")
Back to Journals » Pediatric Health, Medicine and Therapeutics » Volume 11
Level of Undernutrition and Its Determinants Among Children Aged 12–59 Months in Wolaita District, Ethiopia
Authors Workie SB , Mekonen T , Fekadu W , Mekonen TC
Received 3 December 2019
Accepted for publication 2 March 2020
Published 24 March 2020 Volume 2020:11 Pages 109—117
DOI https://doi.org/10.2147/PHMT.S240906
Checked for plagiarism Yes
Review by Single anonymous peer review
Peer reviewer comments 2
Editor who approved publication: Professor Roosy Aulakh
Shimelash Bitew Workie,1 Tesfa Mekonen,2 Wubalem Fekadu,2 Tefera Chane Mekonen3
1College of Medicine and Health Sciences, Wolaita Sodo University, Wolaita Sodo, Ethiopia; 2College of Medicine and Health Sciences, Bahir Dar University, Bahir Dar, Ethiopia; 3College of Medicine and Health Sciences, Wollo University, Dessie, Ethiopia
Correspondence: Shimelash Bitew Workie Email [email protected]
Background: Undernutrition remains one of the most common causes of morbidity and mortality among children throughout the world particularly in developing countries. The present study aimed to assess the magnitude and associated factors of undernutrition among children aged 12– 59 months.
Methods: A community-based cross-sectional study was conducted in Wolaita district from May to June 2015. Multi-stage stratified systematic random sampling procedure was used. Data were collected using a pretested interviewer-administered questionnaire from 626 children aged 12– 59 months. Height and weight were measured by trained data collectors and WHO Anthro version 3.2.2 software was used. Data were entered into Epi Info version 3.3.5 and were exported and analyzed using SPSS version 21. Multivariable logistic regression model with a step-wise method was used to determine the predictors of undernutrition.
Results: One third (34.1%; 95% CI 30.4– 37.9%) of children were stunted while 6.9% and 11.9% of them were wasted and underweight, respectively, based on WHO Z score <-2. Children live in mother-headed households which often use unprotected sources of water and children who did not get minimum dietary diversity were more likely to be stunted compared to their counterparts. Children residing in rural residences, being a male child, having less power for mother decision-making, presence of diarrhea in the last 2 weeks of the survey and who did not get the minimum dietary diversity were found to be significant determinants of underweight. Children living rural, male sex, their order of birth being 5th and above and who had not got the minimum meal frequency were more likely to be wasted than their counterparts.
Conclusion and Recommendation: Undernutrition has a high prevalence in under-5-year-old children of Wolaita district. Under nutrition was associated with female-headed households, unprotected sources of water, below the minimum dietary diversity, rural residence, participation of mother in decision-making, presence of diarrhea, and minimum meal frequency. Thus, nutritional intervention programs in Wolaita district in Ethiopia should focus on these factors.
Keywords: stunted, underweight, wasted, children, undernutrition, Ethiopia
Introduction
Childhood undernutrition is a major global health problem, contributing to childhood morbidity, mortality, impaired intellectual development, suboptimal adult work capacity, and increased risk of diseases in adulthood.1,2 Approximately 35% of deaths are due to nutrition-related factors and 4.4% of deaths have been shown to be specifically attributable to severe wasting, and among low-and middle-income countries (LMICs), the prevalence of stunting was 28% in 2011.1,3 Under nutrition can exist in the form of wasting (acute malnutrition, Weight-for-height Z-score), stunting (chronic malnutrition, Height-for-age Z-score), or underweight (weight-for-Age Z- score).1,3
Ethiopia has been experiencing impacts of global climatic change, particularly drought and chronic food insecurity for the last few years. The cumulative effect of this and other shortfalls leads to a high burden of undernutrition in Ethiopia, especially in under 5-year-old children who remain affected by global acute malnutrition (GAM) and stunting.4
The Ethiopian Demographic and Health Survey (EDHS) (2011/16 and mini 2019) reports showed that there has been improvement in the nutritional status of children. The percentage of stunting showed a slight decrement from 44.4% in 2011 to 37% in 2019 and similarly the percentage of underweight children declined from 28% in 2011 to 21% in 2019. Wasting in under-5-year-old children remained the same according to the EDHS 2016 finding but decreased in the 2019 mini EDHS from 10% to 7%. Under-nutrition is predominantly higher in rural residence s than urban.5–7 SNNPR is one of the most vulnerable areas and accounts for 36.3% of children in 2019 being stunted, of whom 12.4% were severely stunted, 6.3% of children were wasted, of whom 1.0% were severely wasted and 19.7% of children were underweight, of whom 5.4% were severely underweight.6
Since EDHS has tried to estimate the scale of the problem at regional and country level, the Ethiopian government has performed a lot of nutritional interventions. There is a need to identify the effects of nutrition intervention including the first 1,000 days, essential nutrition action, and community-based management of malnutrition and other nutrition specific interventions on the progress of malnutrition. Timely and comprehensive information is vital to provide feedback about the impact of interventions that can enable the future generations to achieve their optimum growth and development. Therefore, the purpose of this study was to assess the prevalence and correlates of under-nutrition among children aged 12–59 months.
Methods and Materials
Study Setting
Wolaita zone is one of the 13 zones of the SNNPR region covering an area of 4,471.3 km2. Wolaita zone is divided into 12 woredas and three administrative towns. Topographically the zone lies at an elevation ranging from 1,200 to 2,950 meters above sea level. The total population of the district is estimated to be about 1,721,339 with a density of 385 inhabitants per square kilometer. Annual average temperature of the zone is 15.1°C and the mean annual rainfall ranges from 1,200 to 1,300 mm. Regarding the land utilization data, 261,000 hectares (ha) are used for cultivation, 5,318 ha for grazing, and 8261 ha for other purposes. Sodo town is the administrative center of the zone. It is located at 380 km south of Addis Ababa and 157 km away from Hawassa town.
Study Design
A community-based cross-sectional study was conducted in Wolaita district from May to June 2015.
Source and Study Population, Sample Size Determination, and Sampling Procedure
All Children 12–59 months of age residing in Wolaita zone were the source population. All children 12–59 months of age residing in selected kebeles were considered as the study population. All children in selected households who were in the age group 12–59 months were included in the study. Severely sick children who could not participate in the measurement were excluded.
The sample size of the study was determined by single population proportion formula by considering 44.1% prevalence of stunting in SNNPR from EDHS 2011,5 margin of error 5%, confidence level of 95%, design effect of 1.5 and 10% of non-respondent and then the final sample size was found to be 626. Multi-stage stratified systematic random sampling was used to recruit the target participants. Four woredas (Damot Sore, Gesuba, Damot Gale, Humbo districts) and two town administrations (Areka town and Sodo town) were selected randomly from 12 woredas and three town administrations. The sample size was allocated based on the proportion of the under-5-year-old population in each woreda. Then kebeles were selected by a lottery method, one urban and three rural kebeles. Households which had children aged 12–59 months of age were selected using systematic random sampling by taking the sampling frame from health extension workers. Health posts had almost complete lists of family folders for all families residing in that kebele.
Data Measurement
Socio-demographic and household economic status variables, nutritional variables, maternal variables, child health-related factors and food access at household level were collected by using a pre-tested questionnaire. The 24-hour recall method was used to assemble information on dietary diversity and meal frequency from mothers and/or caregivers adapted from FANTA version 3 and WHO pre-established tools and from other different literatures.5,8 Children meal frequency score and dietary diversity was assessed based on the last 24-hour recall method. Dietary diversity score was assessed based on IYCF recommendation among seven food categories. Women’s power of participation in decision making was assessed by asking about four types of household decisions: respondent’s use of household income; respondent’s own health care, making major household purchases, and deciding on type of cooking of food. Those who scored above the median were considered as having high decision-making power, and those scoring below the median were considered as low decision-making power.
All the interviews, measurements, observations, and testing were conducted at the dwelling compounds of the study participants. Pretest was conducted on 5% of the total sample size in one of the town administrations and the surrounding rural area which have similar basic socio-economic characteristics as the study kebeles, and necessary corrections were made accordingly. Data were collected from caregivers or mothers of the children by ten trained nurses who could communicate well with the local language.
Child nutritional status (stunting, wasting, and underweight) were expressed by different anthropometric indices. Anthropometric data were taken by four supervisors (master’s degree holders in Public health). The weights of the children were measured using SECA portable digital scales with the nearest 0.1 kg and were taken in light clothes. Instrument adjustment and calibration was carried out before weighing each child. Furthermore, the weighing scale was checked against a standard weight for its accuracy daily. Height was measured using the SECA vertical height scale standing upright in the middle of the board, approximate to the nearest of 0.1 cm. The child’s head, shoulders, buttocks, knees, and heels touch the vertical board. Length was taken for children 12–24 months of age. Both measurements were taken twice, and the average was considered to interpret child nutritional status. The birth date of each child was extracted from the immunization card of the child.
Data collectors and supervisors were trained for 3 days and a regular supervision with practical session for height and weight measurements and follow-up were made by supervisors and the principal investigator. In addition, regular check-ups for completeness and consistency of the data was made daily. Standardization anthropometric measurements were conducted to see whether the data collectors had good precision and accuracy, and the precision and the accuracy of most of the enumerators were acceptable.
Data Management and Analysis
Pre-coded data were entered into Epi info version 3.5.3 and WHO Anthro software was used to convert nutritional data into Z-scores by using 2007 WHO growth standard. Children whose height-for-age, weight-for-height and weight-for-age <−2 SD from the median of the reference population were considered stunted, wasted and underweight respectively. Then, data were exported to a statistical package for social sciences (SPSS) software Version 21 for data processing and analysis. Individual dietary diversity score (DDS) was computed from seven major food groups which were described as locally available food items and compiled to a minimum score of 0 and maximum of 7. These scores were categorized into low dietary diversity and high dietary diversity (those who met the minimum dietary diversity recommendation). Principal component analysis was done using household assets possession to construct wealth index, as a proxy measure of household socioeconomic status. Household socioeconomic status was finally divided into terciles (rich, medium, and poor). Assumptions of principal component analysis were checked.
Before running advanced statistics, influential outliers, normality of data, missing values (particularly standard scores for anthropometric indices and wealth index) and relationships of independent variables were explored very thoroughly. Crude odds ratio with 95% confidence interval was used to assess the association between independent and dependent variables. Independent variables which had an association with the outcome variable in the bivariate logistic regression and those with a p-value of <0.2 were considered as a candidate variable in the final logistic regression model. The Hosmer Lemeshow test was used to check goodness of model fitting. Finally, stepwise method was used to run the final regression analysis and to establish a cut-off point for statistical significance.
Ethical Approval and Consent to Participate
Ethical clearance was obtained from the Wolaita Sodo University, College of Health Sciences and Medicine Institutional Research Ethics Review Committee. The official letter of cooperation was given to all selected district health offices. Prior to data collection, the interviewers had explained the objective, benefit and risks of the study to get informed written consent for mothers or caregivers of the children. Mothers or caregivers under the age of 18 years provided written informed assent from other responsible family members, and this was acceptable and approved by the Wolaita Sodo University Ethics Committee. The right of the respondent to withdraw from the interview or not to participate was respected. Identification of an informant was possible only through specific identification numbers. Data collectors gave advice to mothers or caregivers of the undernourished child to provide additional balanced diets for their children and to visit the nearby health facility.
Results
General Characteristics of the Population
A total of 595 children with their mothers/caregivers were interviewed which makes the response rate 96.8%. Of the total respondents, 90.1% were mothers, 5.5% were caretakers the rest were others. Of the total study population, 76.2% (461) households were headed by males. Forty six percent of the children were living with a total family size of less than four. Nearly 91% of mothers were married and 42.1% (255) mothers had attended primary school (from grade 1–8). Above half (67.3%) of mother’s occupation were housewives.
Mean and median age of mothers was 27.25 and 26 respectively, with SD of 6.025 and a minimum of 15 years and maximum of 50 years. Most of the mothers' age (37.4%) was between 25 and 29 years of age. The result showed that 34% of the populations were under poor wealth status (Table 1).
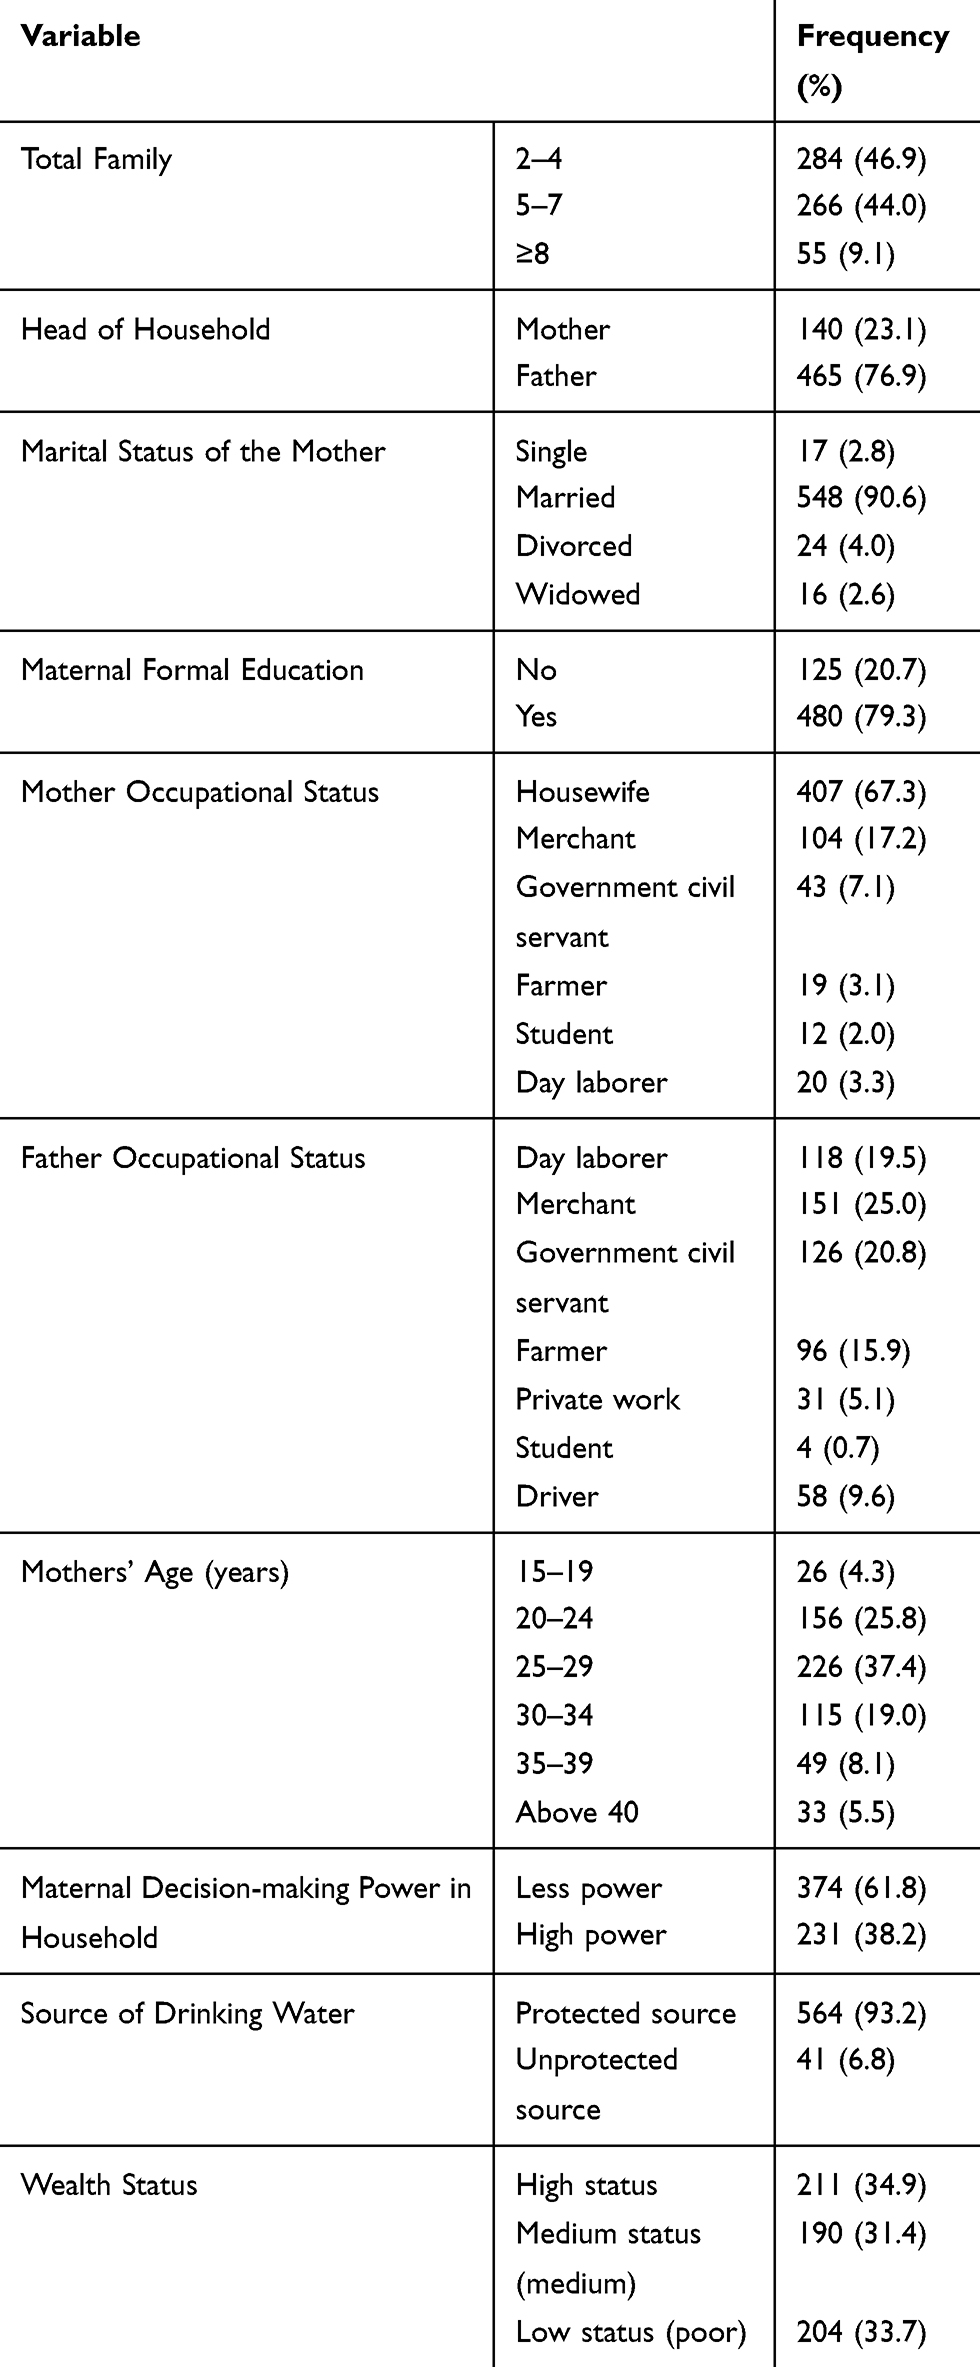 |
Table 1 Sociodemographic Characteristics of Study Participants in Wolaita District, Ethiopia, 2015 (N=595) |
From the total children, 307 (50.7%) were males. Mean and median age of the children was 33.87 and 34 months respectively with SD of 13.9. About one third of the children (29.9%) were between 12 and 23 months of age, one fourth of them (24.6%) were in the 36–47-months- of-age group, and 23.6% in the 48–59-months-of-age group. Thirty seven percent of children were the first child for their mother and 25% were second born to their mother, and the rest were third born or above to their mother.
Almost all (99.3%) children were term at delivery and 59.5% of mothers gave birth at a government health facility. Almost all children were ever breastfed. For children ever breastfed, introduction of complementary food during the 6th month was 81.3%. Out of the total children, 95.5% of them were fully immunized but 23% of them were sick in the last 2 weeks before data collection time (Table 2).
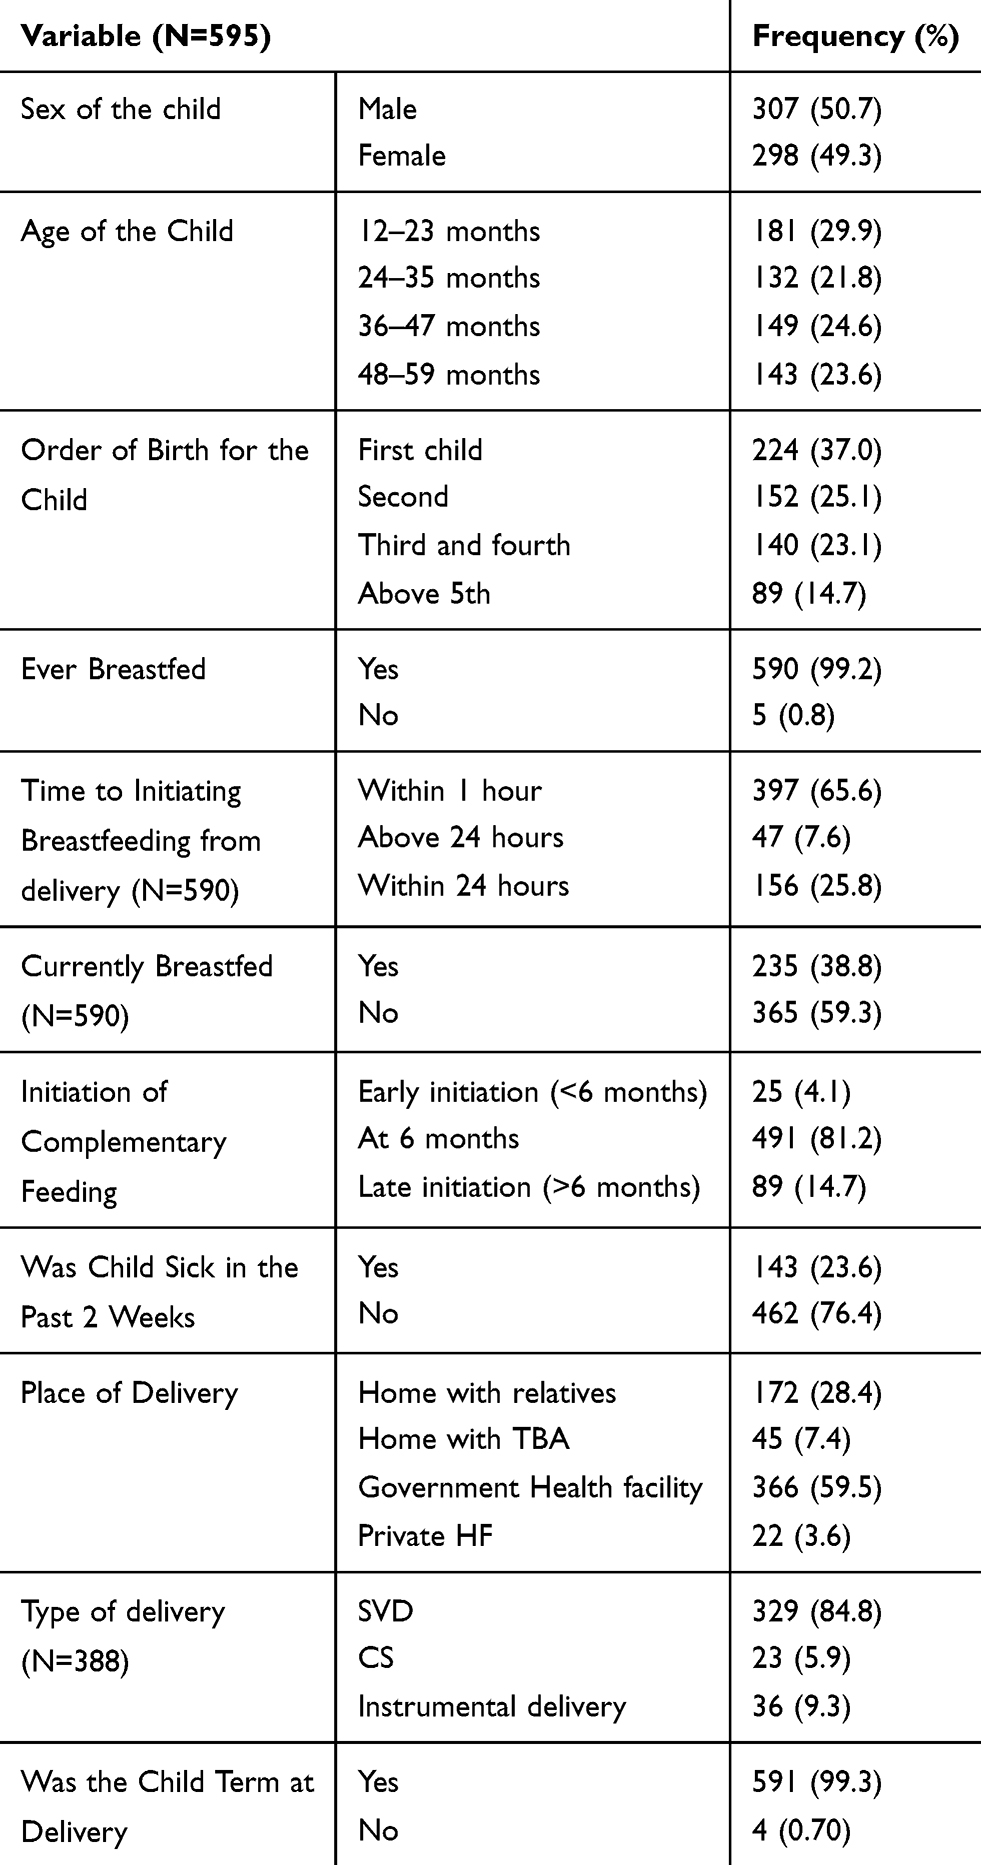 |
Table 2 Sociodemographics, Feeding and Health Status of Children Living in Wolaita District, South Ethiopia, 2015 (N=595) |
Children Nutritional Status and Dietary Practices
Meal frequency score of the 24-hour recall method result shows almost all (92.1%) of the children were above or equal to the minimum recommendation. Fifty nine percent of the children's diversity score was less than four different types. We assessed the food security status of each household based on FANTA and the results show that 11.5% were food insecure households.
Prevalence of stunting, wasting and underweight were 34.1% (95% CI 30.4–37.9%), 6.9% (95% CI 5.2–9.3%), and 11.9% (95% CI 9.5–14.7%), respectively. Prevalences of severely stunted, severely wasted and severely underweight children were 15.6%, 3% and 4.1% respectively (Z score <-3SD). Based on HAZ >-2, 65.9% of children were not stunted and 93.1% of children were also above WHZ of −2SD. No overweight cases were observed. Children aged 12–23 months were the most affected age group by stunting (38.7%) (Table 3).
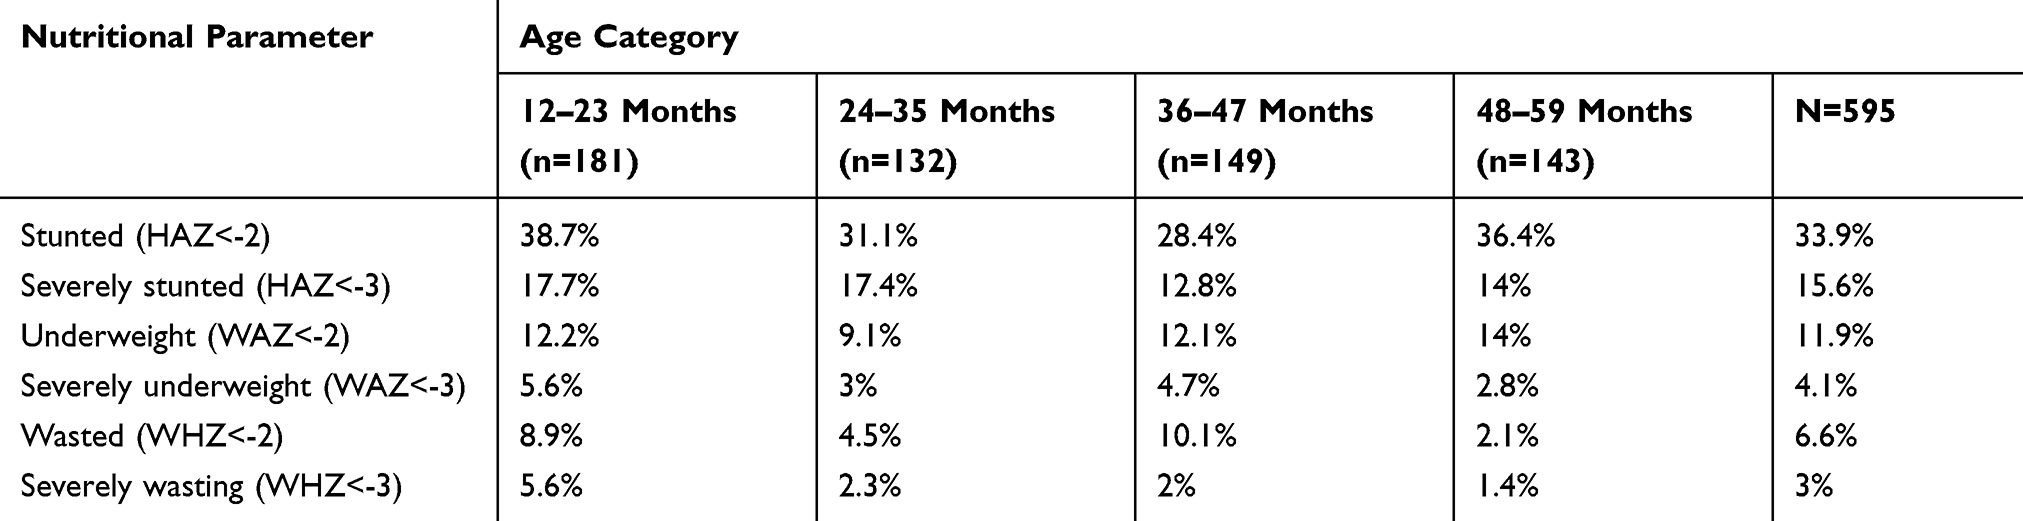 |
Table 3 Nutritional Status of Children by Age Wolaita District, South Ethiopia, 2015 |
Factors Associated with Underweight, Stunting, and Wasting
The multivariable logistic regression analysis showed that children living in a rural residence, being male, with less power for mother decision making, presence of diarrhea in last 2 weeks of the survey and those who had no =minimum dietary diversity score were more likely to be underweight than their counterparts with AOR of 1.85 (95% CI 1.20–3.14), 2.21 (95% CI 1.29–3.77), 1.83 (95% CI 1.03–3.24), 2.9 (95% CI 1.25–6.84) and 2.3 (95% CI 1.36–3.97) respectively (Table 4).
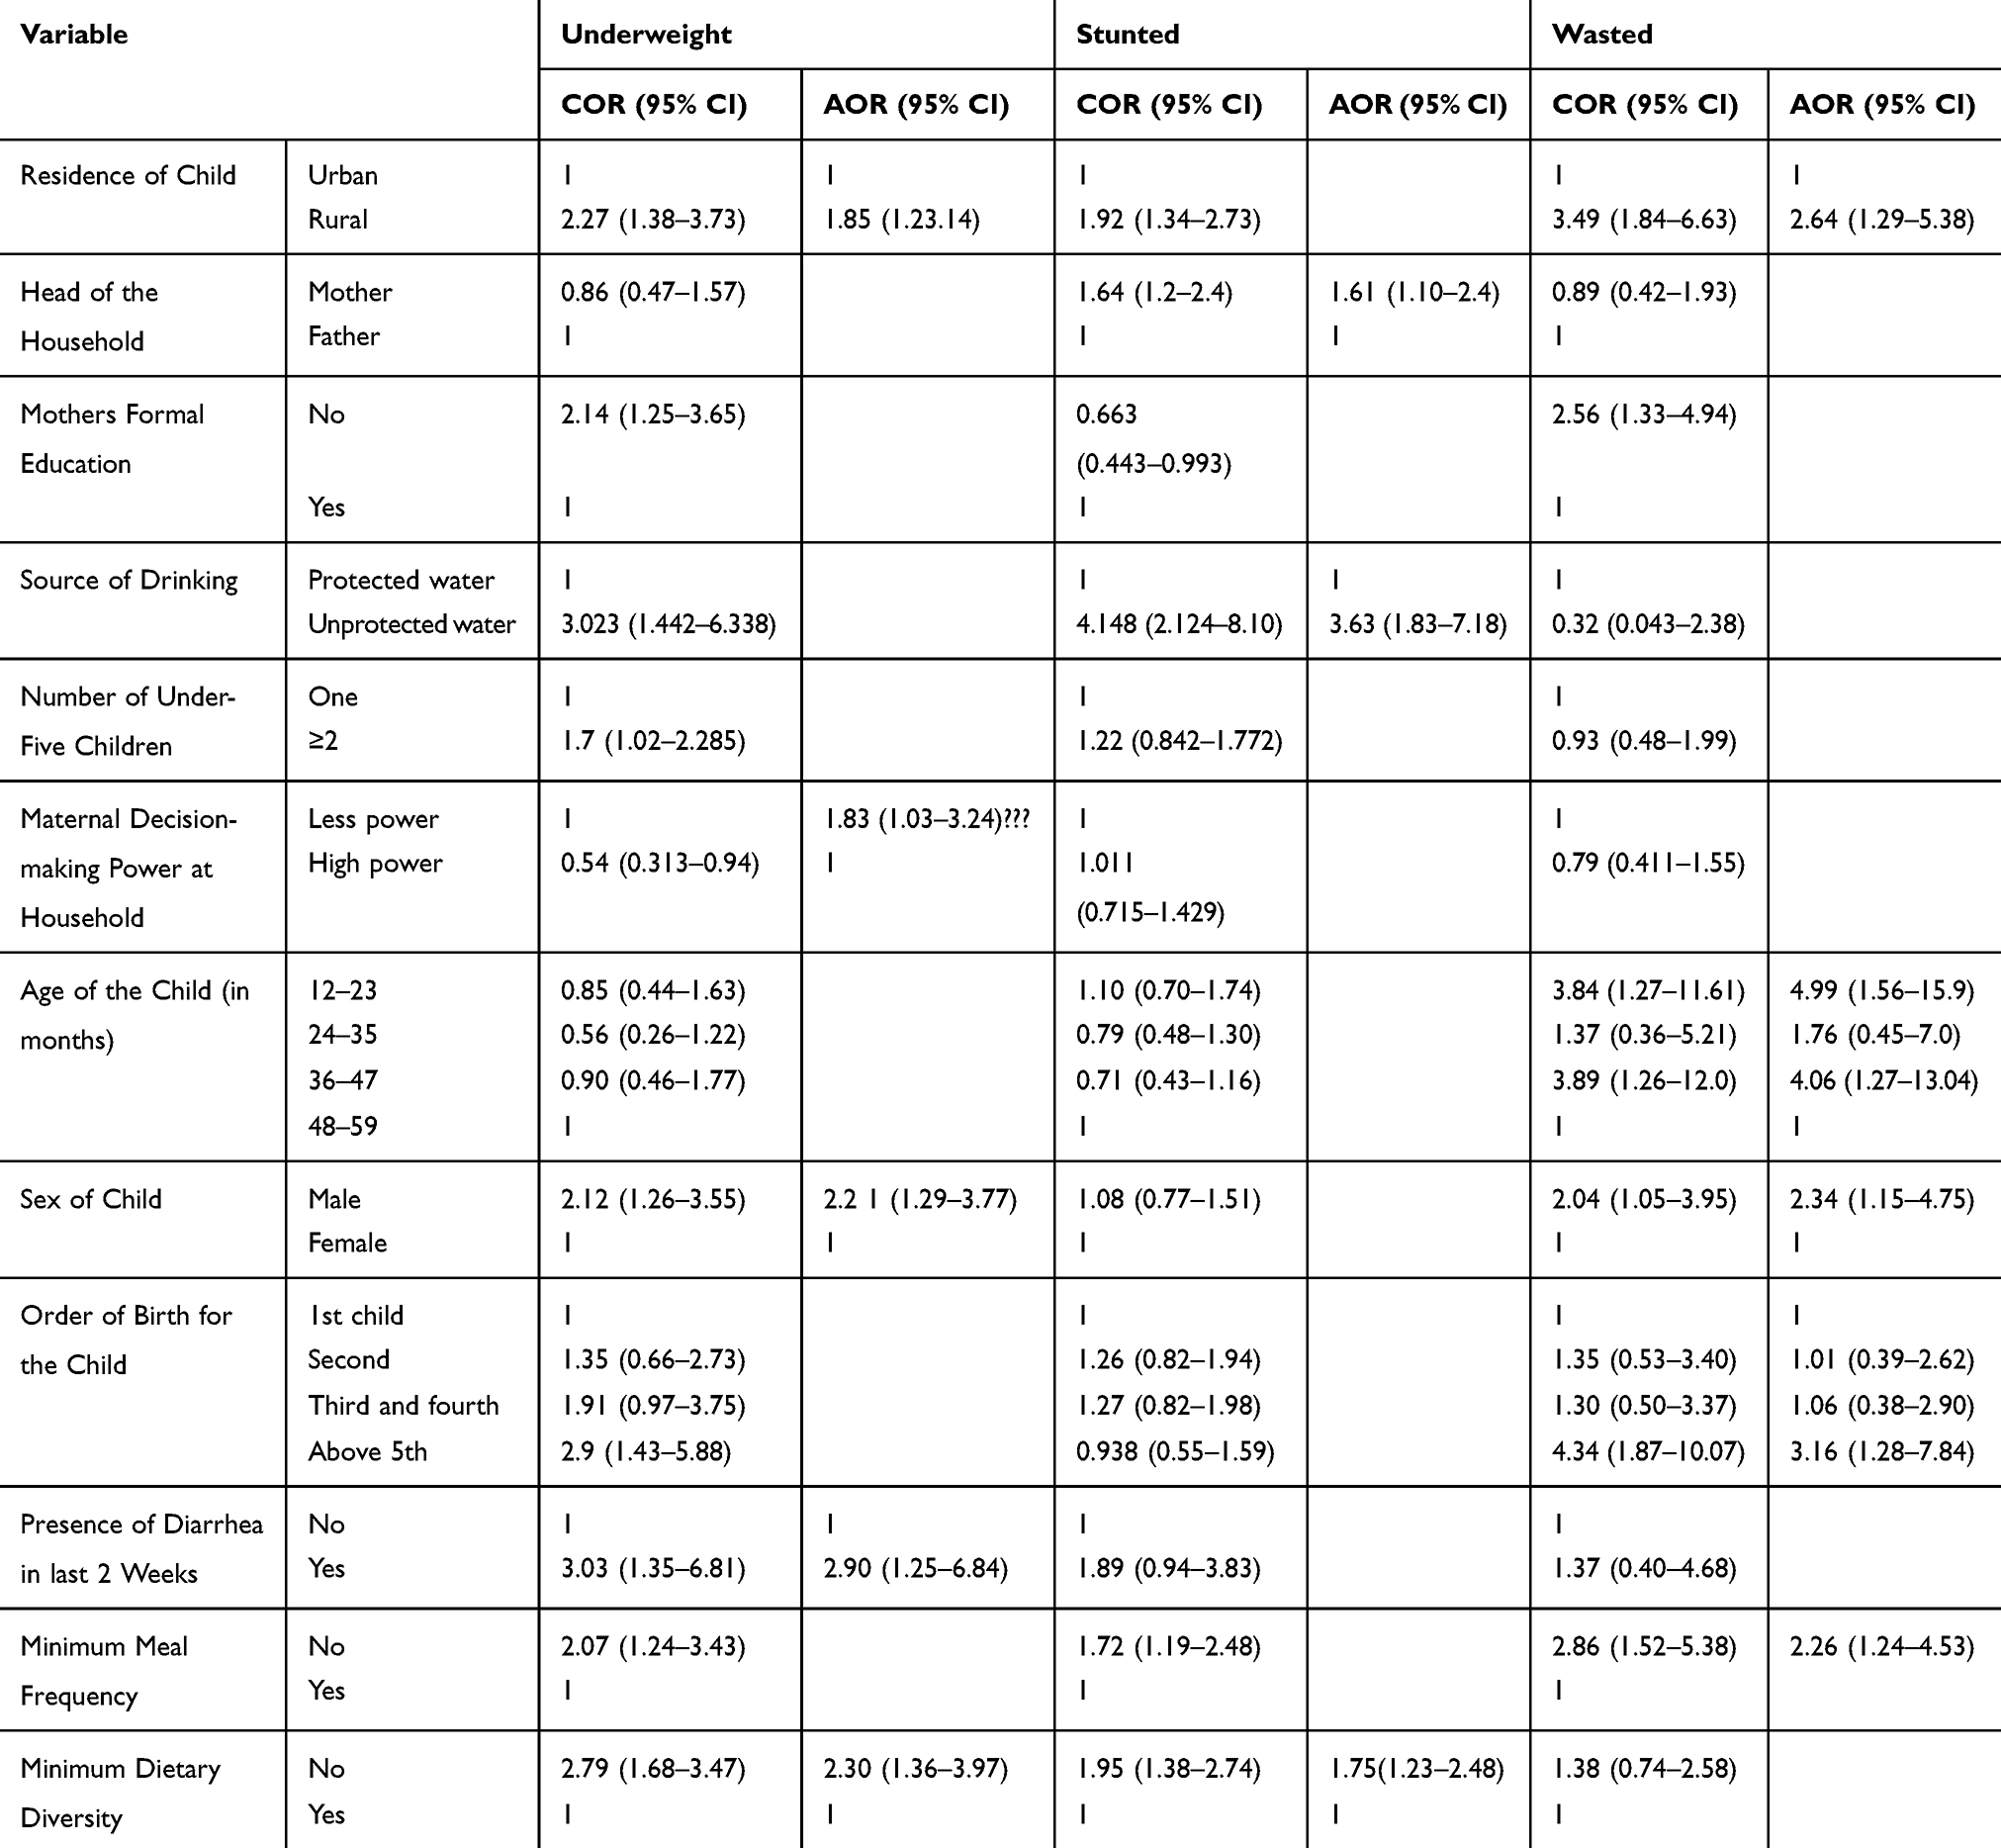 |
Table 4 Predictors of Undernutrition Among Children of 12–59 Months of Age in Wolaita District, South Ethiopia, 2015 |
The multivariable analysis showed that children living in mother-headed households, who used an unprotected source of water and had not got a minimum dietary diversity score were more likely to be stunted compared with others with AOR of 1.61 (95% CI 1.10–2.40), 3.63 (95% CI 1.83–7.18) and 1.75 (95% CI 1.23–2.48) respectively (Table 4).
Similarly, the multivariable analysis showed that children living in rural kebeles were more likely to waste than urban residents with AOR of 2.64 (95% CI 1.29–5.38). After controlling for confounders, being male, age of child between 12 and 23 months and 36 and 47 months were more likely to be wasted than those of female sex and 48–59-months-of-age children with AORs of 2.34 (95% CI 1.15–4.75), 4.99 (95% CI 1.56–15.90) and 4.06 (95% CI 1.27–13.04), respectively. Children whose order of birth was 5th and above and who had not got the minimum meal frequency also had a significant association with wasting in the multivariate analysis with AORs of 3.16 (95% CI 1.28–7.84) and 2.26 (95% CI 1.24–4.53) (Table 4).
Discussion
In this study, one third (34.1%) of children were stunted while 6.9% were wasted and 11.9% were underweight, respectively, based on WHO Z score <-2 standard deviation.
Generally according to WHO’s classification, the prevalence of stunting in the study area was high prevalence.9 The prevalence of stunting is almost similar to that of EDHS 2016 national and regional prevalence which was 38% and 38.6%, respectively, but it is lower than Amhara region (46%).7 As compared to other small pocket studies in different parts of Ethiopia, the prevalence of stunting in the study area was found to be low. For example, prevalence in Haramaya district,10 Bule Hora district,11 Northwest Ethiopia Dembia district12 and northeast Ethiopia Lalibela13 was 45.8%, 47.6%, 46% and 47.3% respectively, while it is almost in line with findings from Hossana town14 which was 35.4%. This might be due to differences in the methods used, sample size variation, variation in agro-ecological pattern, and feeding practices.
Children living in households headed by females (AOR=1.61; 95% CI [1.10–2.40]), who used unprotected sources of water (AOR=3.63; 95% CI [1.83–7.18]) and had not got minimum dietary diversity (AOR=1.75; 95% CI [1.23–2.48]) were more likely to be stunted compared with their counterparts. Female-headed household children were almost two times more likely to be stunted compared to male-headed household children. Which is in line with findings in North Ethiopia.15 This might be because female-headed households tend to be poorer and have less access to job opportunities and government services in most developing countries. Children living in households that use unprotected water for drinking were about four times more likely to be stunted than those who use protected water. The finding is in line with the study from one woreda in Wolaita16 Haramaya district10 and in Tanzania.17 This might be because those children who use unprotected sources of drinking water might be exposed to repeated diarrhea, intestinal parasites, and other infections. In this study those children who did not get minimum acceptable meal frequency had a nearly two times higher chance of being stunted than children who met minimum dietary diversity . The finding is concurrent with the finding in Tanzania17 and a study done in Bangladesh.18 The findings of this analysis and previous research reinforce the notion that improved food variety may indeed reflect a greater likelihood of meeting daily energy and nutrient requirements, which would result in improved nutritional status among young children.
Underweight, the composite index of stunting and wasting which cannot indicate acute or chronic undernutrition. The prevalence of underweight was nearly two times less than national (28%) and regional (23.6%) figures from EDHS 2011 and regional prevalence of 21.1% according to the EDHS 2016 report.5,7 This finding was lower from another study done in Wolaita Sodo town which was 25%.19 The finding was also lower compared to findings from Haramaya,10 Bule Hora district,11 North Ethiopia Lalibela,13 Central Ethiopia North Shoewa20 and North Ethiopia Shire Indaselassie21 with corresponding prevalences of 21%, 29.2%, 25.6%, 30.9%, and 20.9%, respectively. This may vary due to socioeconomics, sample size, study subjects and periods as compared with the present study.
Being a rural residence, being a male child, with less power for mother decision making, presence of diarrhea in the 2 weeks previous to the survey and who had not got a minimum dietary diversity score were more likely to be underweight than their counterparts. Rural residence children were two times more underweight than urban residence children. The finding is congruent with the findings of the EDHS 2016 national7 and a study in Vietnam.22 This might be explained by rural residence having low socioeconomic status and low water supply coverage. In this study, Male children were two times more likely to be underweight than female children: in line with the finding from Bule Hora district in Ethiopia11 and in Vietnam.22 This might be explained as boys are more influenced by environmental stress than girls and more prone to show different infections and staying longer outside the home. In this study, less power for mother decision making resulted in mothers having a higher likelihood of underweight children than those who had greater power for decision making. This is in line with the finding in South India which showed maternal autonomy for decision making had an association with childhood nutritional status.23 This could be the fact that provision of joint care by biological parents requires joint decision on the care or treatment of their children in order to improve children’s nutritional status. Such decisions might require women’s autonomy to participate in the decision-making process of the household equally with the men.
Children who had had diarrhea in the 2 weeks prior to the survey were 2.9 times more likely to be underweight than others. This finding is similar to that from low- and middle-income countries like the study done in North Ethiopia Shire Indaselassie.21 In this study those children who did not get minimum acceptable meal frequency were 2.3 times more likely to be underweight than others.
The prevalence of wasting was 6.6% in Wolaita district. This result was lower than the national EDHS 2016 result which was 10% and similar to the SNNPR result which was 6%.7 This result was lower than different studies such as findings from Haramaya,10 Bule Hora district,11 North Ethiopia Lalibela,13 Central Ethiopia North Shewa,20 East Belesa District, and Northwest Ethiopia24 which were 10.7%, 13.4%, 8.9%, 16.7%, % and 16% respectively. The discrepancy might be due to our small sample size compared to that of national data and the exclusion of children under the age of 12 months. Our finding was higher compared to the study done in North Ethiopia Shire Indaselassie 4.1%.21
Children who live in a rural residence, are of male sex, aged between 12 and 23 months and 36 and 47 months, children whose order of birth is 5th and above and who had not got the minimum meal frequency were more likely to be wasted. Children in rural residence were three times more likely to be wasted than urban residence which is in line with EDHS 20167 and a study done in Vietnam.22 This could be due to the fact that rural children might be exposed to repeated infections, due to less hygienic practices being prevalent. Boys were two times more likely to be wasted than girls which is contrary to other studies like thse conducted in Bule Hora district,11 East rural Ethiopia25 and in East Belesa District, Northwest Ethiopia.24 However, this finding is in line with a study done in Haramaya Ethiopia10 and another in Vietnam.22 Children's order of birth being 5th and above were three times more likely to be wasted than others. This is similar with findings from Haramaya, Ethiopia.10
Conclusion and Recommendation
Undernutrition (stunting, wasting and underweight) is a major public health problem in Wolaita district. Factors that increase the risk of undernutrition were female-headed households, unprotected source of water, below the minimum dietary diversity score, rural residence, participation of mother in decision making, presence of diarrhea, and below minimum meal frequency. Thus, nutritional intervention programs in Wolaita district, Ethiopia should focus on these factors with interventions like safe water supply, and increasing dietary diversity to the community.
Abbreviations
AOR, adjusted odds ratio; CI, confidence interval; COR, crude odds ratio; EDHS, Ethiopian Demographic and Health Survey; FANTA, Food and Nutrition Technical Assistance Project; IYCF, infant and young child feeding; SNNPR, Southern Nation National and People Region; WHO, World Health Organization.
Data Sharing Statement
The datasets during and/or analyzed during the current study are available from the corresponding author on reasonable request.
Acknowledgments
The authors would like to acknowledge Wolaita Sodo University for providing materials used for the work. Our deepest gratitude goes to data collectors, kebeles leaders and Wolaita Sodo health center manager for his cooperation starting from the beginning till the end of data collection time. Finally, our heartfelt thanks go to the respondents and Mr Temesgen Bati.
Author Contributions
All authors contributed to data analysis, drafting and revising the article, gave final approval of the version to be published, and agree to be accountable for all aspects of the work.
Funding
Wolaita Sodo University funded the research. The funders had no role in study design, data collection and analysis, decision to publish, or preparation of the manuscript.
Disclosure
The authors report no conflicts of interest in this work.
References
1. Black R, Alderman H, Bhutta Z, Gillespie S, Haddad L, Horton S. Executive summary of the Lancet maternal and child nutrition series. Maternal and Child Nutrition Study Group (eds). Matern Child Nutr. 2013;1–12.
2. Black RE, Allen LH, Bhutta ZA, et al. Maternal and child undernutrition: global and regional exposures and health consequences. Lancet. 2008;371(9608):243–260. doi:10.1016/S0140-6736(07)61690-0
3. Black RE, Victora CG, Walker SP, et al. Maternal and child undernutrition and overweight in low-income and middle-income countries. Lancet. 2013;382(9890):427–451. doi:10.1016/S0140-6736(13)60937-X
4. Lewis K. Understanding climate as a driver of food insecurity in Ethiopia. Clim Change. 2017;144(2):317–328. doi:10.1007/s10584-017-2036-7
5. [Ethiopia]. CSA. Ethiopia Demographic and Health Survey 2011. Addis Ababa, Ethiopia: CSA; 2012:2011.
6. Central Statistical Agency. Ethiopia Mini Demographic and Health Survey 2019. Addis Ababa, Ethiopia: Central Statistical Agency; 2019.
7. Ethiopian Central Statistical Agency.Ethiopia Demographic and Health Survey. Ethiopia; 2016:2016
8. Coates J, Swindale A, Bilinsky P. Food and Nutrition Technical Assistance Project (FANTA): Household Food Insecurity Access Scale (HFIAS) for Measurement of Food Access: Indicator Guide (V. 3). Washington, DC: Food and Nutrition Technical Assistance Project; 2007.
9. World Health Organization. Nutrition Landscape Information System (NLIS) Country Profile Indicators: Interpretation Guide; Geneva: WHO, 2010.
10. Yisak H, Gobena T, Mesfin F. Prevalence and risk factors for under nutrition among children under five at Haramaya district, Eastern Ethiopia. BMC Pediatr. 2015;15:212. doi:10.1186/s12887-015-0535-0
11. Asfaw M, Wondaferash M, Taha M, Dube L. Prevalence of undernutrition and associated factors among children aged between six to fifty nine months in Bule Hora district, South Ethiopia. BMC Public Health. 2015;15:41. doi:10.1186/s12889-015-1370-9
12. Tariku A, Woldie H, Fekadu A, Adane AA, Ferede AT, Yitayew S. Nearly half of preschool children are stunted in Dembia district, Northwest Ethiopia: a community based cross-sectional study. Arch Public Health. 2016;74:13. doi:10.1186/s13690-016-0126-z
13. Yalew B, Amsalu F, Bikes D. Prevalence and factors associated with stunting, underweight and wasting: a community based cross sectional study among children age 6–59 months at Lalibela Town, Northern Ethiopia. J Nutr Disord Ther. 2014;4(147):2161–0509.1000147.
14. Moges B, Feleke A, Meseret S, Doyore F. Magnitude of stunting and associated factors among 6–59 months old children in Hossana Town, Southern Ethiopia. J Clin Res Bioeth. 2015;6(1):1.
15. Haidar J, Kogi-makau W. Gender differences in the household headship and nutritional status of pre-school children. East Afr Med J. 2009;86(2):69–73. doi:10.4314/eamj.v86i2.46936
16. Batiro B, Demissie T, Halala Y, Anjulo AA. Determinants of stunting among children aged 6–59 months at Kindo Didaye woreda, Wolaita Zone, Southern Ethiopia: unmatched case control study. PLoS One. 2017;12(12):e0189106. doi:10.1371/journal.pone.0189106
17. Altare C, Delbiso TD, Mutwiri GM, Kopplow R, Guha-sapir D. Factors associated with stunting among pre-school children in Southern Highlands of Tanzania. J Trop Pediatr. 2016;62(5):390–408. doi:10.1093/tropej/fmw024
18. Rah J, Akhter N, Semba R, et al. Low dietary diversity is a predictor of child stunting in rural Bangladesh. Eur J Clin Nutr. 2010;64(12):1393–1398. doi:10.1038/ejcn.2010.171
19. Tosheno D, Mehretie Adinew Y, Thangavel T, Bitew Workie S. Risk factors of underweight in children aged 6–59 months in Ethiopia. J Nutr Metab. 2017;2017.
20. Mengistu K, Alemu K, Destaw B. Prevalence of malnutrition and associated factors among children aged 6–59 months at Hidabu Abote District, North Shewa, Oromia Regional State. J Nutr Disord Ther. 2013;1:1–15. doi:10.4172/2161-0509-3-T1-001
21. Brhane G, Regassa N. Nutritional status of children under five years of age in Shire Indaselassie, North Ethiopia: examining the prevalence and risk factors. Kontakt. 2014;16(3):e161–e70. doi:10.1016/j.kontakt.2014.06.003
22. Hien NN, Hoa NN. Nutritional status and determinants of malnutrition in children under three years of age in Nghean, Vietnam. Pak J Nutr. 2009;8(7):958–964. doi:10.3923/pjn.2009.958.964
23. Sethuraman K, Lansdown R, Sullivan K. Women’s empowerment and domestic violence: the role of sociocultural determinants in maternal and child undernutrition in tribal and rural communities in South India. Food Nutr Bull. 2006;27(2):128–143. doi:10.1177/156482650602700204
24. Fentahun W, Wubshet M, Tariku A. Undernutrition and associated factors among children aged 6–59 months in East Belesa District, northwest Ethiopia: a community based cross-sectional study. BMC Public Health. 2016;16:506. doi:10.1186/s12889-016-3180-0
25. Egata G, Berhane Y, Worku A. Predictors of acute undernutrition among children aged 6 to 36 months in east rural Ethiopia: a community based nested case-control study. BMC Pediatr. 2014;14(1):91. doi:10.1186/1471-2431-14-91
 © 2020 The Author(s). This work is published and licensed by Dove Medical Press Limited. The full terms of this license are available at https://www.dovepress.com/terms.php and incorporate the Creative Commons Attribution - Non Commercial (unported, v3.0) License.
By accessing the work you hereby accept the Terms. Non-commercial uses of the work are permitted without any further permission from Dove Medical Press Limited, provided the work is properly attributed. For permission for commercial use of this work, please see paragraphs 4.2 and 5 of our Terms.
© 2020 The Author(s). This work is published and licensed by Dove Medical Press Limited. The full terms of this license are available at https://www.dovepress.com/terms.php and incorporate the Creative Commons Attribution - Non Commercial (unported, v3.0) License.
By accessing the work you hereby accept the Terms. Non-commercial uses of the work are permitted without any further permission from Dove Medical Press Limited, provided the work is properly attributed. For permission for commercial use of this work, please see paragraphs 4.2 and 5 of our Terms.