")
Back to Journals » Clinical Interventions in Aging » Volume 17
Level of LncRNA GAS5 and Hippocampal Volume are Associated with the Progression of Alzheimer’s Disease
Authors Chen X , Ren G, Li Y, Chao W, Chen S, Li X, Xue S
Received 18 February 2022
Accepted for publication 29 April 2022
Published 9 May 2022 Volume 2022:17 Pages 745—753
DOI https://doi.org/10.2147/CIA.S363116
Checked for plagiarism Yes
Review by Single anonymous peer review
Peer reviewer comments 2
Editor who approved publication: Dr Zhi-Ying Wu
Xiaopeng Chen,1,2 Guoqiang Ren,3 Yan Li,1,4 Wa Chao,1 Siyuan Chen,2 Xuezhong Li,2 Shouru Xue1
1Department of Neurology, the First Affiliated Hospital of Soochow University, Suzhou, Jiangsu, People’s Republic of China; 2Department of Neurology, the Affiliated People’s Hospital of Jiangsu University, Zhenjiang, Jiangsu, People’s Republic of China; 3Department of Radiology, the Affiliated People’s Hospital of Jiangsu University, Zhenjiang, Jiangsu, People’s Republic of China; 4Department of Neurology, the Taixing People’s Hospital, Taixing, Jiangsu, People’s Republic of China
Correspondence: Shouru Xue, Department of Neurology, the First Affiliated Hospital of Soochow University, No. 188 Shizi Road, Suzhou, Jiangsu Province, 215006, People’s Republic of China, Tel +86-18962133036, Fax +86-512-65223637, Email [email protected]
Purpose: We evaluated the diagnostic value of long non-coding RNA growth arrest-specific transcript 5 (GAS5) and its relationship with hippocampal volume in Alzheimer’s disease (AD).
Patients and Methods: One hundred and eight patients with AD and 83 healthy controls were included, and demographic data, biochemical parameters, GAS5 levels, and hippocampal volume were recorded. Chi-squared tests or independent sample t-tests were used to compare the baseline characteristics, relative expression of GAS5, and hippocampal volume. Correlations between variables were determined using Spearman’s rank correlation test. Receiver operating characteristic (ROC) curves were generated to compare the diagnostic value of GAS5 and total hippocampal volume in AD.
Results: The levels of GAS5 were significantly upregulated in patients with AD compared with those in controls and were negatively correlated with MMSE score. There were differences in left hippocampal volume, right hippocampal volume, and total hippocampal volume between the two groups. Total hippocampal volume was positively correlated with MMSE score and negatively correlated with GAS5 expression in patients with AD. The area under the curve (AUC) of for GAS5 expression was 0.831, the sensitivity was 61.1%, and the specificity was 95.2%. The AUC of the combined total hippocampal volume was 0.891, the sensitivity was 74.1%, and the specificity was 92.8%.
Conclusion: The results suggested that GAS5 may be an excellent indicator of AD progression alone or in combination with hippocampal volume.
Keywords: Alzheimer’s disease, long non-coding RNA, receiver operating characteristic, biomarker
Introduction
Alzheimer’s disease (AD) is the main cause of dementia, accounting for 60%–80% of all cases. Alzheimer’s disease is a neurodegenerative disease characterized by progressive memory loss, cognitive impairment, and behavioral changes.1 Pathological changes in AD include reduced brain volume, with particularly severe loss of volume in the hippocampus.2 The prevalence of AD is increasing in parallel with an increasingly aging global population. An estimated 6.2 million Americans aged 65 and over had AD, and 72% were 75 years old or older in 2021.3 By 2050, the prevalence of AD in Germany will double.4 A cross-sectional study in 2020 showed that 15.07 million people aged 60 and over in China had dementia, including 9.83 million with AD.5 Alzheimer’s disease is rapidly becoming one of the most expensive and deadly diseases in the world.6
Development of diagnostic criteria for AD has been a challenge due to the mismatch between clinical manifestations and pathology.7 Blood tests have been developed recently to reduce the use of lumbar puncture and PET scanning, which are uncomfortable and expensive, respectively. Many of these blood tests are currently in the process of being validated after which they can be used for diagnostic purposes in clinical practice.8 In the past 20 years, sequencing and analysis of human and mouse genomes has led to the discovery of many non-coding RNAs (ncRNAs), including microRNAs (miRNAs), small interfering RNAs (siRNAs), long non-coding RNAs (lncRNAs), and circular RNAs (circRNAs). Using chromatin immunoprecipitation, studies have shown that a variety of lncRNA are specifically expressed in brain tissue and participate in the regulation of many important neural functions, such as brain tissue aging, hippocampal development, oligodendrocyte myelin synthesis, synaptic transmission, and signal transduction.9 Long non-coding RNAs have great potential as AD biomarkers and as therapeutic targets.10 Long non-coding RNA growth arrest-specific transcript 5 (GAS5) is a lncRNA reported to have multiple regulatory functions.11 Studies have shown that GAS5 has different expression patterns in the brains of young and old mice, and the expression in the hippocampus of old mice is significantly higher than that in young mice, as determined using quantitative reverse transcription polymerase chain reaction (qRT-PCR).12 However, the clinical significance of GAS5 in AD has not been studied.
In this study, we analyzed the expression of GAS5 in peripheral blood mononuclear cells (PBMC) of patients with AD to determine its diagnostic value. In addition, we measured hippocampal volume using neuroimaging to evaluate the association between GAS5 and hippocampal volume, provide clinical evidence for the diagnosis and treatment of AD, and to further characterize the possible mechanisms of AD.
Patients and Methods
Patients
A total of 191 male and female elderly adults participated in this study. Of these adults, 108 were clinically diagnosed with AD and 83 were included as healthy controls. All subjects were recruited from the Affiliated People’s Hospital of Jiangsu University between January 2019 and December 2021. The diagnosis of AD was based on the criteria of the National Institute of Neurological and Communication Disorders and Stroke/Alzheimer’s disease and Related Disorders Association (NINCDS/ADRDA).13 Exclusion criteria were as follows: 1) Hachinski ischemic score > 4; 2) patients who could not complete the assessment or undergo cranial MRI; 3) patients with depression, anxiety, or other neurological and systemic diseases associated with cognitive decline. This study was approved by the Ethical Committee of the Affiliated People’s Hospital of Jiangsu University (ethics number: Y2021018) and conducted in accordance with the Declaration of Helsinki (as revised in 2013). Informed consent was obtained from all participants.
Clinical Examination
After confirming that all subjects met the study inclusion criteria, demographic data were recorded, including age, gender, years of education, body mass index (BMI), smoking and drinking history, and past medical history (including hypertension, diabetes, coronary heart disease). In addition, mini-mental state examination (MMSE) scores were determined for all subjects to evaluate cognitive function.
Collection of Blood Samples and Biochemical Parameters
Patients were fasted for 8 h, and blood samples were collected the next morning. Six milliliters of venous blood were extracted into an EDTA-K2 anticoagulant tube (BD Diagnostics, Franklin Lakes, NJ, USA) for isolation of PBMC. Four milliliters of venous blood were extracted into a gel separation procoagulant tube (Yangpu company, Guangzhou, China) for biochemical analyses. The blood samples collected in the gel separation procoagulant tube were left at room temperature for 1 h and centrifuged at 3000 rpm for 20 min at 4 °C. Biochemical indices were measured using a Beckman AU5800 automatic hematology system (BECKMAN company, Miami, FL, USA). Biochemical parameters included fasting blood glucose (FPG), total cholesterol (TC), triglycerides (TG), high-density lipoprotein (HDL), low-density lipoprotein (LDL), and vitamin B12 levels.
Extraction of PBMC
The blood samples extracted into EDTA-K2 anticoagulant tube were combined with equal volumes of PBS at room temperature, and the tubes were gently mixed. Six milliliters of Ficoll were transferred to a 50 mL centrifuge tube, and the diluted blood was slowly added to the Ficoll. The mixed solution was centrifuged at 2000 rpm for 30 min at 18–20 °C. After centrifugation, the sample was partitioned into four layers from the bottom of the tube to the liquid level, including the erythrocyte and granulocyte layer, the layered liquid layer, the mononuclear cell layer, and the plasma layer. A pipette was inserted into the mononuclear cell layer, which was gently removed to a new centrifuge tube. Then, PBS and PBMC were combined at a 3:1 ratio, and centrifuged at 2000 rpm for 10 min at 18–20 °C, twice in total. The collected cells were transferred into 1.5 mL tubes, mixed with 1 mL of Trizol, and stored at −80 °C until use.
Total RNA Extraction
The PBMC extracts were thawed at room temperature, then combined with 200 μL of chloroform. The samples were shaken vigorously for 20–30 s, allowed to stand for 15 min, and centrifuged at 12,000 rpm for 15 min at 4 °C. The upper layer was removed into a tube, combined with 500 μL of isopropanol, mixed upside down 50 times, and centrifuged at 12,000 rpm for 10 min at 4 °C. The precipitate was washed once with 75% absolute ethanol, centrifuged at 7500 rpm for 10 min at 4 °C. The supernatant was discarded after centrifugation, and the precipitate was dissolved in 10 μL of diethyl pyrocarbonate (DEPC) water. The quality of the RNA was determined using a spectrophotometer (Nano Drop 2000, Thermo Scientific, Wilmington, DE, USA) using the A260/A280 ratio.
Reverse Transcription and qRT-PCR
Reverse transcription was performed using a reverse transcription kit (Takara, Tokyo, Japan). Quantitative RT-PCR was performed on an ABI 7500 real-time PCR using a fluorescent quantitative PCR kit (Takara, Tokyo, Japan). Relative gene expression of GAS5 was determined using the 2−ΔΔct method with human GAPDH as an endogenous control. The following primers for GAS5 were designed and purchased from Sangon Biotech: Forward: AGAGCAAGCCTAACTCAAGCCATTG, Reverse: ATGTCCTTACCCAAGCAAGTCATCC.
Measurement of Hippocampal Volume by MRI
Three imaging physicians with more than 5 years of working experience, under the guidance of neuroimaging and anatomy experts, and referring to the hippocampal segmentation protocol jointly developed by the European Alzheimer’s disease association and the Alzheimer’s disease neuroimaging action plan,14 used coronal fast spin back T2 weighted imaging for routine head scanning to image the hippocampus using a 3.0T MRI (Siemens, Germany). The first gray matter appearing below the hippocampal trough is the anterior boundary of the hippocampus, which was drawn layer by layer from front to back until the oval gray matter nodule on the inner side of the lower corner of the lateral ventricle appeared, marking the posterior boundary of the hippocampus. The medial boundary was the cisterna annuli and the lateral part of splenium of corpus callosum from front to back, excluding the posterior cerebral artery, meninges and tentorium cerebelli. The lateral boundary was the temporal angle of the lateral ventricle. The upper boundary was the hippocampal trough, fimbria, choroidal fissure or temporal angle of the lateral ventricle. The lower boundary was the white matter of the parahippocampal gyrus (including the lower bracket). The contour of each layer of the hippocampus was drawn manually in the coronal position, and the software automatically calculated the area within the sketching range. The area of each layer was multiplied by the layer spacing and interval to obtain the volume of each layer, and the volume of the hippocampus was obtained by adding all layers of the hippocampus. The scanning parameters were as follows: matrix 256 × 256, layer thickness 2.0 mm, interval 2.0 mm, field of view (FOV) 205 mm × 240 mm, time of repetition (TR) 7000 ms, time of echo (TE) 97 ms, collection times: 2 times.
Statistical Analysis
All analyses were performed using SPSS 25.0 software (IBM) and GraphPad Prism 5.01 software (GraphPad Software Inc). Data are expressed as the mean and standard deviation (SD), the median and interquartile range (IQR), or count (percentage). Chi-squared tests or independent sample t-tests were used to compare baseline characteristics, relative expression of GAS5, and hippocampal volume between the two groups. Correlations between variables were determined using Spearman’s rank correlation test. Receiver operating characteristic (ROC) curves were used to compare the diagnostic values of GAS5 and total hippocampal volume in AD. P values <0.05 were considered statistically significant.
Results
Clinical and Demographic Characteristics of Participants
A total of 108 patients with AD (mean age 71.65 ± 5.69 years) and 83 healthy controls (mean age 70.30 ± 5.21 years) were enrolled in the study. The clinical and demographic characteristics of the two groups were collected. As shown in Table 1, age, sex, BMI, smoking status, alcohol assumption, medical histories of hypertension, diabetes, coronary heart disease, and TC, TG, HDL, and vitB12 levels did not differ significantly between the two groups (P>0.05). However, patients with AD had a significantly shorter mean education duration (6.63 ± 4.14 vs 8.23 ± 4.34, P < 0.01), lower MMSE scores (16.68 ± 4.07 vs 29.7 ± 0.96, P < 0.001), and higher LDL levels (2.61 ± 0.87 vs 2.38 ± 0.53, P = 0.032).
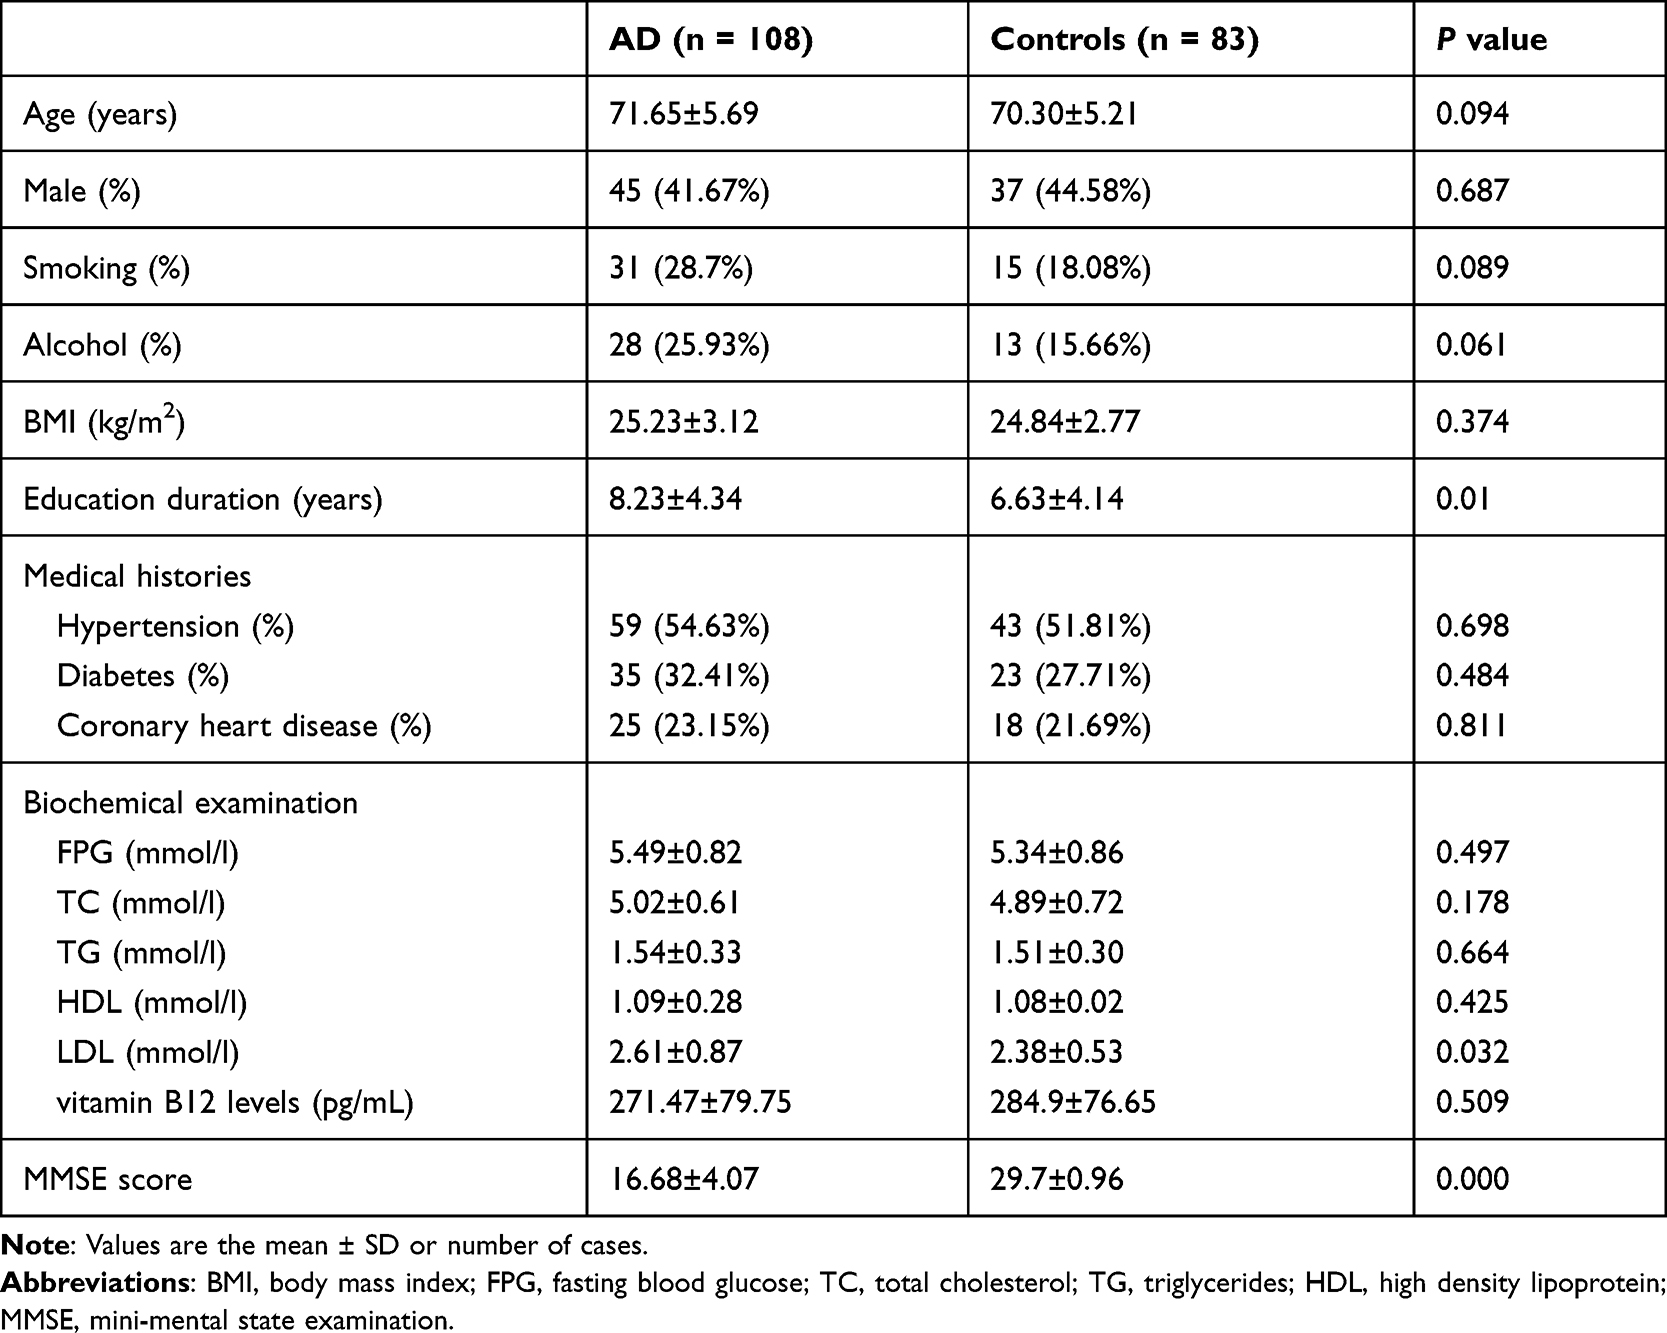 |
Table 1 Analysis of Baseline Characteristics in the Two Groups |
Comparison of GAS5 Expression Between Patients with AD and Healthy Controls
The levels of GAS5 were significantly upregulated in the PBMC of patients with AD compared with those in healthy controls (3.84 ± 1.82 vs 1.75 ± 0.9, P < 0.001), as shown in Figure 1A. To further assess the relationship between GAS5 and AD, a correlation analysis was performed between GAS5 levels and MMSE score. The results showed that GAS5 expression negatively correlated with MMSE score in patients with AD (r = −0.887, P < 0.001) (Figure 1B).
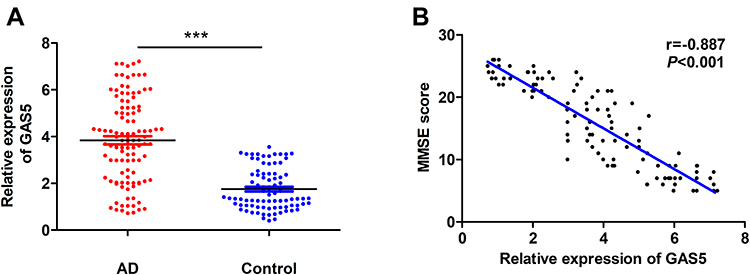 |
Figure 1 Changes in PBMC GAS5 levels in patients with AD. (A) Relative expression of GAS5 in PBMCs was upregulated in patients with AD (n = 108) compared with that in controls (n = 83) (independent sample t-tests). (B) The expression of GAS5 and MMSE scores were negatively correlated in patients with AD (n = 108) (Pearson analysis). ***P < 0.001. |
Changes in Hippocampal Volume in Patients with AD
Figure 2 shows the changes in hippocampal morphology corresponding to different MMSE scores in the AD group compared to those in the healthy group. There were differences in left hippocampal volume (3776.32 ± 181.66 vs 4016.49 ± 223.08, P < 0.001), right hippocampal volume (3819.79 ± 195.32 vs 4068.98 ± 199.72, P < 0.001) and total hippocampal volume (3798.06 ± 187.02 vs 4042.73 ± 209.59, P < 0.001) between patients with AD and healthy controls (Figure 3). Correlation analyses of total hippocampal volume and MMSE score and total hippocampal volume and GAS5 expression were performed. The results showed that the total hippocampal volume was positively correlated with MMSE score in patients with AD (r = 0.558, P < 0.001) (Figure 4A). In contrast, total hippocampal volume was negatively correlated with GAS5 expression in patients with AD (r = −0.667, P < 0.001) (Figure 4B).
 |
Figure 2 Changes in hippocampal morphology as determined using MRI. (A) Normal hippocampal morphology. (B) Mild hippocampal atrophy (MMSE = 25). (C) Moderate hippocampal atrophy (MMSE = 16). (D) Severe hippocampal atrophy (MMSE = 7). |
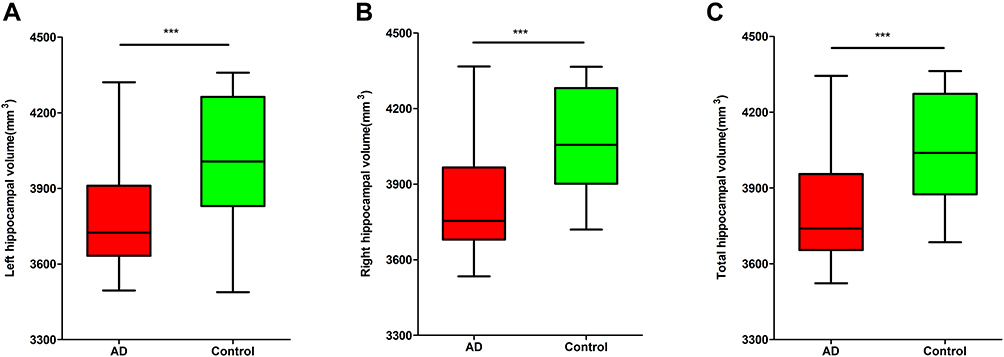 |
Figure 3 Alterations in hippocampal volume in patients with AD. (A) Left hippocampal volumes were smaller in the AD group (n = 108) than those in the control group (n = 83). (B) Right hippocampal volumes were smaller in the AD group (n = 108) than those in the control group (n = 83). (C) The total hippocampal volumes were smaller in the AD group (n = 108) than those in the control group (n = 83). ***P < 0.001. |
 |
Figure 4 Correlation analysis of total hippocampal volume, MMSE score, and GAS5 levels in patients with AD. (A) Positive correlation between MMSE score and total hippocampal volume. (r = 0.558, P< 0.001) (Pearson analysis). (B) Negative correlation between total hippocampal volume and expression of GAS5 (r =−0.667, P< 0.001) (Pearson analysis). |
ROC Curve Analysis
To further evaluate the diagnostic efficacy of GAS5 in AD, an ROC curve was generated with AD as the positive group and healthy control as the negative group. Since GAS5 expression and AD were negatively correlated, the inverse value was used to generate the curve. The area under the curve (AUC) was 0.831, the sensitivity was 61.1%, and the specificity was 95.2% (Figure 5A). The ROC curve for total hippocampal volume was generated in the same manner as that used for GAS5 expression. The AUC was 0.808, the sensitivity was 57.4%, and the specificity was 92.8% (Figure 5B). Then, an ROC curve obtained by combining GAS5 expression and total hippocampal volume was generated. The AUC for this ROC curve was 0.891, the sensitivity was 74.1%, and the specificity was 92.8% (Figure 5C). These data suggested that the combination of GAS5 expression and total hippocampal volume had a better diagnostic rate than the measurement of GAS5 expression alone (Figure 5D).
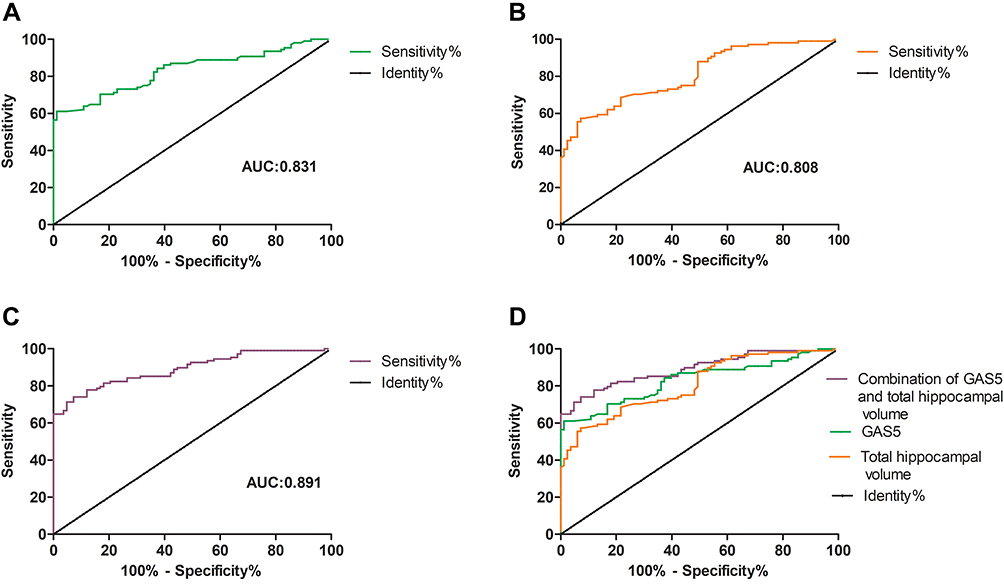 |
Figure 5 Receiver operating characteristic curves. (A) ROC curve of GAS5 levels (AUC = 0.831, sensitivity = 61.1%, specificity = 95.2%). (B) ROC curve of total hippocampal volume (AUC = 0.808, sensitivity = 57.4%, specificity = 92.8%). (C) ROC curve of combined GAS5 levels and total hippocampal volume (AUC = 0.891, sensitivity = 74.1%, specificity = 92.8%). (D) Combination diagram of ROC curves. |
Discussion
Alzheimer’s disease is characterized by extracellular amyloid-β (Aβ) plaque accumulation and intracellular neurofibrillary tangles (NFTs) comprised of hyperphosphorylated tau protein, which are associated with mitochondrial and synaptic dysfunction, oxidative damage, and neuroinflammation. The pathogenesis of AD is considered to be multifactorial, and the exact pathogenesis remains unknown.15 Interestingly, recent studies have found that there may be a relationship between ncRNA and AD pathophysiology. Abnormal expression of ncRNAs and their target mRNAs was observed in the central nervous system, cerebrospinal fluid, and serum of patients with AD, which suggested that they were involved in AD pathogenesis.9 The present study showed that the expression of GAS5 was up-regulated in patients with AD and was negatively correlated with MMSE score. These findings suggested that GAS5 may play a role in AD pathogenesis and may be a diagnostic marker of AD.
GAS5 is a 4087 bp member of the GAS family located on chromosome 1. Previous studies have found that the most profound biological role of GAS5 is in tumors. Studies have shown that GAS5 showed low expression in most tumor samples, such as glioma, non-small cell lung cancer, and breast cancer. As a tumor suppressor, GAS5 is involved in the regulation of tumorigenesis and tumor progression.16 However, GAS5 is also involved in the development of inflammatory-related diseases, such as atherosclerosis (AS). Studies have shown that GAS5 and LDL were markedly increased in the sera of patients with AS. In addition, GAS5 knockdown suppressed inflammation and oxidative stress induced by oxidized low-density lipoprotein in macrophages.17 Our results showed that GAS5 and LDL were increased in AD, which indicated that GAS5 and LDL may jointly promote the pathogenesis of AD. In addition, GAS5 has been found to be associated with many diseases related to aging. Studies have shown that GAS5 is involved in the regulation of neurological diseases. GAS5 is highly expressed in ischemic stroke and has neurotoxic properties. Down regulation of GAS5 can reduce neuronal damage and protect against stroke.18 In addition, GAS5 was significantly upregulated in a PD mouse model and in response to lipopolysaccharide, which suggested that GAS5 was involved in the development of PD through activation of microglia.19 Furthermore, GAS5 has been shown to be a senescence gene, as cell cycle arrest can stimulate the transition of cells to a so-called senescent state. Moreover, aging is a risk factor for AD. A previous study showed that GAS5 may accelerate aging of nerve cells through various mechanisms. The subjects selected in our study were elderly, but GAS5 was upregulated in patients with AD and the expression of GAS5 increased with decreased MMSE score, which suggested that high expression of GAS5 may have accelerated onset and progression of AD. Studies have shown that silencing GAS5 inhibited the inflammatory response in neuronal cells.20 However, the role of GAS5 in AD requires further study.
The hippocampus is an important brain region responsible for memory function. Previous studies have shown that pathological changes in the olfactory cortex of the hippocampus appear in the early stages of AD, and hippocampal atrophy is believed to be a sensitive marker for diagnosis of AD.21 The baseline hippocampal volume of patients with AD was positively correlated with MMSE score in a previous study,22 which was consistent with the results of the present study. Left hippocampal volume, right hippocampal volume, and total hippocampal volume were all decreased in patients with AD compared with those in healthy controls, and these decreases in volume correlated with decreased MMSE score. A previous study showed that GAS5 expression was significantly elevated in the hippocampus as aging gene.23 Another study showed that GAS5 expression was higher in the hippocampi of 15-month-old C57BL/6 mice compared with that in 2-month-old mice.24 Furthermore, GAS5 levels in the hippocampus of old (22-month-old) C57BL/6 male mice were negatively correlated with elevated-plus maze test scores.25 Our study also found that the expression of GAS5 was negatively correlated with the total hippocampal volume, which indicated that GAS5 may play an important regulatory role in hippocampal atrophy, which should be a subject of future studies.
In the present study, we showed that GAS5 expression was able to differentiate patients with AD from healthy controls, as determined by ROC curve analysis, for which the sensitivity was 61.1% and the specificity was 95.2%. Furthermore, we evaluated the accuracy of hippocampal volume as a diagnostic marker for AD, and the sensitivity was 57.4% and the specificity was 92.8%, which demonstrated that hippocampal volume provided less diagnostic accuracy than GAS5. However, a joint analysis of GAS5 and hippocampal volume resulted in increased sensitivity (74.1%) for diagnosis of AD, and the specificity (92.8%) was similar to that when using GAS5 or hippocampal volume alone. Blood samples and hippocampal volume measurements are easy to obtain. Therefore, these indices could feasibly be used in the clinic to improve the accuracy of AD diagnosis.
A limitation of this study was the relatively small sample size, which made it impossible to group patients with AD patients into mild, moderate, and severe subgroups to further characterize the role of GAS5 in AD progression. Although we showed that GAS5 may be a sensitive and specific biomarker for AD, we were not able to determine the mechanisms by which GAS5 may promote onset and progression of AD. Mechanistic studies and large-scale clinical studies are needed to further evaluate the role of GAS5 in AD.
Conclusion
In conclusion, this identified GAS5 and hippocampal volume as joint sensitive and specific biomarkers of AD.
Acknowledgments
We would like to thank Dr Jingdong Zhou for editorial help.
Funding
This work was supported by the scientific research plan of the Affiliated People’s Hospital of Jiangsu University (Y2021018).
Disclosure
The authors report no conflicts of interest in this work.
References
1. Alzheimer’s Association. 2021 Alzheimer’s disease facts and figures. Alzheimers Dement. 2021;17(3):327–406. doi:10.1002/alz.12328
2. Sintini I, Whitwell JL. Update on neuroimaging in Alzheimer’s disease. Curr Opin Neurol. 2021;34(4):525–531. doi:10.1097/WCO.0000000000000947
3. Rajan KB, Weuve J, Barnes LL, McAninch EA, Wilson RS, Evans DA. Population estimate of people with clinical Alzheimer’s disease and mild cognitive impairment in the United States (2020-2060). Alzheimers Dement. 2021;17(12):1966–1975. doi:10.1002/alz.12362
4. Tillmann J, Schnakenberg R, Puth MT, Weckbecker K, Just J, Munster E. Barriers in general practitioners’ dementia diagnostics among people with a migration background in Germany (BaDeMi) - study protocol for a cross-sectional survey. BMC Med Res Methodol. 2018;18(1):124. doi:10.1186/s12874-018-0580-0
5. Jia L, Du Y, Chu L, et al. Prevalence, risk factors, and management of dementia and mild cognitive impairment in adults aged 60 years or older in China: a cross-sectional study. Lancet Public Health. 2020;5(12):e661–e671. doi:10.1016/S2468-2667(20)30185-7
6. Scheltens P, De Strooper B, Kivipelto M, et al. Alzheimer’s disease. Lancet. 2021;397(10284):1577–1590. doi:10.1016/S0140-6736(20)32205-4
7. Ferrari C, Sorbi S. The complexity of Alzheimer’s disease: an evolving puzzle. Physiol Rev. 2021;101(3):1047–1081. doi:10.1152/physrev.00015.2020
8. Atri A. The Alzheimer’s Disease Clinical Spectrum: diagnosis and Management. Med Clin North Am. 2019;103(2):263–293. doi:10.1016/j.mcna.2018.10.009
9. Lauretti E, Dabrowski K, Pratico D. The neurobiology of non-coding RNAs and Alzheimer’s disease pathogenesis: pathways, mechanisms and translational opportunities. Ageing Res Rev. 2021;71:101425. doi:10.1016/j.arr.2021.101425
10. Mihailescu R. Gene expression regulation: lessons from noncoding RNAs. RNA. 2015;21(4):695–696. doi:10.1261/rna.050815.115
11. Song W, Wang K, Zhang RJ, Dai QX, Zou SB. Long noncoding RNA GAS5 can predict metastasis and poor prognosis: a meta-analysis. Minerva Med. 2016;107(1):70–76.
12. Wang F, Ren D, Liang X, et al. A long noncoding RNA cluster-based genomic locus maintains proper development and visual function. Nucleic Acids Res. 2019;47(12):6315–6329. doi:10.1093/nar/gkz444
13. McKhann G, Drachman D, Folstein M, Katzman R, Price D, Stadlan EM. Clinical diagnosis of Alzheimer’s disease: report of the NINCDS-ADRDA Work Group under the auspices of Department of Health and Human Services Task Force on Alzheimer’s Disease. Neurology. 1984;34(7):939–944. doi:10.1212/WNL.34.7.939
14. Boccardi M, Bocchetta M, Apostolova LG, et al. Delphi definition of the EADC-ADNI Harmonized Protocol for hippocampal segmentation on magnetic resonance. Alzheimers Dement. 2015;11(2):126–138. doi:10.1016/j.jalz.2014.02.009
15. Zhu D, Montagne A, Zhao Z. Alzheimer’s pathogenic mechanisms and underlying sex difference. Cell Mol Life Sci. 2021;78(11):4907–4920. doi:10.1007/s00018-021-03830-w
16. Liu Q, Yu W, Zhu S, et al. Long noncoding RNA GAS5 regulates the proliferation, migration, and invasion of glioma cells by negatively regulating miR-18a-5p. J Cell Physiol. 2018;234(1):757–768. doi:10.1002/jcp.26889
17. Zhang Y, Lu X, Yang M, Shangguan J, Yin Y. GAS5 knockdown suppresses inflammation and oxidative stress induced by oxidized low-density lipoprotein in macrophages by sponging miR-135a. Mol Cell Biochem. 2021;476(2):949–957. doi:10.1007/s11010-020-03962-w
18. Deng Y, Chen D, Gao F, et al. Silencing of Long Non-coding RNA GAS5 Suppresses Neuron Cell Apoptosis and Nerve Injury in Ischemic Stroke Through Inhibiting DNMT3B-Dependent MAP4K4 Methylation. Transl Stroke Res. 2020;11(5):950–966. doi:10.1007/s12975-019-00770-3
19. Xu W, Zhang L, Geng Y, Liu Y, Zhang N. Long noncoding RNA GAS5 promotes microglial inflammatory response in Parkinson’s disease by regulating NLRP3 pathway through sponging miR-223-3p. Int Immunopharmacol. 2020;85:106614. doi:10.1016/j.intimp.2020.106614
20. Cao Y, Jiang C, Lin H, Chen Z. Silencing of Long Noncoding RNA Growth Arrest-Specific 5 Alleviates Neuronal Cell Apoptosis and Inflammatory Responses Through Sponging microRNA-93 to Repress PTEN Expression in Spinal Cord Injury. Front Cell Neurosci. 2021;15:646788. doi:10.3389/fncel.2021.646788
21. Dhikav V, Duraiswamy S, Anand KS. Correlation between hippocampal volumes and medial temporal lobe atrophy in patients with Alzheimer’s disease. Ann Indian Acad Neurol. 2017;20(1):29–35. doi:10.4103/0972-2327.199903
22. Peng GP, Feng Z, He FP, et al. Correlation of hippocampal volume and cognitive performances in patients with either mild cognitive impairment or Alzheimer’s disease. CNS Neurosci Ther. 2015;21(1):15–22. doi:10.1111/cns.12317
23. Feldker DE, Datson NA, Veenema AH, et al. GeneChip analysis of hippocampal gene expression profiles of short- and long-attack-latency mice: technical and biological implications. J Neurosci Res. 2003;74(5):701–716. doi:10.1002/jnr.10800
24. Verbitsky M, Yonan AL, Malleret G, Kandel ER, Gilliam TC, Pavlidis P. Altered hippocampal transcript profile accompanies an age-related spatial memory deficit in mice. Learn Mem. 2004;11(3):253–260. doi:10.1101/lm.68204
25. Meier I, Fellini L, Jakovcevski M, Schachner M, Morellini F. Expression of the snoRNA host gene gas5 in the hippocampus is upregulated by age and psychogenic stress and correlates with reduced novelty-induced behavior in C57BL/6 mice. Hippocampus. 2010;20(9):1027–1036. doi:10.1002/hipo.20701
 © 2022 The Author(s). This work is published and licensed by Dove Medical Press Limited. The full terms of this license are available at https://www.dovepress.com/terms.php and incorporate the Creative Commons Attribution - Non Commercial (unported, v3.0) License.
By accessing the work you hereby accept the Terms. Non-commercial uses of the work are permitted without any further permission from Dove Medical Press Limited, provided the work is properly attributed. For permission for commercial use of this work, please see paragraphs 4.2 and 5 of our Terms.
© 2022 The Author(s). This work is published and licensed by Dove Medical Press Limited. The full terms of this license are available at https://www.dovepress.com/terms.php and incorporate the Creative Commons Attribution - Non Commercial (unported, v3.0) License.
By accessing the work you hereby accept the Terms. Non-commercial uses of the work are permitted without any further permission from Dove Medical Press Limited, provided the work is properly attributed. For permission for commercial use of this work, please see paragraphs 4.2 and 5 of our Terms.