")
Back to Journals » OncoTargets and Therapy » Volume 11
Lentivirus-mediated overexpression of HSDL2 suppresses cell proliferation and induces apoptosis in cholangiocarcinoma
Authors Zhang DY, Liu Z, Lu Z, Sun WL, Ma X, Zhang P, Wu BQ, Cui PY
Received 5 June 2018
Accepted for publication 28 August 2018
Published 17 October 2018 Volume 2018:11 Pages 7133—7142
DOI https://doi.org/10.2147/OTT.S176410
Checked for plagiarism Yes
Review by Single anonymous peer review
Peer reviewer comments 2
Editor who approved publication: Dr William C. Cho
Deng-Yong Zhang,1 Zhong Liu,1 Zheng Lu,1 Wan-Liang Sun,1 Xiang Ma,1 Pei Zhang,2 Bin-Quan Wu,1 Pei-Yuan Cui1
1Department of General Surgery, The First Affiliated Hospital of Bengbu Medical College, Bengbu 233000, Anhui, People’s Republic of China; 2Department of Pharmacy, Bengbu Medical College, Bengbu 233000, Anhui, People’s Republic of China
Background: Cholangiocarcinoma (CCA) is a malignant tumor of the bile duct epithelium, including intrahepatic, perihilar, and distal CCA based on anatomical location. Hydroxysteroid dehydrogenase-like 2 (HSDL2) belongs to the SDR subfamily of oxidoreductases, and it is involved in glioma oncogenesis, as it can promote cell proliferation and inhibit cell apoptosis. The purpose of this study was to explore the underlying molecular mechanisms of HSDL2 in the process of CCA.
Methods: HSDL2 expression levels were observed in CCA and adjacent (normal control) tissues by analyzing data from The Cancer Genome Atlas and Gene Expression Omnibus databases. A receiver operating characteristic curve analysis was carried out. In vitro, we overexpressed HSDL2 in RBE cells (a human CCA cell line) using a stable lentivirus-mediated transduction strategy. We then used quantitative real-time-PCR and Western blotting methods to detect the efficiency of HSDL2 overexpression. Cell proliferation was assessed using a Celigo Image Cytometer, MTT assays, and the expression of PCNA. Cell apoptosis was assessed by flow cytometry analysis, caspase3/7 activity, and the expression of the apoptotic markers BCL-2 and BAX.
Results: We observed a downregulation of HSDL2 in CCA tissues based on The Cancer Genome Atlas and Gene Expression Omnibus data analysis. The receiver operating characteristic curve analysis showed that HSDL2 could be an excellent efficacy biomarker for CCA. In vitro, HSDL2 overexpression largely suppressed the proliferation of RBE cells. In addition, apoptosis was induced by HSDL2 overexpression.
Conclusion: The results of the data analysis indicated that, compared with adjacent tissues, HSDL2 was downregulated in CCA tissues, and overexpressing HSDL2 in CCA cells suppressed growth and proliferation, which involved activating apoptosis. This helps to understand the underlying HSDL2-related molecular mechanisms in the process of CCA.
Keywords: cholangiocarcinoma, CCA, HSDL2, lentivirus, proliferation, apoptosis
Introduction
Cholangiocarcinoma (CCA) is a malignant tumor of the bile duct epithelium,1 including intrahepatic, perihilar, and distal CCA based on anatomical location.2 In addition, mixed hepatocellular–cholangiocellular carcinomas have recently been reported to be a distinct subtype of CCA based on the World Health Organization classification.3–5 Recently, primary sclerosing cholangitis, cirrhosis, viral hepatitis C6–9 and B,10–12 liver fluke infections, inflammatory bowel disease, and liver disease have been shown to be associated with the development of CCA.13,14 Similarly, metabolic syndrome is recognized as a risk factor for CCA.15 However, the precise underlying mechanisms are not yet fully understood.
Over the past few decades, a multitude of studies have shown that ether lipids are disturbed in tumor cells, and lipid metabolism abnormality is a major marker of cancer.16–19 Peroxisomes, a crucial organelle with low abundance, are necessary for all sorts of human cell metabolic functions.20 Hydroxysteroid dehydrogenase-like 2 (HSDL2), composed of N-terminal catalytic and C-terminal SCP-2 domains, belongs to the SDR subfamily of oxidoreductases.21 It has been argued that the peroxisomal localization of HSDL2 indicates that it is associated with fatty acid metabolism,22 indicating that HSDL2 may be involved in lipid metabolism.
In the present study, we found that HSDL2 was downregulated in CCA tissues based on mRNA expression profiles from both The Cancer Genome Atlas (TCGA) and Gene Expression Omnibus (GEO) databases. Thereafter, we overexpressed HSDL2 in RBE cells using a stable lentivirus (LV)-mediated transduction strategy. The results showed that, following overexpression of HSDL2, cell proliferation was significantly inhibited and cell apoptosis was significantly promoted in RBE cells, indicating that CCA cell survival was dependent on HSDL2 expression. These results have significant implications for understanding the underlying HSDL2-related molecular mechanisms in the process of CCA.
Materials and methods
TCGA and GEO data on HSDL2 expression
Publicly available RNA sequencing (RNA-seq) data were downloaded directly from TCGA (https://cancergenome.nih.gov/). This dataset involved 36 CCA tissues and 9 adjacent tissues. The mRNA expression levels of HSDL2 (ENSG00000119471) were presented as fragments per kilobase of exon per million. Two sets of normalized data were downloaded from GEO (https://www.ncbi.nlm.nih.gov/geo/): GSE76297 (Affymetrix-017586 Human Transcriptome Array 2.0 [Affymetrix, Santa Clara, CA, USA], 91 CCA tissues vs 92 adjacent tissues) and GSE26566 (Illumina-006104 humanRef-8 v2.0 expression beadchip [Illumina, San Diego, CA, USA], 104 CCA tissues vs 59 adjacent tissues).23
To detect HSDL2 expression level in CCA tissues and adjacent (normal control) tissues, the ILMN_1787843 probe (for GSE26566) and the TC09000566.hg.1 and TC09002184.hg.1 probe sets (for GSE76297) were used with BioMart Ensembl24,25 and the limma package based on the R language (The R Foundation, Vienna, Austria).26 A receiver operating characteristic (ROC) curve analysis was carried out to distinguish between cancer and adjacent tissues (using the above three datasets) with GraphPad Prism v6 (GraphPad Software Inc, San Diego, CA, USA).
Cell culture
RBE cells (a human CCA cell line) were purchased from the cell bank of the Chinese Academy of Sciences (Shanghai, People’s Republic of China) and cultured with Dulbecco’s Modified Eagle’s Medium containing 10% fetal bovine serum and 100 U/mL penicillin/streptomycin at 37°C in humidified 5% CO2. The above three reagents were purchased from Gibco (New York, NY, USA).
LV construction and cell transfection
The LV for overexpressing HSDL2 (LV-HSDL2) and the control LV (LV-Control) were designed and synthesized by GeneChem (Shanghai, People’s Republic of China). RBE cells were infected with LV-HSDL2 or LV-Control (multiplicity of infection =20), respectively. GFP expression was observed to assess infection efficiency based on fluorescence microscopy. In addition, cells were harvested to detect the efficiency of HSDL2 overexpression by quantitative real-time reverse transcription PCR (qRT-PCR) and Western blotting.
qRT-PCR analysis
Total RNA was extracted using the TRIzol reagent (Thermo Fisher Scientific, Waltham, MA, USA) according to the manufacturer’s protocol. The quantity and quality of total RNA were measured using a NanoDrop 2000 spectrophotometer (Thermo, Wilmington, DE, USA), and RNA integrity was determined by agarose gel electrophoresis. cDNA was generated by SuperScriptTM III Reverse Transcriptase (Invitrogen). The relative expression of HSDL2 was determined using FastStart Universal SYBR Green Master (Rox) (Roche Inc, Basel, Switzerland) with specific primers (General Biosystems, Chuzhou, People’s Republic of China), which are listed in Table 1. PCRs were performed in triplicate using the following temperature profile: denaturation at 95°C for 10 minutes followed by amplification by 40 cycles of 95°C for 10 seconds and 60°C for 1 minute. GAPDH was used as an internal reference. The data were analyzed using the 2−ΔΔCt method, and the expression level of HSDL2 was represented as the fold change.
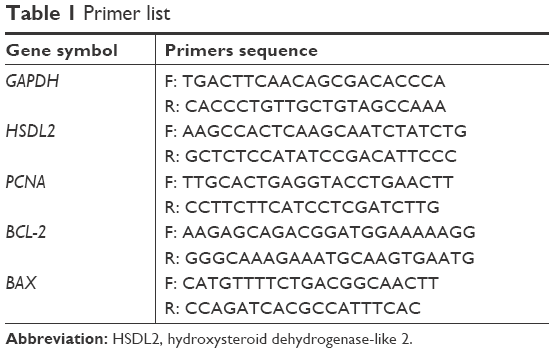 | Table 1 Primer list |
Cell proliferation profiles examined using a Celigo Image Cytometer
After digestion with 0.25% Trypsin (Thermo Fisher Scientific) of RBE cells in the logarithmic growth phase in the LV-HSDL2 and LV-Control groups, the cells were resuspended in cell culture medium Dulbecco’s Modified Eagle’s Medium and seeded in 96-well plates in triplicate, with a cell density of 1,000 cells/well, at 37°C in humidified 5% CO2. From the second day after seeding, Celigo Image Cytometer (Nexcelom Bioscience, Lawrence, MA, USA) was used to record at 488 nm laser once a day for 5 consecutive days and generate cell growth curves.
MTT assay
Cell proliferation was assessed by MTT assay for 5 consecutive days. The method of resuspending the RBE cells was the same as for Celigo. In brief, from the second day after seeding, 20 μL of MTT solution (final concentration, 5 mg/mL) was added to each well without changing the liquid at 4 hours before the end of the culture, and 100 μL of DMSO was then added after completely removing the culture media (but not removing the formazan particles at the bottom of each plate). The plates were shaken constantly for 2–5 minutes, and the optical density at 490 nm (OD490) was assessed using a microplate reader.
Immunoblotting
The cells were scraped off and lysed in RIPA lysis buffer (P0013B; Beyotime, Shanghai, People’s Republic of China), and a BCA protein assay kit (P0010S; Beyotime) was used to measure the protein concentration. In brief, 20 μg of total protein was separated by 10% SDS-PAGE and transferred to PVDF membranes (BioSciences, Pollards Wood, UK) at 300 mA for 40 minutes in an ice water mixture. The membranes were incubated overnight at 4°C with the following primary antibodies: rabbit anti-HSDL2 at a dilution of 1:500 (HPA050453; Sigma-Aldrich Co., St Louis, MO, USA), mouse anti-PCNA at 1:1,000 (ab18197; Abcam, Cambridge, UK), rabbit anti-BCL-2 at 1:1,000 (ab32124; Abcam), rabbit anti-BAX at 1:1,000 (ab32503; Abcam), and mouse anti-GAPDH at 1:2,000 (sc-32233; Santa Cruz Biotechnology Inc., Dallas, TX, USA). Subsequently, the membranes were blocked for 1 hour at room temperature with 5% milk dissolved in TBST. The secondary HRP-conjugated antibodies were as follows: goat anti-mouse IgG H&L at 1:2,000 (sc-2005; Santa Cruz Biotechnology Inc.) or goat anti-rabbit IgG H&L at 1:5,000 (ab6721; Abcam). After washing three times with TBST, an ECL kit (Thermo Fisher Scientific) was used to detect the immunoactivity.
Apoptosis assay
An annexin V–allophycocyanin (APC) apoptosis detection kit (Ebioscience, San Diego, CA, USA) was used to detect cell apoptosis, following the manufacturer’s protocol. Cells in the LV-Control or LV-HSDL2 groups were resuspended at a density of 1×10⁶ cells/mL. The cell mixture, containing 10 μL of annexin V–APC, was left for 15 minutes at room temperature and a flow cytometry analysis (Guava easyCyte HT, Millipore, Billerica, MA, USA) was then performed.
Caspase 3/7 activity assay
Cells were resuspended and seeded in 96-well plates in triplicate at a cell density of 1,000 cells/well and at 37°C in a 5% CO2 incubator for another day. Caspase 3/7 activity was then tested using a Caspase Glo® 3/7 Assay (Promega Corporation, Fitchburg, WI, USA) based on the manufacturer’s protocol.
Statistical analysis
The results are presented as mean ± SD. P<0.05 was set as the critical value for statistical significance. Data analysis was performed using SPSS 22.0 software (IBM Corporation, Armonk, NY, USA).
Results
Low expression of HSDL2 in CCA based on database analysis
TCGA RNA-Seq-based transcriptome data on the HSDL2 gene were obtained and analyzed using the limma package based on the R language. The differentially expressed protein-coding RNAs (mRNAs) in CCA were obtained. The HSDL2 gene, which has not previously appeared in the published literature, was selected as the subject of this study. TCGA data on HSDL2 that could be used for expression analysis were extracted. The results of data analysis indicated that HSDL2 was significantly downregulated in CCA tissues compared to adjacent tissues (fragments of kilobase of exon per million: 11.21±1.177 vs 33.91±1.933, fold change =3.02, P<0.0001) (Figure 1A). The ROC curve analysis indicated an area under the curve of 0.9691 (P<0.0001; 95% CI: 0.9147–1.024) for HSDL2 (Figure 1B).
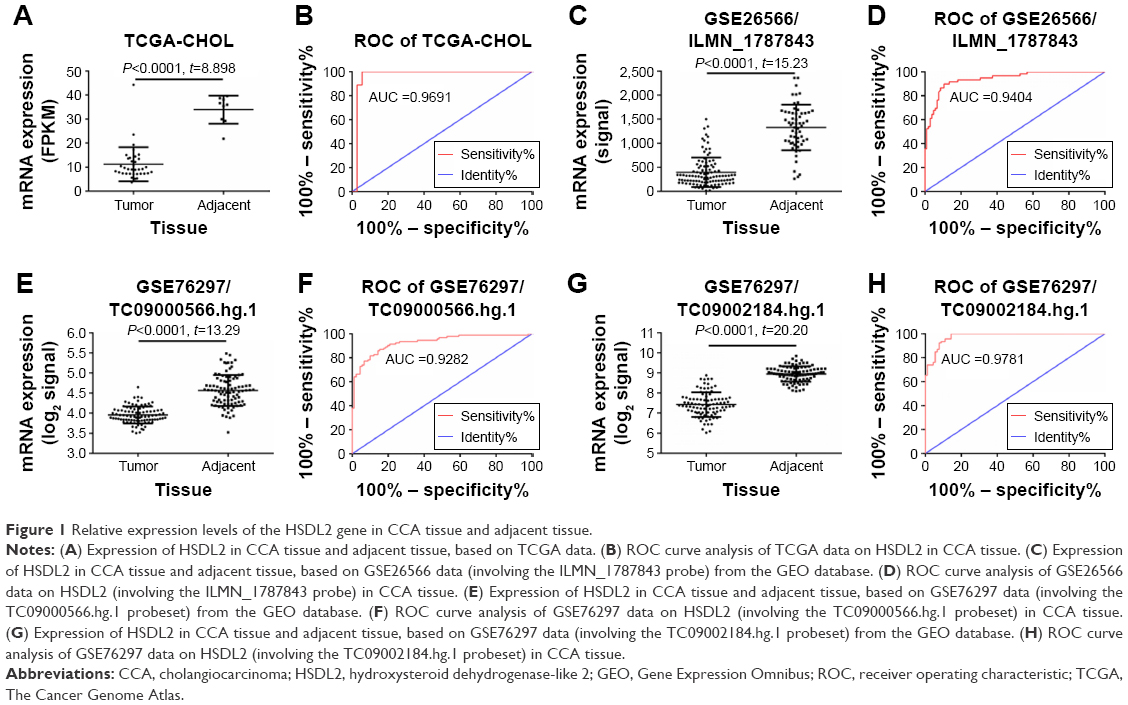 | Figure 1 Relative expression levels of the HSDL2 gene in CCA tissue and adjacent tissue. |
From the online GEO database, two microarray datasets (GSE76297 and GSE26566) on HSDL2 expression in CCA and adjacent tissues were obtained. In the GSE26566 dataset, the HSDL2 expression level (assessed using the ILMN_1787843 probe) was significantly lower in CCA tissues than in adjacent tissues (signal: 398.1±30.18 vs 1,329±61.37; fold change =3.34, P<0.001) (Figure 1C). The ROC curve analysis indicated an area under the curve of 0.9404 (P<0.0001; 95% CI: 0.9042–0.9767) for HSDL2 (assessed using the ILMN_1787843 probe) (Figure 1D). The GSE76297 data on the HSDL2 expression level (assessed using the TC09000566.hg.1 and TC09002184.hg.1 probesets), and the ROC curve analysis of the GSE76297 data concurred with the TCGA and GSE26556 results (Figure 1E–H). The results demonstrated that HSDL2 was significantly downregulated in CCA tissues compared with adjacent tissues, indicating that HSDL2 might be involved in the process of CCA in humans.
Overexpression efficiency of LV-HSDL2
RBE cells were transfected with LV-Control or LV-HSDL2, and the GFP fluorescence showed that the virus was highly effective at infecting the cells. HSDL2 was mainly expressed in the nucleus, and to a certain extent in the cytoplasm (Figure 2). The qRT-PCR results indicated that there was an overexpression efficiency of approximately 5.192 in RBE cells transfected with LV-HSDL2 (rather than LV-Control) (Figure 3A). Similarly, overexpression efficiency was further determined in RBE cells transfected with LV-HSDL2 or LV-Control via Western blotting. The Western blotting results suggested that LV-HSDL2 efficiently increased HSDL2 expression in RBE cells at the protein level (Figure 3B and C). Taken together, the LV-HSDL2 strategy efficiently increased HSDL2 expression in RBE cells.
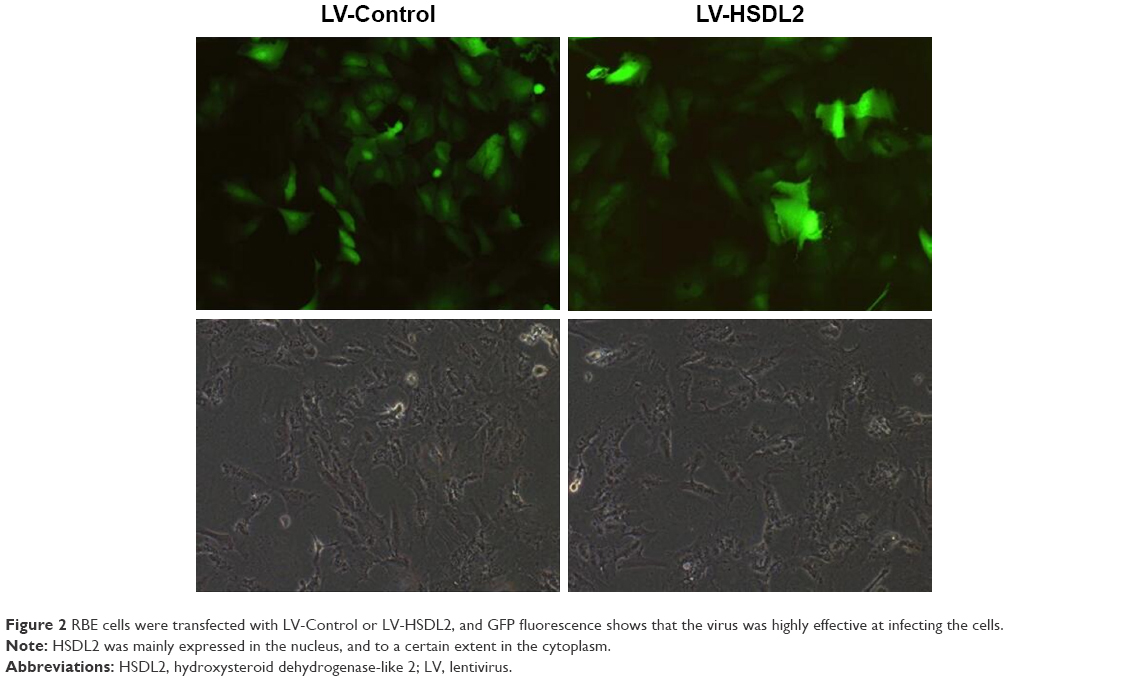 | Figure 2 RBE cells were transfected with LV-Control or LV-HSDL2, and GFP fluorescence shows that the virus was highly effective at infecting the cells. |
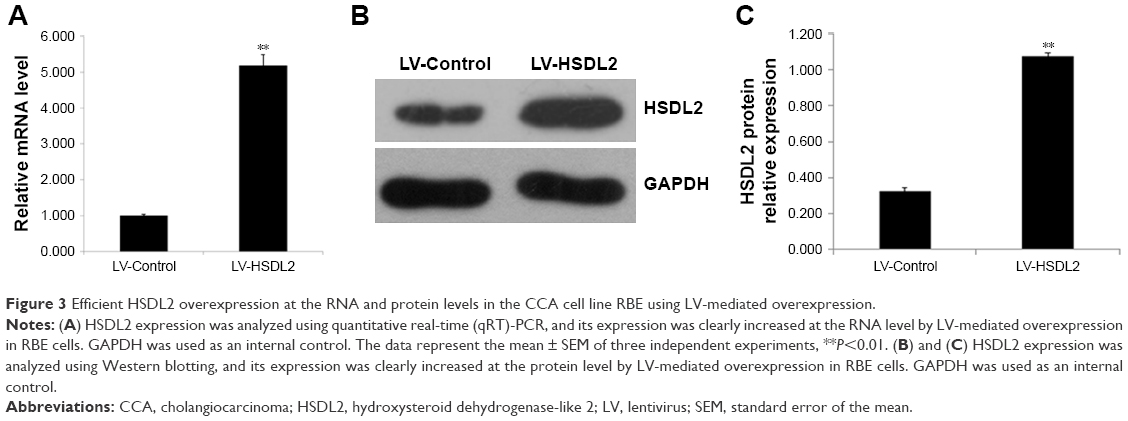 | Figure 3 Efficient HSDL2 overexpression at the RNA and protein levels in the CCA cell line RBE using LV-mediated overexpression. |
HSDL2 overexpression significantly blocked cell proliferation in RBE cells
To verify the effect of HSDL2 on cell proliferation, we used a Celigo Image Cytometer, MTT assay, and PCNA expression analysis. As shown in Figure 4A, a Celigo Image Cytometer was used to assess cell proliferation for 5 consecutive days. Significant inhibition of cell proliferation was detected in RBE cells transfected with LV-HSDL2 rather than LV-Control (Figure 4B and C). In addition, the number of RBE cells transfected with LV-HSDL2 hardly increased on the fourth and fifth days. Additionally, as can be seen from Figure 5A and B, the MTT assay results indicated significant inhibition of proliferation of RBE cells transfected with LV-HSDL2. Moreover, PCNA was suppressed by overexpressed HSDL2 in RBE cells (Figure 6). In general, the results implied that HSDL2 was vital for RBE cell proliferation, indicating that HSDL2 might suppress CCA progression based on the deceleration of cell proliferation.
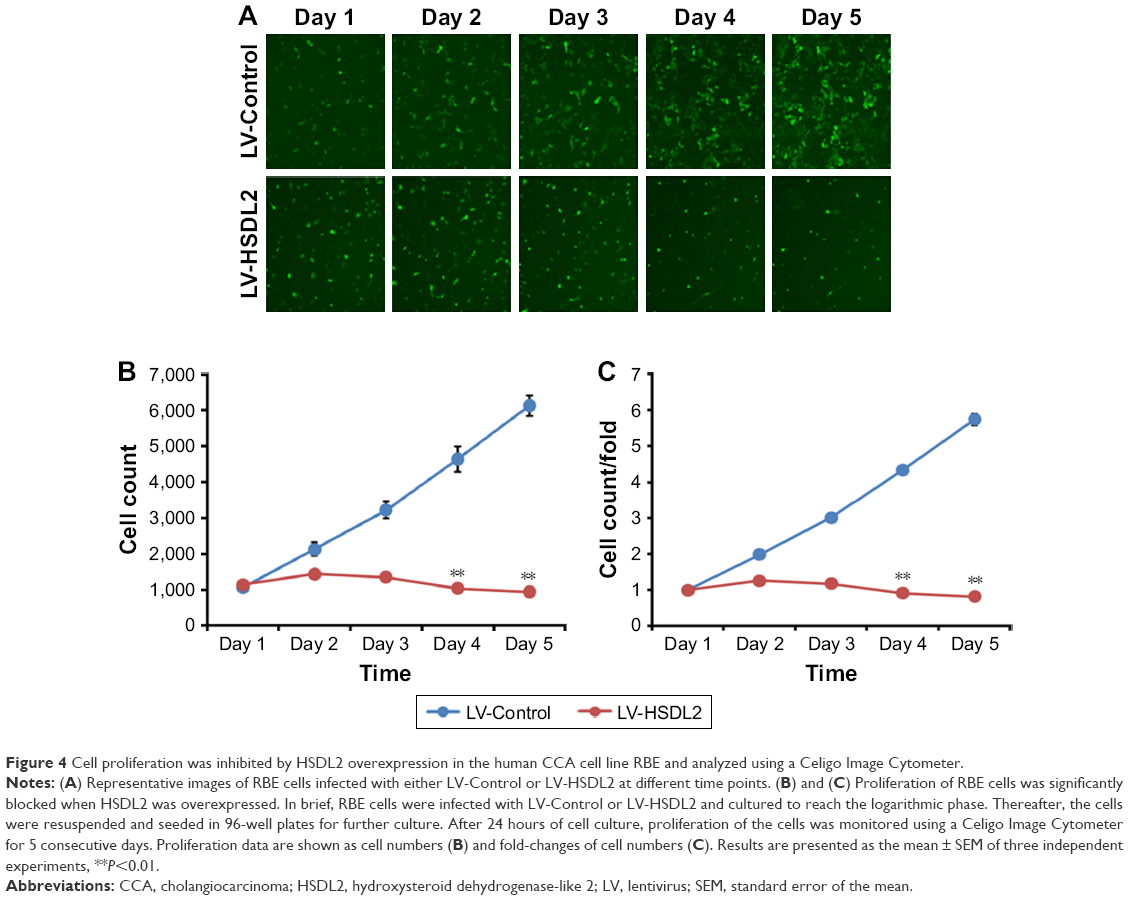 | Figure 4 Cell proliferation was inhibited by HSDL2 overexpression in the human CCA cell line RBE and analyzed using a Celigo Image Cytometer. |
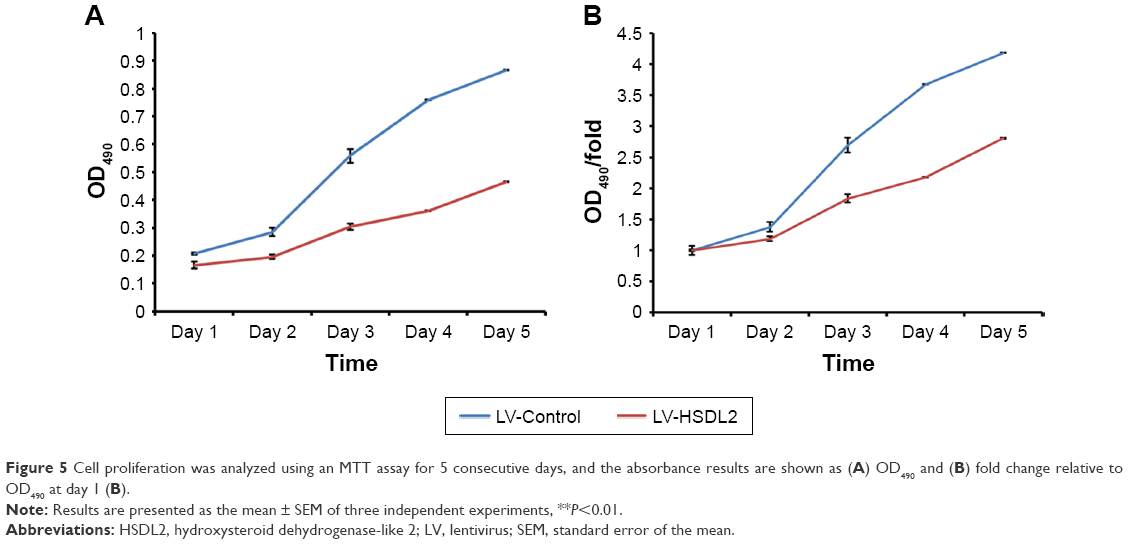 | Figure 5 Cell proliferation was analyzed using an MTT assay for 5 consecutive days, and the absorbance results are shown as (A) OD490 and (B) fold change relative to OD490 at day 1 (B). |
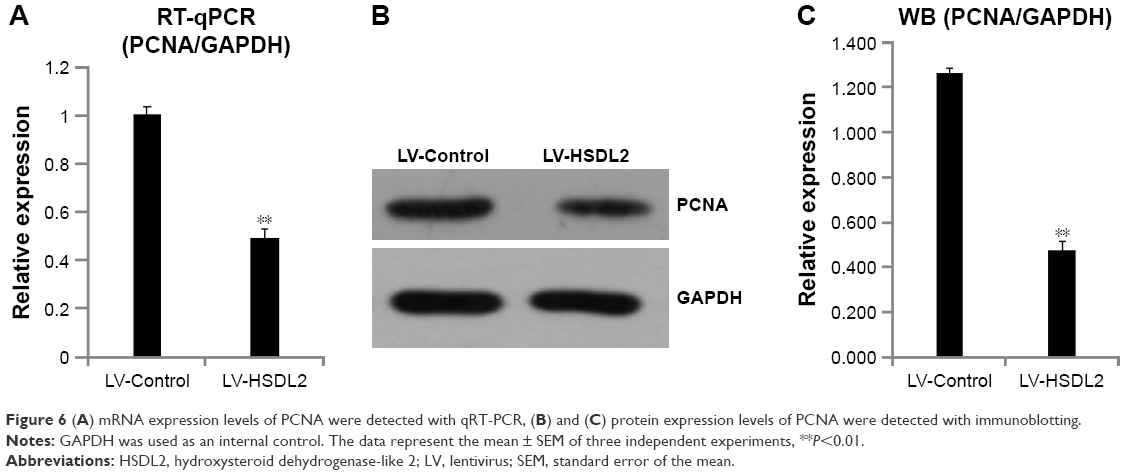 | Figure 6 (A) mRNA expression levels of PCNA were detected with qRT-PCR, (B) and (C) protein expression levels of PCNA were detected with immunoblotting. |
HSDL2 overexpression activated apoptosis in RBE cells
The inhibition of cell proliferation by HSDL2 overexpression may result from increased cell death. Consequently, apoptosis in RBE cells infected with LV-HSDL2 or LV-Control was assessed by annexin V–APC apoptosis detection, caspase 3/7 activity determination, and the mRNA/protein expression of BAX/BCL-2. There were more apoptotic cells among RBE cells infected with LV-HSDL2 rather than LV-Control (Figure 7A and B). Similarly, the activity of caspase-3/7 increased in RBE cells infected with LV-HSDL2 (Figure 7C). In RBE cells with overexpression of HSDL2, BAX mRNA and protein expression levels were decreased and BCL-2 mRNA and protein expression levels were increased (Figure 8).
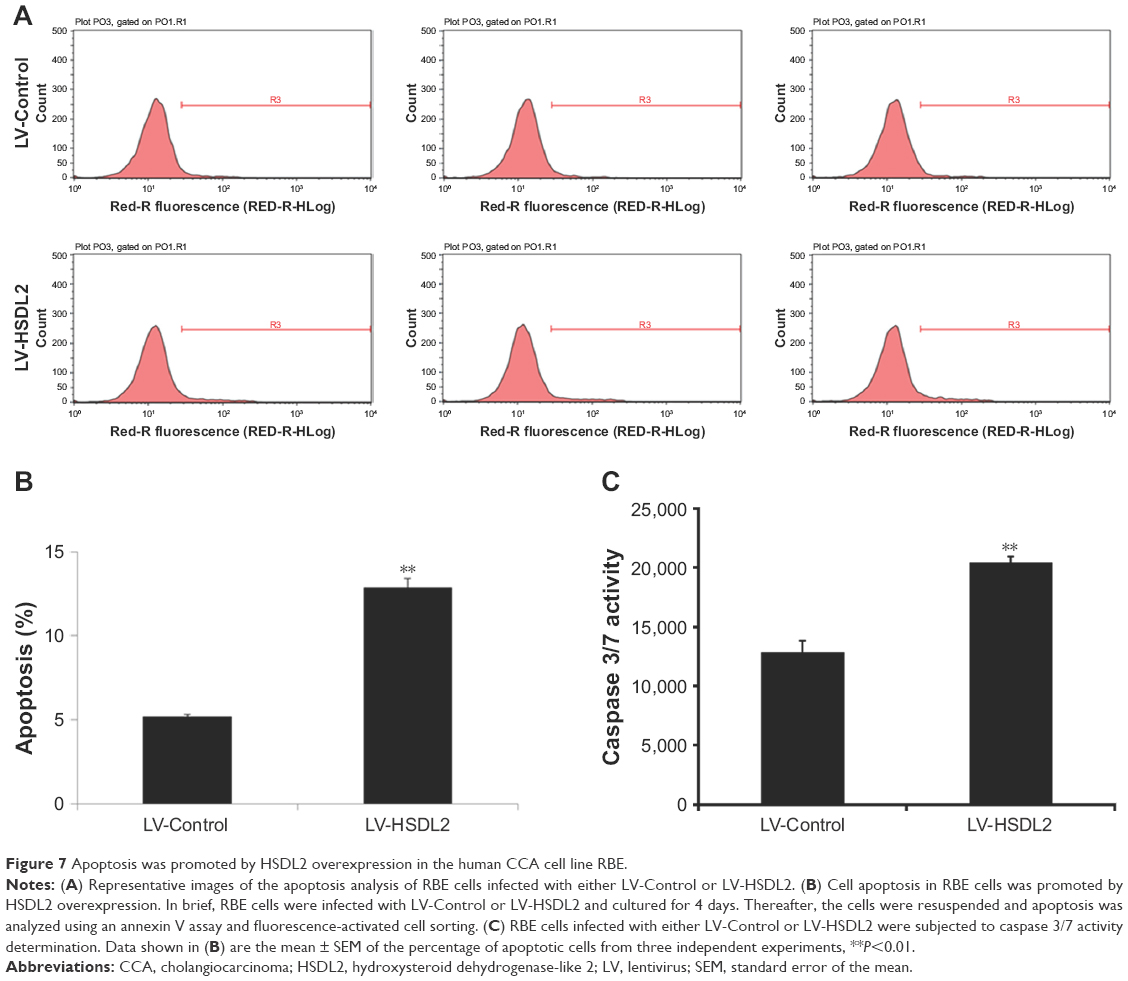 | Figure 7 Apoptosis was promoted by HSDL2 overexpression in the human CCA cell line RBE. |
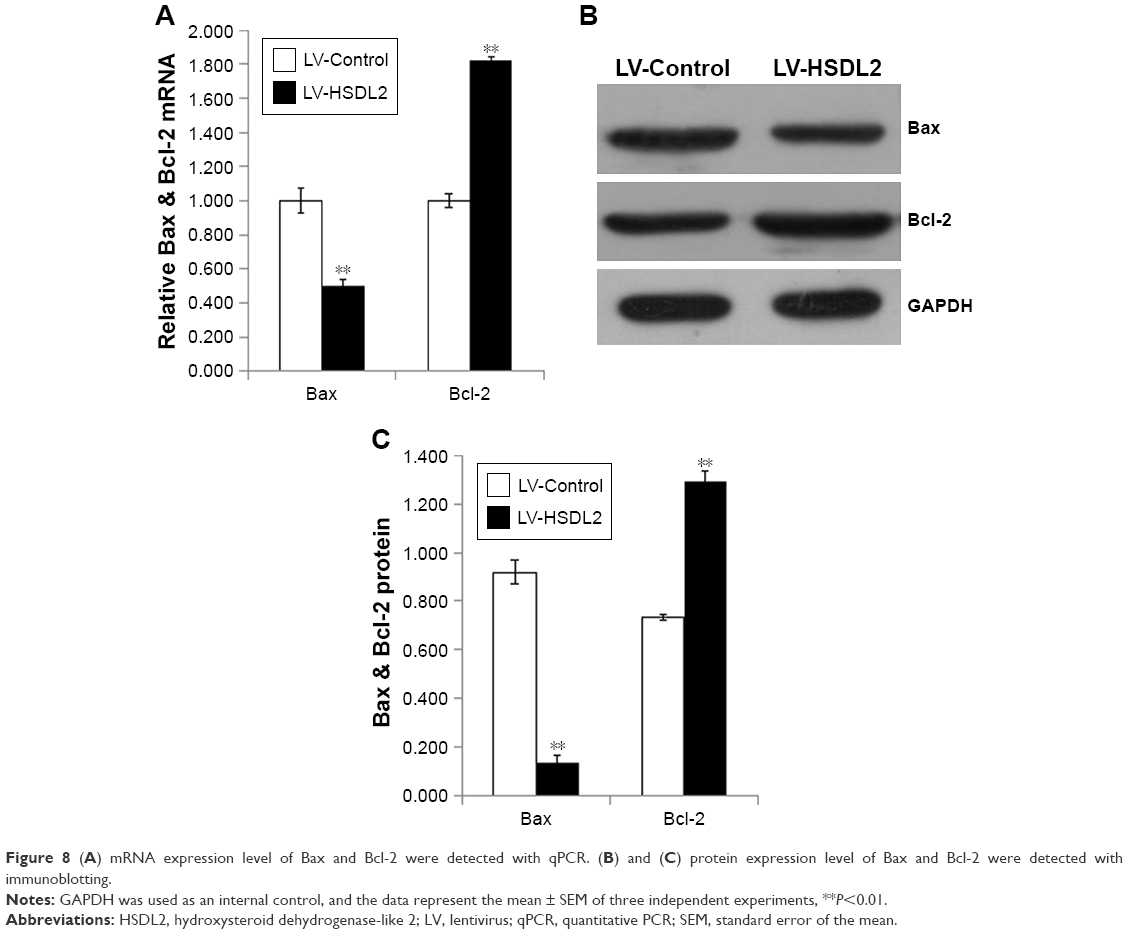 | Figure 8 (A) mRNA expression level of Bax and Bcl-2 were detected with qPCR. (B) and (C) protein expression level of Bax and Bcl-2 were detected with immunoblotting. |
Discussion
Peroxisomes are organelles that are surrounded by a single membrane and are found in almost all eukaryotic cells. They are implicated in a multitude of metabolic pathways, including fatty acid alpha- and beta-oxidation, ether-phospholipid biosynthesis, reactive oxygen metabolism, and acetaldehyde detoxification.20 HSDL2 is widely expressed in human tissues, with relatively high expression levels in the liver, kidneys, prostate, testicles, and ovaries.21 HSDL2 has been reported to localize to peroxisomes in human, mouse, and rat cells.20,27 HSDL2 is composed of N-terminal catalytic and C-terminal SCP-2 domains, and it is specifically targeted to peroxisomes via a C-terminal PTS1, where it is likely to be involved in peroxisomal oxidation of fatty acids.28 Also, peroxisomes are central to lipid metabolism.29 In addition, it was reported that cell proliferation could be suppressed by silencing of HSDL2 in gliomas.30 However, the relationship between HSDL2 and CCA has never been reported before.
In this paper, we demonstrated that HSDL2 was critical for CCA cell survival. Downregulated HSDL2 in CCA tissues was found in silico. In vitro, we overexpressed HSDL2 in RBE cells (a CCA cell line), and the results showed that HSDL2 overexpression suppressed RBE cell proliferation. This indicated that the survival of CCA cells was closely related to HSDL2 expression. Moreover, apoptosis was induced by HSDL2 overexpression, partially explaining why RBE cell viability was decreased after overexpressing HSDL2. Further studies should focus on the effect of HSDL2 regarding the synthesis of peroxidase and ether lipids to provide more information on the molecular mechanisms of HSDL2-associated CCA.
Conclusion
The results of the data analysis indicated that HSDL2 was downregulated in CCA tissues compared to adjacent tissues, and overexpressed HSDL2 suppressed growth and proliferation while activating apoptosis in CCA cells. This has significant implications for the understanding of the underlying HSDL2-related molecular mechanisms in the process of CCA.
Acknowledgments
This study was supported by the Key Research and Development Plan of Anhui Province, People’s Republic of China (1604a0802088), Anhui Province Science Foundation for Youths (1808085QH288), University top-notch talent cultivation project (gxbjZD28), and Bengbu Medical College Science Foundation (BYKJ1734ZD).
Disclosure
The authors report no conflicts of interest in this work.
References
Lim JH. Cholangiocarcinoma: morphologic classification according to growth pattern and imaging findings. AJR Am J Roentgenol. 2003;181(3):819–827. | ||
Razumilava N, Gores GJ. Cholangiocarcinoma. Lancet. 2014;383(9935):2168–2179. | ||
Nakanuma Y, Sato Y, Harada K, Sasaki M, Xu J, Ikeda H. Pathological classification of intrahepatic cholangiocarcinoma based on a new concept. World J Hepatol. 2010;2(12):419–427. | ||
Komuta M, Govaere O, Vandecaveye V, et al. Histological diversity in cholangiocellular carcinoma reflects the different cholangiocyte phenotypes. Hepatology. 2012;55(6):1876–1888. | ||
Roskams T. Liver stem cells and their implication in hepatocellular and cholangiocarcinoma. Oncogene. 2006;25(27):3818–3822. | ||
Welzel TM, Mellemkjaer L, Gloria G, et al. Risk factors for intrahepatic cholangiocarcinoma in a low-risk population: a nationwide case-control study. Int J Cancer. 2007;120(3):638–641. | ||
Donato F, Gelatti U, Tagger A, et al. Intrahepatic cholangiocarcinoma and hepatitis C and B virus infection, alcohol intake, and hepatolithiasis: a case-control study in Italy. Cancer Causes Control. 2001;12(10):959–964. | ||
El-Serag HB, Engels EA, Landgren O, et al. Risk of hepatobiliary and pancreatic cancers after hepatitis C virus infection: a population-based study of U.S. veterans. Hepatology. 2009;49(1):116–123. | ||
Shaib YH, El-Serag HB, Davila JA, Morgan R, McGlynn KA. Risk factors of intrahepatic cholangiocarcinoma in the United States: a case-control study. Gastroenterology. 2005;128(3):620–626. | ||
Lee TY, Lee SS, Jung SW, et al. Hepatitis B virus infection and intrahepatic cholangiocarcinoma in Korea: a case-control study. Am J Gastroenterol. 2008;103(7):1716–1720. | ||
Zhou YM, Yin ZF, Yang JM, et al. Risk factors for intrahepatic cholangiocarcinoma: a case-control study in China. World J Gastroenterol. 2008;14(4):632–635. | ||
Sekiya S, Suzuki A. Intrahepatic cholangiocarcinoma can arise from Notch-mediated conversion of hepatocytes. J Clin Invest. 2012;122(11):3914–3918. | ||
Tyson GL, El-Serag HB. Risk factors for cholangiocarcinoma. Hepatology. 2011;54(1):173–184. | ||
Welzel TM, Graubard BI, El-Serag HB, et al. Risk factors for intrahepatic and extrahepatic cholangiocarcinoma in the United States: a population-based case-control study. Clin Gastroenterol Hepatol. 2007;5(10):1221–1228. | ||
Welzel TM, Graubard BI, Zeuzem S, El-Serag HB, Davila JA, McGlynn KA. Metabolic syndrome increases the risk of primary liver cancer in the United States: a study in the SEER-Medicare database. Hepatology. 2011;54(2):463–471. | ||
Albert DH, Anderson CE. Ether-linked glycerolipids in human brain tumors. Lipids. 1977;12(2):188–192. | ||
Howard BV, Morris HP, Bailey JM. Ether-lipids, -glycerol phosphate dehydrogenase, and growth rate in tumors and cultured cells. Cancer Res. 1972;32(7):1533–1538. | ||
Roos DS, Choppin PW. Tumorigenicity of cell lines with altered lipid composition. Proc Natl Acad Sci U S A. 1984;81(23):7622–7626. | ||
Snyder F, Wood R. Alkyl and alk-1-enyl ethers of glycerol in lipids from normal and neoplastic human tissues. Cancer Res. 1969;29(1):251–257. | ||
Gronemeyer T, Wiese S, Ofman R, et al. The proteome of human liver peroxisomes: identification of five new peroxisomal constituents by a label-free quantitative proteomics survey. PLoS One. 2013;8(2):e57395. | ||
Dai J, Xie Y, Wu Q, et al. Molecular cloning and characterization of a novel human hydroxysteroid dehydrogenase-like 2 (HSDL2) cDNA from fetal brain. Biochem Genet. 2003;41(5–6):165–174. | ||
Kowalik D, Haller F, Adamski J, Moeller G. In search for function of two human orphan SDR enzymes: hydroxysteroid dehydrogenase like 2 (HSDL2) and short-chain dehydrogenase/reductase-orphan (SDR-O). J Steroid Biochem Mol Biol. 2009;117(4–5):117–124. | ||
Barrett T, Wilhite SE, Ledoux P, et al. NCBI GEO: archive for functional genomics data sets – update. Nucleic Acids Res. 2013;41(Database issue):D991–D995. | ||
Smedley D, Haider S, Durinck S, et al. The BioMart community portal: an innovative alternative to large, centralized data repositories. Nucleic Acids Res. 2015;43(W1):W589–W598. | ||
Kinsella RJ, Kähäri A, Haider S, et al. Ensembl BioMarts: a hub for data retrieval across taxonomic space. Database (Oxford). 2011;2011:bar030. | ||
Ritchie ME, Phipson B, Wu D, et al. limma powers differential expression analyses for RNA-sequencing and microarray studies. Nucleic Acids Res. 2015;43(7):e47. | ||
Keller GA, Scallen TJ, Clarke D, Maher PA, Krisans SK, Singer SJ. Subcellular localization of sterol carrier protein-2 in rat hepatocytes: its primary localization to peroxisomes. J Cell Biol. 1989;108(4):1353–1361. | ||
Cheng Z, Li Y, Sui C, Sun X, Xie Y. Synthesis, purification and crystallographic studies of the C-terminal sterol carrier protein type 2 (SCP-2) domain of human hydroxysteroid dehydrogenase-like protein 2. Acta Crystallogr F Struct Biol Commun. 2015;71(Pt 7):901–905. | ||
Di Cara F, Sheshachalam A, Braverman NE, Rachubinski RA, Simmonds AJ. Peroxisome-mediated metabolism is required for immune response to microbial infection. Immunity. 2017;47(1):93.e7–106.e7. | ||
Ruokun C, Yake X, Fengdong Y, Xinting W, Laijun S, Xianzhi L. Lentivirus-mediated silencing of HSDL2 suppresses cell proliferation in human gliomas. Tumour Biol. 2016;37(11):15065–15077. |
 © 2018 The Author(s). This work is published and licensed by Dove Medical Press Limited. The full terms of this license are available at https://www.dovepress.com/terms.php and incorporate the Creative Commons Attribution - Non Commercial (unported, v3.0) License.
By accessing the work you hereby accept the Terms. Non-commercial uses of the work are permitted without any further permission from Dove Medical Press Limited, provided the work is properly attributed. For permission for commercial use of this work, please see paragraphs 4.2 and 5 of our Terms.
© 2018 The Author(s). This work is published and licensed by Dove Medical Press Limited. The full terms of this license are available at https://www.dovepress.com/terms.php and incorporate the Creative Commons Attribution - Non Commercial (unported, v3.0) License.
By accessing the work you hereby accept the Terms. Non-commercial uses of the work are permitted without any further permission from Dove Medical Press Limited, provided the work is properly attributed. For permission for commercial use of this work, please see paragraphs 4.2 and 5 of our Terms.