")
Back to Journals » OncoTargets and Therapy » Volume 13
LEMD1-AS1 Suppresses Ovarian Cancer Progression Through Regulating miR-183-5p/TP53 Axis
Received 22 February 2020
Accepted for publication 30 June 2020
Published 28 July 2020 Volume 2020:13 Pages 7387—7398
DOI https://doi.org/10.2147/OTT.S250850
Checked for plagiarism Yes
Review by Single anonymous peer review
Peer reviewer comments 2
Editor who approved publication: Dr Leo Jen-Liang Su
Ruowen Guo, Yide Qin
Department of Biochemistry and Molecular Biology, School of Basic Medical Sciences, Anhui Medical University, Hefei, Anhui, 230032, People’s Republic of China
Correspondence: Yide Qin Email [email protected]
Background/Aims: Long noncoding RNAs (lncRNAs) play a critical role in tumorigenesis and progression of ovarian cancer (OC). This study focused on the function and potential mechanism toward LEMD1-AS1 (LEMD1 antisense RNA 1) in the progression of ovarian cancer.
Materials and Methods: The expression of LEMD1-AS1 in OC tissues was evaluated in TCGA and Gene Expression Omnibus datasets (GSE119056) and confirmed in OC cell lines via qRT-PCR (quantitative real-time polymerase chain reaction). Then, the location of LEMD1-AS1 in the cytoplasmic and nuclear RNAs extracted from OV cells was detected by qRT-PCR. Cell Counting Kit-8 (CCK-8), colony formation, wound-healing and transwell assays were applied to examine cell viability, proliferation, migration and invasion, respectively. Further, the effect of LEMD1-AS1 on OC tumor growth was determined via subcutaneous xenotransplanted tumor model. The potential target for LEMD1-AS1 was validated via dual-luciferase activity assay, RNA pull-down and RNA immunoprecipitation.
Results: The expression of LEMD1-AS1 was decreased in OC tissues and cell lines. Forced overexpression of LEMD1-AS1 inhibited the proliferation, migration and invasion of ovarian cancer cells and transplanted tumor growth in nude mice. We found that LEMD1-AS1 was mainly located in the cytoplasm of OC cells and contained complementary sites of miR-183-5p. Mechanistically, our results showed that LEMD1-AS1 could directly interact with miR-183-5p and tumor protein p53 (TP53). The anti-tumor role of LEMD1-AS1 on OC progression depended on miR-183-5p-mediated TP53 expression.
Conclusion: LEMD1-AS1 suppresses OC progression through sponging miR-183-5p and regulation of TP53, suggesting a novel biomarker and target for OC.
Keywords: LEMD1-AS1, long noncoding RNA, ovarian cancer, tumor progression, miR-183-5p, TP53
Introduction
Ovarian cancer is one of the most common gynecological malignancies. Due to the inconspicuous early symptoms and the lack of effective detection methods, ovarian cancer has the highest mortality rate among all gynecological malignancies.1,2 Thus, to explore novel targets and underlying molecular mechanism is essential for early diagnosis and treatment of ovarian cancer.
LncRNAs are non-coding RNAs that comprise more than 200 nucleotides.3,4 lncRNAs play important roles in many biological processes such as dose compensation effect, epigenetic regulation, cell cycle regulation and cell differentiation. Recent Studies have shown that lncRNAs were implicated in the progression of cancers. LncRNA UCA1 enhanced cell proliferation via modulating miR-206/PTP1B axis in breast cancer.5 LncRNA DSCAM-AS1 was increased and promoted cell migration and invasion of colorectal adenocarcinoma cells via inhibiting miR-216b.6 LncRNA TMPO-AS1 restrained cell apoptosis of osteosarcoma by increasing WNT7B expression via inhibition of miR-199a-5p.7 In addition, lncRNA TP73-AS1 promoted the proliferation and metastasis of ovarian cancer cells by regulating MMP2 and MMP9.8 Therefore, a deeper understanding of the function of novel lncRNAs will help to elucidate the mechanism of OC development.
LEMD1-AS1 is a recently identified lncRNA. So far, its role and mechanism in tumor have not been reported. In this study, we found that LEMD1-AS1 was significantly decreased in human OC. Downregulated LEMD1-AS1 was closely associated with low survival rate. Overexpressed LEMD1-AS1 inhibited the proliferation, migration and invasion ability whereas downregulated LEMD1-AS1 had the opposite effects. Moreover, we showed that overexpressed LEMD1-AS1 decreased miR-183-5p level in OC cells. Both bioinformatics analysis and luciferase reporter gene bioassay confirmed that LEMD1-AS1 could directly interact with miR-183-5p. We also demonstrated that LEMD1-AS1 inhibited the proliferation, migration and invasion of OC cells by regulating miR-183-5p. Furthermore, we confirmed that TP53 was a gene regulated by miR-183-5p and its expression was positively with LEMD1-AS1. Taken together, these results suggest that LEMD1-AS1 inhibits the proliferation, migration and invasion of ovarian cells through miR-183-5p/TP53 axis.
Materials and Methods
Patients and Tissue Samples
Fresh ovarian tumor tissues and normal ovarian tissues were collected from 30 patients undergoing surgical procedures in the First Affiliated Hospital of Anhui Medical University from June 2017 to March 2019. All samples were stored at −80°C for subsequent experiments. The study was approved by the Clinical Research Ethics Committee of the Anhui Medical University, and the informed written consent were obtained from all patients.
Cell Culture
All human ovarian cancer cell lines mentioned in the paper were obtained from the Cell Bank of the Chinese Academy of Sciences (Shanghai, China). All cells were grown in DMEM medium (Gibco) supplemented with 10% fetal bovine serum, 10 mg/mL streptomycin and 100 U/mL penicillin. Cells were maintained in a humidified atmosphere at 37°C with 5% CO2.
Cell Transfection
The LEMD1-AS1-overexpressing plasmid (pcDNA-LEMD1-AS1) and the empty vector were purchased from Shanghai Sangon Biotech Co., Ltd (Shanghai, China). siRNA targeting human TP53 (siTP53), siRNA control (si-Con), miR-183-5p mimic and negative control (miR-NC) were obtained from GenePharma Co., Ltd. (Shanghai, China). SKOV3 and OVCAR3 cells were transfected with siRNAs, miRNA or the plasmid vectors according to the manufacturer’s instructions.
Cell Viability Assay
Cell viability was determined by CCK-8 method. SKOV3 and OVCAR3 cells were seeded with 4x10³ cells/well into 96-well plates. For 24hrs, 48hrs and 72hrs after designed treatment, cells were added 10 μL CCK-8 solution and incubated for 2hrs. Absorbance at 450 nm was measured using a microplate reader (BIO-RAD, Hercules, CA, USA) for assessing cell viability. All experiments were repeated three times.
Colony Formation Assay
Colony formation assay was performed according to the previous experimental scheme.9 48 hrs after transfection, 1x10³ cells were seeded into 6-well plate, and cultured for 2 weeks. Colonies were counted with a microscope. All experiments were repeated three times.
Western Blot Assay
In brief, cells were lysed in RIPA buffer to obtain cell lysates. Then, protein lysates were separated by SDS-PAGE and transferred to polyvinylidene difluoride membrane (PVDF). Then, PVDF membrane was incubated with diluted primary antibodies at 4°Covernight, followed by incubation with appropriate secondary antibody conjugated with horseradish peroxidase. Finally, enhanced chemiluminescence kit (Millipore, Waltham, MA, USA) was used to expose protein bands in a dark room using and densitometry analysis was performed.
Wound-Healing Assay
SKOV3 and OVCAR3 Cells were digested and seeded into six-well plates. When the cells were grown to almost complete confluence, scratches were created by a 200 µL sterile micropipette tip. Then, The cell debris was washed away, and the cells were cultured in DMEM medium for 24hrs. Meantime, the scratch area was recorded by inverted phase-contrast microscope and the width of the scratch was analyzed.
Cell Invasion Assay
Cell invasion assay was determined by transwell chamber (Corning, NY) incubated with a mixture of 10% Matrigel and 90% serum-free medium. A total of 5 × 10⁴ cells in 200µL serum-free DMEM medium were added into the inner chamber, and 600µL dulbecco modified Eagle medium with 10% FBS was added to the bottom of outer chamber, and cultured for 24hrs at 37°C. Then, the chamber was washed, fixed with 4% paraformaldehyde for 30mins, and stained with 0.1% crystal violet for 30mins. Next, the chamber was gently washed and swabbed to remove cells that had non crossed the membrane. Finally, the number of invasive cells was counted by inverted microscope. All experiments were carried out in three replicates.
Quantitative Real-Time PCR
Total RNA of tissue and cell specimens were extracted using Trizol reagent (Invitrogen, Carlsbad, USA), and then reverse transcribed to cDNA using the PrimeScript RT Reagent Kit (Takara, Japan). Gene expression was examined using SYBR Green PCR Kit (Takara, Japan). GAPDH was used as an internal reference. All primers were conducted by GenePharma (Shanghai, China). The sequences of the primers used in qRT-PCR were listed as follows:
GAPDH forward (5ʹ-3ʹ): ACAACTTTGGTATCGTGGAAGG,
GAPDH reverse (5ʹ-3ʹ): GCCATCACGCCACAGTTTC;
U6 forward (5ʹ-3ʹ): CTCGCTTCGGCAGCACA,
U6 reverse (5ʹ-3ʹ): AACGCTTCACGAATTTGCGT;
LEMD1-AS1 forward (5ʹ-3ʹ): AATGACCGCAATCCCAAGGT,
LEMD1-AS1 forward (5ʹ-3ʹ): GGTGACTAGCAGTGCGTGAT;
miR-183-5p forward (5ʹ-3ʹ): TATGGCACTGGTAGAATTCACT,
miR-183-5p reverse (5ʹ-3ʹ): ACGCTTCACGAATT TGCGT;
TP53 forward (5ʹ-3ʹ): GGCCCACTTCACCGTACTAA,
TP53 reverse (5ʹ-3ʹ): GTGGTTTCAAGGCCAGATGT.
RNA Isolation and Quantitation
Thermo Fisher BioReagents (Thermo Fisher Scientific) following the manufacturer’s instructions. qRT-PCR analysis was conducted to detect the location of LEMD1-AS1.
Luciferase Reporter Assays
For the LEMD1-AS1 luciferase reporter assay, we synthesized the LEMD1-AS1 fragment containing either predicted miR-183-5p binding site (LEMD1-AS1-WT) or the mutant fragment (LEMD1-AS1-MUT). The synthesized fragments were then inserted downstream of the luciferase reporter gene in the pmirGLO vector (Promega, Madison, WI, USA). For microRNA target gene luciferase reporter assays, The 3ʹ-untranslated region (UTR) of TP53 with predicted miR-183-5p binding sites or mutant sites was synthesized and inserted into the pmirGLO vector. The constructed vectors were cotransfected into cells with miR-183-5p mimic or miR-183-5p mimic control using Lipofectamine 3000 according to the manufactures’s instruction. Renilla and firefly luciferase activities were measured with the dual-Luciferase Reporter Assay System (Promega). Renilla luciferase activity was used as the normalized control and represented relative luciferase activity.
RNA Binding Protein Immunoprecipitation (RIP) Assay
RIP assay was carried out by a RIP Kit (Millipore, Bedford, MA, USA). The SKOV3 and OVCAR3 cells were lysed with RIP lysis buffer. The supernatant of the lysate samples was incubated with magnetic beads-antibody complex for 3hrs to achieve RNA binding protein immunoprecipitation. After incubation with proteinase K, RNAs in immunoprecipitation were purified and isolated. The obtained RNAs were examined with qRT-PCR method.
RNA Pull-Down Assay
Bio-labeled LEMD1-AS1 (Bio-LEMD1-AS1) and Bio-labeled negative control (Bio-NC) were purchased from Sangon (Shanghai, China). The SKOV3 and OVCAR3 cells were lysed and the lysates were incubated with Bio-LEMD1-AS1 or Bio-NC. Then, the RNA-RNA complex was conjugated with streptavidin magnetic beads. After elution, the level of miR-183-5p was examined using qRT-PCR.
In vivo Experiments
All the procedures of animal experiments were approved by the Institutional Animal Care and Use Committee of Anhui Medical University before operation. The animals used in this study were 4~6 weeks old, female BALB/c nude mice (Shanghai R&S Biotechnology Co, Ltd, China). SKOV3 cells transfected with LEMD1-AS1 or empty vector were resuspended in 100 μL PBS and subcutaneously injected into the flanks of mice (five mice per group). Tumor volume was measured once a week. Six weeks after injection, the mice were sacrificed and the tumor tissues were excised for further experiments.
Statistical Analysis
GraphPad Prism 8.0 software (GraphPad Software, San Diego, CA, USA) was used for statistical analysis. All data were presented as the mean ± standard deviation. Results were analyzed using Student’s t-test, or one- or two-way analysis of variance test. p < 0.05 was considered statistically significant. All experiments were repeated at least three times.
Results
LEMD1-AS1 is Significantly Downregulated in Ovarian Cancer Tissues and Cell Lines
First, we used the GEPIA (http://gepia.-cancer-pku.cn/index.html) to analyze the expression of LEMD1-AS1 in ovarian cancer and control tissues from TCGA database. The result showed that LEMD1-AS1 level was downregulated in OC tissues relative to that in control tissues (P < 0.05, Figure 1A). In addition, LEMD1-AS1 expression was inversely correlated with FIGO stage (Figure 1B). Prognostic analysis revealed that patients with low level of LEMD1-AS1 exhibited worse overall survival compared to those with high level of LEMD1-AS1 (P < 0.05, Figure 1C). Consistently, microarray data (GSE119056) from GEO database also confirmed that LEMD1-AS1 level in ovarian cancer tissues was decreased compared with normal ovarian tissues (P < 0.0001, Figure 1D). Further, qRT-PCR was performed to measure the expression of LEMD1-AS1 in 30 cases of ovarian cancer tissues and normal tissues. As shown in Figure 1E, LEMD1-AS1 was significantly down-regulated in ovarian cancer tissues compared to that in normal tissues (P<0.0001). Consistent with these findings, the expression of LEMD1-AS1 in ovarian cell lines was lower than that of normal human ovarian surface epithelial cell line (HOSE). SKOV3 and OVCAR3 cell lines showed the lowest LEMD1-AS1 levels, and thus were selected for subsequent study (Figure 1F). All these data indicate that LEMD1-AS1 is downregulated in OC.
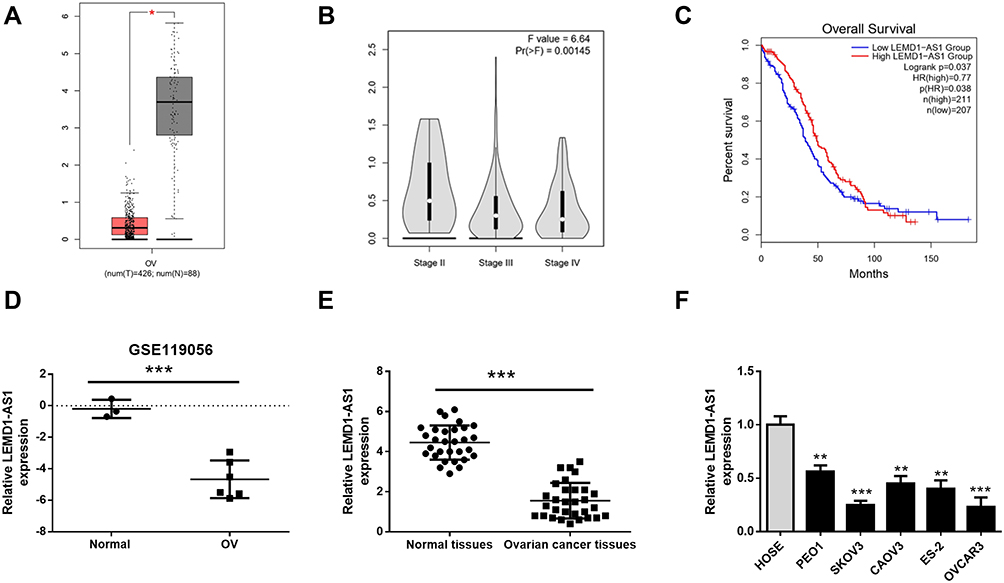 |
Figure 1 The expression of LEMD1-AS1 is low in ovarian cancer samples and cell lines. (A) The expressions of LEMD1-AS1 in ovarian cancer tissues (red box) and normal tissues (black box) from GEPIA. (B) Differential expression of LEMD1-AS1 in stage II, stage III and stage IV ovarian cancer. (C) The relationship between LEMD1-AS1 expression and overall survival (OS) of ovarian cancer patients based on the KM Plotter from GEPIA. (D) LEMD1-AS1 levels in ovarian cancer tissues and normal tissues from the GEO database (GSE119056). (E) Relative LEMD1-AS1 expression in 30 pairs of ovarian cancer tissues and non-tumor tissues were demonstrated using qRT-PCR. (F) Relative LEMD1-AS1 expression in HOSE cell line and ovarian cancer cell lines (PEO1, SKOV3, CAOV3, ES-2 and OVCAR3). *P < 0.05, **P < 0.01, ***P < 0.001. |
Overexpression of LEMD1-AS1 Inhibits OC Cell Proliferation, Migration and Invasion
To investigate the biological functions of LEMD1-AS1 in OC cell lines, SKOV3 and OVCAR3 cell lines were transfected with pcDNA-LEMD1-AS1, and the empty vector was used as a negative control. qRT-PCR analysis demonstrated that LEMD1-AS1 expression was upregulated in SKOV3 and OVCAR3 cells transfected with pcDNA-LEMD1-AS1 (Figure 2A). CCK-8 assay results showed that the cell viability was significantly decreased in SKOV3 and OVCAR3 cells transfected with pcDNA-LEMD1-AS1 compared with the vector group (Figure 2B and C). As demonstrated in colony formation assays, forced expression of LEMD1-AS1 led to a significant reduction in cell proliferative ability in SKOV3 and OVCAR3 cells compared to the control groups (Figure 2D). Moreover, wound-healing and transwell experiments revealed that overexpression of LEMD1-AS1 significantly inhibited the migration and invasive capacity of SKOV3 cells and OVCAR3 cell lines (Figure 2E and F). In conclusion, overexpression of LEMD1-AS1 suppressed the proliferation, migration, and invasion of ovarian cancer cells.
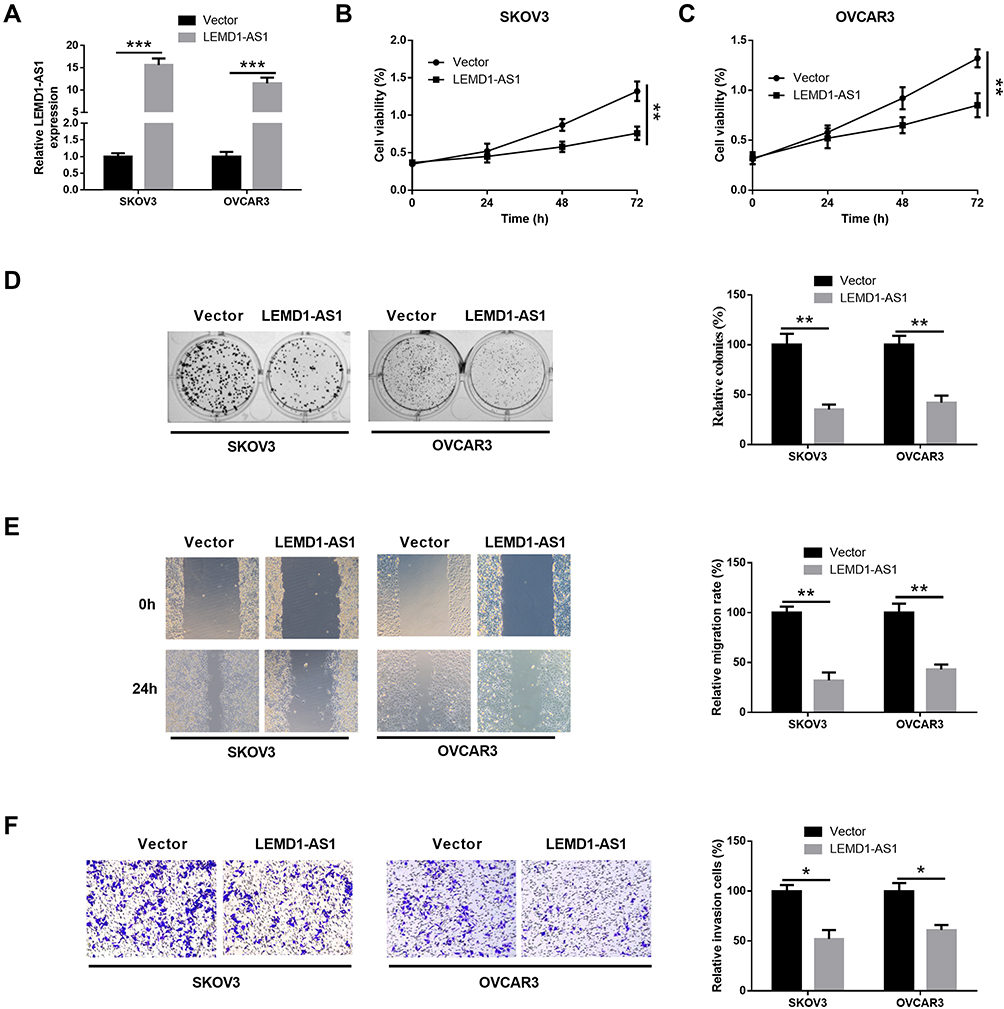 |
Figure 2 Overexpressed LEMD1-AS1 inhibits proliferation, migration and invasion in ovarian cancer cells. (A) SKOV3 and OVCAR3 cells were transfected with pcDNA-LEMD1-AS1 or control vector, and LEMD1-AS1 level was detected by qRT-PCR. The following indicators were then assessed in the SKOV3 and OVCAR3 cells transfected with control vector or pcDNA-LEMD-AS1: (B and C) cell viability, (D) colony formation assays, (E) cell migration, and (F) cell invasion. *P < 0.05, **P < 0.01, ***P < 0.001. |
LEMD1-AS1 Directly Interacts with miR-183-5p
To explore the intracellular location of LEMD1-AS1, qRT-PCR was performed to detect localization of LEMD1-AS1 in OC cells. Our data showed that LEMD1-AS1 mostly distributed in the cytoplasm (Figure 3A and B), suggesting that LEMD1-AS1 might act as a miRNA sponge to decoy miRNAs. Next, we investigated the potential lncRNA/miRNA interaction by DIANA tools (http://diana.imis.athena-innova tion.gr/DianaTools/index.php) and found complementary sites of miR-183-5p within LEMD1-AS1 sequence (Figure 3C). Further, luciferase reporter gene assay was performed to explore whether miR-183-5p could bind to LEMD1-AS1. As illustrated in Figure 3D and E, when co-transfected with LEMD1-AS1 (WT) luciferase reporter, the luciferase activity of miR-183-5p mimics group was markedly lower than that of the miR-NC group (P<0.01), whereas no significant differences were observed in the Luc activity in each group when co-transfected with LEMD1-AS1 (MUT) luciferase reporter. RNA pull-down results showed a significant increase of miR-183-5p enrichment in Bio-LEMD1-AS1 relative to Bio-probe NC (P < 0.05, Figure 3F). Moreover, RIP was conducted using antibody against Ago2, the key factor of RISC. As expected, LEMD1-AS1 and miR-183-5p were observed in the Ago2-containing precipitates (Figure 3G). Moreover, as showed in Figure 3H, the levels of miR-183-5p were decreased in SKOV3 and OVCAR3 cells after LEMD1-AS1 transfection. In addition, qRT-PCR was used to detect the LEMD1-AS1 and miR-183-5p expression in OC tissues, and analyze their correlation. The results showed that miR-183-5p expression was elevated in OC tissues compared with that in the control group (P < 0.001, Figure 3I), and miR-183-5p expression was negatively correlated with LEMD1-AS1 expression (r = −0.5552, P < 0.001, Figure 3J). Taken together, LEMD1-AS1 was directly bound to miR-183-5p in OC.
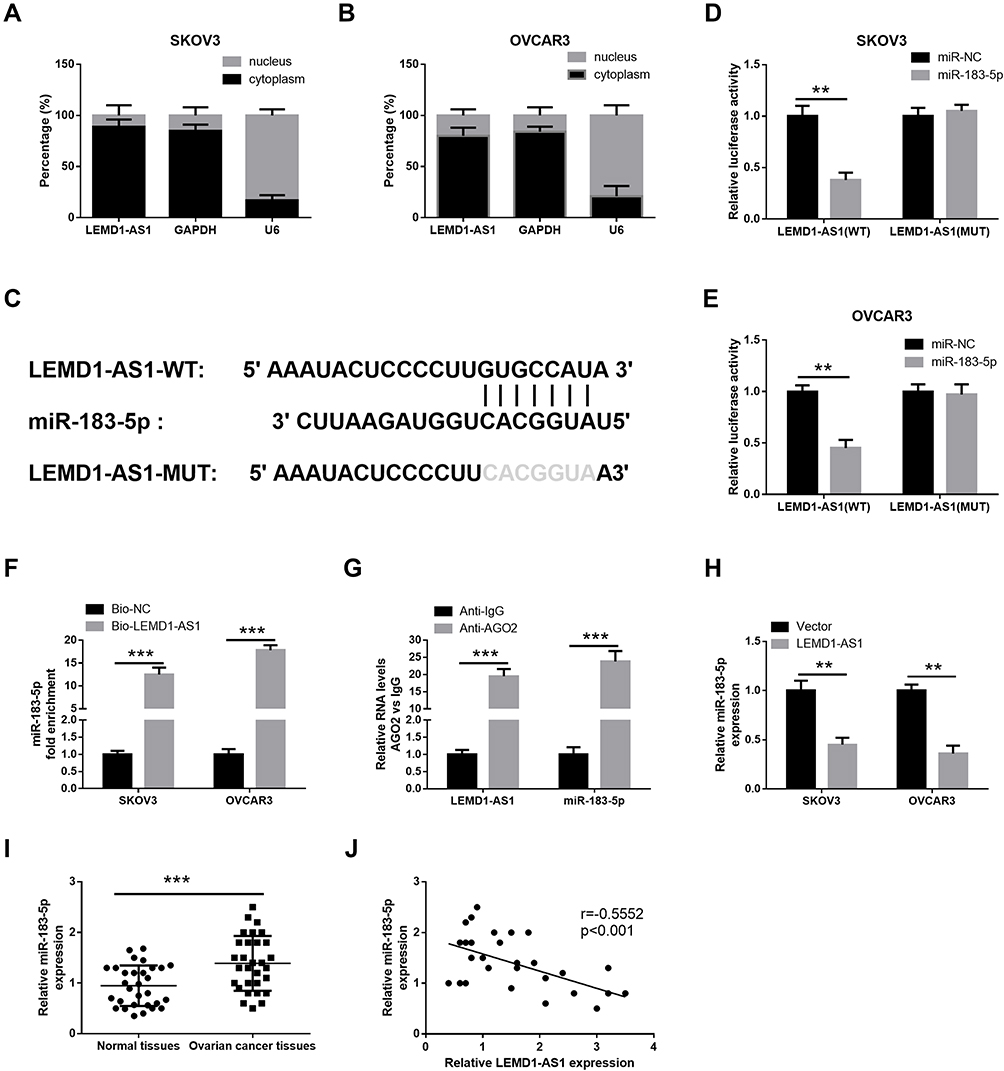 |
Figure 3 LEMD1-AS1 directly interacts with miR-183-5p. (A and B) The expression of LEMD1-AS1 in nuclear and cytoplasmic fractions were measured using qRT-PCR, U6 and GAPDH were used as nuclear and cytosolic loading controls, respectively. (C) The predicted binding sites of miR-183-5p within LEMD1-AS1 through DIANA tools. (D and E) Luciferase reporter assay of cells co-transfected with miR-183-5p mimics and luciferase reporter containing LEMD1-AS1 wild type (wt) or mutant construct (mut). (F) The binding relationship between LEMD1-AS1 and miR-183-5p confirmed by RNA pull-down assay. (G) The relative enrichment of LEMD1-AS1 and miR-183-5p with AGO2 determined by RIP assay. (H) Overexpressed LEMD1-AS1 inhibited miR-183-5p expression in SKOV3 and OVCAR3 cells. (I) The expression of miR-183-5p was examined by qRT-PCR in 30 cases of ovarian cancer and adjacent non-cancerous tissues. (J) Pearson correlation analysis of the association between miR-183-5p with LEMD1-AS1. **P < 0.01, ***P < 0.001. |
LEMD1-AS1 Regulates TP53 Expression via Sponging miR-183-5p
To investigate whether LEMD1-AS1 sponged miR-183-5p to regulate the expression of target genes, StarBase V 2.0 (http://starbase.sysu.edu.cn/) was used to identify the target genes of miR-183-5p and TP53 was predicted (Figure 4A). Luciferase reporter assay was performed and the luciferase activity of miR-183-5p group was significantly decreased when co-transfected with TP53-WT luciferase reporter, whereas there was no significant difference in luciferase activity in each group when co-transfected with TP53-MUT luciferase reporter (Figure 4B and C). To further verify LEMD1-AS1 regulates TP53 expression via sponging miR-183-5p, qRT-PCR and Western blot was used to detect the expression levels of TP53 mRNA and protein, respectively. The results showed that the levels of TP53 mRNA and TP53 protein in the LEMD1-AS1 group were significantly higher than that in the vector group, but the expression of TP53 mRNA and TP53 protein showed no significant differences between vector group and LEMD1-AS1+miR-183-5p group (Figure 4D and E). Subsequently, qRT-PCR analysis of specimens showed that the expression level of TP53 in OC tissues was significantly lower than that in adjacent normal tissues (P < 0.001, Figure 4F). TP53 expression was positively correlated with LEMD1-AS1 expression level (Figure 4G) but inversely correlated with miR-183-5p level in OC tissues (Figure 4H). Above all data indicate that LEMD1-AS1 regulates TP53 expression by sponging miR-183-5p.
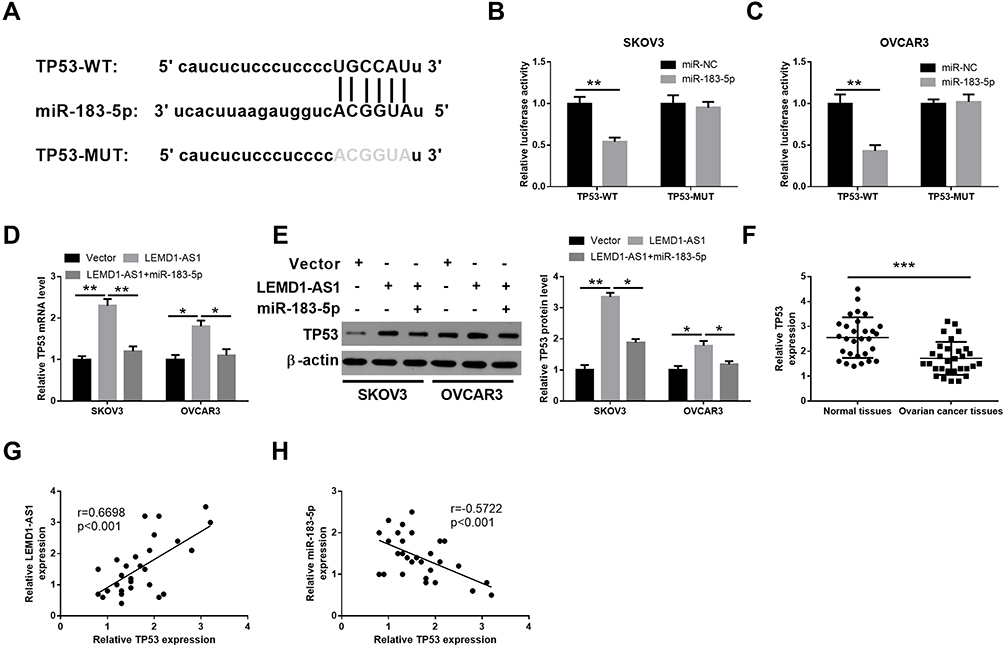 |
Figure 4 LEMD1-AS1 regulates TP53 expression via sponging miR-183-5p. (A) The putative binding sequence between TP53 and miR-183-5p predicted from StarBase. (B and C) The combination between miR-183-5p and TP53 was further validated by dual-luciferase reporter assay. (D and E) qRT-PCR and Western blot assays detected TP53 mRNA and protein expression after transfection with LEMD1-AS1 or cotransfection with LEMD1-AS1 and miR-183-5p mimics in SKOV3 and OVCAR3 cells. (F) The expression levels of TP53 in paired ovarian cancer and adjacent normal tissues from 30 patients (same samples as in Figure 1E) detected by qRT-PCR. (G and H) Pearson correlation analysis of the association between LEMD1-AS1/miR-183-5p with TP53. *P < 0.05, **P < 0.01, ***P < 0.001. |
miR-183-5p and TP53 are Responsible for LEMD1-AS1-Mediated Effects on OC Cells
To further verify the role of miR-183-5p and TP53 in LEMD1-AS1-mediated progression of OC, SKOV3 and OVCAR3 cells were co-transfected with pcDNA-LEMD1-AS1 and miR-183-5p mimics or siTP53. CCK8 and colony formation assays demonstrated that cell proliferation in both LEMD1-AS1+ miR-183-5p group and LEMD1-AS1+ siTP53 group was elevated compared with the LEMD1-AS1group (Figure 5A–C). Moreover, miR-183-5p restoration and TP53 knockdown partially reversed LEMD1-AS1 overexpressing-induced inhibitory effects on the migration and invasion potential of OC cells (Figure 5D–E). Taken together, miR-183-5p and TP53 participated in LEMD1-AS1-induced OC progression.
 |
Figure 5 Over-expression of LEMD1-AS1 regulates TP53 expression and inhibits ovarian cancer cells activities by targeting miR-183-5p. (A and B) Cell viability in SKOV3 and OVCAR3 cells with the transfection of vector, LEMD1-AS1, LEMD1-AS1+ miR-183-5p mimics, LEMD1-AS1+ siTP53 was detected by CCK-8 assay. (C) Colony formation assay in SKOV3 and OVCAR3 cells with the transfection of vector, LEMD1-AS1, LEMD1-AS1+ miR-183-5p mimics, LEMD1-AS1+ siTP53. (D) Cell migration ability in SKOV3 and OVCAR3 cells with the transfection of vector, LEMD1-AS1, LEMD1-AS1+ miR-183-5p mimics, LEMD1-AS1+ siTP53 detected by wound-healing assay. (E) Cell invasion ability in SKOV3 and OVCAR3 cells with the transfection of vector, LEMD1-AS1, LEMD1-AS1+ miR-183-5p mimics, LEMD1-AS1+ siTP53 detected by transwell with matrigel. *P < 0.05, **P < 0.01. |
LEMD1-AS1 Suppresses the Growth of Ovarian Cancer in vivo
To investigate whether overexpression of LEMD1-AS1 regulates tumor growth in vivo, SKOV3 cells stably transfected with LEMD1-AS1 or control vector were injected subcutaneously into BALB/c nude mice. Tumor volumes were measured weekly after injection. After 6 weeks, the mice were killed and the tumors were excised for qRT-PCR and Western blot analysis. Compared with the control group, the LEMD1-AS1 overexpression group exhibited significantly reduced the growth rate and tumor weight (Figure 6A–C). Additionally, compared with the control group, upregulated LEMD1-AS1 and downregulated miR-183-5p and TP53 were observed in the LEMD1-AS1 overexpression group performed by qRT-PCR results (Figure 6D). Western blot analysis also showed that the protein level of TP53 was decreased in the over-expressing LEMD1-AS1 group relative to the control group (Figure 6E). These results demonstrate that upregulated LEMD1-AS1 efficiently suppresses the growth of ovarian cancer in vivo.
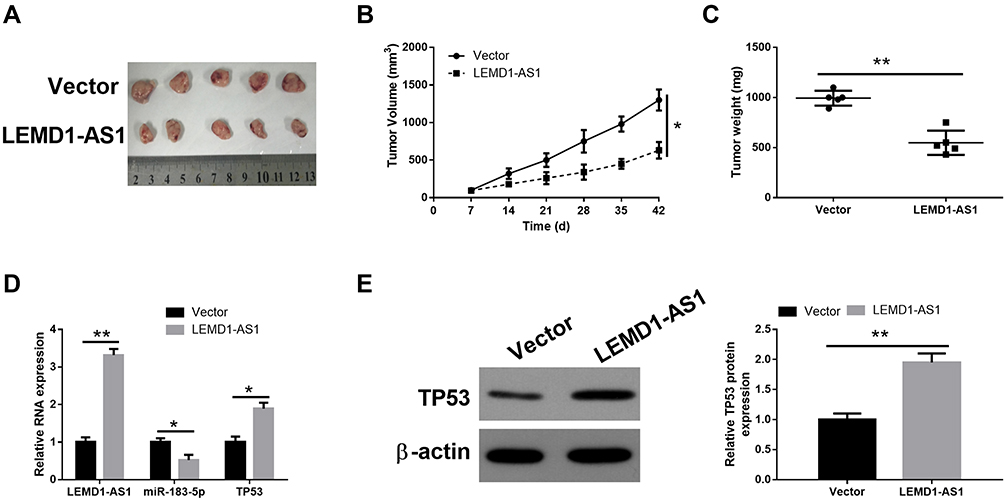 |
Figure 6 LEMD1-AS1 suppresses the growth of ovarian cancer tumor in vivo. (A) The subcutaneous tumors were taken photos in mock or LEMD1-AS1 groups. (B) Tumor volume was measured weekly. (C) The subcutaneous tumors were weighted in vector and LEMD1-AS1 groups. (D) The levels of LEMD1-AS1, miR-183-5p and TP53 in tumor tissues were measured by qRT-PCR. (E) The protein expression of TP53 was measured using Western blot in the xenografts. *P < 0.05, **P < 0.01. |
Discussion
LncRNAs, generated from genes, have been identified as biomarkers or regulators in multiple cancers.10–12 Large number of lncRNAs have been shown to play vital roles in occurrence and progression of OC. For instance, downregulated lncRNA PCAT-1 inhibits the progression of ovarian cancer cells through miRNA-124-3p.13 LncRNA PCAT6 promotes occurrence and development of ovarian cancer by inhibiting PTEN.14 LncRNA AB209371 increases survivin expression by targeting miR-203 in ovarian carcinoma.15 LncRNA HAND2-AS1 exerts anti-oncogenic effect on ovarian cancer via enhancing BCL2L11 expression as a sponge of microRNA-340-5p.16 However, the functional role as well as the mechanism about LEMD1-AS1 in OC remain largely unknown. In this study, we investigated the expression level of LEMD1-AS1 in OC, and then elucidated the anti-oncogenic role of LEMD1-AS1 and explored the underlying mechanism.
Firstly, one of the major findings of the present study is that a novel down-regulated lncRNA in OC, LEMD1-AS1, was identified in microarray dataset GSE119056 from Gene Expression Omnibus database as well as OC tissues and cell lines. Kaplan-Meier survival analysis demonstrated shorter OS in patients with low expression of LEMD1-AS1, which was consistent with the previous report.17 Other than function as potential prognosis biomarkers for OC, lncRNAs have also been shown to be associated with the carcinogenesis and aggressive behavior of OC.18 Here, in vitro functional assays revealed that overexpression of LEMD1-AS1 suppressed cell viability, proliferation, migration and invasion of OC cells. Moreover, in vivo subcutaneous xenotransplanted tumor model also indicated that overexpressed LEMD1-AS1 could suppress OC tumor growth, suggesting that LEMD1-AS1 might be a potential novel target for OC therapy.
Previous studies have revealed that lncRNAs serve as miRNAs spongers in implication in OC.19–21 miRNAs could be putative oncogenic or tumor-suppressive factors by acting as key modulators of gene expression, and are important targets of lncRNAs.22,23 The putative miRNA targets of LEMD1-AS1 were then investigated in the present study. By the means of dual-luciferase reporter assay, RNA pull down and RIP, miR-183-5p was validated as the direct binding target of LEMD1-AS1. In previous studies, mir-183-5p exerts an oncogenic function in several cancers and functions as a tumor suppressor in some cancers, which may be related to its different targets and mechanisms depending on the physiological circumstances and cell type.24,25 Recently, miR-183-5p was shown to be a potential prognostic biomarker and related to platinum resistance in ovarian cancer.26,27 In the present study, we found that miR-183-5p was upregulated in ovarian cancer tissues and negatively correlated with LEMD1-AS1 expression. Further functional assays revealed that miR-183-5p was responsible for TP53 expression and LEMD1-AS1mediated effects on OC cells. These findings not only shed light on the mechanism of LEMD1-AS1 but also provided a better understanding of the action mode of miR-183-5p in ovarian cancer.
Finally, another important finding of this study is that TP53 was identified as the direct target of miR-183-5p and involved in the LEMD1-AS1-mediated effect on OC. TP53 is a well-known tumor suppressor that induces growth arrest or apoptosis and involved in cell cycle regulation.28 TP53 is downregulated in many types of tumors including non-small cell lung cancer, colorectal cancer, cervical cancer and ovarian cancer,29–34 which can lead to a poor survival rate. Our results showed that TP53 was downregulated in OC tissues, and could be decreased by miR-183-5p mimics and restored by overexpressed LEMD1-AS1, respectively. Collectively, the present findings revealed the essential roles of the LEMD1-AS1/miR-183-5p/TP53 axis on the regulation of OC progression.
In conclusion, our results illustrated that LEMD1-AS1 could inhibit ovarian cancer progression through regulating miR-183-5p/TP53 axis, providing novel and promising targets for the diagnosis and treatment of OC.
Abbreviations
LncRNAs, long noncoding RNAs; OC, ovarian cancer; LEMD1-AS1, LEMD1 antisense RNA 1; qRT-PCR, quantitative real-time polymerase chain reaction; HOSE, human ovarian surface epithelial; siTP53, siRNA targeting TP53; si-Con, siRNA control; pcDNA- LEMD1-AS1, pcDNA3.1 containing LEMD1-AS1 plasmid; GEPIA, Gene expression profiling interactive analysis.
Data Sharing Statement
The datasets used and/or analyzed during this study are available from the corresponding author on reasonable request.
Ethics Approval and Consent to Participate
The study was approved by the Clinical Research Ethics Committee of the Anhui Medical University (approval number: 2017-29, date: 20170512), and the informed consent and written approvals were obtained from all of the patients.
All the animals in this study were treated according to the guidelines for the welfare and use of animals in cancer research35 and with the approval of the Institutional Animal Care and Use Committee of Anhui Medical University (approval number 2017-135, date: 20171123).
Disclosure
The authors report no conflicts of interest in this work.
References
1. Szajnik M, Czystowska-Kuzmicz M, Elishaev E, Whiteside TL. Biological markers of prognosis, response to therapy and outcome in ovarian carcinoma. Expert Rev Mol Diagn. 2016;16:811–826. doi:10.1080/14737159.2016.1194758
2. Cortez AJ, Tudrej P, Kujawa KA, Lisowska KM. Advances in ovarian cancer therapy. Cancer Chemother Pharmacol. 2018;81(1):17–38.
3. Mercer TR, Dinger ME, Mattick JS. Long non-coding RNAs: insights into functions. Nat Rev Genet. 2009;10(3):155–159. doi:10.1038/nrg2521
4. Wang KC, Chang HY. Molecular mechanisms of long noncoding RNAs. Mol Cell. 2011;43:904–914.
5. Li Y, Zeng Q, Qiu J, Pang T, Xian J, Zhang X. Long non-coding RNA uca1 promotes breast cancer by upregulating ptp1b expression via inhibiting mir-206. Cancer Cell Int. 2019;19:275. doi:10.1186/s12935-019-0958-z
6. Liu F, Jia J, Sun L. lncRNA dscam-as1 downregulates mir-216b to promote the migration and invasion of colorectal adenocarcinoma cells. Onco Targets Ther. 2019;12:6789–6795. doi:10.2147/OTT.S213301
7. Cui H, Zhao J. Lncrna tmpo-as1 serves as a cerna to promote osteosarcoma tumorigenesis by regulating mir-199a-5p/wnt7b axis. J Cell Biochem. 2019.
8. Wang X, Yang B, She Y, Ye Y. The lncrna tp73-as1 promotes ovarian cancer cell proliferation and metastasis via modulation of mmp2 and mmp9. J Cell Biochem. 2018;119:7790–7799. doi:10.1002/jcb.27158
9. Wang Y, Yang L, Chen T, et al. A novel lncrna mcm3ap-as1 promotes the growth of hepatocellular carcinoma by targeting mir-194-5p/foxa1 axis. Mol Cancer. 2019;18:28. doi:10.1186/s12943-019-0957-7
10. Yang G, Lu X, Yuan L. Lncrna: A link between RNA and cancer. Biochim Biophys Acta Gene Regul Mech. 2014;1839:1097–1109.
11. Chang L, Guo R, Yuan Z, Shi H, Zhang D. Lncrna hot air regulates ccnd1 and ccnd2 expression by sponging mir-206 in ovarian cancer. Cell Physiol Biochem. 2018;49(4):1289–1303. doi:10.1159/000493408
12. Jiao H, Jiang S, Wang H, Li Y, Zhang W. Upregulation of linc00963 facilitates melanoma progression through mir-608/nacc1 pathway and predicts poor prognosis. Biochem Biophys Res Commun. 2018;504(1):34–39. doi:10.1016/j.bbrc.2018.08.115
13. Min F, Chu G. Long noncoding RNA pcat-1 knockdown prevents the development of ovarian cancer cells via microRNA-124-3p. J Cell Biochem. 2019.
14. Kong F-R, Lv Y-H, Yao H-M, Zhang H-Y, Zhou Y, Liu S-E. Lncrna pcat6 promotes occurrence and development of ovarian cancer by inhibiting pten. Eur Rev Med Pharmacol Sci. 2019;23:8230–8238. doi:10.26355/eurrev_201910_19132
15. Zheng Z-H, Wu D-M, Fan S-H. Lncrna ab209371 up-regulated survivin gene by down-regulating mir-203 in ovarian carcinoma. J Ovarian Res. 2019;12:92. doi:10.1186/s13048-019-0559-4
16. Chen J, Lin Y, Jia Y, Xu T, Wu F, Jin Y. Lncrna hand2-as1 exerts anti-oncogenic effects on ovarian cancer via restoration of bcl2l11 as a sponge of microRNA-340-5p. J Cell Physiol. 2019;234:23421–23436. doi:10.1002/jcp.28911
17. Zheng M, Hu Y, Gou R, et al. Identification three lncrna prognostic signature of ovarian cancer based on genome-wide copy number variation. Biomed Pharmacother. 2020;124:109810. doi:10.1016/j.biopha.2019.109810
18. Zeng XY, Jiang XY, Yong JH, et al. Lncrna abhd11-as1, regulated by the egfr pathway, contributes to the ovarian cancer tumorigenesis by epigenetically suppressing timp2. Cancer Med. 2019;8(16):7074–7085.
19. Lin X, Yang F, Qi X. Lncrna dancr promotes tumor growth and angiogenesis in ovarian cancer through direct targeting of mir-145. Mol Carcinog. 2019;58:2286–2296. doi:10.1002/mc.23117
20. Shang A, Wang W, Gu C. Long non-coding RNA hot tip enhances il-6 expression to potentiate immune escape of ovarian cancer cells by upregulating the expression of pd-l1 in neutrophils. J Exp Clin Cancer Res. 2019;38:411. doi:10.1186/s13046-019-1394-6
21. Zhou Y, Zheng X, Xu B, Hu W, Huang T, Jiang J. The identification and analysis of mRNA-lncrna-mirna cliques from the integrative network of ovarian cancer. Front Genet. 2019;10:751. doi:10.3389/fgene.2019.00751
22. Yan H, Li H, Silva MA. Lncrna flvcr1-as1 mediates mir-513/yap1 signaling to promote cell progression, migration, invasion and EMT process in ovarian cancer. J Exp Clin Cancer Res. 2019;38:356. doi:10.1186/s13046-019-1356-z
23. You Q, Shi H-Y, Gong C-F, Tian X-Y, Li S. Long non-coding RNA dlx6-as1 acts as an oncogene by targeting mir-613 in ovarian cancer. Eur Rev Med Pharmacol Sci. 2019;23:6429–6435. doi:10.26355/eurrev_201908_18524
24. Wang H, Ma Z, Liu X, et al. Mir-183-5p is required for non-small cell lung cancer progression by repressing pten. Biomed Pharmacother. 2019;111:1103–1111. doi:10.1016/j.biopha.2018.12.115
25. Zheng Z, Zheng X, Zhu Y, et al. Mir-183-5p inhibits occurrence and progression of acute myeloid leukemia via targeting erbin. Mol Ther. 2019;27:542–558. doi:10.1016/j.ymthe.2019.01.016
26. Wang L, Zhu MJ, Ren AM, et al. A ten-microRNA signature identified from a genome-wide microRNA expression profiling in human epithelial ovarian cancer. PLoS One. 2014;9:e96472. doi:10.1371/journal.pone.0096472
27. Qi X, Yu C, Wang Y, Lin Y, Shen B. Network vulnerability-based and knowledge-guided identification of microRNA biomarkers indicating platinum resistance in high-grade serous ovarian cancer. Clin Transl Med. 2019;8:28. doi:10.1186/s40169-019-0245-6
28. Aubrey BJ, Strasser A, Kelly GL. Tumor-suppressor functions of the tp53 pathway. Cold Spring Harb Perspect Med. 2016;6(5):a026062. doi:10.1101/cshperspect.a026062
29. Zheng Z-H, Wu D-M, Fan S-H, Zhang Z-F, Chen G-Q, Lu J. Upregulation of mir-675-5p induced by lncrna h19 was associated with tumor progression and development by targeting tumor suppressor p53 in non-small cell lung cancer. J Cell Biochem. 2019;120:18724–18735. doi:10.1002/jcb.29182
30. Zhang T, Li Y, Zhu R, et al. Transcription factor p53 suppresses tumor growth by prompting pyroptosis in non-small-cell lung cancer. Oxid Med Cell Longev. 2019;2019:8746895.
31. Cen B, Lang JD, Du Y, et al. Prostaglandin e2 induces mir675-5p to promote colorectal tumor metastasis via modulation of p53 expression. Gastroenterology. 2019.
32. Zhang Y, Na R, Wang X. Lncrna wt1-as up-regulates p53 to inhibit the proliferation of cervical squamous carcinoma cells. BMC Cancer. 2019;19:1052. doi:10.1186/s12885-019-6264-2
33. Han CY, Patten DA, Lee SG. P53 promotes chemoresponsiveness by regulating hexokinase ii gene transcription and metabolic reprogramming in epithelial ovarian cancer. Mol Carcinog. 2019;58:2161–2174. doi:10.1002/mc.23106
34. Parra-Herran C, Bassiouny D, Lerner-Ellis J. P53, mismatch repair protein, and pole abnormalities in ovarian clear cell carcinoma: an outcome-based clinicopathologic analysis. Am J Surg Pathol. 2019;43:1591–1599. doi:10.1097/PAS.0000000000001328
35. Workman P, Aboagye EO, Balkwill F, et al. Committee of the National Cancer Research I. Guidelines for the welfare and use of animals in cancer research. Br J Cancer. 2010;102:1555–1577. doi:10.1038/sj.bjc.6605642
 © 2020 The Author(s). This work is published and licensed by Dove Medical Press Limited. The full terms of this license are available at https://www.dovepress.com/terms.php and incorporate the Creative Commons Attribution - Non Commercial (unported, v3.0) License.
By accessing the work you hereby accept the Terms. Non-commercial uses of the work are permitted without any further permission from Dove Medical Press Limited, provided the work is properly attributed. For permission for commercial use of this work, please see paragraphs 4.2 and 5 of our Terms.
© 2020 The Author(s). This work is published and licensed by Dove Medical Press Limited. The full terms of this license are available at https://www.dovepress.com/terms.php and incorporate the Creative Commons Attribution - Non Commercial (unported, v3.0) License.
By accessing the work you hereby accept the Terms. Non-commercial uses of the work are permitted without any further permission from Dove Medical Press Limited, provided the work is properly attributed. For permission for commercial use of this work, please see paragraphs 4.2 and 5 of our Terms.