")
Back to Journals » International Journal of Women's Health » Volume 10
Leading causes of death of women of reproductive age in the Republic of Georgia: findings from the National Reproductive Age Mortality Survey (2014)
Authors Lomia N , Berdzuli N , Sturua, L, Kereselidze M , Topuridze M, Pestvenidze E , Stray-Pedersen B
Received 29 January 2018
Accepted for publication 24 April 2018
Published 15 August 2018 Volume 2018:10 Pages 437—452
DOI https://doi.org/10.2147/IJWH.S164053
Checked for plagiarism Yes
Review by Single anonymous peer review
Peer reviewer comments 3
Editor who approved publication: Professor Elie Al-Chaer
Nino Lomia,1 Nino Berdzuli,1 Lela Sturua,2 Maia Kereselidze,3 Marina Topuridze,4 Ekaterine Pestvenidze,1 Babill Stray-Pedersen1,5
1Institute of Clinical Medicine, Faculty of Medicine, University of Oslo, Oslo, Norway; 2Department of Non-Communicable Diseases, National Center for Disease Control and Public Health, Tbilisi, Georgia; 3Department of Medical Statistics, National Center for Disease Control and Public Health, Tbilisi, Georgia; 4Health Promotion Division, Department of Non-Communicable Diseases, National Center for Disease Control and Public Health, Tbilisi, Georgia; 5Department of Obstetrics and Gynecology, Rikshospitalet, Oslo University Hospital, Oslo, Norway
Purpose: An understanding of women’s health problems during the reproductive years, based on reliable cause-of-death data, is of critical importance to avoid premature female mortality. This study aimed to investigate mortality levels, cause-specific patterns, and trends in women of reproductive age in Georgia.
Materials and methods: The National Reproductive Age Mortality Survey (2014) was conducted to identify all causes of death for women aged 15–49 years in 2012. The leading causes were compared with those in 2006, using directly age-standardized death rates (ASDRs). The accuracy of official cause-of-death data was assessed against verbal autopsy (VA) diagnoses, using kappa statistics, sensitivity, positive predictive value, and misclassification analyses.
Results: Of 913 eligible deaths, VAs were completed for 878 deaths. Noncommunicable diseases (NCDs) were the dominant causes of death (69.6% or 53.1/100,000), with cancer taking a major toll (45.2% or 34.5/100,000), followed by injuries (18.6% or 14.2/100,000). Breast cancer (12.5%), road injuries (9.1%), cervical cancer (6.5%), cerebrovascular diseases (5.2%), uterine cancer (4.1%), brain cancer (3.4%), suicide (3.1%), stomach cancer (3.0%), maternal disorders (2.6%), and liver cirrhosis (2.2%) contributed to the 10 leading specific causes of death, with the majority being substantially underreported in official statistics. This was primarily due to a significantly higher proportion (84%, p<0.05) of deaths routinely assigned ill-defined codes. Since 2006, statistically significant changes in ASDRs, with declines, were observed only for undetermined causes (40%, p<0.05) and ovarian cancer (54%, p<0.05); ovarian cancer and tuberculosis were replaced by stomach cancer and liver cirrhosis in the top 10 cause-of-death list.
Conclusion: NCDs continue to be the major health threats for Georgian women of reproductive age. The VA method proved a feasible tool to yield essential cause-of-death information for this population. Further research is needed to inform national health promotion and disease prevention interventions to be focused on NCDs and reproductive health needs with an integrated approach.
Keywords: women’s health, mortality, verbal autopsy, noncommunicable diseases, injuries, cancer
Introduction
A comprehensive approach to women’s health from a life course perspective, going beyond the reproductive and maternal realm, provides a unique opportunity to address the whole spectrum of health risks and more effectively reduce premature female mortality.1–3 Reproductive years (15–49 years) have a particular impact on women’s health and well-being as this stage of life is associated with the double burden of child-bearing and a wide range of preventable health issues, faced by their male counterparts.2,3 This has important implications for both present and future generations. There are also large variations across and within geographical regions. Young adult women in more developed settings tend to die predominantly from noncommunicable diseases (NCDs), whereas those in the least-developed settings are more likely to die from maternal causes and infectious diseases.2,3 Over recent decades and at different rates, low- and middle-income countries (LMICs) have experienced epidemiologic transitions, which have shifted the disease burden from communicable to chronic NCDs.2–6 Concurrently, there has been a substantial reduction in maternal deaths, which now account for only 6%–40% of all reproductive-aged female deaths in many of these countries.2,3,7 There are persistent gaps in the knowledge of health problems among women of reproductive age in LMICs.2,3,7 This is primarily owing to the lack of high-quality national-level cause-of-death data stemming from inadequate civil registration and vital statistics (CRVS) systems.8 In the absence of complete CRVS, several alternative approaches, including reproductive age mortality surveys (RAMOSs) and verbal autopsies (VAs), have been increasingly recommended to yield useful information about population-level cause-of-death patterns and inform policy decisions.9–11
Georgia, one of the former Soviet Republics in the Caucasus Region of Eurasia, with an estimated population of four million, belongs to the World Bank lower middle-income country group and the World Health Organization (WHO) European Region.12,13 Regardless of numerous political, economic, and social upheavals since independence in 1991, Georgia is currently undergoing rapid economic growth.13,14
As with other former Soviet bloc countries, Georgia continues to face the critical challenges of data quality,8,15,16 notwithstanding recent meaningful reforms to improve its CRVS system.17 This has been reflected in substantial inconsistencies between official statistics and the various survey findings supported by international agencies.15,18 The first national RAMOS, conducted in Georgia in 2008 (RAMOS08) through the technical support of the US Centers for Disease Control and Prevention (CDC), revealed considerable discrepancies between these two sources in overall and cause-specific mortality patterns for women of reproductive age in 2006, highlighting the important gaps in both death registration coverage and cause-of-death ascertainment in the CRVS system.19
The poor accuracy and reliability of the official cause-of-death statistics and the need to identify mortality patterns and likely changes over time in this age group of Georgian women resulted in a repeat national RAMOS. The second national RAMOS was conducted in Georgia in 2014 (RAMOS14) by the National Center for Disease Control and Public Health (NCDC&PH) and replicated the methodology of the RAMOS08.19 The primary aim of this study was to determine all causes of death in women aged 15–49 years who died in Georgia in 2012. The secondary aim was to investigate changes over time in all-cause and cause-specific mortality.
Materials and methods
Data collection and assigning causes of death
First, all eligible deaths were identified based on triangulation of mortality data for the year 2012 available from multiple sources. These included CRVS and NCDC&PH’s mortality datasets, regional death registers, as well as hospital and ambulance service registers.
In the second phase, the VA interviews with family members or other caregivers of decedents were conducted from March to December 2014 by household visits within 24 months of death, considering the local cultural context for the mourning period. Detailed information on premortem illness signs and symptoms was collected by skilled female interviewers with a medical background using the VA instrument. This instrument was developed for the RAMOS08 and based on the CDC questionnaires for pregnancy mortality studies and surveillance systems, combined with the WHO international standard VA questionnaire.19,20
Completed VA questionnaires were reviewed blind by two physicians to assign the most probable underlying cause to each death according to the rules of the International Classification of Diseases, 10th revision (ICD-10).21 Discrepancies in coding were resolved by a third physician who adjudicated the final diagnosis. The VA-derived maternal causes, based on the new ICD for Maternal Mortality (ICD-MM) definitions (“direct”, “indirect”, and “late” maternal deaths),22 were further investigated through a hospital medical record review. They were finally confirmed by the multidisciplinary expert panel of physicians.
Tabulating causes of death and statistical analysis
The VA diagnoses were first compared with the CRVS diagnoses for the same deaths, aggregated into the WHO General Mortality Tabulation List 1 of ICD-10 (hereafter referred to as WHO list)23 and then into a shortened list of the most relevant causes.
Agreement of cause attribution between the two sources was assessed based on the Cohen’s kappa (k) statistic, with the corresponding 95% CIs.24 The strength of agreement was evaluated as poor for k=0.01–0.20, fair for k=0.21–0.40, moderate for k=0.41–0.60, good for k=0.61–0.80, and almost perfect for k=0.81–1.00.24 Sensitivity and positive predictive value (PPV) of the CRVS system for each cause category were measured against VA diagnosis as a reference standard. Estimates of kappa, sensitivity, and PPV with the corresponding 95% CIs were computed by DAG_Stat spreadsheet.25 Over- or underreporting of causes of death in CRVS were determined against the same reference standard based on Nam and Blackwelder method26 by calculating the relative differences in mortality proportions for each cause category, with the corresponding 95% CIs, using NCSS 11 statistical software.27 Patterns of misclassification between CRVS and VA diagnoses were further analyzed by cross-tabulating these two data based on the shortened WHO list.
Using the Global Burden of Disease (GBD) classification,6 VA-based causes of death were further reclassified into three broad categories: communicable, maternal, neonatal, and nutritional disorders; NCDs; and injuries. In addition, the fourth group of undetermined causes incorporated all deaths assigned ill-defined and unknown codes.11 Crude mortality rates (all-cause-, age- and cause-specific per 100,000 women) were calculated using the 5-year age groups (from 15–19 to 45–49 years) and the corresponding mid-year female population estimates as denominators obtained from official sources.28 Age-standardized death rates (ASDRs) were then computed by applying age-specific death rates to the world standard population age distribution (2000–2025) using the direct method29 and compared to those for the reference period of 2006.19 The two populations were deemed significantly different in their ASDRs at the 0.05 level if the 95% CI of the standardized rate ratio (SRR) excluded 1. Both the ASDRs and the SRRs, with the corresponding 95% CIs, were calculated using Rothman’s Episheet.30
All other statistical analyses in our study were performed using SPSS software version 21.0.31
Ethical approval and informed consent
Ethical approval for this study was received from the Institutional Review Board of the NCDC&PH and the Regional Committees for Medical and Health Research Ethics South East Norway. Written informed consent was obtained from all respondents prior to interviews.
Results
Of 913 identified eligible deaths, VAs were successfully completed for 878 deaths, which yielded a response rate of 96.2% and included two cases found to be unreported in official sources. Only one family refused to be interviewed, and 34 families could not be traced after their family member’s death. The overall median age at death was 42 years (range 15–49 years), and over two-thirds of deaths (72.4%) occurred outside of health institutions.
Cause agreement and misclassification patterns
Table 1 summarizes the findings of the overall and individual-level agreement in attribution of causes of death between the CRVS and VA sources based on the shortened WHO list. The overall level of agreement on cause-of-death ascertainment between these two data was fair (k=0.36, 95% CI=0.33 to 0.40), showing a slight improvement from that when using the WHO list (k=0.34, 95% CI=0.31 to 0.38). Individual agreement was extremely poor for ill-defined causes and unspecified external causes, with the lowest kappa scores (0.04 and 0.06, respectively). Among specific causes of death, disagreement between the two sources was particularly evident for suicide, transport accidents, neurologic disorders, and liver diseases (k=0.12–0.20). By contrast, the level of agreement was good for respiratory tuberculosis (TB), breast cancer, leukemia, malignant skin melanoma, brain cancer, and maternal causes (k=0.63–0.75), and almost perfect (k=0.81) for stomach cancer (Table 1).
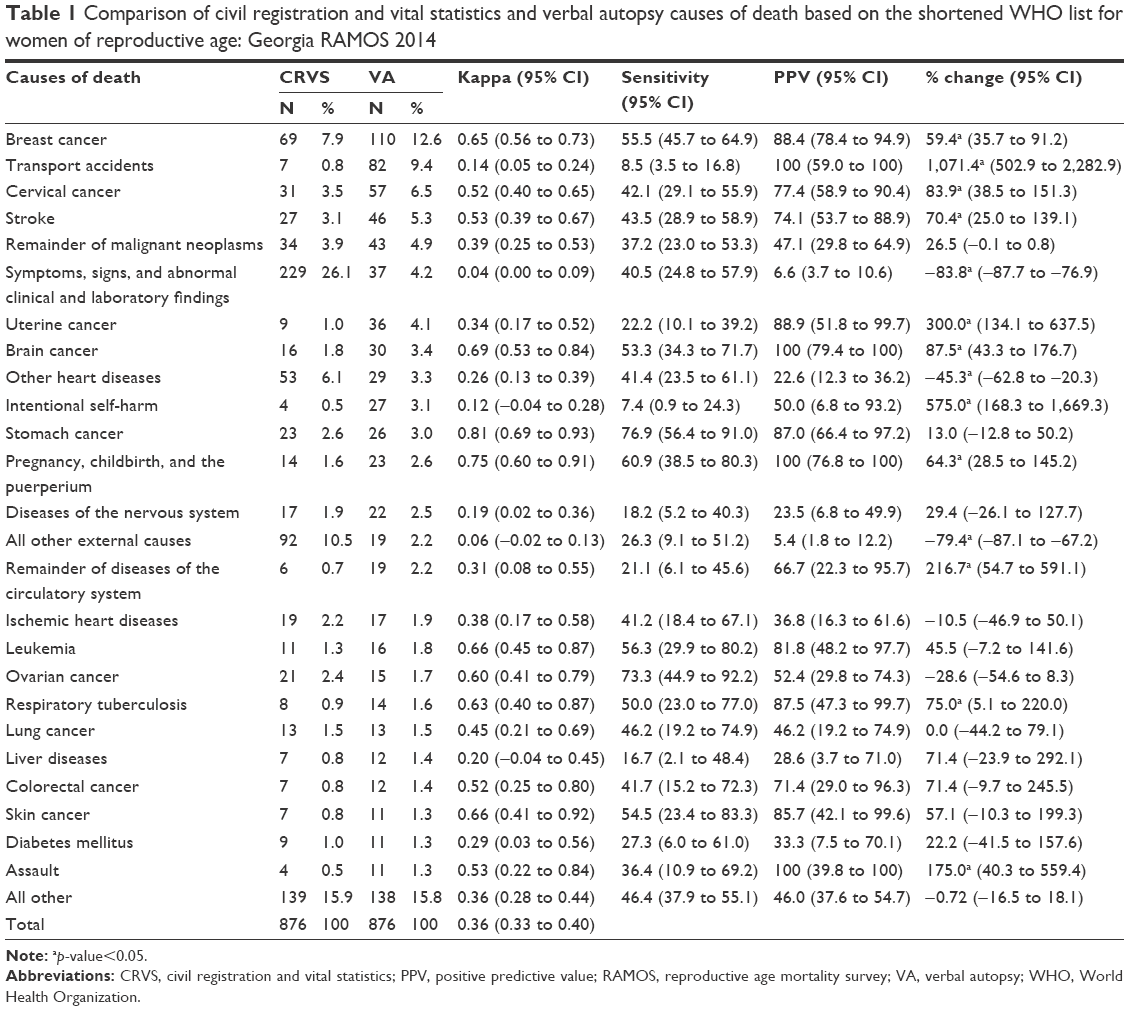 | Table 1 Comparison of civil registration and vital statistics and verbal autopsy causes of death based on the shortened WHO list for women of reproductive age: Georgia RAMOS 2014 |
The observed sensitivity of the CRVS system relative to the VA in identifying the major specific causes of death was largely unsatisfactory (<50%), with the lowest values for suicide, transport accidents, liver diseases, neurologic disorders, uterine cancer, and diabetes (Table 1). Sensitivity was higher (>60%) for maternal causes and ovarian cancer, and the highest for stomach cancer (76.9%). The PPVs of the CRVS system, ranging from 5.4% to 100%, were among the lowest for liver disease, diabetes, and ischemic heart disease (IHD), while being the highest (100%) for transport accidents, brain cancer, maternal causes, and assault (Table 1).
The estimated degrees of over- and underdiagnosing for each cause category in CRVS due to misclassification are presented in Table 1. As shown, percentage changes for the majority of selected causes of death were statistically significant (p<0.05), with the largest differences seen for transport accidents, suicide, and uterine cancer compared to other specific causes (Table 1).
Table 2 provides the details of the misclassification patterns for the major causes of death using the shortened WHO list. The overwhelming majority of deaths (214/229), ascertained by the CRVS system as ill-defined causes, were reclassified by the VA into a wide range of ICD cause categories. This was particularly evident for breast cancer (33/110), transport accidents (13/82), cervical cancer (15/57), cerebrovascular diseases (11/46), uterine cancer (11/36) and suicide (7/27), as well as brain cancer (5/30) and maternal causes (5/23). Further increases in these important causes, namely breast cancer (16/110), cervical cancer (18/57), uterine cancer (17/36), cerebrovascular diseases (15/46), and brain cancer (9/30), as well as maternal causes (4/23) and suicide (4/27), were observed after their reallocation from various specific or unspecified causes of death of CRVS data. Furthermore, over half of the deaths due to transport accidents (55/82) and suicide (14/27) and nearly one-quarter of those due to assault (3/11) from the VA source were originally attributed to the category of “all other external causes”. Overall, this category was vastly miscoded (73/92) in the CRVS source (Table 2).
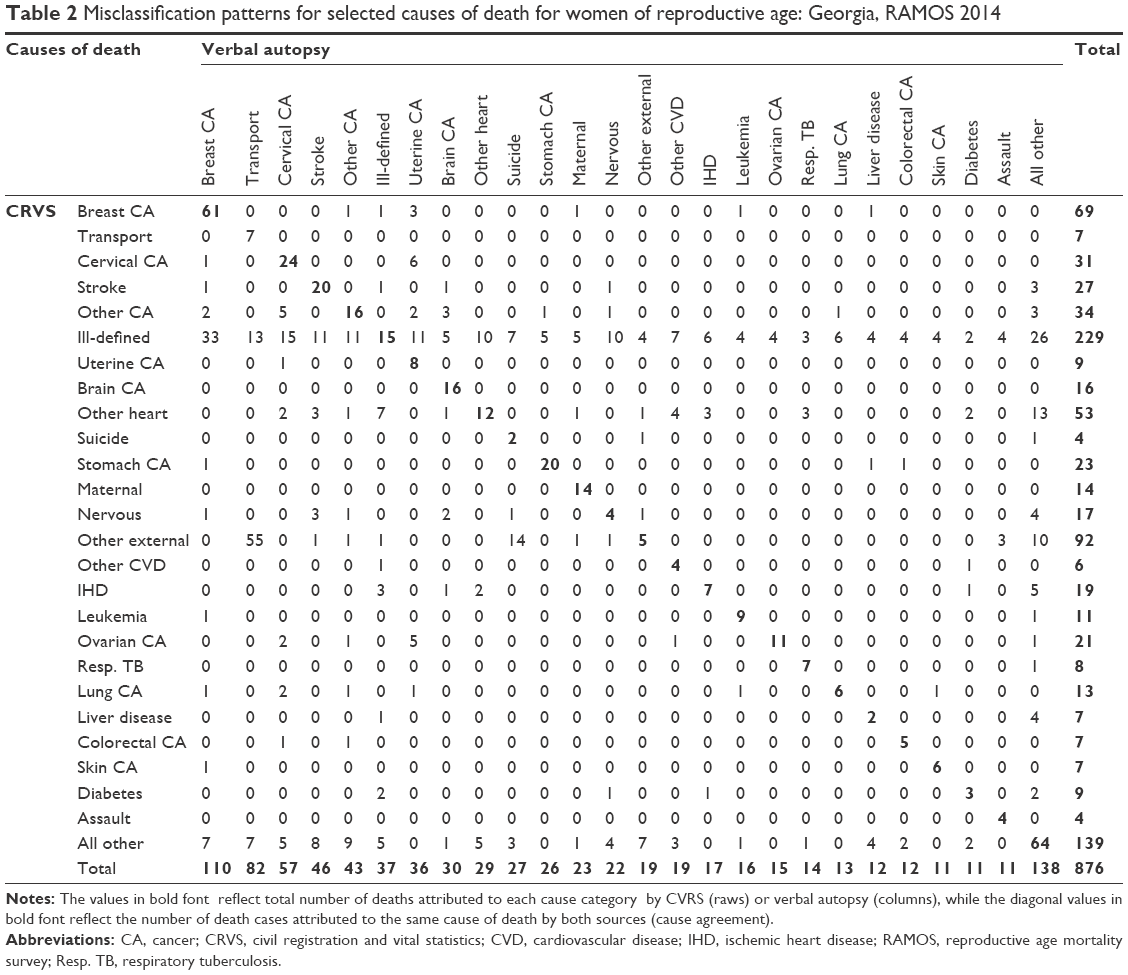 | Table 2 Misclassification patterns for selected causes of death for women of reproductive age: Georgia, RAMOS 2014 |
Broad causes of death
Table 3 summarizes the VA-based cause-specific mortality patterns of reproductive-aged women in Georgia in 2012 based on the GBD classification. The all-cause crude mortality rate was 76.2 per 100,000 (95% CI=71.3 to 81.4). Of the four broad categories of death, NCDs were by far the leading cause of death, accounting for over two-thirds of all deaths (69.6%) or 53.1 deaths per 100,000. Cancer accounted for almost half of all deaths (45.2%) or 34.5 per 100,000 and was the most common NCD-related cause and the principal cause of death. The second most common NCD-related cause was cardiovascular disease (CVD), contributing to 13.2% of all deaths. Almost one-fifth (18.6%) of all deaths were due to injuries, accounting for 14.2 deaths per 100,000, making them the second leading broad category of death. This category was followed by communicable, maternal, neonatal, and nutritional disorders at 7.4% or 5.6 deaths per 100,000. Undetermined causes contributed to only 4.4% (Table 3).
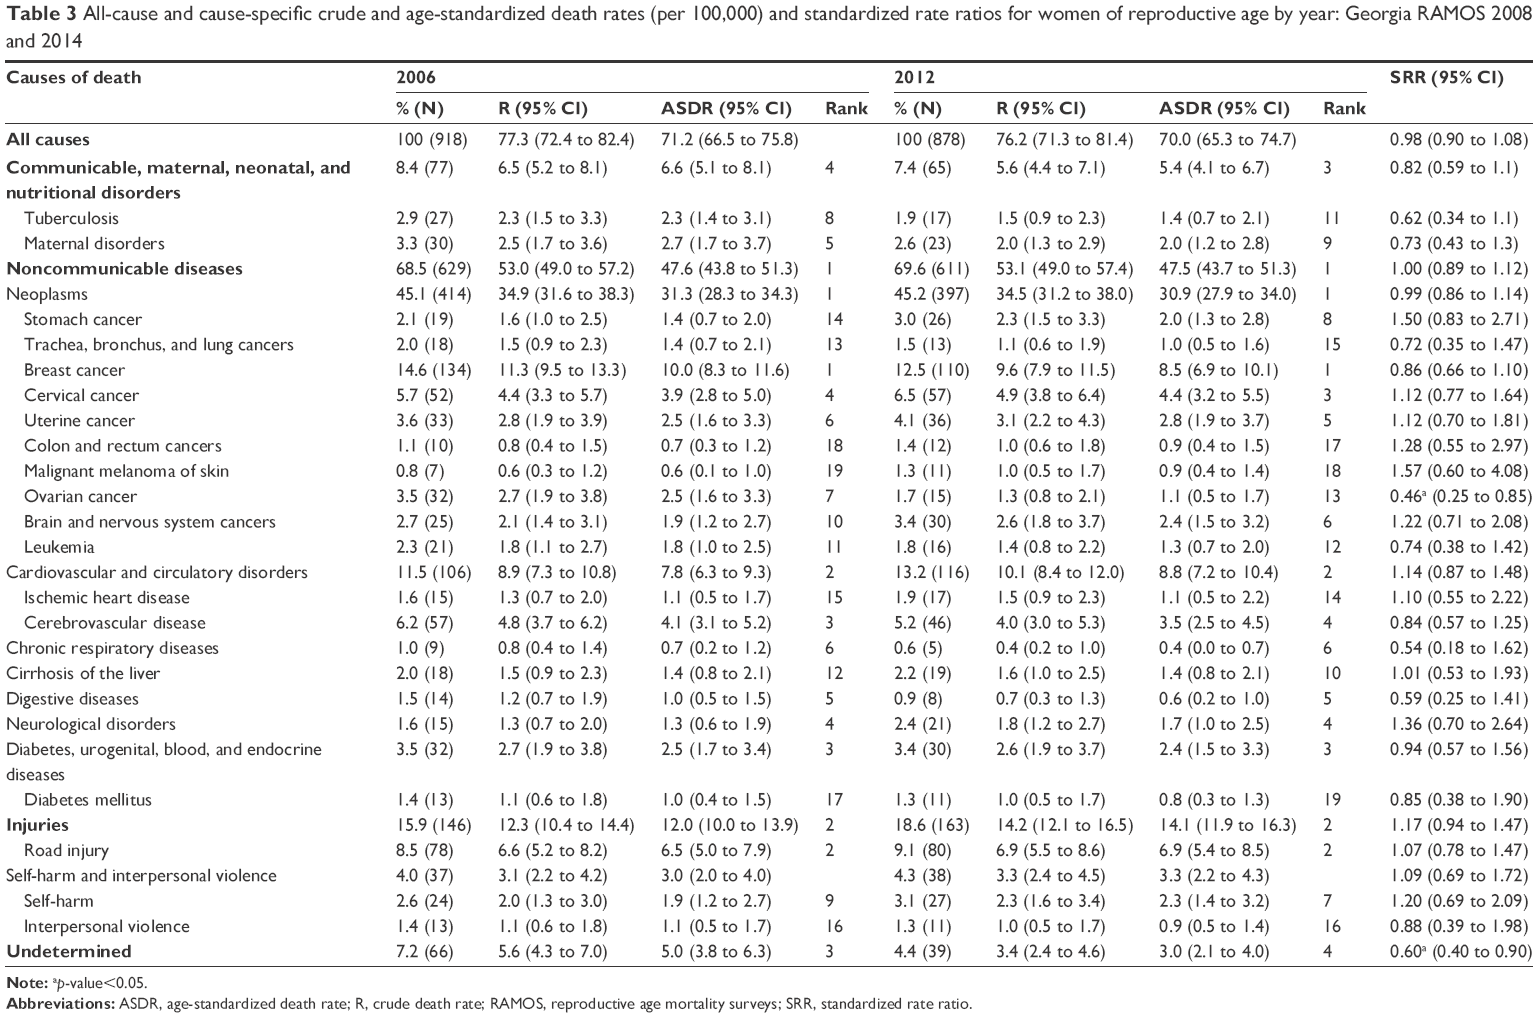 | Table 3 All-cause and cause-specific crude and age-standardized death rates (per 100,000) and standardized rate ratios for women of reproductive age by year: Georgia RAMOS 2008 and 2014 |
The cause-of-death pattern varied across the age groups (Table 4). Injuries were the principal cause of death in women aged under 25 years, accounting for nearly half of all deaths in this age group and particularly affecting those aged 15–19 years (63.3%). By contrast, more than two-thirds of deaths in women aged ≥25 years were due to NCDs, making them the principal cause of death in this age category, with the greatest proportion in the oldest age group (84.0%). Cancer was the most common cause of NCD-related deaths across all age categories, being the principal cause of death in those aged ≥30 years and killing half of the women in this age group. CVD ranked as the third leading cause of death in the youngest age group after injuries and cancer, but the second in the oldest age group. Communicable, maternal, neonatal, and nutritional disorders were most prominent and the third top cause in the 20–24-year age group (24.5%), holding their rank in the 30–39-year age group, but ranking second in those aged 25–29 years after injuries and cancer. Undetermined causes at 5.3% were most pronounced in the oldest age group (Table 4).
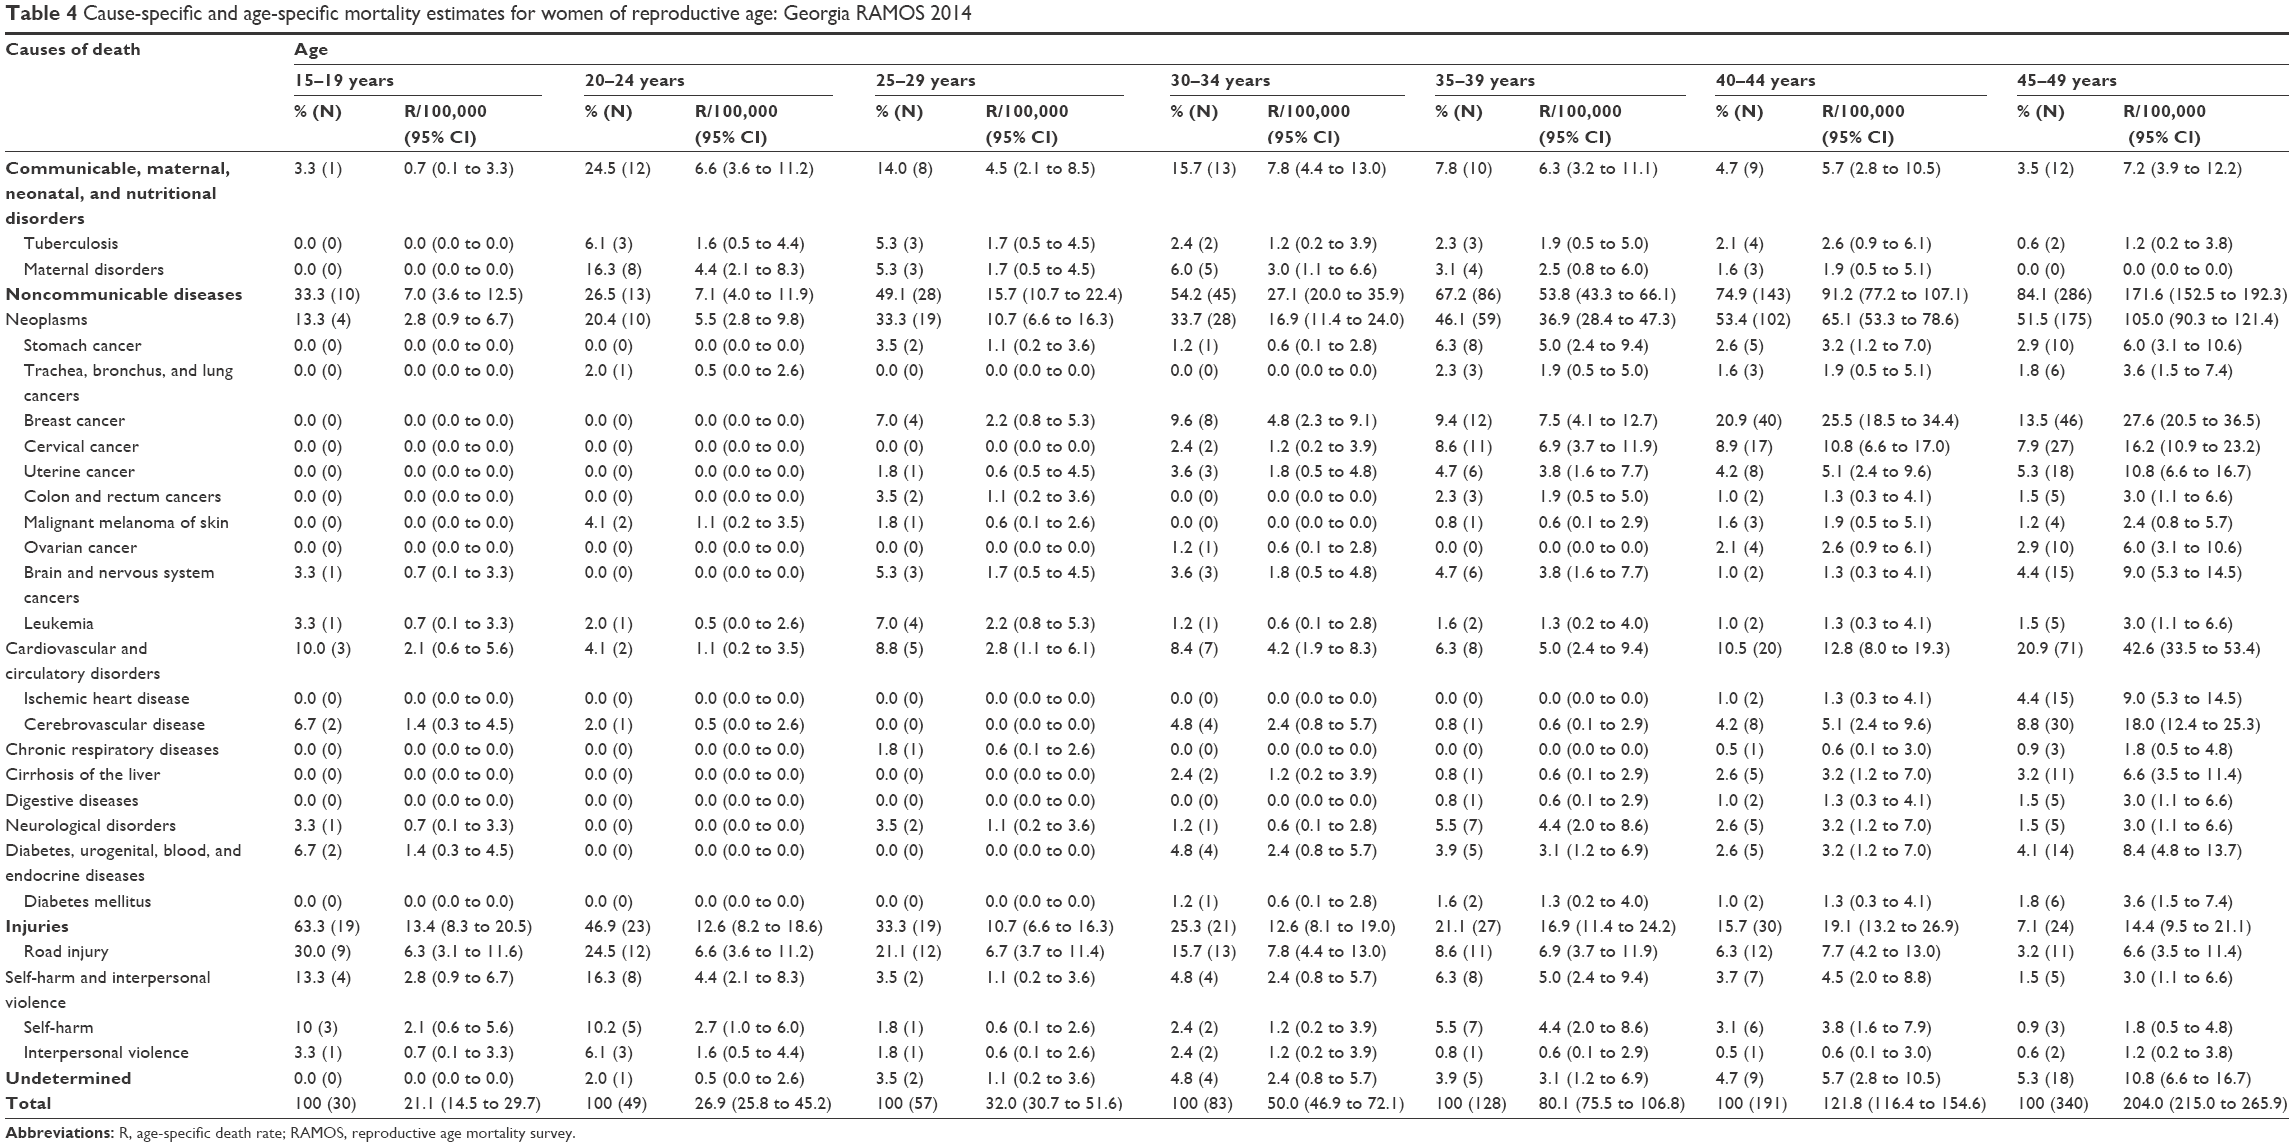 | Table 4 Cause-specific and age-specific mortality estimates for women of reproductive age: Georgia RAMOS 2014 |
Figure 1 shows a steady increase in crude mortality rates from all causes combined, NCDs, cancer, and CVD with age, in contrast to injuries and communicable, maternal, neonatal, and nutritional disorders.
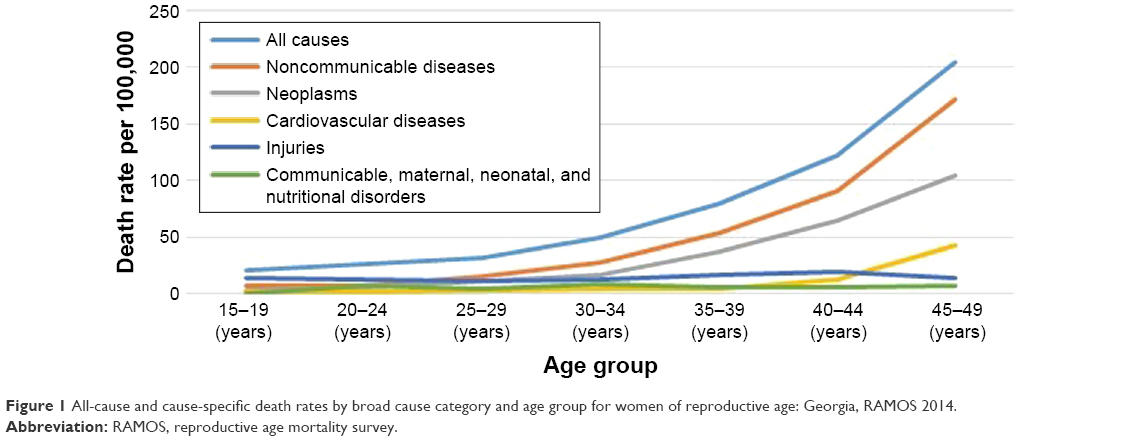 | Figure 1 All-cause and cause-specific death rates by broad cause category and age group for women of reproductive age: Georgia, RAMOS 2014. |
Specific causes of death
Examining the specific causes of death, based on the GBD classification (Table 3), breast cancer was found to be the number one cause in women aged 15–49 years, accounting for 12.5% of all deaths or 9.6 per 100,000, followed by road injuries at 9.1% or 6.9 per 100,000 and cervical cancer at 6.5% or 4.9 per 100,000. Cerebrovascular diseases were the fourth major cause (5.2%), whereas uterine cancer was the fifth (4.1%). Brain cancer (3.4%), with subsequent suicide (3.1%) ranked as the sixth and seventh leading causes of death, respectively, followed, in descending order, by stomach cancer, maternal disorders, and liver cirrhosis as the eighth, ninth, and tenth leading causes of death. TB at 1.9% or 1.5 per 100,000 was the most common cause of death from communicable diseases (Table 3).
A detailed analysis of specific causes of death by age categories (Table 4) identified road injuries as the principal cause of death in women aged under 35 years, killing nearly one-third (30.0%) of adolescent girls aged 15–19 years. Suicide ranked second ahead of cerebrovascular diseases in the youngest age group, but third in those aged 20–24 years behind maternal disorders, with the latter dropping down to the third place in the 25–34-year age group and further in the older groups, while not affecting those in the youngest and oldest age categories. Breast cancer was the second major cause of death in women aged 25–34 years, but the principal cause in the older age groups (35–49 years), followed by cervical cancer and road injuries in those aged 35–44 years, with cervical cancer being outranked by the second most common cerebrovascular diseases in the oldest age group. TB and brain cancer shared the third place with equally important maternal disorders in the 25–29-year age group, whereas stomach cancer was the third major cause in those aged 34–39 years. Becoming increasingly relevant with age, uterine and ovarian cancers were most prominent in the oldest age group, as were liver cirrhosis, IHD, and diabetes (Table 4).
Figure 2 illustrates the sharp increase with age in mortality rates for all five cancer-related deaths, cerebrovascular diseases, and liver cirrhosis, as opposed to mortality rates for road injuries, suicide, and maternal disorders, remaining relatively stable or decreasing with age.
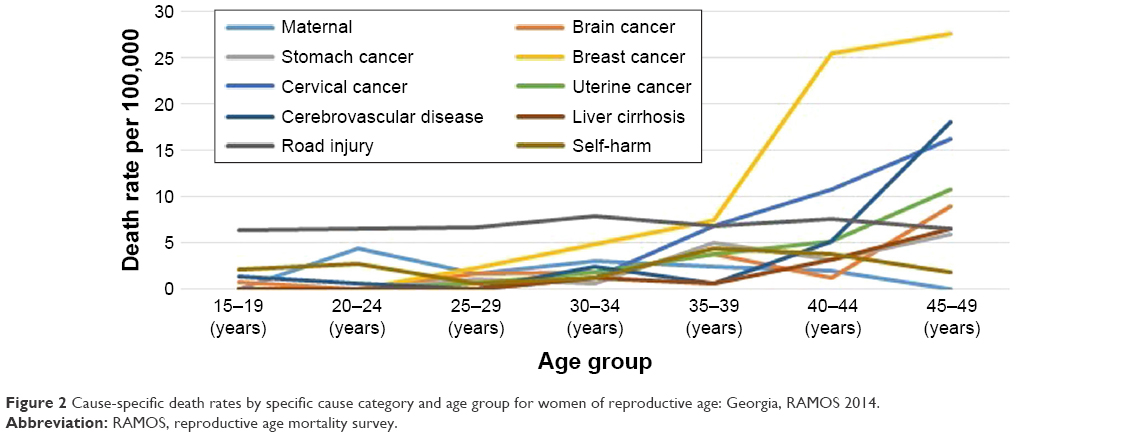 | Figure 2 Cause-specific death rates by specific cause category and age group for women of reproductive age: Georgia, RAMOS 2014. |
Comparison of the leading causes of death in 2006 and 2012
Table 3 presents a comparison of mortality estimates for the leading causes of death of Georgian women of reproductive age between 2006 and 2012, based on the two national RAMOS (RAMOS08 and RAMOS14) findings. The all-cause ASDR per 100,000 women was 70.0 in 2012, showing no statistically significant difference from 71.2 in 2006 (SRR=0.98, 95% CI=0.90 to 1.08; p>0.05). Almost no statistically significant changes have been identified during that period in ASDRs for the broad categories of death either, including NCD broad subgroups, except for a statistically significant decline (SRR=0.60, 95% CI=0.40 to 0.90; p<0.05) seen in undetermined causes, making them rank down to the fourth place compared to 2006 (Table 3).
Likewise, among the major specific causes of death, statistically significant difference in the ASDR between 2 years was identified only for ovarian cancer, which more than halved (SRR=0.46, 95% CI=0.25 to 0.85; p<0.05) compared to 2006 (Table 3). Further changes during that period were observed in both composition and rankings of the 10 leading specific causes of death, with only breast cancer and subsequent road injuries maintaining their dominant positions. Specifically, ovarian cancer and TB, ranking seventh and eighth in 2006, were no longer apparent in the list of top 10 causes in 2012, being replaced by stomach cancer and liver cirrhosis, which moved up from their 14th and 12th places to the eighth and tenth, respectively. Beyond this, a rank increase was observed for cervical, uterine, and brain cancers, and suicide from their fourth, sixth, tenth, and ninth to the third, fifth, sixth, and seventh places, respectively, as opposed to a rank decrease for cerebrovascular diseases and maternal disorders from their third and fifth to the fourth and ninth places, respectively (Table 4).
Discussion
This paper presents the nationwide all-cause and cause-specific mortality patterns among women of reproductive age in Georgia for 2012 and trends over time based on the repeat national RAMOS findings. The all-cause crude mortality rate was 76.2 per 100,000. NCDs were the leading broad cause of death, accounting for 69.6% of all deaths or 53.1 per 100,000, whereas breast cancer was the number one specific cause of death, responsible for 12.5% of all deaths or 9.6 per 100,000.
Using multiple sources of mortality data, our study identified only two (0.2%) unregistered deaths in the 2012 official statistics. Compared to the RAMOS08 findings (25% in 2006),19 this suggests a substantial improvement in death registration coverage in Georgia (98% according to the WHO).12 This is most likely owing to the previously mentioned reforms in the CRVS system, which lawfully obliged all medical establishments and other responsible bodies to complete electronic birth and death certificates and submit by a set deadline to the Civil Registry Agency.17 However, in line with the RAMOS08,19 there were considerable discrepancies between the VA and CRVS in the underlying patterns of causes of death for this population in 2012, revealing significant underrepresentation of a clear majority of important cancer, injury, and maternal deaths in official sources, with transport accidents, suicide, and uterine cancer misrepresented as the leading specific causes of death. Showing overall fair agreement between two sources (k=0.36, 95% CI=0.33 to 0.40), along with largely unsatisfactory sensitivity (<50%) of the CVRS system in identifying the major specific causes of death, our study found the poor level of individual agreement (k<0.21) and the lowest values of sensitivity (≤22.2%) for these latter causes. Further analysis of the misclassification patterns revealed significant over reporting of ill-defined (84%, p<0.05) and unspecified external causes (79%, p<0.05) in the CRVS system as compared to only about 4% and 2% of these deaths, respectively, in VA data. A massive reallocation of the specific causes of death from ill-defined and further from various originally miscoded specific or “other” unspecified cause categories resulted in significant proportional increases in estimated mortality notably from breast, cervical, uterine, and brain cancers; cerebrovascular diseases; and maternal disorders, in addition to transport accidents and suicide (Table 1). Given the clear majority of deaths (72%) in our study sample occurred outside of health institutions, this observation suggests the failure of the system to collect cause-of-death data on out-of-hospital deaths in Georgia. Overall, our findings are consistent with the recent global assessment of the national CRVS systems for the period of 1980–2012, classifying Georgia in the medium group of countries with inadequate quality of mortality data making it less useful for policy and research.16 The excessive use of ill-defined and “other” unspecified codes particularly for external causes, cancers, and CVDs, in addition to systematic undercounting of maternal causes in the routine registration system, was also documented in earlier studies conducted in other former Soviet Republics and was largely attributed to artifacts in cause-of-death certification and coding practices.8,15,16,32–34 Our study, therefore, signifies the need for continued trainings for physicians and coders in these important procedures,32 as well as periodic assessments of the quality of routine mortality statistics, using VA as the best and reliable approach to improve national and regional cause-of-death data, particularly for deaths occurring without medical attention, in order to inform public health priorities.8–11,35–37
Based on the GBD classification, our study identified that NCDs, accounting for two-thirds of all deaths, were by far the leading causes of death in women during their child-bearing years in 2012, followed by injuries and communicable, maternal, neonatal, and nutritional causes. Breast cancer, followed by road injuries, cervical cancer, cerebrovascular diseases, uterine cancer, brain cancer, suicide, stomach cancer, maternal disorders, and liver cirrhosis, contributed to the 10 leading specific causes of death. Overall, the mortality level and cause-of-death patterns have remained fairly consistent over the 6-year period. A comparison of all-cause and cause-specific ASDRs with those in 2006 revealed statistically significant changes, with declines, only for undetermined causes (40%, p<0.05) and ovarian cancer (54%, p<0.05). While the reduction in ill-defined causes may partly be attributable to improved skills of field interviewers and death certifiers since the RAMOS08,19 the downward trend in ovarian cancer mortality is in line with that observed globally and in Europe, including in certain former Soviet Republics, between 2002 and 2012.38 Declines were systematically larger in the young (20–49 years) and mainly linked to oral contraceptives’ use and their protective effects against this cancer.38 However, this cannot fully explain such a dramatic reduction in this cancer mortality in Georgia, given the very low prevalence (4%) of the oral contraceptives’ use among women aged 15–44 years, despite a twofold increase between 1999 and 2010, as documented by the Georgia Reproductive Health Survey 2010.17 Therefore, this requires further research. Besides this, dropping in rank, ovarian cancer, along with TB, was no longer evident in the top 10 cause list in 2012, being replaced by more important stomach cancer and liver cirrhosis. Rank declines due to relative decreases in absolute numbers of deaths were seen for cerebrovascular diseases and maternal disorders, with rank increases for cervical, uterine, and brain cancers.
An observed decline, though nonsignificant, in deaths from communicable, maternal, neonatal, and nutritional disorders, and the persistent predominance of NCD causes are in line with the global shift of causal patterns of mortality in reproductive-aged women, including in LMICs.1–3,6 The rapid rise in overall premature deaths from NCDs (48%), largely from CVD and cancer in these countries, is closely linked to the modernization and urbanization during the socioeconomic transition, resulting in a wider adoption of more affluent lifestyle choices, such as unhealthy diet, low physical activity, smoking, and alcohol use, with associated changes in body mass index and lipid and blood pressure profiles.2–6,13,39–41 While Georgia is challenged by overall 93% of NCD mortality, of which 19% occur in women under age 70, over half (54.2%) of adult female population aged ≥18 years are overweight and more likely to be obese than man (28.5% vs 21.8%), 22.3% show insufficient physical activity, whereas 31.7% has the raised blood pressure,39,42,43 mirroring the global and the WHO European Regional trends.13,39,41 There is also evidence of the increasing tobacco epidemic in Georgian women, particularly in those aged under 40 years, being more educated and living in urban areas, similar to other former Soviet Republics.44 However, in view of the current demographic trends of increasing life expectancy and decreasing fertility, along with the rapid socioeconomic development in Georgia,12,14,18,40,41 further country-specific research is needed to identify expected changes in risk and disease patterns in this population in order to ensure evidence-informed and targeted national disease prevention and control interventions.
A particularly alarming finding of our study pertains to cancer-related causes of death, remaining dominant and contributing to almost half of all eligible deaths. Breast and reproductive system cancers collectively were responsible for one-quarter of all deaths. Our findings are in line with global estimates, ranking breast and cervical cancers among the leading causes of death in reproductive-aged women, including in the WHO European Region.6,41 Breast cancer is the major cause of death in young adult women in Central and Western Europe, ranking fourth in Central Asia, whereas cervical cancer ranks fourth in Central Europe.41 Over the past three decades, worldwide deaths from breast and cervical cancers in this age group increased 1.8% and 0.45% per year, respectively, with both cancers combined currently causing more deaths than maternal causes in general.45,46 As breast and cervical cancers now kill more women than any other forms of cancer in all parts of the developing world, both incidence and mortality from each type of cancer in women of reproductive age are substantially higher than in developed countries, with breast cancer predominance.38,45,46 The observed trends in breast and cervical cancer mortality have been attributed to women’s sexual and reproductive choices and other exposures in early life, such as lower parity and later age at first birth, breastfeeding history, obesity and low physical activity, history of infection with the human papillomavirus (HPV), and various occupational factors, coupled with the limited awareness of and access to disease prevention and treatment services in low-recourse settings.3,41,46,47 Previous research in Russia and Ukraine documented a steady increase in breast cancer incidence and mortality over the past few decades that has been linked to the very low contemporary birth rate in both countries.48 The other studies highlighted higher incidence and mortality rates of cervical cancer across the former Soviet Republics than in most Western European countries, which have been explained by opportunistic screening programs, lack of efficient call–recall systems, low coverage, and the absence of quality-assured cytology with centralized screening registry, alongside low HPV vaccine uptake.49,50 One study from Georgia indicated a relatively high prevalence (8.6%) of high-risk HPV among females aged 18–59 years.51 There is also evidence of the low utilization of either mammography (10%) or a Pap smear test (12%), as well as the low awareness of HPV and the HPV vaccine (21% and 18%, respectively) among Georgian women of reproductive age that has been attributed to their lack of knowledge or reluctance to access preventive services or providers’ lack of expertise or the absence of perceived job responsibility to offer such services.18,52 Our results, therefore, could guide strategies for further strengthening the National Reproductive Tract Cancers Prevention and Early Detection Program, initiated in 2006 and expanded nationwide in 2011,53 to curtail cancer epidemic and reduce mortality in the Georgian female population, who might also benefit from fertility preservation during their child-bearing years.54
The observed high death toll of CVD, the second major NCD-related cause, with the most common cerebrovascular diseases and IHD, mirrors global evidence on increasing importance of these conditions in rankings of the top 10 causes of female premature death (years of life lost), with much faster advancement in LMICs.3,4,6,39 This also makes CVD the second leading cause of death in women of reproductive age worldwide.6 Similarly, across the WHO European Region, except for Western Europe, both IHD and stroke are among the top three major causes of death in this age group, though ranking in the reverse order, contrary to our findings.41 Compared to Nordic countries, the burden for women is more than double toward the east, including in Central Asia and Russia, and most likely reflects the East–West gap in CVD mortality driven by social and political forces, mass psychological stress, and changes in risk factor profiles in post-communist republics since the breakup of the Soviet Union.6,13,40,41 Recent plateauing of IHD mortality trends in women aged under 45 years in some European countries, including Russia, has been linked to increasing prevalence of risk factors, such as diabetes and obesity, and plateaus in the prevalence of hypertension in the younger age groups.55,56 While diabetes, metabolic syndrome, and tobacco use are the well-established predictors of CVD in young women than in their older counterparts, recent epidemiologic studies suggested nontraditional risk factors, such as preterm delivery, hypertensive pregnancy disorders (including preeclampsia), gestational diabetes, autoimmune diseases, breast cancer treatment, and depression to be the important contributors as well, with preeclampsia being associated with increased risk of both IHD and stroke into later life.57–59 At the same time, compared to men, women, particularly the young (<50 years), are more likely to experience poorer outcomes of a CVD event in part because of underestimation of their risk, delay in diagnosis, or less aggressive treatment on the part of clinicians who are possibly misled by a somewhat different presentation of disease and known protective physiologic effects of estrogen against CVD.2,41,57,58 Given also exceedingly common undetermined or cryptogenic causes of early-onset stroke mostly at younger ages (<30 years), the overall burden of CVD in young adult women is prone to being underestimated in the face of alarming levels of associated mortality.59 The implied need for more close follow-up and comprehensive management of the underlying diseases in the high-risk groups of young women gains increasing importance in view of the current concept of “obstetric transition”, describing a global shift of direct obstetric causes of maternal mortality toward indirect causes mainly owing to chronic diseases (primarily CVD) with aging of maternal population.60 Our findings, documenting high mortality from both NCDs and maternal causes, may, therefore, serve as the indirect proof of the critical need for accelerating remedial actions on preventable maternal deaths with the greater focus on interactions between reproductive and noncommunicable conditions.1,2
Additional findings with important policy and program implications include the emergence of liver cirrhosis among the 10 leading causes of death in women of reproductive age, with subsequent TB as the most common communicable cause. Our findings are comparable with the global data indicating both diseases to be the leading causes of death (seventh and fifth, respectively) in this age group of women.6 Likewise, liver cirrhosis ranks among the top five causes of death in young women in all parts of the WHO region, whereas TB ranks fifth in Central Asia.41 The observed high mortality from liver cirrhosis in our study population, particularly pronounced in the oldest age group, likely reflects Georgia’s one of the world’s highest prevalence rates (6.7%) of hepatitis C virus (HCV) infection owing to iatrogenic transmission and injection drug use, as opposed to other former Soviet Republics in Eastern Europe, where the increasing burden of liver cirrhosis has been predominantly driven by heavy alcohol consumption.6,61–63 Our findings are also consistent with the recent research in the general female population from nine developing countries, identifying Georgia as the third highest female HCV prevalence (1.3%) country after Mongolia and Pakistan and suggesting interventions/hospitalizations due to childbirth, but not sexual transmission, to be a possible route of HCV transmission in the study sites.64 The same study also indicated that a steady increase in female HCV prevalence with age (prevalence ratio for ≥45 versus <35 years=2.84, 95% CI=2.18 to 3.71) is likely to be attributable to the combination of accumulating risk of exposure and a high probability of infection becoming chronic, and confirmed a correlation between age-specific HCV prevalence and related liver cancer incidence in those aged ≥45 years.64 Furthermore, previous study in Georgia found the high prevalence of HCV coinfection (21%) among TB patients (median age 37 years) most likely owing to drug-induced hepatotoxicity.65 This has been shown to be associated with increased risk of liver cirrhosis, and conversely, HCV and cirrhosis with increased risk of developing active TB disease.66,67 Georgia, like other former Soviet Republics, has been among the worst-affected countries by TB since the collapse of the Soviet Union and currently ranks among the world’s 27 high multidrug-resistant-TB (MDR-TB) countries that hinder effective TB control.68–70 Moreover, while previous treatment has been documented as a major risk factor for MDR-TB in the European Region, with Eastern Europe and Central Asia showing the world’s highest rates, studies in Georgia identified female gender as another independent predictor of MDR-TB, imitating the findings from two studies conducted in Russia and Estonia.68,69 Besides this, a substantial proportion of reproductive-aged women in the GRHS10 reported TB exposure through interactions with either infected family members (9%) or the other sources (12%).18 Hence, our results highlight the importance of improving surveillance and treatment programs for liver cirrhosis and TB, preferably in an integrated manner, to more effectively and efficiently reduce the associated heavy burden in women of reproductive age, addressing at the same time a vertical HCV transmission risk during pregnancy71 and increased risk of perinatal deaths (sixfold) or premature birth and low birthweight (twofold) related to TB.72
Our study findings further emphasize the crucial need in the country for prevention of fatal injuries, remaining overall the second leading cause of death and the principal cause in those aged under 25 years. Of special concern are road injuries, the second major cause, and violence, particularly suicide, the seventh leading cause, collectively accounting for over one-third (35%) of deaths in those aged 15–29 years, thus the prime child-bearing age group in Georgia.18 Our findings are consistent with the WHO data for Georgia and the European Region,73,74 as are with global patterns of injury mortality, showing road injuries to be the principal cause of death in the 15–29-year age group, followed by suicide, yet with males most affected.75 Contrary to the global ranking of tenth place, road injuries in Europe and Central Asia rank sixth as a cause of premature death and disability, while ranking fourth among women of reproductive age in Eastern Europe.40,41 The rising, yet neglected, burden of road traffic deaths in LMICs, contributing to >90% of fatalities worldwide, has been associated with increased urbanization and motorization, particularly in emerging economies, coupled with a lack of sufficiently improved road safety strategies.75 In recognition of this health and development problem, Georgia has recently addressed the well-established risk factors of road traffic accidents by setting and enforcing traffic laws governing speed limits, drunk driving, distracting driving, and mandatory use of seat belts and helmets, in addition to improving the road infrastructure.73,75 However, our study results imply that clearly defined road safety policy, strict implementation of proven interventions, and reliable information systems are still required to reduce the burden of road traffic fatalities in the country.73 A special attention has to be drawn to violence as well, particularly in those at younger ages. Adolescents are exceptionally susceptible to violence death, predominantly suicide, known to be largely triggered by depression, eating disorder, other mental disorders, loneliness and hopelessness, relationship breakdown or interpersonal problem, or adverse childhood experience, such as physical and sexual abuse or victimization by bullying.76,77 There are also increasing concerns about the role of the social media in suicide communications among the young.76 Importantly, depression is among the top two leading causes of disability in women aged 15–49 years in all subregions of the WHO European Region.41 Overall, as most of the global suicide deaths are disproportionately concentrated in LMICs (78%),76 some of the world’s highest suicide rates documented in former Soviet Republics have been correlated with the post-Soviet transitional period and a wide range of socioeconomic, cultural, and religious factors, with unemployment and income inequality shown to be stronger predictors of female suicide.6,33,34,78 Studies from Georgia highlighted deep-rooted patriarchal attitudes and gender stereotypes as the important drivers of intimate partner violence (IPV) among ever married women of reproductive age (4%) who were 2–4 times more likely to justify IPV in at least one scenario, compared with those who had no such experience.18,79 This was particularly evident among poor, rural, less educated, unemployed, and younger women, as well as those with a history of child abuse or parental IPV.79 This in turn is known to be associated with increased risk of IPV80 and suicidality.76,77,81 Furthermore, the cross-sectional study on conflict-affected internally displaced persons aged >18 years in Georgia found that, compared to men, women were more likely to have posttraumatic stress disorder (PTSD), depression, and anxiety due to trauma exposure, forced displacement, daily stressors, and impoverishment.82 This warrants further research, given a well-recognized relationship between PTSD and suicidal behavior mediated by comorbid depression irrespective of the type of trauma experienced.81 Taken together, our study findings underline the urgent need for multisectoral prevention and control interventions addressing violence, both self-inflicted and interpersonal, with a special focus on the availability of key data, law enforcement, and service accessibility for victims to ensure effective response.73
Limitations
Our study had a number of limitations. First, underlying causes of death could not be determined for 35 eligible women because of a failure to reach their families and complete VAs. However, there is little reason to expect such a small percentage of missing causes (only 3.8%) to have significantly biased our findings. In addition, 39 deaths (4.4%), lacking clear symptom patterns, were assigned to ill-defined codes in VA data, yet accepted within a reasonable range, given the retrospective nature of the data collection.11 Second, the relatively long recall period of 2 years could have influenced the respondents’ ability to correctly recall events. On the other hand, previous research, indicating no major differences in the impact of the longer and shorter recall intervals, suggested 3 months to 2 years to be the most optimal delay range after a death.9–11 Other potential biases in VA-based cause-of-death ascertainment could be related to the well-recognized limitations of this method likely linked to instrument design, selection of respondents, variability in interviewers’ skills, and physicians’ approaches to death certification and coding.9,83,84 Finally, although acknowledging these limitations, our study used VA diagnoses as a reference standard to assess the diagnostic accuracy of the CRVS system. However, our decision, driven by a very low percentage of hospital deaths (28%) in the study sample, was supported by other studies, which used the same approach.36,37 Besides this, despite all of its shortcomings, earlier validation studies highlighted a good level of performance of physician-certified VA for some important specific causes of death in adults, particularly for breast cancer, maternal causes, road injuries, homicide, and, to some extent, suicide and stroke.84
Conclusion
Understanding the full dimension of women’s health risks during the reproductive years based on reliable data on causal patterns of mortality is of critical importance to inform evidence-based health policy and develop robust strategies addressing avoidable premature female mortality. Our study underscores that VA is a feasible tool for filling in existing gaps in national cause-of-death data, thus yielding essential information on key age- and sex-specific health priorities. This study identified NCDs, with cancers dominant, to be the major health threats for Georgian women of reproductive age. While our findings may contribute to the limited global evidence on the special challenges adolescent and young adult women face in the less developed world, they could also serve as a baseline knowledge for tracking progress toward broader national development goals. Further detailed research is needed to advance our knowledge of emerging health problems and their determinants in this population for effective application of health promotion and risk reduction interventions to be focused on NCDs and reproductive health needs with an integrated approach.
Acknowledgments
The authors thank the US International Development Agency for funding this study and Letten Foundation for providing financial support for this work. The authors are also grateful to the NCDC&PH staff and all other contributors to this study. The funding agency had no role in the study design and data collection, data analysis, or preparation of this manuscript.
Disclosure
The authors report no conflicts of interest in this work.
References
Barfield WD, Warner L. Preventing chronic disease in women of reproductive age: opportunities for health promotion and preventive services. Prev Chronic Dis. 2012;9:E34. | ||
Raymond SU, Greenberg HM, Leeder SR. Beyond reproduction: women’s health in today’s developing world. Int J Epidemiol. 2005;34(5):1144–1148. | ||
AbouZahr C. Progress and challenges in women’s health: an analysis of levels and patterns of mortality and morbidity. Contraception. 2014;90(Suppl 6):S3–S13. | ||
Yeates K, Lohfeld L, Sleeth J, Morales F, Rajkotia Y, Ogedegbe O. A global perspective on cardiovascular disease in vulnerable populations. Can J Cardiol. 2015;31(9):1081–1093. | ||
Miranda JJ, Kinra S, Casas JP, Davey Smith G, Ebrahim S. Non-communicable diseases in low- and middle-income countries: context, determinants and health policy. Trop Med Int Health. 2008;13(10):1225–1234. | ||
Lozano R, Naghavi M, Foreman K, et al. Global and regional mortality from 235 causes of death for 20 age groups in 1990 and 2010: a systematic analysis for the Global Burden of Disease Study 2010. Lancet. 2012;380(9859):2095–2128. | ||
Scrafford CG, Tielsch JM. Maternal deaths account for a small proportion of the total deaths among reproductive age women. J Womens Health (Larchmt). 2016;25(3):242–248. | ||
Mathers CD, Fat DM, Inoue M, Rao C, Lopez AD. Counting the dead and what they died from: an assessment of the global status of cause of death data. Bull World Health Organ. 2005;83(3):171–177. | ||
Fottrell E, Byass P. Verbal autopsy: methods in transition. Epidemiol Rev. 2010;32:38–55. | ||
Byass P, D’Ambruoso L, Ouédraogo M, Qomariyah SN. Assessing the repeatability of verbal autopsy for determining cause of death: two case studies among women of reproductive age in Burkina Faso and Indonesia. Popul Health Metr. 2009;7:6. | ||
Aleksandrowicz L, Malhotra V, Dikshit R, et al. Performance criteria for verbal autopsy-based systems to estimate national causes of death: development and application to the Indian Million Death Study. BMC Med. 2014;12:21. | ||
World Health Organization. Georgia. WHO Statistical Profile. Geneva, Switzerland: World Health Organization; 2015. Available from: http://www.who.int/gho/countries/geo.pdf?ua=1. Accessed February 3, 2017. | ||
Rahu M, Vlassov VV, Pega F, et al. Population health and status of epidemiology: WHO European Region I. Int J Epidemiol. 2013;42(3):870–885. | ||
The World Bank. Data: Georgia. Washington: The World Bank; 2017. Available from: https://data.worldbank.org/country/georgia. Accessed February 4, 2017. | ||
Glonti K, Rechel B. Health targets in the former Soviet countries: responding to the NCD challenge? Public Health Rev. 2013;35(1):1–24. | ||
Mikkelsen L, Phillips DE, AbouZahr C, et al. A global assessment of civil registration and vital statistics systems: monitoring data quality and progress. Lancet. 2015;386(10001):1395–1406. | ||
Byfuglien J, Haskl P, Hughes M, et al. Adapted Global Assessment of the National Statistical System of Georgia: Final Version. Geneva, Switzerland: United Nations Economic Commission for Europe (UNECE); 2013. Available from: https://www.unece.org/fileadmin/DAM/stats/documents/technical_coop/GA_Georgia_EN.pdf. Accessed April 11, 2017. | ||
Serbanescu F, Egnatashvili V, Ruiz A, Suchdev D, Goodwin M. Reproductive Health Survey, Georgia 2010: Summary Report. Atlanta, GA: Division of Reproductive Health, Centers for Disease Control and Prevention (DRH/CDC); 2011. | ||
Serbanescu F, Teft M, Shakhnazarova M, Willians D, Berdzuli N, Berg C. Reproductive Age Mortality Study, Georgia 2008 – Part II: maternal mortality. Atlanta, GA: Division of Reproductive Health, Centers for Disease Control and Prevention (DRH/CDC); 2009. | ||
World Health Organization. Verbal Autopsy Standards: Ascertaining and Attributing Causes of Death. Geneva, Switzerland: World Health Organization; 2007. | ||
World Health Organization. International Statistical Classification of Diseases and Related Health Problems 10th Revision, Edition 2010. Geneva, Switzerland: World Health Organization; 2010. Available from: http://apps.who.int/classifications/icd10/browse/2010/en. Accessed March 15, 2015. | ||
World Health Organization. The WHO Application of ICD-10 to Deaths During Pregnancy, Childbirth and the Puerperium: ICD-MM. Geneva, Switzerland: World Health Organization; 2012. Available from: http://apps.who.int/iris/bitstream/10665/70929/1/9789241548458_eng.pdf?ua=1. Accessed March 20, 2015. | ||
World Health Organization special tabulation lists for mortality and morbidity; mortality tabulation list 1. International Statistical Classification of Diseases and Health Related Problems – 10th Revision. Vol 1. Geneva, Switzerland: World Health Organization; 1993:1207–1210. | ||
Landis JR, Koch GG. The measurement of observer agreement for categorical data. Biometrics. 1977;33(1):159–174. | ||
Mackinnon A. A spreadsheet for the calculation of comprehensive statistics for the assessment of diagnostic tests and inter-rater agreement. Comput Biol Med. 2000;30(3):127–134. | ||
Nam JM, Blackwelder WC. Analysis of the ratio of marginal probabilities in a matched-pair setting. Stat Med. 2002;21(5):689–699. | ||
NCSS 11 Statistical Software. NCSS, LLC. Kaysville, UT, USA: 2016. Available from: https://www.ncss.com/software/ncss/. Accessed April 2, 2017. | ||
National Statistics Office of Georgia. Statistical Yearbook of Georgia 2013. Tbilisi, Georgia: National Statistics Office; 2013. | ||
Ahmad OE, Boschi-Pinto C, Lopez AD, Murray JL, Lozano R, Inoue M. Age Standardization of Rates: A New WHO Standard GPE. Discussion Paper Series: No. 31. Geneva, Switzerland: World Health Organization; 2001. | ||
Rothman KJ, Greenland S, Lash TL. Modern Epidemiology. 3rd ed. Philadelphia, PA: Lippincott Williams and Wilkins; 2008. Available from: https://www.krothman.org/episheet.xls Accessed January 27, 2017. | ||
IBM. SPSS Statistics for Windows, Version 21.0. Armonk, NY: IBM Corp.; 2012. | ||
Danilova I, Shkolnikov VM, Jdanov DA, Meslé F, Vallin J. Identifying potential differences in cause-of-death coding practices across Russian regions. Popul Health Metr. 2016;14:8. | ||
Värnik P, Sisask M, Värnik A, et al. Massive increase in injury deaths of undetermined intent in ex-USSR Baltic and Slavic countries: hidden suicides? Scand J Public Health. 2010;38(4):395–403. | ||
Värnik P, Sisask M, Värnik A, et al. Validity of suicide statistics in Europe in relation to undetermined deaths: developing the 2–20 benchmark. Inj Prev. 2012;18(5):321–325. | ||
Hill K, Lopez AD, Shibuya K, Jha P; Monitoring of Vital Events (MoVE). Interim measures for meeting needs for health sector data: births, deaths, and causes of death. Lancet. 2007;370(9600):1726–1735. | ||
Wang L, Yang G, Jiemin M, et al. Evaluation of the quality of cause of death statistics in rural China using verbal autopsies. J Epidemiol Community Health. 2007;61(6):519–526. | ||
Joubert J, Bradshaw D, Kabudula C, et al. Record-linkage comparison of verbal autopsy and routine civil registration death certification in rural north-east South Africa: 2006–2009. Int J Epidemiol. 2014;43(6):1945–1958. | ||
Malvezzi M, Carioli G, Rodriguez T, Negri E, La Vecchia C. Global trends and predictions in ovarian cancer mortality. Ann Oncol. 2016;27(11):2017–2025. | ||
World Health Organization. Global Status Report On Noncommunicable Diseases. Geneva, Switzerland: World Health Organization; 2014. | ||
Institute for Health Metrics and Evaluation, Human Development Network, The World Bank. The Global Burden of Disease: Generating Evidence, Guiding Policy – Europe and Central Asia Regional Edition. Seattle, WA: IHME; 2013. | ||
Beyond the mortality advantage: investigating women’s health in Europe. Copenhagen, Denmark: WHO Regional Office for Europe; 2015. Available from: http://www.euro.who.int/en/health-topics/health-determinants/gender/publications/2015/beyond-the-mortality-advantage.-investigating-womens-health-in-europe. Accessed May 5, 2017. | ||
World Health Organization. Noncommunicable Diseases (NCD) Country Profiles, 2014: Georgia. Geneva, Switzerland: World Health Organization; 2014. Available from: http://www.who.int/nmh/countries/geo_en.pdf. Accessed February 20, 2017. | ||
World Health Organization. Georgia STEPS Survey 2010: Fact Sheet. Geneva, Switzerland: World Health Organization; 2010. Available from: http://www.who.int/chp/steps/Georgia_2010_Fact_Sheet.pdf. Accessed February 20, 2017. | ||
Berg CJ, Aslanikashvili A, Djibuti M. A Cross-sectional study examining youth smoking rates and correlates in Tbilisi, Georgia. Biomed Res Int. 2014;2014:476438. | ||
Forouzanfar MH, Foreman KJ, Delossantos AM, et al. Breast and cervical cancer in 187 countries between 1980 and 2010: a systematic analysis. Lancet. 2011;378(9801):1461–1484. | ||
Tsu VD, Jeronimo J, Anderson BO. Why the time is right to tackle breast and cervical cancer in low-resource settings. Bull World Health Organ. 2013;91(9):683–690. | ||
Weiderpass E, Labrèche F. Malignant tumors of the female reproductive system. Saf Health Work. 2012;3(3):166–180. | ||
Hirte L, Nolte E, Bain C, McKee M. Breast cancer mortality in Russia and Ukraine 1963–2002: an age-period-cohort analysis. Int J Epidemiol. 2007;36(4):900–906. | ||
Rogovskaya SI, Shabalova IP, Mikheeva IV, et al. Human papillomavirus prevalence and type-distribution, cervical cancer screening practices and current status of vaccination implementation in Russian Federation, the Western countries of the former Soviet Union, Caucasus region and Central Asia. Vaccine. 2013;31(Suppl 7):H46–H58. | ||
Bray F, Lortet-Tieulent J, Znaor A, Brotons M, Poljak M, Arbyn M. Patterns and trends in human papillomavirus-related diseases in Central and Eastern Europe and Central Asia. Vaccine. 2013;31(Suppl 7):H32–H45. | ||
Alibegashvili T, Clifford GM, Vaccarella S, et al. Human papillomavirus infection in women with and without cervical cancer in Tbilisi, Georgia. Cancer Epidemiol. 2011;35(5):465–470. | ||
Bednarczyk RA, Butsashvili M, Kamkamidze G, Kajaia M, McNutt LA. Attitudes and knowledge of Georgian physicians regarding cervical cancer prevention, 2010. Int J Gynaecol Obstet. 2013;121(3):224–228. | ||
Georgia National Screening Center. National Screening Program. Available from: http://www.gnsc.ge/?act=page&id=44&lang=en. Accessed June 1, 2017. | ||
Feichtinger M, Rodriguez-Wallberg KA. Fertility preservation in women with cervical, endometrial or ovarian cancers. Gynecol Oncol Res Pract. 2016;3:8. | ||
Bertuccio P, Levi F, Lucchini F, et al. Coronary heart disease and cerebrovascular disease mortality in young adults: recent trends in Europe. Eur J Cardiovasc Prev Rehabil. 2011;18(4):627–634. | ||
Nichols M, Townsend N, Scarborough P, Rayner M. Trends in age-specific coronary heart disease mortality in the European Union over three decades: 1980–2009. Eur Heart J. 2013;34(39):3017–3027. | ||
Levit RD, Reynolds HR, Hochman JS. Cardiovascular disease in young women: a population at risk. Cardiol Rev. 2011;19(2):60–65. | ||
Garcia M, Mulvagh SL, Merz CN, Buring JE, Manson JE. Cardiovascular disease in women: clinical perspectives. Circ Res. 2016;118(8):1273–1293. | ||
Putaala J. Ischemic stroke in the young: current perspectives on incidence, risk factors, and cardiovascular prognosis. Eur Stroke J. 2016;1(1):20–40. | ||
Souza JP, Tunçalp Ö, Vogel JP, et al. Obstetric transition: the pathway towards ending preventable maternal deaths. BJOG. 2014;1(Suppl 1)1:1–4. | ||
Stvilia K, Tsertsvadze T, Sharvadze L, et al. Prevalence of hepatitis C, HIV, and risk behaviors for blood-borne infections: a population-based survey of the adult population of T’bilisi, Republic of Georgia. J Urban Health. 2006;83(2):289–298. | ||
Shapatava E, Nelson KE, Tsertsvadze T, del Rio C. Risk behaviors and HIV, hepatitis B, and hepatitis C seroprevalence among injection drug users in Georgia. Drug Alcohol Depend. 2006;82(Suppl 1):S35–S38. | ||
Mokdad AA, Lopez AD, Shahraz S, et al. Liver cirrhosis mortality in 187 countries between 1980 and 2010: a systematic analysis. BMC Med. 2014;12:145. | ||
Clifford GM, Waterboer T, Dondog B, et al. Hepatitis C virus seroprevalence in the general female population in 9 countries in Europe, Asia and Africa. Infect Agent Cancer. 2017;12:9. | ||
Richards DC, Mikiashvili T, Parris JJ, et al. High prevalence of hepatitis C virus but not HIV co-infection among patients with tuberculosis in Georgia. Int J Tuberc Lung Dis. 2006;10(4):396–401. | ||
Peng YC, Lin CL, Hsu WY, Chang CS, Yeh HZ, Kao CH. Risk of liver cirrhosis in patients with tuberculosis: a nationwide cohort study. Eur J Clin Invest. 2015;45(7):663–669. | ||
Lin YT, Wu PH, Lin CY, et al. Cirrhosis as a risk factor for tuberculosis infection – a nationwide longitudinal study in Taiwan. Am J Epidemiol. 2014;180(1):103–110. | ||
Mdivani N, Zangaladze E, Volkova N, et al. High prevalence of multidrug-resistant tuberculosis in Georgia. Int J Infect Dis. 2008;12(6):635–644. | ||
Lomtadze N, Aspindzelashvili R, Janjgava M, et al. Prevalence and risk factors for multidrug-resistant tuberculosis in Republic of Georgia: a population based study. Int J Tuberc Lung Dis. 2009;13(1):68–73. | ||
World Health Organization. Global Tuberculosis Report 2013. WHO/HTM/TB/2013.11. Geneva, Switzerland: World Health Organization; 2013. Available from: http://apps.who.int/iris/bitstream/10665/91355/1/9789241564656_eng.pdf. Accessed June 19, 2017. | ||
Benova L, Mohamoud YA, Calvert C, Abu-Raddad LJ. Vertical transmission of hepatitis C virus: systematic review and meta-analysis. Clin Infect Dis. 2014;59(6):765–773. | ||
World Health Organization. Tuberculosis in Women. Geneva: Switzerland: World Health Organization; 2016. Available from: http://www.who.int/tb/publications/tb_women_factsheet_251013.pdf. Accessed June 17, 2017. | ||
World Health Organization. Progress in the Prevention of Injuries in the WHO European Region: Georgia. Copenhagen, Denmark: World Health Organization Regional office for Europe; 2013. Available from: http://www.euro.who.int/__data/assets/pdf_file/0010/98713/Georgia.pdf?ua=1. Accessed July 3, 2017. | ||
World Health Organization. Injuries in Europe: A Call for Public Health Action. Copenhagen, Denmark: World Health Organization Regional Office for Europe; 2014. Available from: http://www.euro.who.int/__data/assets/pdf_file/0011/252569/Injuries-in-WHO-European-Region-A-call-for-public-health-action-Eng-revised.pdf?ua=1. Accessed July 5, 2017. | ||
World Health Organization. Global Status Report on Road Safety 2015. Geneva, Switzerland: World Health Organization; 2015. Available from: http://www.who.int/violence_injury_prevention/road_safety_status/2015/en/. Accessed July 7, 2017. | ||
World Health Organization. Preventing Suicide: A Global Imperative. Geneva, Switzerland: World Health Organization; 2014. Available from: http://apps.who.int/iris/bitstream/10665/131056/1/9789241564779_eng.pdf?ua=1&ua=1. Accessed July 10, 2017. | ||
World Health Organization. Global Status Report On Violence Prevention 2014. Geneva, Switzerland: World Health Organization; 2014. Available from: http://www.who.int/violence_injury_prevention/violence/status_report/2014/en/. Accessed July 11, 2017. | ||
Kolves K, Milner A, Varnik P. Suicide rates and socioeconomic factors in Eastern European countries after the collapse of the Soviet Union: trends between 1990 and 2008. Sociol Health Illn. 2013;35(6):956–970. | ||
Waltermaurer E, Butsashvili M, Avaliani N, Samuels S, MacNutt LA. An examination of domestic partner violence and its justification in the Republic of Georgia. BMC Womens Health. 2013;13:44. | ||
Faramarzi M, Esmailzadeh S, Mosavi S. A comparison of abused and non-abused women’s definitions of domestic violence and attitudes to acceptance of male dominance. Eur J Obstet Gynecol Reprod Biol. 2005;122(2):225–231. | ||
Panagioti M, Gooding P, Tarrier N. Post-traumatic stress disorder and suicidal behavior: a narrative review. Clin Psychol Rev. 2009;29(6):471–482. | ||
Makhashvili N, Chikovani I, McKee M, Bisson J, Pattel V, Roberts B. Mental disorders and their association with disability among internally displaced persons and returnees in Georgia. J Trauma Stress. 2014;27(5):509–518. | ||
Soleman N, Chandramohan D, Shibuya K. Verbal autopsy: current practices and challenges. Bull World Health Organ. 2006;84(3):239–245. | ||
Lozano R, Lopez AD, Atkinson C, Naghavi M, Flaxman AD, Murray CJ; Population Health Metrics Research Consortium (PHMRC). Performance of physician-certified verbal autopsies: multisite validation study using clinical diagnostic gold standards. Popul Health Metr. 2011;9:32. |
 © 2018 The Author(s). This work is published and licensed by Dove Medical Press Limited. The full terms of this license are available at https://www.dovepress.com/terms.php and incorporate the Creative Commons Attribution - Non Commercial (unported, v3.0) License.
By accessing the work you hereby accept the Terms. Non-commercial uses of the work are permitted without any further permission from Dove Medical Press Limited, provided the work is properly attributed. For permission for commercial use of this work, please see paragraphs 4.2 and 5 of our Terms.
© 2018 The Author(s). This work is published and licensed by Dove Medical Press Limited. The full terms of this license are available at https://www.dovepress.com/terms.php and incorporate the Creative Commons Attribution - Non Commercial (unported, v3.0) License.
By accessing the work you hereby accept the Terms. Non-commercial uses of the work are permitted without any further permission from Dove Medical Press Limited, provided the work is properly attributed. For permission for commercial use of this work, please see paragraphs 4.2 and 5 of our Terms.