")
Back to Journals » Journal of Healthcare Leadership » Volume 7
Leadership in dentistry: findings from new tool to measure clinical leadership
Authors Hill H, Brocklehurst P
Received 17 February 2015
Accepted for publication 9 March 2015
Published 11 June 2015 Volume 2015:7 Pages 13—20
DOI https://doi.org/10.2147/JHL.S82994
Checked for plagiarism Yes
Review by Single anonymous peer review
Peer reviewer comments 2
Editor who approved publication: Professor Russell Taichman
Harry Hill,1 Paul Brocklehurst2
1The Manchester Centre for Health Economics and School of Dentistry, University of Manchester, Manchester, UK; 2School of Dentistry, University of Manchester, Manchester, UK
Background: In England, the recent reorganization of the National Health Service has led to the development of local dental networks and an emerging narrative on the importance of clinical leadership in dentistry. Analogous to clinical commissioning groups, local dental networks ensure general dental practitioners (GDPs) influence the delivery of local services. However, little is known about what GDPs think clinical leadership is and whether the construct has meaning. The aim of this study was to explore the structure of a pilot questionnaire to determine the qualities that GDPs deem are important and to use a data reduction methodology to produce a tool to measure clinical leadership.
Methods: A 61-item questionnaire was distributed to GDPs across the North West of England. GDPs were asked to rate the level of importance of each item using a 7-point Likert scale. Principal component analysis and direct oblimin rotation was used to examine for factor loadings within the questionnaire. Internal validity was tested by Cronbach's alpha.
Results: Two principle factors emerged: “how to lead” and “how not to lead”. Individually, the item “I think it is important to have integrity” was rated as the most important.
Conclusion: The study developed a refined questionnaire that captures the important qualities of clinical leadership in dentistry. This is the first questionnaire that has been developed to capture important leadership attributes for GDPs.
Keywords: pilot questionnaire, leadership questionnaire, exploratory factor analysis, confirmatory factor analysis
Introduction
Clinical leadership has been described as a key driver in the recent reorganization of the UK National Health Service (UKNHS).1 The narrative used in UK government documents would suggest that putting clinicians at the center of local commissioning decisions improves the quality of care delivered.2 In dentistry, this reorganization has culminated in the development of local dental networks (LDNs). LDNs are analogous to clinical commissioning groups in medicine and act as a platform to enable general dental practitioners (GDPs) to work alongside NHS England, Public Health England and local authorities to ensure local dental services are “clinically led, patient and outcome focused”.3 In dentistry in the UK, GDPs are the front-line clinicians and deliver the bulk of service provision in primary care.
Leadership has been the subject of a substantive amount of research in the literature.4,5 It has also become the subject of increasing interest in health care, given this implied link between leadership and quality.2,6,7 In the NHS, clinical leadership has been identified as the most important determinant to improve patient safety and quality.8 This has led to a plethora of frameworks purported to develop leadership within a clinical setting. The Leadership Qualities Framework9 and the Clinical Leadership Competency Framework10 provided a general framework aimed at all medical staff, whilst the Medical Leadership Competency Framework11 was specifically aimed at hospital doctors. More recently, the Healthcare Leadership Model has been developed based on nine dimensions of leadership behavior.12 However, leadership development for primary care physicians has only been a relatively recent policy goal,13 and it has been absent for GDPs.
This focus on the importance of clinical leadership within the NHS is not without its critique. Martin and Learmonth14 and Checkland15 have both highlighted how the term can be used as a rhetorical device to decentralize the NHS, moving responsibility away from the government, such that future failure would be seen as a lack of clinical leadership at a micro level, rather than due to any structural or budgetary constraints at a macro level. A precise definition of what leadership is can also prove elusive, and many definitions assume that it “belongs” to an individual, rather than being the product of a complex social interaction.16 Checkland15 also argues that circularity is a common problem with the rhetoric used; positive behaviors being identified post hoc and labeled as “good leadership”, with the inference that they are either causal or exist a priori. Despite this critique, there has been a rapid growth in leadership training, and the NHS Leadership Academy17 has developed a framework with a number of domains that are purported to be important for the clinical leader, despite a lack of empirical evidence.
In earlier qualitative studies in dentistry, leadership was considered to be important by GDPs in Greater Manchester. However, a precise definition was not forthcoming; both “leadership as the individual” and “leadership as the relationship” were articulated.18 In an analysis of an oral health promotion program run by the LDN across Greater Manchester, the importance of “clinically led and clinically owned” projects was demonstrated, but again, the precise role of leadership was unclear.19
In the survey design research literature, factor analysis techniques are commonly used to create and then validate psychometric scales. The procedure removes redundant survey items within a questionnaire and collates observed survey items together, according to the similarity of their ranking. This enables researchers to capture complex phenomena that are not directly measurable by a single question.20 These common subscales are known as factors and measure the unobservable or latent components that summarize the variance in the individually observed survey items. Two main methods exist, exploratory factor analysis (EFA), where no subscale structure is articulated a priori, and confirmatory factor analysis (CFA), which tests responses against a pre-articulated subscale structure.
An earlier paper described a simple data reduction methodology on the leadership questionnaire, which had been returned by over 400 GDPs across the North West of England.21 The aim of this study was to use both EFA and CFA to further explore the psychometric properties of the pilot questionnaire in more detail.
Methods
Procedure
Ethical approval was provided by the University of Manchester Ethics Committee (UREC_AJ/ethics/0805/13). The 61 items used in the pilot questionnaire were developed from existing research on leadership, the NHS Leadership Framework, and earlier cognitive and qualitative studies.16–19 The participants were asked to rate each item on a 7 point Likert scale according to how important they thought it was for clinical leadership. The questionnaire was distributed once to all GDPs across the North West of England.
Preliminary analysis
The dataset was initially evaluated for appropriateness for factor analysis by utilizing the Kaiser–Meyer–Olkin (KMO) measure to test whether the partial correlations among the items were small. The KMO measure ranges from 0 to 1 and factor analysis is considered appropriate when it lies at or above 0.5.22 Bartlett’s test of sphericity was then undertaken to determine whether the correlation matrix was an identify matrix, ie, whether the diagonal elements were equal to unity and whether off-diagonal elements were equal to zero.23
Exploratory factor analysis
Analysis was undertaken using EFA, and this was then followed by CFA to validate its structure (n=237). To undertake the EFA, a principal component analysis (PCA) method was chosen using a rotation that yielded inter-factor correlations greater than 0.3. The number of factors to retain was determined using a scree test24 and Horn’s parallel analysis (HPA). HPA calculates average eigenvalues from a random dataset and compares them to the factors from the real data. Factors were considered to be valid when their eigenvalues exceeded those that were derived from the random dataset.25 Both structure and pattern matrices were used in the PCA, as the former can be confounded by correlations between factors, and the latter can miss cross-item loadings in the structure matrix.26 Two rules were used for retaining items: 1) those that loaded 0.6 or greater on one factor, but no more than 0.3 on any other factor (factor model 1); and 2) those that loaded 0.6 or greater on one factor, but no more than 0.4 on any other factor (factor model 2). An analysis of the variance of the items that formed the factors was then undertaken using a cut-off point of 0.50 or greater.15
Confirmatory factor analysis
Several fit indices were then used to test which factor model best represented the data: chi-square (χ2), chi-square statistic to degrees of freedom (χ2/df), root mean square error of approximation (RMSEA), Tucker–Lewis index (TLI), comparative fit index (CFI), or the parsimony-adjusted CFI (PCFI). The χ2 statistic tests whether a model’s covariance structure is statistically significantly different from the observed covariance structure in the data. A P-value above 0.05 was considered to indicate a good fit.17 However, as the χ2 statistic can be sensitive to multivariate non-normality, small sample sizes (n=<200) can lead to type II errors, whilst large samples (n=≥200) can yield type I errors. As a result, absolute values were reported, and the χ2 statistic to df was calculated. The χ2/df statistical test penalizes the fit of factor models when they contain a larger number of pathways. For this study, a χ2/df ratio of less than 5 was considered to represent a good fit.16 RMSEA, CFI, and TLI tests were then undertaken. RMSEA tests the residuals in the model, whilst the CFI and TLI determine the extent to which the covariance in the data is reproduced against a model where the observed variables are uncorrelated. Measures range from 0 to 1, and the thresholds chosen were 0.08 and 0.9 for CFI and TLI, respectively. PCFI was also utilized, and accounts for the complexity of the models by multiplying the CFI value by a constant known as the “parsimony ratio”.26 Statistical software Amos Version 5.0 was used for all the analyses.
Item reliability in the revised leadership questionnaire
The revised leadership questionnaire excluded the items that did not sufficiently load onto the underlying constructs according to the two-item retention rules, which distinguished the factor models tested. Subscales for the leadership questionnaire were formed in each factor model by totaling the items that loaded onto each factor. The internal consistency of the subscales was then tested using Cronbach’s alpha (α).
Cronbach’s alpha is a measure of the intercorrelations among test items and is maximized when all items measure the same construct. Hence, it can be interpreted as an indirect measure of the extent to which a set of items that load onto the subscale measures a single unidimensional latent construct.26 As the estimate of reliability increases on the subscale, the fraction of a test score that is attributable to error will decrease. Squaring the alpha score and subtracting from 1.00 produces the index of this measurement error. A recommended cut-off value for score reliability for survey research is α≥0.80.26
Results
Demographics
Of the 998 questionnaires that were mailed to GDPs across Greater Manchester, 237 of the returned questionnaires were useable. This resulted in a response rate of 22.9%. The mean age of the participants was 45.7 years (range, 24–69 years; standard deviation [SD] =11.3), and the mean number of years since qualification was 22.1 years (range, 1–44 years; SD =11.6). Of the respondents, 135 (56.9%) were male and 94 (39.7%) were female (eight questionnaires were incomplete). Of the usable responses, 49.5% (109 of the 220 usable responses) had additional qualifications. Although the response rate was low, the distribution of these key variables appears representative of the GDP population across Greater Manchester.
Preliminary analysis
The KMO measure for the questionnaire was 0.72 and so was above the threshold value set a priori. Bartlett’s test of sphericity was also statistically significant (P<0.001), indicating that the strength of the relationship among the inter-item correlations was sufficiently large to reject the hypothesis that the data were not suitable for EFA.
Exploratory factor analysis
The direct oblimin rotation for the PCA yielded weak inter-factor correlations (0.3 or below), and so the results presented represent those from a varimax (orthogonal) rotation. The scree test highlighted a clear and definite break in the curve at two factors, which was confirmed by the HPA. The two retained factors explained 57.12% of the total variance observed in the data. Eigenvalues, variance explained by each factor and item along with pattern and structure matrixes, are described in Tables 1 and 2. After studying the items loadings on the pattern matrix, the two factors were labeled as “how to lead” and “how not to lead”. The former contained 30 items in factor model 1 and 32 items in factor model 2; the latter factor contained two items in factor model 1 and eleven items in factor model 2.
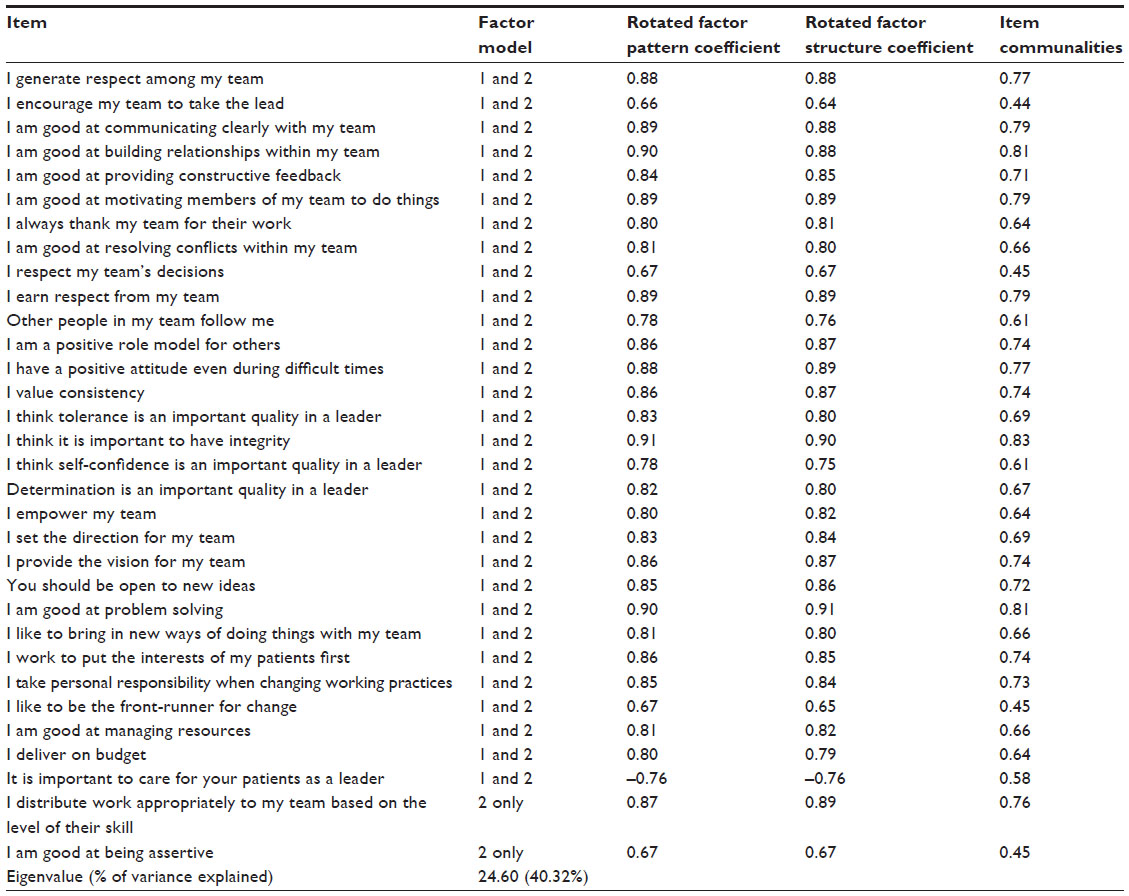 | Table 1 Items that load onto “good leadership” |
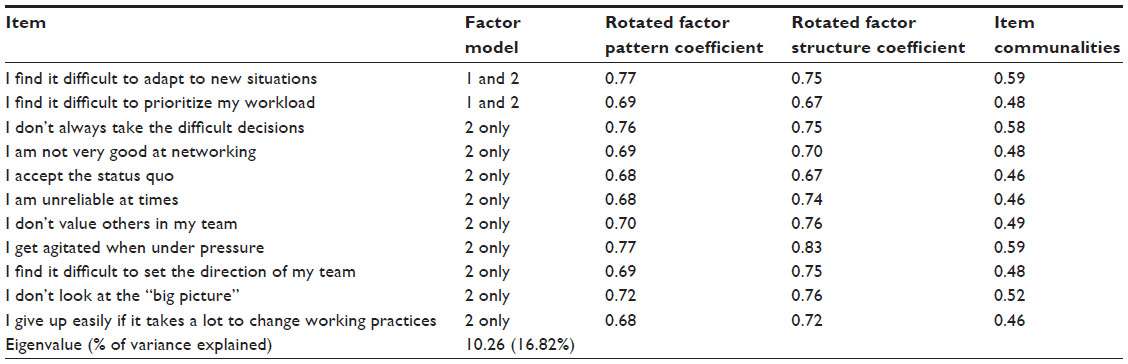 | Table 2 Items that load onto “poor leadership” |
The item communalities for the former how to lead factor ranged from 0.44 to 0.83 with a median of 0.43. The item communalities for the latter latent factor ranged from 0.44 to 0.83 with a median of 0.48. Individually, the item “I think it is important to have integrity” had the highest communality value (0.83), and the item “I encourage my team to take the lead” had the lowest value (0.44).
Table 3 summarizes each factor model. The mean score on the items that form the how to lead factor was 5.97, meaning the respondents were most likely to answer, “Agree” to statements expressing that their actions and attitudes in the workplace were congruent with good leadership. The mean score on the items that formed the how not to lead factor was 3.44 in factor model 1 and 2.96 in factor model 2, meaning the respondents were most likely to answer, “Disagree somewhat” to statements expressing that their actions and attitudes in the workplace were in congruence with poor leadership. There is little observed variation (0.03) in item scores around the mean in both factor models.
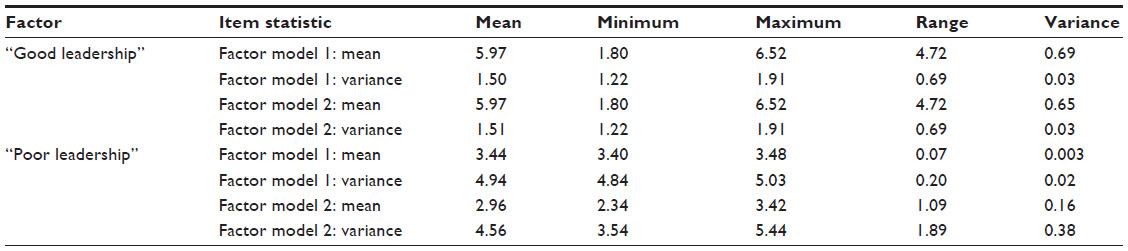 | Table 3 Summary statistics of items that load onto each factor |
Confirmatory factor analysis
The results of the CFA are provided in Table 4. Both models were significant for the χ2 test, whereas the χ2/df for factor model 2 was smaller (2.52) than for factor model 1 (2.79), although both ratios were small enough to indicate an acceptable fit. The RMSEA value for factor model 2 was smaller than for factor model 1 (0.080 and 0.087, respectively), again suggesting a better model fit. The TLI found values of 0.86 and 0.85 for the two models, and factor model 1 performed marginally better than factor model 2 for the CFI test (0.89 versus 0.86, respectively). When the complexity of the two models (df) was taken into account, PCFI was found to be 0.78 for both.
 | Table 4 Measures of models fit for the CFA |
Analyses of the factor subscales
The results of the subscale analysis are provided in Table 5. The alpha scores for both subscales are above 0.9 in factor model 2. This confirms that the sample of items is strongly unidimensional, so the two subscales created would appear internally valid. The how not to lead alpha score in factor model 1 (α=0.62) was much lower than the same score in factor model 2 (α=0.91). The how to lead score alpha score in factor model 1 (α=0.97) was lower than in factor model 2 (α=0.62). The how not to lead alpha score in factor model 1 (α=0.62) was much lower than the score in factor model 2 (α=0.91). Descriptive statistics are provided for each subscale in Table 5. It is evident that the data are not overdispersed on the scales in each factor model, as the SD values are lower than the corresponding means.
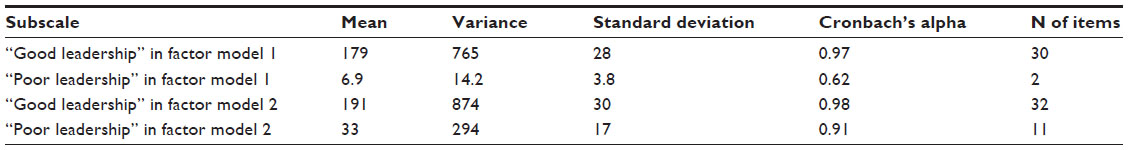 | Table 5 Scale statistics for each factor |
The revised questionnaire
The results for the CFA suggest that when model parameters and parsimony is accounted for (χ2/df and PCFI), factor model 2 was the best fit to the data from the pilot questionnaire. In addition, the score reliability results for the subscales indicate that there was high internal consistency in factor model 2 and that the items that comprised each latent factor were more strongly unidimensional than in factor model 1. Hence, the items that form factors in factor model 2 support the basis of the new leadership questionnaire. The items that are excluded because of their lack of relevance to the two underlying constructs in the survey how to lead and how not to lead are listed in Table 6. Upon inspection, there are no strong similarities in the items that were excluded, which is to be expected if a third underlying latent construct was not identified as a relevant concept to explain the structure of the pilot survey in our findings from EFA.
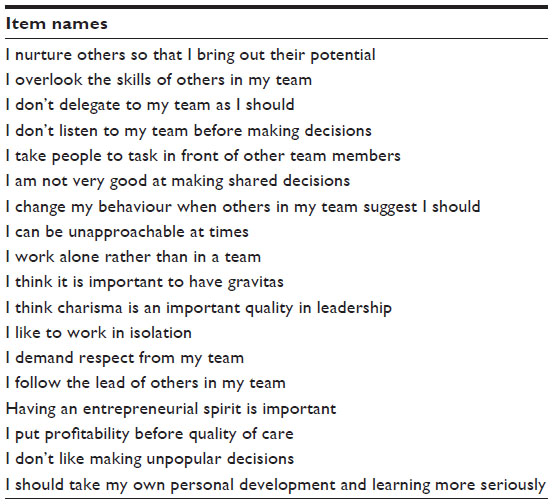 | Table 6 Items found to be redundant on the pilot questionnaire |
Discussion
Common to both factor models was the finding that only two factors emerged: how to lead and how not to lead. This concurs with the preliminary analysis undertaken earlier.21 An examination of the items that loaded onto these two factors showed that only a further two additional items where loaded onto each factor as the rules for each model were tightened (moving from 0.3 to 0.4, ie, from factor model 1 to factor model 2). Taken together, this would appear to suggest that leadership was conceptualized around a simple bipolar construct. This would appear to support the view that leadership is a relatively diffuse concept that remains difficult to define at a subordinate and individualistic level.15 It also appears to undermine the idea that there are multiple domains to leadership.17 Instead, the construct for GDPs has been divided into a set of good behaviors and poor behaviors.
Proponents of the clinical leadership model argue that it is important in improving the quality of care,27 delivering patient outcomes, and improving services.28 According to West et al,8 this emphasis on front-line clinicians delivering change distinguishes clinical leadership from leadership more generally. However, there is a tension here again for GDPs. Earlier qualitative work across Greater Manchester has suggested that many GDPs are so focused on meeting the demands of the current NHS dental contract that they find it difficult to raise their “gaze” from direct patient care to consider the type of strategic objectives that are more associated with the notion of leadership.18,19 This may explain the bipolar understanding of the term, given the lack of opportunities to engage in leadership more broadly.
Despite the limited number of factors elicited by the study, the individual items that were ranked most highly were associated with the relationship within clinical teams. Integrity was scored highly by all the GDPs and would appear to be a closely aligned with the idea of leadership. Other important items were being good at problem solving and building relationships, the ability to communicate clearly, earning respect from the dental team, and being good at motivating peers. This may highlight the potential importance of training for GDPs. Morison and McMullan’s study found that education was vital for developing leadership.30 In a recent study examining the role of a pilot leadership program for GDPs, “many of the practitioners had no pre-conceived idea of leadership or what the program would entail.”30 As a result, recommendations have been made for a formal leadership and development program for dental professionals more generally, not just in relation to the function of the Local Professional Networks (LPNs).31 This development is encouraging, as the Clinical Leadership Competency Framework emphasizes the importance of distributed leadership.10 This places more emphasis on team dynamics and the types of relational processes that help foster leadership. This is important in dentistry, as the LDNs require clinicians who can work across organizations such as the NHS area teams, Public Health England, and the local authorities to produce change at a local level. As Bekas2 highlights, leadership development should be supported by change at an organizational level.
The scale developed in the new leadership survey in the current study provides a powerful tool to measure leadership in an entire dental organization, in a dental team, or just at a practitioner level. It reveals valuable data on how a person views their current leadership performance in dentistry. The scale could be used to reveal key opportunities for leadership development by establishing a compelling rationale for change, focusing leadership development efforts and revealing barriers to organizational change or restructuring. The scale can be utilized in future research to correlate perceptions of dental leadership to productivity, profits, care quality, patients seen, health care treatments delivered, and other bottom line metrics of organizations delivering health care. Other uses include benchmarking clinical leadership to track this metric over time, to compare clinical leadership between different units that deliver oral health care, and to map trends in clinical leadership with clinical and oral health performance indicators.
Conclusion
The psychometric properties of a pilot leadership questionnaire identified two relevant latent constructs: good leadership and poor leadership. Given the range of items that loaded onto each factor and their high internal consistency, the pilot questionnaire would suggest that leadership is a relatively simple bipolar construct among the GDPs sampled.
Acknowledgments
The authors would like to acknowledge and thank Health Education North West for their support and funding of this project. The authors would like to acknowledge and thank the North Western Deanery and the Great Britain Sasakawa Foundation for their support of this study.
Disclosure
The authors report no conflicts of interest in this work.
References
The King’s Fund. Patient-centred Leadership: Rediscovering Our Purpose. London: The King’s Fund; 2013. Available from: http://www.kingsfund.org.uk/sites/files/kf/field/field_publication_file/patient-centred-leadership-rediscovering-our-purpose-may13.pdf. Accessed January 05, 2015. | |
Bekas S. Evaluating leadership development in postgraduate medical education. Leadersh Health Serv. 2014;27(1):31–40. | |
The United Kingdom National Health Service Commissioning Board. Securing Excellence in Commissioning NHS Dental Services. London: National Health Service; 2013. Available from: http://www.commissioningboard.nhs.uk/files/2013/02/commissioning-dental.pdf. Accessed August 4, 2014. | |
Stogdill RM, Bass BM. Handbook of Leadership: A Survey of Theory and Research. 3rd ed. New York: The Free Press; 1990. | |
Nohria N, Khurana R. Handbook of Leadership Theory and Practice: A Harvard Business School Centennial. Boston: Harvard Business Publishing; 2010. | |
Dickinson H, Ham C. Engaging Doctors in Leadership: Review of the literature. Birmingham: University of Birmingham. 2008. | |
Berwick D. A Promise to Learn, a Commitment to Act: Improving the Safety of Patients in England, London: Department of Health; 2013. | |
West M, Eckert R, Steward K, Pasmore B. Developing Collective Leadership for Healthcare. London: The King’s Fund; 2014. | |
National Health Service. Leadership Qualities Framework. London: National Health Service Institute for Innovation and Improvement and Academy of Medical Royal Colleges; 2006. | |
National Health Service. Clinical Leadership Competency Framework. London: National Health Service Leadership Academy; 2011. | |
National Health Service. Medical Leadership Competency Framework. London: National Health Service Institute for Innovation and Improvement and Academy of Medical Royal Colleges; 2010. | |
National Health Service. Leadership Model. London: National Health Service Leadership Academy; 2014. | |
O’Riordan C, McDermott A. Clinical managers in the primary care sector: do the benefits stack up? J Health Organ Manag. 2012;26(4–5):621–640. | |
Martin GP, Learmonth M. A critical account of the rise and spread of ‘leadership’: the case of UK healthcare. Soc Sci Med. 2012;74(3):281–288. | |
Checkland K. Leadership in the NHS: does the emperor have any clothes? J Health Serv Res Policy. 2014;19(4):253–256. | |
Judge TA, Colbert AE, Ilies R. Intelligence and leadership: a quantitative review and test of theoretical propositions. J Appl Psychol. 2004;89(3):542–552. | |
Department of Health. Healthcare Leadership model. London: NHS Leadership Academy, Department of Health; 2014. Available at: http://www.leadershipacademy.nhs.uk/resources/healthcare-leadership-model/. Accessed January 05, 2015. | |
Brocklehurst P, Nomura M, Ozaki T, Ferguson J, Matsuda R. Cultural differences in clinical leadership: a qualitative study comparing the attitudes of general dental practitioners from Greater Manchester and Tokyo. Br Dent J. 2013;215(10):E19. | |
Brocklehurst P, Bridgman C, Davies G. A qualitative evaluation of a Local Professional Network programme “Baby Teeth DO Matter”. Community Dent Health. 2013;30(4):241–248. | |
Swisher LL, Beckstead JW, Bebeau MJ. Factor analysis as a tool for survey analysis using a professional role orientation inventory as an example. Phys Ther. 2004;84(9):784–799. | |
Brocklehurst P, O’Malley L, Hill H, Ozaki T, Nomura M, Matsuda R. The development and piloting of a leadership questionnaire for general dental practitioners: preliminary results from the North West of England and Tokyo. Br Dent J. 2014;217(9):E17. | |
Kaiser HF. An index of factorial simplicity. Psychometrika. 1974; 39(1):31–36. | |
Bartlett MS. A further note on tests of significance in factor analysis. Br J Math Stat. 1951;4(1):1–2. | |
Cattell RB. The scree test for the number of factors. Multivar Behav Res. 1966;1(2):245–276. | |
Horn JL. A rationale and test for the number of factors in factor analysis. Psychometrika. 1965;30(2):179–185. | |
Brown TA. Confirmatory Factor Analysis for Applied Research: Methodology in the Social Sciences. New York: Guilford Press; 2006. | |
Howieson B, Thiagarajah T. What is clinical leadership? A journal based meta-review. Int J Clin Lead. 2011;17(1):7–18. | |
Willcocks SG, Milne P, Milne H. Implementing the MLCF in general practice: implications for development. Br J Health Mgmt. 2013; 19:178–185. | |
Barr J, Dowding L. Leadership in Health Care. 2nd edition. London: Sage Publications; 2012. | |
Morison S, McMullan C. Preparing for the future: challenges and opportunities for management and leadership skills. Br Dent J. 2013; 214(1):E2. | |
Walsh J, Taylor N, Hough D, Brocklehurst P. A qualitative evaluation of a leadership programme for dentists. Leadersh Health Serv. ISSN: 1751–1879 Epub 2014. | |
National Health Service. Shared Leadership: Underpinning of the MLCF. London: Institute for Innovation and Improvement and Academy of Medical Royal Colleges; 2010. |
 © 2015 The Author(s). This work is published and licensed by Dove Medical Press Limited. The full terms of this license are available at https://www.dovepress.com/terms.php and incorporate the Creative Commons Attribution - Non Commercial (unported, v3.0) License.
By accessing the work you hereby accept the Terms. Non-commercial uses of the work are permitted without any further permission from Dove Medical Press Limited, provided the work is properly attributed. For permission for commercial use of this work, please see paragraphs 4.2 and 5 of our Terms.
© 2015 The Author(s). This work is published and licensed by Dove Medical Press Limited. The full terms of this license are available at https://www.dovepress.com/terms.php and incorporate the Creative Commons Attribution - Non Commercial (unported, v3.0) License.
By accessing the work you hereby accept the Terms. Non-commercial uses of the work are permitted without any further permission from Dove Medical Press Limited, provided the work is properly attributed. For permission for commercial use of this work, please see paragraphs 4.2 and 5 of our Terms.