")
Back to Journals » Drug Design, Development and Therapy » Volume 15
LC–MS/MS Estimation of Rociletinib Levels in Human Liver Microsomes: Application to Metabolic Stability Estimation
Authors Attwa MW , Abdelhameed AS , Kadi AA
Received 24 May 2021
Accepted for publication 10 August 2021
Published 15 September 2021 Volume 2021:15 Pages 3915—3925
DOI https://doi.org/10.2147/DDDT.S321330
Checked for plagiarism Yes
Review by Single anonymous peer review
Peer reviewer comments 2
Editor who approved publication: Professor Anastasios Lymperopoulos
Mohamed W Attwa, Ali S Abdelhameed, Adnan A Kadi
Department of Pharmaceutical Chemistry, College of Pharmacy, King Saud University, Riyadh, Saudi Arabia
Correspondence: Ali S Abdelhameed Tel +966 1146 98314
Fax +966 1146 76 220
Email [email protected]
Background: Rociletinib (CO-1686; RLC) is a new, small molecule that is orally administered to inhibit mutant-selective covalent inhibitor of most epidermal growth factor receptor (EGFR)-mutated forms, including T790M, L858R, and exon 19 deletions, but not exon 20 insertions. Non–small-cell lung cancer (NSCLC) with a gene mutation that encodes EGFR is sensitive to approved EGFR inhibitors, but usually resistance develops, which is frequently mediated by T790M EGFR mutation. RLC is an EGFR inhibitor found to be active in preclinical models of EGFR-mutated NSCLC with or without T790M.
Methods: In silico drug metabolism prediction of RLC was executed with the aid of the WhichP450 module (StarDrop software package) to verify its metabolic liability. Second, a fast, accurate, and competent LC-MS/MS assay was developed for RLC quantification to determine its metabolic stability. RLC and bosutinib (BOS) (internal standard; IS) were separated using an isocratic elution system with a C18 column (reversed stationary phase).
Results: The developed LC-MS/MS analytical method showed linearity of 5– 500 ng/mL with r2 ≥ 0.9998 in the human liver microsomes (HLMs) matrix. A limit of quantification of 4.6 ng/mL revealed the sensitivity of the analytical method, while the acquired inter- and intra-day accuracy and precision values below 4.63% inferred the method reproducibility. RLC metabolic stability estimation was calculated using intrinsic clearance (20.15 μL/min/mg) and in vitro half-life (34.39 min) values.
Conclusion: RLC exhibited a moderate extraction ratio indicative of good bioavailability. The developed analytical method herein is the first LC-MS/MS assay for RLC metabolic stability.
Keywords: rociletinib, metabolic stability assessment, in vitro half-life, validated LC-MS/MS methodology
Introduction
Cancer is a major cause of death worldwide. It is responsible for more than one-fourth of deaths globally.1 Recently, molecular targeting strategies have been implemented for the management of disseminated cancer based on the investigations of tumor suppressor genes and oncogenes participating in the progression of human cancers.2 Lung cancer has the highest mortality rate among all cancer types globally. Statistically, in 2012, >1.5 million deaths were linked to lung tumors, which represents 20% of all cancer deaths.3 Most lung cancers (90%) are considered non-small cell lung cancers (NSCLCs), which include various subtypes driven by numerous activated oncogenes.4,5 Gene mutations in the encoding epidermal growth factor receptor (EGFR) are among the most common oncogenic mutations in lung adenocarcinoma.6 At the diagnosis time, approximately 90% of EGFR-mutation-positive patients have one of two activating mutations, an L858R point mutation in exon 21 or an in-frame deletion in exon 19.6
The first- and second-generation EGFR tyrosine kinase inhibitors (TKIs), namely, erlotinib, afatinib, and gefitinib, are highly active against cancers with these mutations, with objective response rates of 50–70%.7–9 But the progress of acquired resistance after treatment periods (9–13 months) is most commonly due to EGFR T790M mutation in resistant cases (50–60%).10,11 Cytotoxic chemotherapy is usually used as there are no approved therapies that precisely target T790M. After the emergence of T790M, the median survival period is less than two years.11
Rociletinib (CO-1686; RLC) is a potent 5-CF3 2,4-diaminopyrimidine-based orally available molecule that consists of a reactive acrylamide group, an aminopyrimidine group, and a piperazine ring.12 RLC was developed by Clovis Oncology, Inc. (Nasdaq: CLVS). RLC (Figure 1) is a mutant-selective covalent inhibitor of commonly mutated forms of EGFR, including exon 19 deletions, L858R, and T790M, but not exon 20 insertions. Preclinical studies have verified that RLC has less activity against wild-type EGFR. In contrast, currently approved EGFR tyrosine kinase inhibitors lead to considerable inhibition of nonmutant EGFR, causing diarrhea and rash as their two dose-limiting and most frequent side effects. RLC showed durable tumor shrinkage in xenograft models with EGFR-activating mutations either alone or combined with T790M resistance mutations,12 which was most noticeable when plasma concentrations were kept at more than 200 ng/mL across the dosing interval. Therefore, Phase 1–2 study of RLC was performed in patients with EGFR-mutated NSCLC with acquired resistance to first- or second-generation EGFR TKIs.
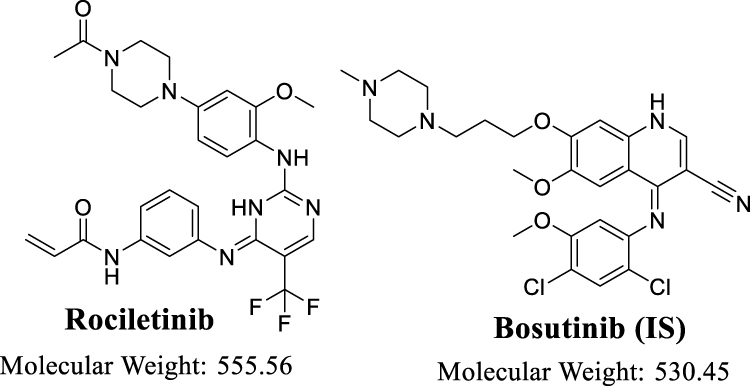 |
Figure 1 Chemical structures of rociletinib and bosutinib (internal standard; IS). |
Before commencing in vitro metabolic stability experiments, RLC should be checked for its lability to drug metabolism in the liver. Thus, we performed in silico metabolic stability for RLC using the WhichP450 software. Nevertheless, no chromatographic methods reported for the RLC estimation in HLMs matrix with the application of metabolic stability assessment. Thus, this study aimed to develop a validated liquid chromatography-mass spectrometry (LC-MS/MS) analytical assay for estimating RLC levels in the HLMs matrix. Such a method was used to figure the in vitro half-life (t1/2) and intrinsic clearance (CLint) of RLC.13 Thus, in silico and in vitro experiments for RLC metabolic stability determination were performed to give more information about its metabolic rate and to allow in vivo bioavailability estimation.
To determine in vivo metabolism rate using in vitro metabolism data, three basic models could be used: Parallel tube, dispersion, and venous equilibrium.14,15 Here, the RLC in vitro half-life (t1/2) and intrinsic clearance in HLMs were computed by an ‘in vitro t1/2ʹ approach using the “well-stirred” model16,17 as it is the frequently used model in drug metabolism experiments owing to its simplicity. Such parameters (intrinsic clearance and in vitro t1/2) can be used to calculate numerous physiological factors (eg, liver clearance and in vivo t1/2). The drug bioavailability estimation gives a clear approach to expect its in vivo metabolic mechanisms. If the tested drug experiences rapid metabolism, it shall show reduced in vivo bioavailability value and a short duration of action.13,18–21
Materials and Methods
Materials and Instruments
Male human liver microsomes (product number: M0567, Pooled HLMs) were procured from Sigma-Aldrich (West Chester, PA, USA) and then kept at −70°C until use. HLMs contain a mixture of HLMs pooled from different human donors. As stated in the product information sheet: The protein content of HLMs was determined as 20 mg/mL (250 mM sucrose). All solvents used in the current experimental work were of high-performance liquid chromatography (HPLC) grade. All reference powders and other chemicals are of analytical (AR) grade. RLC (Cat. No.: HY-15729 at purity: 99.45%) and bosutinib (Cat. No.: HY-10158 at purity: 99.96%) were purchased from MedChem Express Company (Woburn, MA, USA). Formic acid and acetonitrile were purchased from Sigma-Aldrich Company (West Chester, PA, USA). Purified water was arranged using an in-house Milli-Q plus purification system from Millipore (Millipore, Bedford, MA, USA).
RLC Metabolic Vulnerability Evaluation Using the WhichP450 Module
Characterization of RLC lability for metabolism was executed via the WhichP450 module of the StarDrop software. The composite site lability (CSL) value was utilized to infer the degree of metabolism.22–25
LC-MS/MS Analytical System
Analytical parameters including liquid chromatographic conditions and mass spectrometric parameters were optimized to attain a good resolution of RLC and bosutinib (BOS: Internal standard, IS) with adequate sensitivity. Analytical parameters for the liquid chromatographic resolution of BOS and RLC, which involves separating analytes, including stationary phase nature, pH, and mobile phase constituents, were optimized. The pH of the 0.1% formic acid solution was adjusted to 3.2 as an increased pH value caused an increased retention time and peak tailing. The mobile phase was composed of 55% aqueous solution (0.1% formic acid in H2O) and 45% organic solvent (0.1% formic acid in ACN). Increasing the organic solvent percentage generated unresolved peaks and a bad separation, while decreasing the percentage resulted in a run time increase. Various stationary phases were checked, such as HILIC columns (polar columns); however, neither BOS nor RLC was retained, and the best results were achieved utilizing a C18 column (ID: 2.1 mm, PS: 1.8 μm and L: 50 mm).
Mass spectrometric detection was performed using Agilent quadrupole mass analyzer (6410 QqQ) with an electrospray ionization source (interface) that was operated in the positive ionization mode and used for ion generation. Nitrogen gas at a flow rate of 11 L/min was used for droplet spray evaporation inside the source and for fragmentation of ions at 55 psi inside the collision cell. The flow injection analysis program of the autosampler was used for the optimization of the Agilent 6410 QQQ mass spectrometer parameters for ion sensitivity increasing. ESI-positive ionization mode was used for ion generation as it exhibited a higher peak intensity than the negative ionization mode as these drugs are basic in nature. The capillary voltage was adjusted to 4000 V to decrease parent insource fragmentation, which leads to decreased chromatographic peak intensity. ESI temperature was adjusted to 350°C. The Agilent Mass Hunter software was used to control LC-MS/MS and the acquisition of data and outcome analysis. Collision energy (CE) and fragmentor voltage (FV) were adjusted for each mass transition for RLC and BOS. RLC peak (Rt: 2.2) was quantified using the multiple reaction monitoring (MRM) mode (parent to daughter ions) from 556→514 (FV: 135 and CE: 22) and 556→112 (FV: 130 and CE: 25) (Figure 2B). MRM mass transitions for BOS (Rt: 1.1) were 530→141 (FV: 140 and CE: 15) and 530→113 (FV: 135 and CE: 18) (Figure 2A). HLMs matrix-related interference was reduced using the MRM analyzer mode, which resulted in increased established LC-MS/MS analytical method sensitivity (Figure 2).
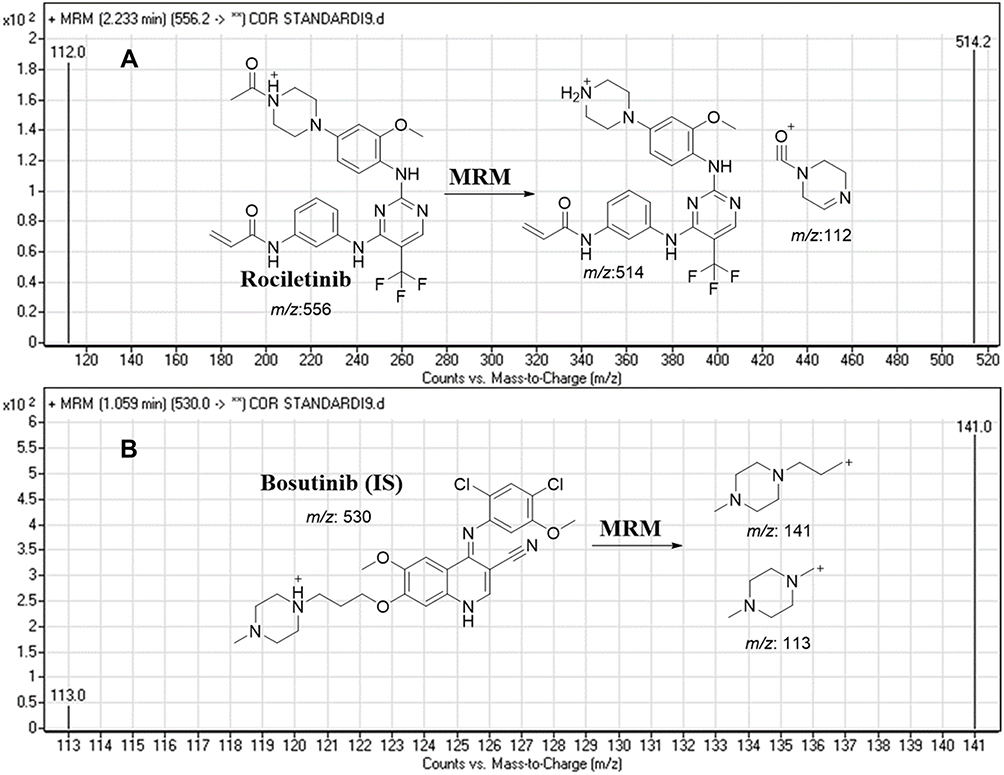 |
Figure 2 MRM mass spectra of rociletinib (RLC) (A) and bosutinib (internal standard; IS) (B) presenting the proposed fragmentation pattern. |
RLC Working Solutions
RLC showed a low dimethyl sulfoxide (DMSO) solubility (2.5 mg/mL), whereas BOS exhibited good DMSO solubility (≥46 mg/mL), so stock solutions (SS) of both analytes were prepared in DMSO at (1 mg/mL) at the permitted solubility range. The mobile phase was used as a solvent for stepwise dilution for both RLC and BOS (IS). The RLC-working solution (WK1: 100 µg/mL) was prepared by ten-fold dilution of RLC SS. RLC WK2 (10 µg/mL) was prepared by ten-fold dilution of WK1. BOS WK3 (2 µg/mL) was prepared by a two-step dilution of the BOS SS.
RLC Calibration Standards
The HLMs matrix was deactivated using DMSO so as to avoid the metabolic effect of microsomal enzymes on the conc. of RLC standards during the analytical method validation. DMSO is used for deactivation process as it will be used later for solubilisation of RLC.26,27 The HLMs matrix was prepared by mixing 30 µL HLMs with a phosphate buffer to the mobile phase (1 mg protein in 1 mL phosphate buffer). Calibration standards were prepared by diluting RLC WK2 with the HLM matrix to yield 11 calibration levels: 5, 15, 30, 50, 80, 100, 150, 200, 300, 400, and 500 ng/mL, which were utilized for the construction of RLC linear calibration curve. Among calibration standards, four levels (5, 15, 150, and 400 ng/mL) were selected as quality controls for the developed LC-MS/MS method: a lower limit of quantification (LLOQ), a lower quality control (LQC), a medium quality control (MQC), and a high-quality control (HQC), respectively. Fifty microliter of BOS WK3 (2 µg/mL) was added as the IS to calibration levels of quality controls (QC). The protein precipitation method was utilized for the extraction of analytes (RLC and BOS) from the HLMs matrix28,29 by adding 2 mL of ACN to the calibration standards. Next, precipitated proteins were removed by centrifugation (14,000 rpm, 12 min) in a thermostated centrifuge (4°C). Filtration of 1-mL supernatant into 1.5-mL HPLC vials using a 0.22 µm syringe filter to confirm its purity, and then 5 µL of the filtrates was injected into the analytical system to estimate its conc. In the same methodology described above, control samples were prepared (without HLMs) to verify the interference absence from matrix components at the retention times of the analytes. A RLC calibration curve was made by plotting RLC exact values (x-axis) versus the peak area ratio of RLC to BOS (y-axis). The LC-MS/MS method linearity was confirmed using the linear regression equation.
Method Validation
Various validation parameters for the established LC-MS/MS method were computed according to guidelines of the bioanalytical method validation that were established by the International Conference on Harmonization (ICH) and the USFDA general regulations. The validation of the developed methodology was done using sensitivity, specificity, linearity precision, accuracy, stability, the matrix effect, and extraction recovery. The statistical method (least squared: y = ax + b) was used to calculate the calibration curve equation for RLC calibration levels. The LOD and LOQ were calculated as recommended by the Pharmacopeia using the intercept standard deviation (SD) and the calibration curve slope:30,31
RLC Metabolic Stability
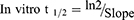
The RLC metabolic clearance involving the intrinsic clearance and in vitro t1/2 was calculated by the determination of remaining RLC conc. after incubation with HLMs, NADPH (cofactor), and 3.3 mM MgCl2 for 50 min in a phosphate buffer (pH 7.4). Briefly, preincubation of 1 µM of RLC (1 µL of 1 mM RLC in DMSO) was performed using 30 µL HLMs matrix (1-mg protein/mL) at 37°C for 10 min to achieve optimum conditions for metabolic reactions. Then, NADPH was added to initiate the metabolic reaction. To verify the results, the same metabolic experiment was repeated three times. The initiation of the metabolic incubation was done by adding NADPH (1 mM). Stopping of the metabolic reaction was done at certain time intervals: 0, 5, 10, 15, 20, 40, 50, 70, 90, and 120 min by adding 2 mL ice-cold ACN. The incubation and extraction procedures were conducted, as mentioned above. Data analysis was performed using the Mass Hunter software. The conc. of RLC at certain time intervals was calculated, and the metabolic stability curve was created. Considering the RLC conc. at 0 min was 100%, and the remaining percentage of RLC was plotted against time. From this plot, linear range points were chosen to construct the curve showing the natural logarithm of the proportion of the remaining RLC over time. The linear part slope of the curve showed the rate constant for the RLC metabolic clearance that was used to compute the in vitro t1/2 utilizing the following equation:
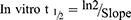
Next, the RLC intrinsic clearance CLint (µL/min/mg) was computed using the next equation:32
The CLint rate could be categorized using the HLMs protein conc. and average liver weights that were reported in the literature.16,33–35
Results and Discussion
In silico RLC Metabolic Lability
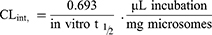
The RLC metabolic landscape provides a suggestion of the lability of the molecule chemical active sites with regard to CYP3A4 enzyme metabolism,36–38 to improve understanding of the generation of RLC metabolites, and to help in designing new chemical structure changes to increase metabolic stability. The IUPAC name of RLC is N-(3-{[2-{[4-(4-Acetyl-1-piperazinyl)-2-methoxyphenyl]amino}-5-(trifluoromethyl)-4-pyrimidinyl]amino}phenyl) acrylamide. This reveals that position C35 and C36 of the acrylamide group, and C1 of the acetyl group are labile to metabolism. In contrast, C17 of the methoxyl group and N4 of the piperazine ring are moderately labile. These outcomes revealed the RLC metabolic instability, which was consistent with the current in vitro experiments. The CSL (0.9942) revealed that it has a high lability area for RLC metabolism; thus, the established method here was used for studying the RLC metabolic stability (Figure 3).
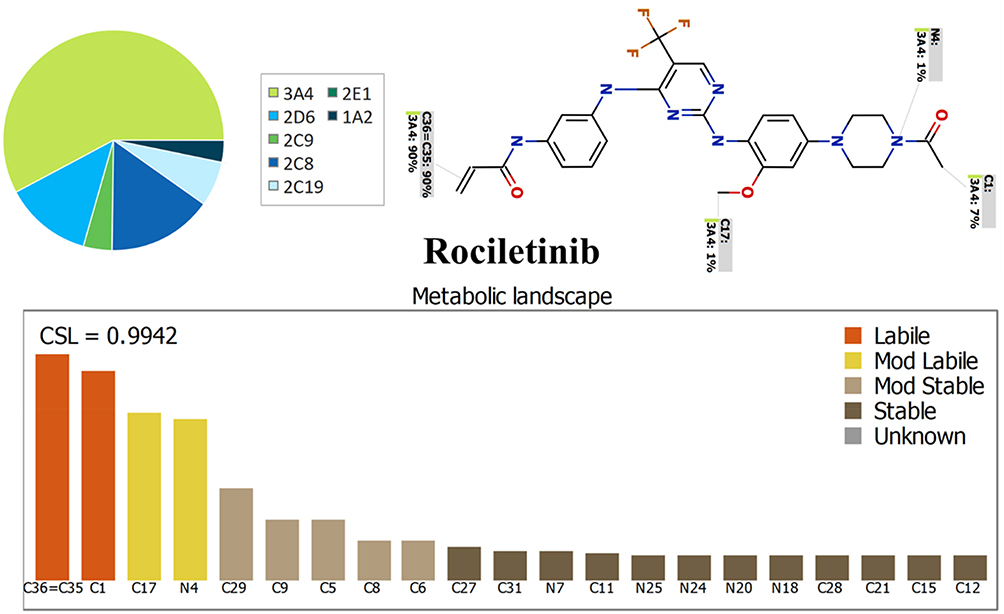 |
Figure 3 Proposed metabolic vulnerability of rociletinib using StarDrop software (WhichP450 module). |
LC–MS/MS Method Development
BOS was selected as the IS in RLC quantification as the protein precipitation extraction could be applied for extracting analytes (RLC and BOS) from the HLMs matrix. RLC and BOS extraction recoveries were 101.60 ± 1.49% and 97.4 ± 3.75%, respectively. The elution time point of the BOS (1.1 min) elution near the RLC (2.2 min) was an indicator of good resolution. Also, the run time was rapid (3 min). RLC and BOS are both TKIs and will not be given together to the same patient; thus, the established LC-MS/MS methodology could be utilized for pharmacokinetics or therapeutic drug monitoring for patients under RLC treatment.
BOS and RLC were eluted at 1.1 min and 2.2 min, respectively, with a satisfactory peak resolution. The run time for the established LC-MS/MS method was 3 min (Figure 4). No noticeable carry-over was seen in the control HLMs matrix chromatograms. Figure 4B shows the RLC calibration standards overlaid with the MRM chromatograms.
 |
Figure 4 Blank + IS sample (Black line) overlaid blank sample (blue line) revealing the absence of any peak at the retention time of rociletinib and bosutinib, (A) and overlaid MRM chromatograms of the RLC calibration levels (B) showing the bosutinib peak (1.1 min) and rociletinib peak (2.2 min). |
Validation Parameters
LC-MS/MS Method Specificity
Figure 4 shows the good separation of the RLC and BOS chromatographic peaks; also, there were no interference chromatographic peaks in the control HLMs matrix at the analyte elution times (Figure 4A), thus, confirming the LC-MS/MS method specificity. In the blank MRM chromatograms, no carry-over influence of RLC and BOS was observed.
LC-MS/MS Method Linearity and Sensitivity
The established method exhibited a linearity of 5–500 ng/mL. The RLC calibration curve regression equation was y = 0.3768x – 0.6074 (r2 = 0.9999) for the analytical method. The RSD values for the 6 replicates of each RLC standard (calibration and QC standards) were <3.80% (Table 1). Back calculations for the eleven RLC standards in the HLMs matrix confirmed the established analytical method’s success. The LOD and LOQ were 1.52 ng/mL and 4.60 ng/mL, respectively.
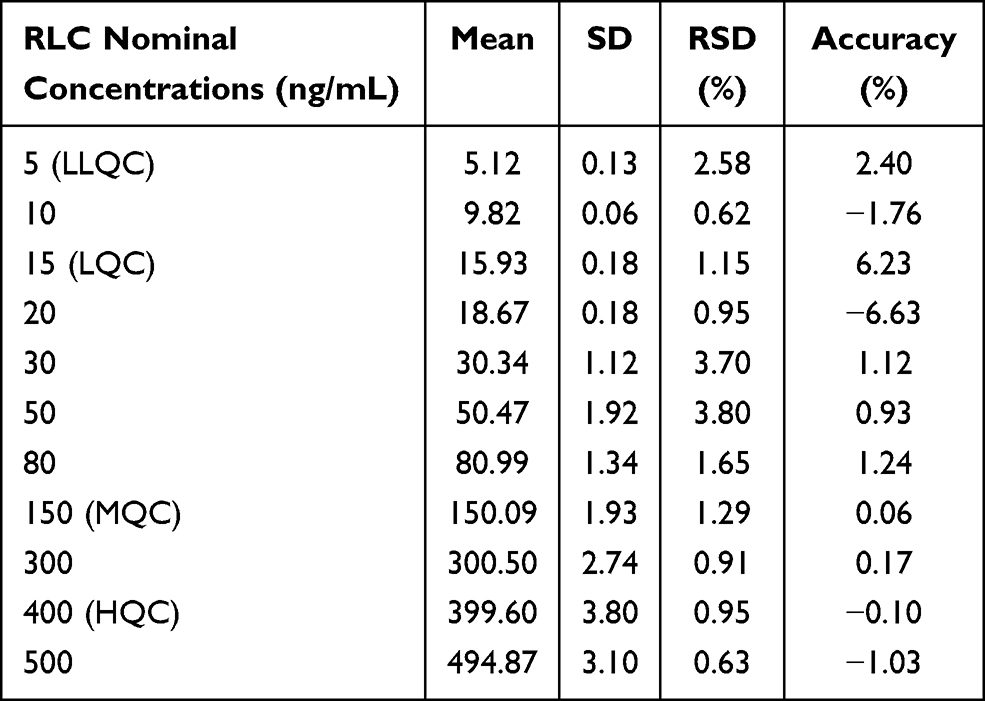 |
Table 1 RLC Back-Calculation of Six Replicates of the Calibration Standards |
LC-MS/MS Method Accuracy and Precision
Accuracy and precision outcomes were in agreement with the FDA guidelines.26,39 The intra- and inter-day accuracy and precision values of the established analytical method were 0.12–3.37 and 0.23–4.63, respectively (Table 2).
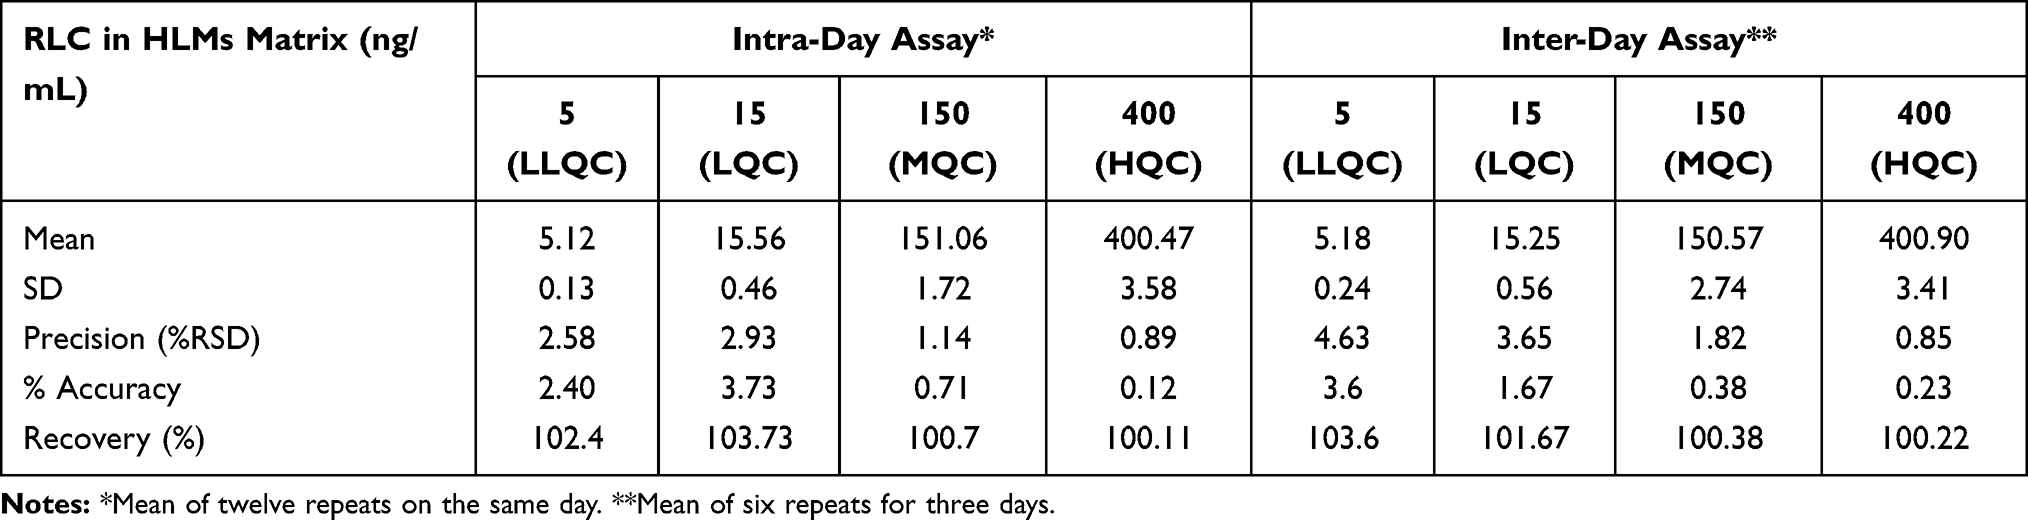 |
Table 2 Intra- and Inter-Day (Precision and Accuracy) of the Developed LC-MS/MS Method |
RLC Extraction Recovery and Matrix Effects of HLMs
The recovery of the RLC QC levels in the spiked HLMs matrix was 101.60 ± 1.49% (RSD < 1.46%) (Table 2). The BOS recovery was 97.4 ± 3.75%. The matrix effect absence on RLC or BOS ionization was confirmed by running two batches of HLMs matrix (set 1 and 2). Set 1-batch was spiked with the RLC LQC (15 ng/mL) and BOS (50 ng/mL), while set 2-batch was performed by replacing the mobile phase for the HLMs matrix. The matrix effects (ME) for RLC and BOS were computed using the next equations:


The HLMs containing RLC and BOS exhibited an ME of 102.53 ± 2.87% and 100.85 ± 3.3%, respectively. The IS normalized ME was calculated using the following equation:
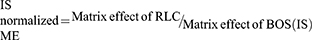
The IS normalized ME was 1.0 and was within the accepted range.27,40 Therefore, these outcomes confirmed that the HLMs matrix showed no observed effect on the ionization degree of either RLC or BOS.
Metabolic Stability
The RLC concentration in in vitro metabolic stability incubations was 1 µM lower than the Michaelis–Menten constant, ensuring the linear relationship between the metabolism ratio against the incubation time intervals (0, 5, 10, 15, 20, 40, 50, 70, 90, and 120 min). HLMs concentration in the incubation mixture was 1 mg protein/mL, confirming the absence of nonspecific protein binding. The RLC conc. was calculated utilizing the regression equation of the simultaneously freshly prepared calibration curve. The RLC metabolic stability curve was established by plotting the incubation time (x-axis) against the RLC percentage remaining (y-axis) (Figure 5A). From the plotted curve, the concentration, which showed linearity (0–40 min) was chosen to construct another curve of time versus the natural logarithm (Ln) RLC remaining (Figure 5B). The slope of the linear portion (0.02239) described the rate constant for RLC metabolism. The linear curve regression equation was Y = –0.02015×X + 4.470 with r2 = 0.939, which was used for calculating RLC in vitro t1/2 (Table 3).21,41–45
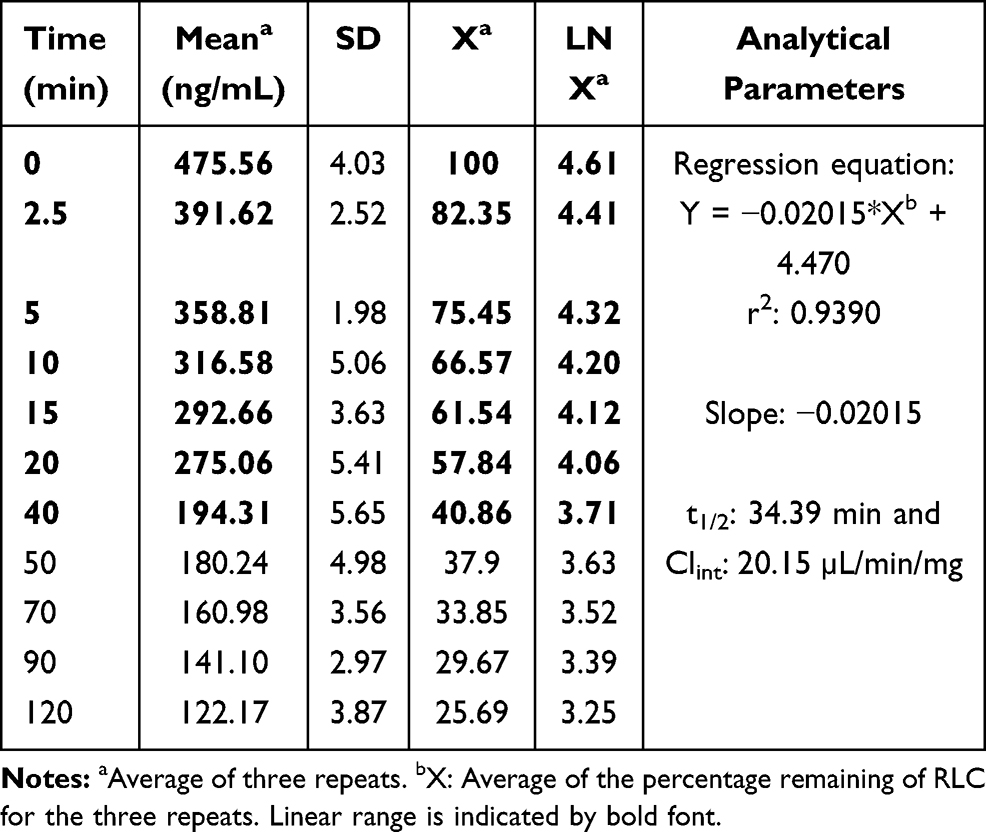 |
Table 3 RLC Metabolic Stability Curve Parameters |
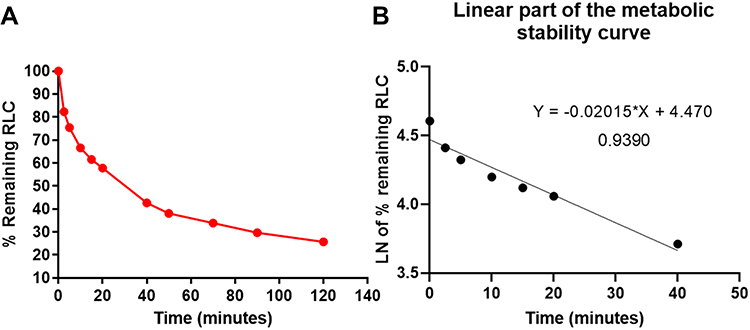 |
Figure 5 The metabolic stability curve of RLC in HLMs (A) and the regression equation of the linear part of the curve (B). |
Using the following equations:

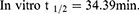
RLC intrinsic clearance was computed utilizing the in vitro t1/2 method as exhibited in the following equation:14,18
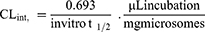

The in vitro t1/2 and Clint of RLC were 34.39 min and 20.15 µL/min/mg, respectively. Depending on these outcomes, it can be proposed that RLC is a medium extraction ratio drug that revealed moderate excretion from the body. This proposes a potentially good bioavailability and a moderate probability of accumulation in the body if compared with other studied TKIs (eg, dacomitinib). Using the simulation software, Cloe PK, these outcomes could also be utilized to propose the RLC in vivo pharmacokinetics.42
Conclusions
An LC-MS/MS assay was constructed and validated to evaluate the metabolic stability of RLC that showed an in vitro t1/2 values (34.39 min) and moderate Clint (20.15 µL·min−1·mg−1), which proposed a moderate rate of RLC hepatic clearance. Based on such results, we predict that RLC can be administered to patients without the effect of dose accumulation or rapid excretion in the human body. The in vitro experimental data was reinforced by in silico the WhichP450 software. More drug discovery studies may be conducted using this approach, which will permit new drug development with an increased metabolic stability profile.
Abbreviations
RLC, rociletinib; ESI, electrospray ionization; HLMs, human liver microsomes; TKIs, tyrosine kinase inhibitors; LC-MS/MS, liquid chromatography tandem mass spectrometry; EGFR, epidermal growth factor receptor; NSCLCs, Non-small cell lung cancers; Clint, intrinsic clearance; t1/2, half-life; ABL, Abelson murine leukemia; MET, met proto-oncogene; ROS1, v-ros UR2 sarcoma virus oncogene homolog 1; Axl, receptor tyrosine kinase.
Ethics Approval
The study design using in vitro experiments with commercially available human liver microsomes exempts it from the need of the Ethics Committees approval.
Acknowledgment
The authors extend their sincere appreciation to the Deanship of Scientific Research at the King Saud University for funding this work through the Research Group Project No. RG-1435-025.
Author Contributions
All authors made a significant contribution to the work reported, whether that is in the conception, study design, execution, acquisition of data, analysis and interpretation, or in all these areas; took part in drafting, revising or critically reviewing the article; gave final approval of the version to be published; have agreed on the journal to which the article has been submitted; and agree to be accountable for all aspects of the work.
Disclosure
The authors report no conflicts of interest for this work.
References
1. Jemal A, Siegel R, Ward E, et al. Cancer statistics. CA Cancer J Clin. 2008;58(2):71–96.
2. Barinaga M. From bench top to bedside. Am Assoc Adv Sci. 1997;278:1036–1039. doi:10.1126/science.278.5340.1036
3. Ferlay J, Soerjomataram I, Dikshit R, et al. Cancer incidence and mortality worldwide: sources, methods and major patterns in GLOBOCAN 2012. Int J Cancer. 2015;136(5):E359–E386. doi:10.1002/ijc.29210
4. Ettinger DS, Akerley W, Bepler G, et al. Non–small cell lung cancer. J Natl Compr Canc Netw. 2010;8(7):740–801. doi:10.6004/jnccn.2010.0056
5. Larsen JE, Cascone T, Gerber DE, Heymach JV, Minna JD. Targeted therapies for lung cancer: clinical experience and novel agents. Cancer J. 2011;17(6):512. doi:10.1097/PPO.0b013e31823e701a
6. Sharma SV, Bell DW, Settleman J, Haber DA. Epidermal growth factor receptor mutations in lung cancer. Nat Rev Cancer. 2007;7(3):169–181. doi:10.1038/nrc2088
7. Mok TS, Wu Y-L, Thongprasert S, et al. Gefitinib or carboplatin–paclitaxel in pulmonary adenocarcinoma. N Engl J Med. 2009;361(10):947–957. doi:10.1056/NEJMoa0810699
8. Rosell R, Carcereny E, Gervais R, et al. Erlotinib versus standard chemotherapy as first-line treatment for European patients with advanced EGFR mutation-positive non-small-cell lung cancer (EURTAC): a multicentre, open-label, randomised Phase 3 trial. Lancet Oncol. 2012;13(3):239–246. doi:10.1016/S1470-2045(11)70393-X
9. Sequist L, Yang J, Yamamoto N, et al. Phase III study of afatinib or cisplatin/pemetrexed in metastatic lung adenocarcinoma patients with epidermal growth factor receptor mutations. J Clin Oncol. 2013;31:3327–3334. doi:10.1200/JCO.2012.44.2806
10. Sequist LV, Waltman BA, Dias-Santagata D, et al. Genotypic and histological evolution of lung cancers acquiring resistance to EGFR inhibitors. Sci Transl Med. 2011;3(75):75ra26–75ra26. doi:10.1126/scitranslmed.3002003
11. Helena AY, Arcila ME, Rekhtman N, et al. Analysis of tumor specimens at the time of acquired resistance to EGFR-TKI therapy in 155 patients with EGFR-mutant lung cancers. Clin Cancer Res. 2013;19(8):2240–2247. doi:10.1158/1078-0432.CCR-12-2246
12. Walter AO, Sjin RTT, Haringsma HJ, et al. Discovery of a mutant-selective covalent inhibitor of EGFR that overcomes T790M-mediated resistance in NSCLC. Cancer Discov. 2013;3(12):1404–1415. doi:10.1158/2159-8290.CD-13-0314
13. Amer SM, Kadi AA, Darwish HW, Attwa MW. Liquid chromatography tandem mass spectrometry method for the quantification of vandetanib in human plasma and rat liver microsomes matrices: metabolic stability investigation. Chem Cent J. 2017;11(1):45. doi:10.1186/s13065-017-0274-4
14. Rowland M, Benet LZ, Graham GG. Clearance concepts in pharmacokinetics. J Pharmacokinet Biopharm. 1973;1(2):123–136. doi:10.1007/BF01059626
15. Wilkinson GR, Shand DG. A physiological approach to hepatic drug clearance. Clin Pharmacol Ther. 1975;18(4):377–390. doi:10.1002/cpt1975184377
16. Houston JB. Utility of in vitro drug metabolism data in predicting in vivo metabolic clearance. Biochem Pharmacol. 1994;47(9):1469–1479. doi:10.1016/0006-2952(94)90520-7
17. Obach RS, Baxter JG, Liston TE, et al. The prediction of human pharmacokinetic parameters from preclinical and in vitro metabolism data. J Pharmacol Exp Ther. 1997;283(1):46–58.
18. Baranczewski P, Stanczak A, Sundberg K, et al. Introduction to in vitro estimation of metabolic stability and drug interactions of new chemical entities in drug discovery and development. Pharmacol Rep. 2006;58(4):453.
19. Darwish HW, Attwa MW, Kadi AA. Rapid validated liquid chromatographic method coupled with Tandem mass spectrometry for quantification of nintedanib in human plasma. Trop J Pharm Res. 2016;15(11):2467–2473. doi:10.4314/tjpr.v15i11.23
20. Darwish HW, Kadi AA, Attwa MW, Almutairi HS. Investigation of metabolic stability of the novel ALK inhibitor brigatinib by liquid chromatography tandem mass spectrometry. Clin Chim Acta. 2018;480:180–185. doi:10.1016/j.cca.2018.02.016
21. Attwa MW, Kadi AA, Darwish HW, Amer SM, Alrabiah H. A reliable and stable method for the determination of foretinib in human plasma by LC-MS/MS: application to metabolic stability investigation and excretion rate. Eur J Mass Spectrometry. 2018;24(4):344–351. doi:10.1177/1469066718768327
22. Tyzack JD, Kirchmair J. Computational methods and tools to predict cytochrome P450 metabolism for drug discovery. Chem Biol Drug Des. 2019;93(4):377–386. doi:10.1111/cbdd.13445
23. Attwa MW, Kadi AA, Abdelhameed AS, Alhazmi HA. Metabolic stability assessment of new PARP inhibitor talazoparib using validated LC-MS/MS methodology: in silico metabolic vulnerability and toxicity studies. Drug Des Devel Ther. 2020;14:783–793. doi:10.2147/DDDT.S239458
24. Attwa MW, Kadi AA, Abdelhameed AS. Phase I metabolic profiling and unexpected reactive metabolites in human liver microsome incubations of X-376 using LC-MS/MS: bioactivation pathway elucidation and in silico toxicity studies of its metabolites. RSC Adv. 2020;10(9):5412–5427. doi:10.1039/C9RA09115G
25. Alsubi TA, Attwa MW, Bakheit AH, Darwish HW, Abuelizz HA, Kadi AA. In silico and in vitro metabolism of ribociclib: a mass spectrometric approach to bioactivation pathway elucidation and metabolite profiling. RSC Adv. 2020;10(38):22668–22683. doi:10.1039/D0RA01624A
26. U.S. Food and Drugs Adminstration. Bioanalytical method validation, guidance for industry; 2018. Available from: https://www.fda.gov/media/70858/download.
27. Kadian N, Raju KSR, Rashid M, Malik MY, Taneja I, Wahajuddin M. Comparative assessment of bioanalytical method validation guidelines for pharmaceutical industry. J Pharm Biomed Anal. 2016;126:83–97. doi:10.1016/j.jpba.2016.03.052
28. Attwa MW, Kadi AA, Darwish HW, Amer SM, Al-shakliah NS. Identification and characterization of in vivo, in vitro and reactive metabolites of vandetanib using LC–ESI–MS/MS. Chem Cent J. 2018;12(1):99. doi:10.1186/s13065-018-0467-5
29. Abdelhameed AS, Attwa MW, Kadi AA. An LC–MS/MS method for rapid and sensitive high‐throughput simultaneous determination of various protein kinase inhibitors in human plasma. Biomed Chromatography. 2017;31(2):e3793. doi:10.1002/bmc.3793
30. AlRabiah H, Kadi AA, Aljohar HI, et al. A new validated HPLC-MS/MS method for quantification and pharmacokinetic evaluation of dovitinib, a multi-kinase inhibitor, in mouse plasma. Drug Des Devel Ther. 2020;14:407. doi:10.2147/DDDT.S223573
31. Attwa MW, Kadi AA, Abdelhameed AS. Detection and characterization of olmutinib reactive metabolites by LC–MS/MS: elucidation of bioactivation pathways. J Sep Sci. 2020;43(4):708–718. doi:10.1002/jssc.201900818
32. Attwa MW, Darwish HW, Alhazmi HA, Kadi AA. Investigation of metabolic degradation of new ALK inhibitor: entrectinib by LC-MS/MS. Clinica Chimica Acta. 2018;485:298–304. doi:10.1016/j.cca.2018.07.009
33. Davies B, Morris T. Physiological parameters in laboratory animals and humans. Pharm Res. 1993;10(7):1093–1095. doi:10.1023/A:1018943613122
34. Barter ZE, Bayliss MK, Beaune PH, et al. Scaling factors for the extrapolation of in vivo metabolic drug clearance from in vitro data: reaching a consensus on values of human micro-somal protein and hepatocellularity per gram of liver. Curr Drug Metab. 2007;8(1):33–45. doi:10.2174/138920007779315053
35. Iwatsubo T, Suzuki H, Sugiyama Y. Prediction of species differences (rats, dogs, humans) in the in vivo metabolic clearance of YM796 by the liver from in vitro data. J Pharmacol Exp Ther. 1997;283(2):462–469.
36. Tan L, Kirchmair J. Software for metabolism prediction. In: Kirchmair J, editor. Drug Metabolism Prediction. Wiley‐VCH Verlag GmbH & Co. KGaA; 2014:27–52. doi:10.1002/9783527673261
37. Hunt PA, Segall MD, Tyzack JD. WhichP450: a multi-class categorical model to predict the major metabolising CYP450 isoform for a compound. J Comput Aided Mol Des. 2018;32(4):537–546. doi:10.1007/s10822-018-0107-0
38. Shin GY, Le H, Khojasteh C. Comparison of metabolic soft spot predictions of CYP3A4, CYP2C9 and CYP2D6 substrates using metasite and stardrop. Comb Chem High Throughput Screen. 2011;14(9):811–823. doi:10.2174/138620711796957170
39. Attwa MW, Kadi AA, Abdelhameed AS. Reactive intermediates and bioactivation pathways characterization of avitinib by LC–MS/MS: in vitro metabolic investigation. J Pharm Biomed Anal. 2019;164:659–667. doi:10.1016/j.jpba.2018.11.033
40. Kadi AA, Abdelhameed AS, Darwish HW, Attwa MW, Al‐Shakliah NS. A highly efficient and sensitive LC‐MS/MS method for the determination of afatinib in human plasma: application to a metabolic stability study. Biomed Chromatography. 2016;30(8):1248–1255. doi:10.1002/bmc.3674
41. Scott WJ, Hentemann MF, Rowley RB, et al. Discovery and SAR of novel 2, 3‐dihydroimidazo [1, 2‐c] quinazoline PI3K inhibitors: identification of copanlisib (BAY 80‐6946). ChemMedChem. 2016;11(14):1517. doi:10.1002/cmdc.201600148
42. Attwa Mohamed W, Kadi AA, Darwish HW, Abdelhameed AS. Investigation of the metabolic stability of olmutinib by validated LC-MS/MS: quantification in human plasma. RSC Adv. 2018;8(70):40387–40394. doi:10.1039/C8RA08161A
43. Kadi AA, Darwish HW, Attwa MW, Amer SM. Validated LC-MS/MS method for the quantification of ponatinib in plasma: application to metabolic stability. PLoS One. 2016;11(10):e0164967. doi:10.1371/journal.pone.0164967
44. Manzo A, Montanino A, Costanzo R, et al. Chapter 33 - EGFR mutations: best results from second- and third-generation tyrosine kinase inhibitors. In: Dammacco F, Silvestris F, editors. Oncogenomics. Academic Press; 2019. 477–486.
45. Leahy DE. Integrating in vitro ADMET data through generic physiologically based pharmacokinetic models. Expert Opin Drug Metab Toxicol. 2006;2(4):619–628. doi:10.1517/17425255.2.4.619
 © 2021 The Author(s). This work is published and licensed by Dove Medical Press Limited. The full terms of this license are available at https://www.dovepress.com/terms.php and incorporate the Creative Commons Attribution - Non Commercial (unported, v3.0) License.
By accessing the work you hereby accept the Terms. Non-commercial uses of the work are permitted without any further permission from Dove Medical Press Limited, provided the work is properly attributed. For permission for commercial use of this work, please see paragraphs 4.2 and 5 of our Terms.
© 2021 The Author(s). This work is published and licensed by Dove Medical Press Limited. The full terms of this license are available at https://www.dovepress.com/terms.php and incorporate the Creative Commons Attribution - Non Commercial (unported, v3.0) License.
By accessing the work you hereby accept the Terms. Non-commercial uses of the work are permitted without any further permission from Dove Medical Press Limited, provided the work is properly attributed. For permission for commercial use of this work, please see paragraphs 4.2 and 5 of our Terms.