")
Back to Journals » Risk Management and Healthcare Policy » Volume 12
Large-Scale Comparative Analysis Reveals A Simple Model To Predict The Prevalence Of Thyroid Nodules
Authors Li G, Wang L, Lei J, Song L, Tang H , Li Z, Gong R, Zhu J
Received 26 August 2019
Accepted for publication 3 October 2019
Published 14 November 2019 Volume 2019:12 Pages 225—232
DOI https://doi.org/10.2147/RMHP.S228752
Checked for plagiarism Yes
Review by Single anonymous peer review
Peer reviewer comments 2
Editor who approved publication: Professor Marco Carotenuto
Genpeng Li,1,* Lijuan Wang,1,* Jianyong Lei,1 Linlin Song,1 Huairong Tang,2 Zhihui Li,1 Rixiang Gong,1 Jingqiang Zhu1
1Thyroid and Parathyroid Surgery Center, West China Hospital of Sichuan University, Chengdu 610041, People’s Republic of China; 2Health and Management Center, West China Hospital of Sichuan University, Chengdu 610041, People’s Republic of China
*These authors contributed equally to this work
Correspondence: Huairong Tang
Health and Management Center, West China Hospital of Sichuan University, Chengdu 610041, People’s Republic of China
Tel +86-28-85422933
Fax +86-28-85422933
Email [email protected]
Background: The frequency of thyroid nodules (TNs) has increased rapidly in recent decades. We established a simple, effective model to predict TN occurrence by a large-scale comparative analysis of the Chinese population.
Subjects and methods: A total of 13,307 subjects were included to screen risk factors between the case group (TN+) and the control group (TN-) by univariate and multivariate analyses. A simple prediction model formed by a subset of five factors was established. The optimal index points for predicting the prevalence of TNs, the model discriminatory power and the association of the model with the size of TNs were assessed.
Results: Age at diagnosis ≥45 years, female sex, body mass index (BMI) ≥24 kg/m2, hypertension, antithyroglobulin antibody (TGAB) ≥16.5 IU/mL were independently related to an increased risk of TNs. The cutoff value of 4 points was found to be the best prediction for the prevalence of TNs in the current study, and the model had better discriminatory power than other single independent predictors. In addition, a positive correlation was also found between the index points and the diameter of TNs.
Conclusion: Based on our prediction model, thyroid high-resolution ultrasound and associated laboratory tests may be necessary for patients with index points ≥4 due to a higher prevalence of thyroid nodules.
Keywords: thyroid nodules, large-scale, risk factors, prediction model
Introduction
Thyroid nodules (TNs), one of the most common diseases of the endocrine system, develop as a consequence of the interplay among genetic, environmental, and endogenous factors.1,2 The incidence of TNs detected by high-resolution ultrasonography among randomly selected individuals ranges from 19–68%, and only 3–7% of TNs can be detected by palpation, while 5–15% of TNs are diagnosed as malignant tumors in a subsequent examination.2,3 Although TNs have no clinical manifestations in the majority of patients, they can be associated with a variety of disorders that affect quality of life and life expectancy, such as endocrine dysregulation, autoimmune thyroid disease,4–6 and even breathing and/or swallowing difficulties.7
Due to annually increasing trends worldwide, TNs have received much attention in the medical field. These trends cannot be explained by traditional known risk factors, such as exposure to radiation or chemicals or a family history of thyroid nodules or cancer, so numerous studies have attempted to determine whether other demographic parameters and clinical histories have a profound effect on the formation and growth of TNs. Age and sex were associated with the increasing prevalence of TNs in the study by Akushevich.8 With regard to lifestyle, smoking was identified by multiple studies as predisposing the study population to TNs.9 Meanwhile, studies by Diez and Guo noted an increased incidence of TNs in individuals with clinically diagnosed hypertension, diabetes and abnormal thyroid hormone levels, in particular high thyroid-stimulating hormone (TSH) levels;10,11 however, there is still no consensus regarding which individuals should closely monitor the health of their thyroid in populations without definite known risk factors, as mentioned above.
The aim of the present study was to determine the association of different clinical parameters or lifestyle-associated factors with TNs in populations without definite known risk factors and to establish a simple multivariable prediction model for the prevalence of TNs via a large-scale comparative analysis in the Chinese population.
Subjects And Methods
From October 2014 to October 2017, the medical records of 19,108 patients who received health examinations at the Health and Management Center of the West China Hospital of Sichuan University were reviewed. The inclusion criteria were subjects from 18 to 80 years of age whose thyroid ultrasound and associated laboratory test results (performed in our center) were available and who had adequate medical histories and person without definite known risk factors, such as exposure to radiation or chemicals or a family history of thyroid nodules or cancer. In our study, pregnant women and subjects taking contraceptive agents or estrogen were not included. Those who suffered from severe diseases, such as chronic renal failure, hepatic cirrhosis, evident cardiac insufficiency, or abdominal ascites, were excluded. Individuals who received medications that influence thyroid function, such as amiodarone and iodine, or hormones, such as glucocorticoid and somatostatin, were also excluded.11 Based on the inclusion and exclusion criteria, 13,307 subjects were eligible for this retrospective analysis. Data on the subjects’ clinical features, such as age at diagnosis, sex, body mass index (BMI), size of TNs, blood pressure, prediabetes or diabetes, smoking, alcohol consumption, antithyroid peroxidase antibody (TPOAB, normal reference <34 IU/mL) and antithyroglobulin antibody (TGAB, normal reference <115 IU/mL), were extracted from electronic medical records. TNs referred to any detected discrete lesion within the thyroid gland that is radiologically distinct from the surrounding thyroid parenchyma. Receiver operating characteristic (ROC) curve studies were performed to identify the optimal cutoff point for predicting TNs in continuous variables, such as age, TPOAB and TGAB. Univariate and multivariate analyses were performed with a focus on risk factors associated with TNs. Thus, a multivariable prediction model of TNs was constructed in accordance with these independent risk factors, and ROC curve analyses were conducted to identify the optimal cutoff point and compare discriminatory power. Additionally, the relationship between the prediction model and the diameter of thyroid nodules was identified. The study protocol was approved by the Institutional Review Board of West China Hospital of Sichuan University, and patient approval or informed consent was required for review of the patients’ medical records.
Statistical analyses were performed using SPSS software, version 20.0 (SPSS, Chicago, IL, USA). Continuous variables with normal distributions are expressed as the mean ± standard deviation, and continuous variables without normal distributions are expressed as medians. Categorical variables are presented as numbers. Continuous variables with normal distributions were compared using Student’s t-test or analysis of variance (ANOVA). Categorical variables were compared using the chi-square test or Fisher’s exact chi-square test. Independent predictors were determined by a multivariable logistic regression model based on the risk factors related to TNs. According to multiple logistic regression analyses, features that were independent factors were assigned different points based on the OR to develop a simple model. Significance was set at a level of 5%.
Results
Associations Between Clinical Parameters Or Lifestyle Factors And Subjects With TNs
The subjects were divided into two groups according to their thyroid gland status (case group: TNs detected by ultrasound; control group: TNs not detected by ultrasound). Of the enrolled subjects, 5534 and 7773 were in the case group and control group, respectively. The baseline demographics and lifestyle-associated factors that were investigated in the present study included the following: age, sex, BMI, hypertension, prediabetes or diabetes, smoking, alcohol consumption, thyroid function, and presence of autoimmune antibody. No significant differences were found in the thyroid-stimulating hormone (TSH) level between the cases and controls, as shown in Table 1 (P=0.115); however, 13 clinical and lifestyle factors did have correlations with the prevalence of TNs in the univariate analysis (positive correlations: 9 factors; negative correlations: 4 factors). As shown in Figure 1, ROC curve analysis was conducted to predict the cutoff point of continuous variables with positive correlations with the prevalence of TNs (age ≥45 years; FT3 <3.60 pmol/L; FT4 <12.0 pmol/L; TPOAB ≥16.0 IU/mL; TGAB ≥16.5 IU/mL). However, thyroxine (T4) and triiodothyronine (T3) did not exhibit differences in the ROC curve analysis (all P>0.05).
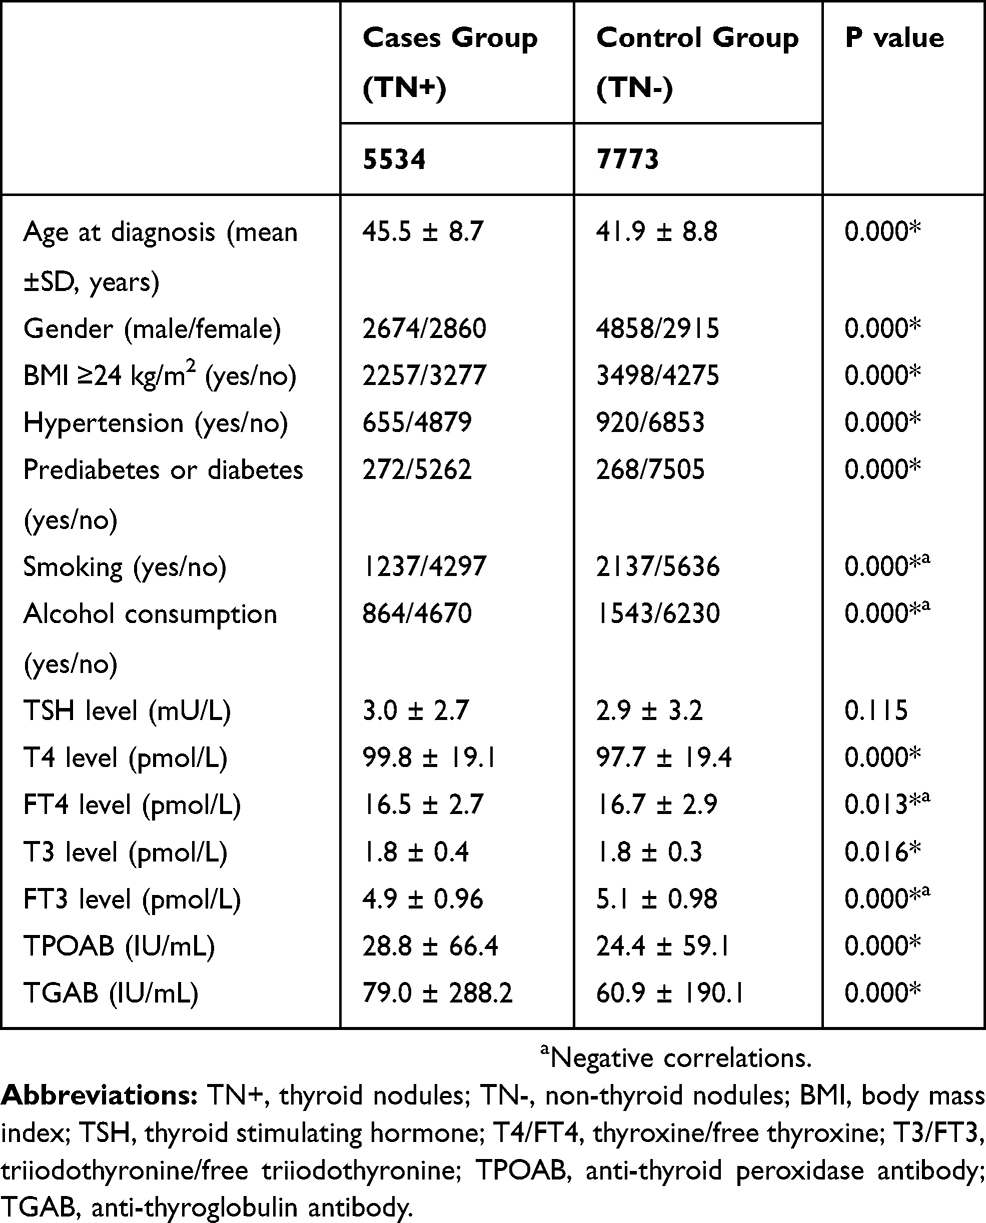 |
Table 1 Comparison Of The Baseline Demographics And Clinical Features Of Patients With TN+ And TN− |
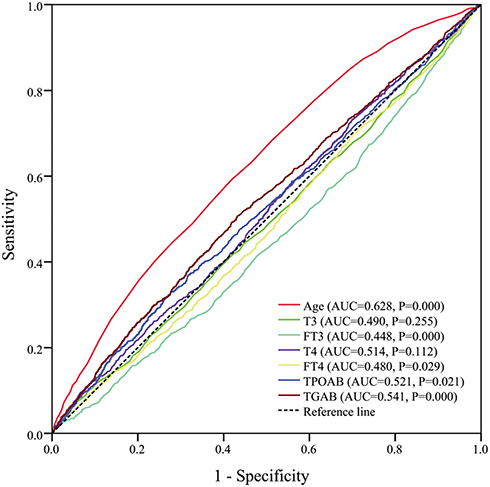 |
Figure 1 Receiver-operating characteristic (ROC) curve to predict the cut -off point of continuous variables associated with prevalence of TNs. (Age ≥45 years; FT3 <3.60 pmol/L;FT4 <12.0 pmol/L;TPOAB ≥16.0 IU/mL; TGAB ≥16.5 IU/mL). |
Multivariable Risk Assessment And Establishment Of A Prediction Model
In the univariate and ROC curve analyses, the following 9 factors significantly increased the risk of TNs: age at diagnosis ≥45 years, female sex, BMI ≥24 kg/m2, hypertension, prediabetes or diabetes, FT4 <12.0 pmol/L, FT3 <3.60 pmol/L, TPOAB ≥16.0 IU/mL and TGAB ≥16.5 IU/mL (all P<0.05). A multivariate analysis was performed to compare these factors with the risk potential as indicated by univariate and ROC curve analyses; prediabetes or diabetes, FT4 <12.0 pmol/L, FT3 <3.60 pmol/L and TPOAB ≥16.0 IU/mL were not significantly associated with the prevalence of TNs in the multivariable analysis (all P>0.05). The factors that remained independently associated with the prevalence of TNs were age at diagnosis ≥45 years (OR 2.026, 95% CI 1.841–2.230, P=0.000), female sex (OR 1.772, 95% CI 1.598–1.965, P=0.000), BMI ≥24 kg/m2 (OR 1.326, 95% CI 1.105–1.548, P=0.024), hypertension (OR 1.187, 95% CI 1.018–1.385, P=0.029); and TGAB ≥16.5 IU/mL (OR 1.198, 95% CI 1.005–1.294, P=0.003) (Table 2). Based on the multivariable logistic regression analysis, a simple prediction model formed by a subset of five factors was established. The evaluated cutoff points for each characteristic are shown in Table 2 (total 7 points), and the sum of the points was evaluated to distinguish between subjects with and those without TNs.
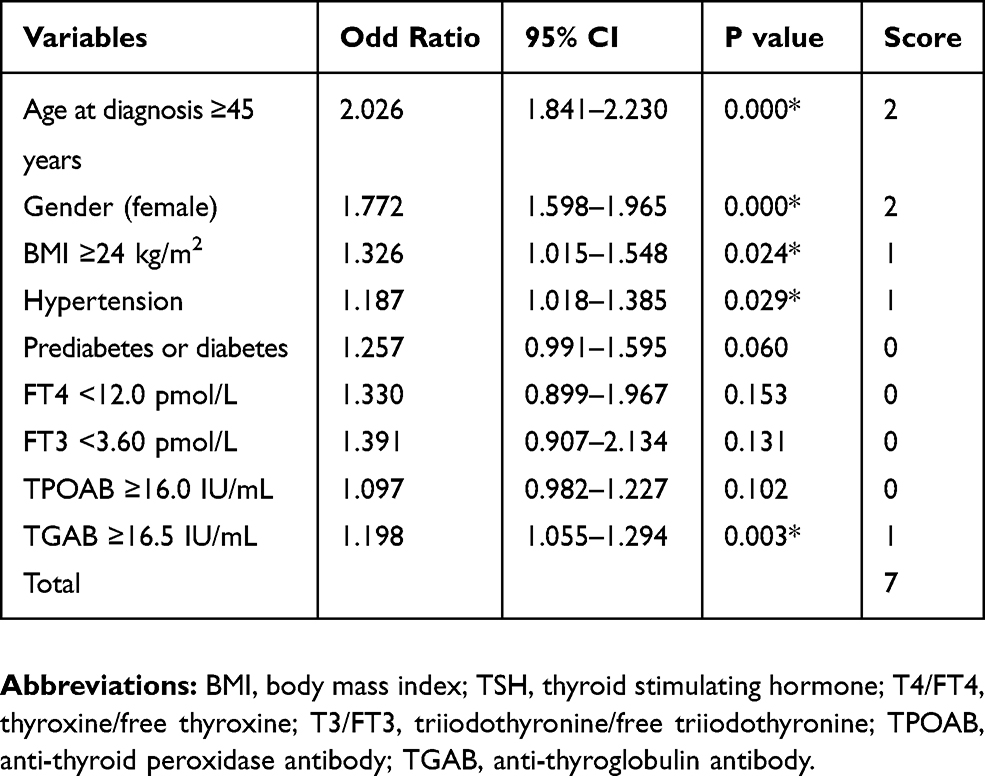 |
Table 2 Multivariate Analyses Of Factors Associated With The Prevalence Of Thyroid Nodules |
The Quality Of Prediction Model For The Prevalence Of Thyroid Nodules
The score distributions of the two groups are presented in Figure 2A. The number of control and case groups all showed an N-shaped curve, which peaked at the score of three. The mean index score was 2.1 ± 1.5 in the control group and 3.3 ± 1.8 in the case group, which was a significant difference (P=0.000), as shown in Figure 2B. As determined using ROC curves (Figure 3), a cutoff value of 4 was found to be the best score for predicting the prevalence of TNs, with an area under the ROC curve of 0.784, and the sensitivity and specificity of this system were 65.9% and 77.8%, respectively. Compared with other single independent predictors, the model had a much better predictive value, as shown in Table 3. Furthermore, the ROC curves also revealed that this scoring system (AUC=0.701) had a higher discriminatory power than other single independent predictors (largest AUC=0.599), as shown in Figure 3. The occurrence of TNs increased with an increasing score (Figure 4A), and the prevalence of TNs in patients with an index score of ≥4 points was 2.3-fold greater than that in patients with an index score of <4 points. In addition, a positive correlation was also found between the index points and the diameter of TNs (Figure 4B).
 |
Table 3 Predictive Value For The Prediction Model And Independent Risk Factors |
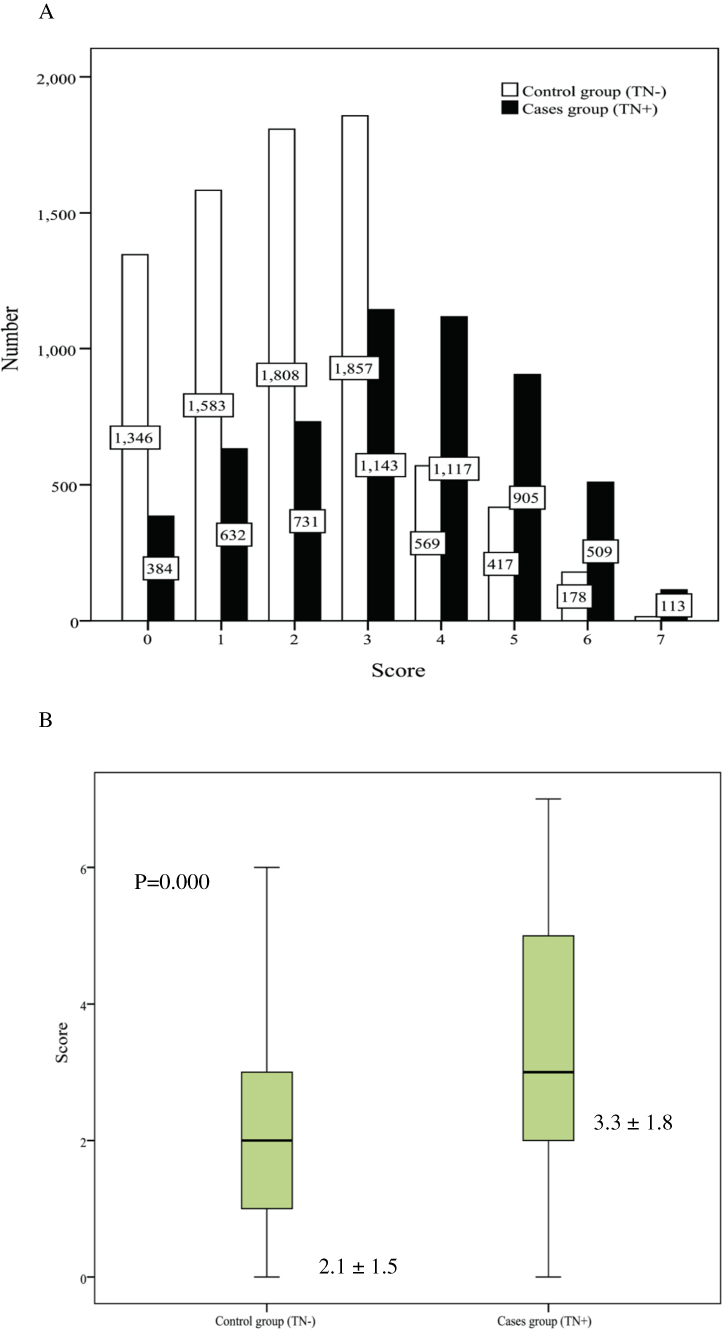 |
Figure 2 (A) The distribution of cases in the two groups in different points according to the prediction model. (B) The mean index points in the cases group and control group according to the prediction model. |
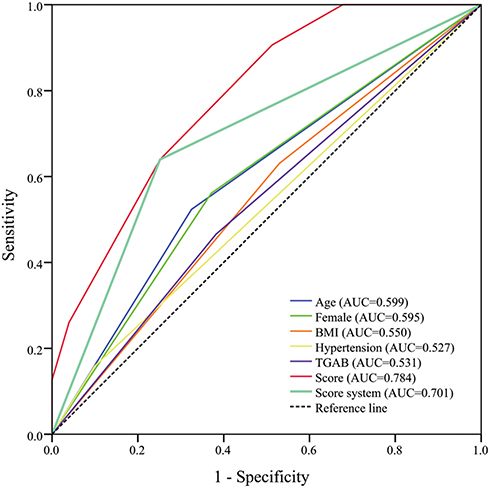 |
Figure 3 Receiver-operating characteristic (ROC) curve to identify the optimal cutoff value and compare the discrimination power. (The area under the ROC curve was 0.784 and a cutoff value of 4 points was found to be the best for distinguishing between patients with and without TNs. The sensitivity and specificity were 65.9% and 77.8%, respectively. Besides, the score system had a higher discrimination power than other single independent predictors). |
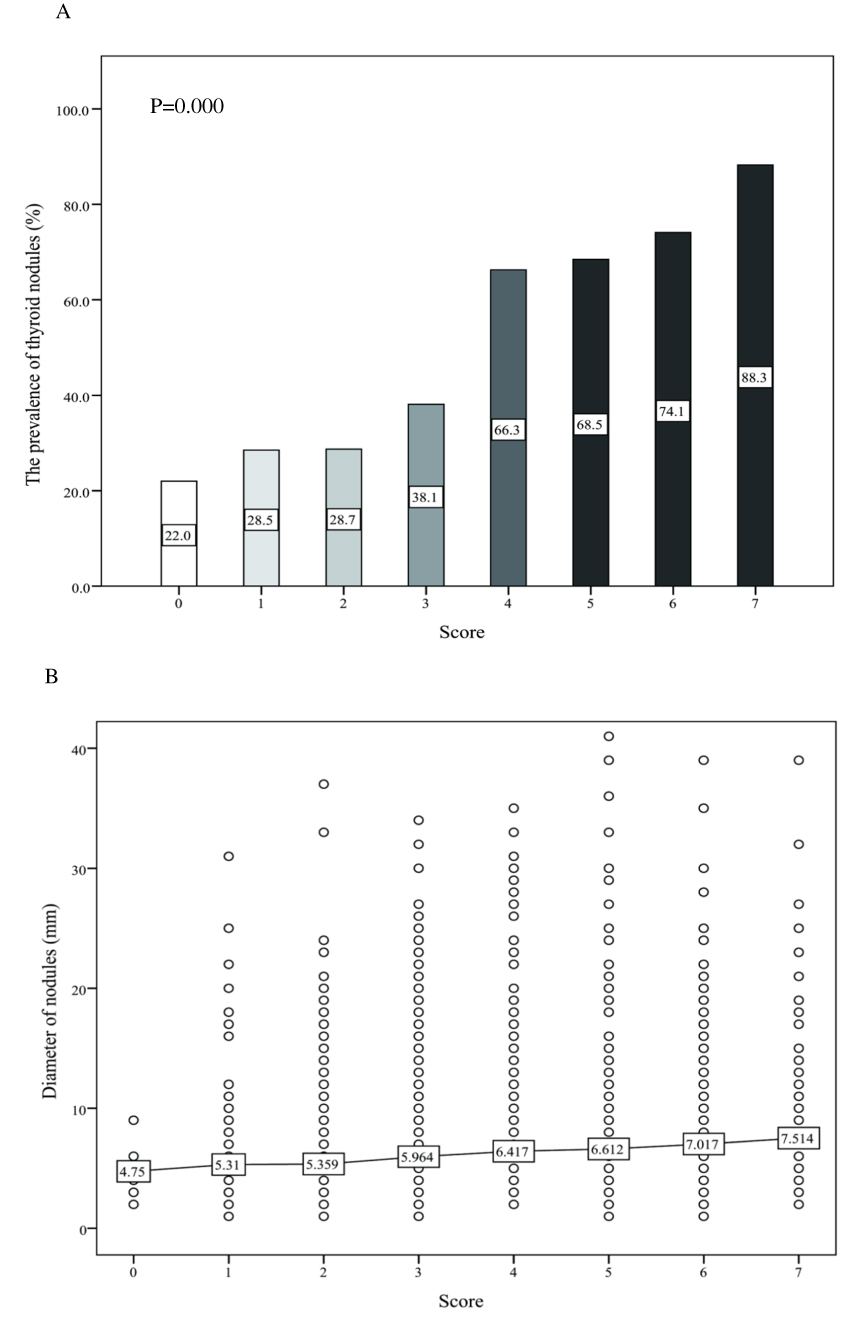 |
Figure 4 (A) The occurrence of thyroid nodules increased with increasing score. (B) Diameter of thyroid nodules was correlated with the index points in the cases group. |
Discussion
In recent years, the prevalence of TNs has significantly increased. According to the literature, the prevalence of TNs was 67.1% in North America, 27.3% in Finland, 19.5% in Belgium, and 17.7% in Brazil in 2013.12,13 In China, studies have reported that in Hangzhou, the prevalence in men and women was 24.1% and 34.7%, respectively, in 2013, and among people in Nanjing aged >40 years, the prevalence reached 46.6% in 2014.11,14 The results of this survey showed that the prevalence of TNs was 41.6% in the Chinese population and that the occurrence of TNs was 49.5% in females, which was significantly higher than the incidence of 35.5% among males. Although TNs are the most common thyroid disorder in the adult population, the etiology is not completely understood. The high prevalence of TNs may be partly due to advancements in diagnostic technologies, but it still cannot be explained by traditional known risk factors such as iodine intake, exposure to radiation or chemicals, or a family history of thyroid nodules or cancer.15 The presentation of TNs ranges from mild changes in the thyroid structure without clinical symptoms to severe symptoms, such as breathing and/or swallowing difficulties. In this cross-sectional study, we conducted a large-scale comparative analysis that aimed to further identify the risk factors and construct a prediction model for the occurrence of TNs.
Our data suggested that age ≥45 years, female sex, BMI ≥24 kg/m2, and hypertension were independently associated with a higher risk of TNs, which is consistent with the results of many previous studies.16–19 In 2015, Qin reported that high thyroglobulin antibody levels will increase the risk of differentiated thyroid carcinoma.20 Our results revealed that high thyroglobulin antibody levels (TGAB ≥16.5 IU/mL) also contribute to the prevalence of TNs. TSH plays a major role in the regulation of thyroid cell growth and differentiation and may play a direct role in nodule formation. Zhu and Ayturk revealed that increased serum TSH was an independent risk factor for increased thyroid volume in patients;21,22 however, TSH levels were not found to be associated with the formation and growth of TNs in the present study. Interestingly, smoking and alcohol were not identified as risk factors for the frequency of TNs. In a study by Knudsen,23 a strong association between tobacco smoking and goiter prevalence was found in iodine-deficient areas, whereas the association is less pronounced in iodine-replete areas. This finding was expected, as experimental studies have reported thiocyanate to mediate the goitrogenic effect of tobacco smoke acting as a competitive inhibitor of iodine uptake. In addition, a low occurrence of goiter among alcohol consumers has been found, but the mechanism underlying this association remains unknown.
Next, we established a simple prediction model based on OR values, and the average scores for the two groups were 3.3 ± 1.8 in the case group and 2.1 ± 1.5 in the control group, which were significantly different. In addition, the best cutoff value determined by the ROC curves for the prediction of TNs with moderate sensitivity (0.659) and specificity (0.778) was 4 (AUC=0.701), and the model had higher discriminatory power than other single independent predictors. Both the prevalence of TNs and the diameter of TNs increased with increasing score. This simple model for the risk factors that predict TNs may be another approach that can be used to guide physical examinations. High-resolution ultrasound and associated laboratory tests may be necessary for patients with index scores ≥4 points due to the higher risk of TN occurrence.
In 2006, Davies and Welch found a mismatch between trends in the incidence and mortality of thyroid cancer; their study was the first to comment on the problem of thyroid cancer overdiagnosis and overtreatment24 and postoperative management of thyroid cancer is also a focus of attention.25 One of the activities leading to overdiagnosis of thyroid cancer is the workup of incidental thyroid nodules detected on imaging.26 To mitigate the problem of overdiagnosis and overtreatment, the most suitable population for our prediction model may be individuals who warrant a thyroid examination. Based on our model, a brief assessment can be performed before conducting the examination. High-resolution ultrasound and associated laboratory tests for thyroid can be considered for patients with index scores ≥4 points, while associated examinations may not be necessary for these persons with index scores <4 points, which may help save considerable healthcare resources and reduce thyroid nodule overdiagnosis and overtreatment.
In this study, we conducted a comprehensive analysis of the risk factors for the prevalence of TNs and established a multivariable prediction model for TNs. Future work is needed to determine whether the characteristics of this study population influenced these observational results. This study also has several limitations. First, some tiny TNs may not be detected by high-resolution ultrasound, which could cause slight bias during grouping. Second, the lack of repeated laboratory tests in the subjects is a possible limitation. Third, there was no dose-response analysis of factors such as blood glucose and blood pressure. The large sample size, however, was a major strength of the present study.
Conclusions
This work is one of the largest investigations of risk factors affecting the occurrence of TNs. A simple model was established based on five identified independent risk factors. Patients with index scores ≥4 points could be considered at higher risk for the occurrence of TNs; these results provide some insights for clinical practice that may help improve preventive and therapeutic strategies for TNs.
Acknowledgments
This study was supported by grants from the National Key R&D Program of China (2017YF0907504), the National Natural Science Foundation (81702646), the National Post-Doctoral Research Project (2018M631086, 2019T120846), the Sichuan Provience Science and Technology Project of China (2017SZ0139), the Sichuan University for Youth Fund (2017SCU11016), the Health and Family Planning Commission of Sichuan Province (17PJ398), the Postdoctoral Sustentation Fund of Sichuan University (2017SCU12035), and the Post-Doctoral Research Project, West China Hospital, Sichuan University (2019HXBH043). Li Genpeng and Wang Lijuan are co-first authors.
Author Contributions
All authors made substantial contributions to the study conception and design and data acquisition, analysis and interpretation; were involved in drafting the article or revising it critically for important intellectual content; gave final approval of the version to be published; and agreed to be accountable for all aspects of the work.
Disclosure
The authors report no conflicts of interest in this work.
References
1. Dauksiene D, Petkeviciene J, Klumbiene J, et al. Factors associated with the prevalence of thyroid nodules and goiter in middle-aged euthyroid subjects. Int J Endocrinol. 2017;2017(7):1–8.
2. Haugen BR, Alexander EK, Bible KC, et al. 2015 American thyroid association management guidelines for adult patients with thyroid nodules and differentiated thyroid cancer: the American thyroid association guidelines task force on thyroid nodules and differentiated thyroid cancer. Thyroid Off J Am Thyroid Assoc. 2016;26(1):1.
3. Jemal A, Siegel R, Xu J, et al. Cancer statistics, 2010. Ca A Cancer J Clin. 2011;61(2):10.
4. Smith JJ, Chen X, Schneider DF, et al. Toxic nodular goiter and cancer: a compelling case for thyroidectomy. Ann Surg Oncol. 2013;20(4):1336.
5. Reverter JL, Fajardo C, Resmini E, et al. Benign and malignant nodular thyroid disease in acromegaly. Is a routine thyroid ultrasound evaluation advisable? PLoS One. 2014;9(8):e104174.
6. Cañete EJ, Sisonpeña CM, Jimeno CA. Clinicopathological, biochemical, and sonographic features of thyroid nodule predictive of malignancy among adult Filipino patients in a tertiary hospital in the Philippines. Endocrinol Metab. 2014;29(4):489.
7. Zheng L, Yan W, Kong Y, et al. An epidemiological study of risk factors of thyroid nodule and goiter in Chinese women. Int J Environ Res Public Health. 2015;12(9):11608.
8. Akushevich I, Kravchenko J, Ukraintseva S, et al. Time trends of incidence of age-associated diseases in the US elderly population: medicare-based analysis. Age Ageing. 2013;42(4):494–500.
9. Aydin LY, Aydin Y, Besir FH, et al. Effect of smoking intensity on thyroid volume, thyroid nodularity and thyroid function: the Melen study. Minerva Endocrinol. 2011;36(4):273–280.
10. Díez JJ, Iglesias P. An analysis of the relative risk for goitre in euthyroid patients with type 2 diabetes. Clin Endocrinol (Oxf). 2014;80(3):356–361.
11. Guo H, Sun M, He W, et al. The prevalence of thyroid nodules and its relationship with metabolic parameters in a Chinese community-based population aged over 40 years. Endocrine. 2014;45(2):230–235.
12. Ezzat S, Sarti DA, Cain DR, et al. Thyroid incidentalomas: prevalence by palpation and ultrasonography. Arch Intern Med. 1994;154(16):1838–1840. doi:10.1001/archinte.154.16.1838
13. Frates MC, Benson CB, Doubilet PM, et al. Can color Doppler sonography aid in the prediction of malignancy of thyroid nodules? J Ultrasound Med. 2003;22(2):127–131.
14. Chen Z, Xu W, Huang Y, et al. Associations of noniodized salt and thyroid nodule among the Chinese population: a large cross-sectional study. Am J Clin Nutr. 2013;98(3):684–692.
15. Jiang H, Tian Y, Yan W, et al. The prevalence of thyroid nodules and an analysis of related lifestyle factors in Beijing communities. Int J Environ Res Public Health. 2016;13(4):442.
16. Barrã¨Re X, Valeix P, Preziosi P, et al. Determinants of thyroid volume in healthy French adults participating in the SU.VI.MAX cohort. Clin Endocrinol. 2000;52(3):273–278.
17. Wesche MFT, Wiersinga WM, Smits NJ. Lean body mass as a determinant of thyroid size. Clin Endocrinol (Oxf). 1998;48(6):701.
18. Gómez JM, Maravall FJ, Gómez N, et al. Determinants of thyroid volume as measured by ultrasonography in healthy adults randomly selected. Clin Endocrinol (Oxf). 2000;53(5):629–634.
19. Brix TH, Hansen PS, Kyvik KO, et al. Cigarette smoking and risk of clinically overt thyroid disease: a population-based twin case-control study. Arch Intern Med. 2000;160(5):661–666.
20. Qin J, Yu Z, Guan H, et al. High thyroglobulin antibody levels increase the risk of differentiated thyroid carcinoma. Dis Markers. 2015;2015:648670.
21. Zhu HF, Yang Y, J Y L, et al. Prevalence of thyroid nodules and influencing factors among employees of a company in Qingdao. Chin J Prev Med. 2012;46(3):228.
22. Ayturk S, Gursoy A, Kut A, et al. Metabolic syndrome and its components are associated with increased thyroid volume and nodule prevalence in a mild-to-moderate iodine-deficient area. Eur J Endocrinol. 2009;161(4):599–605. doi:10.1530/EJE-09-0410
23. Knudsen N, Laurberg P, Perrild H, et al. Risk factors for goiter and thyroid nodules. Thyroid Off J Am Thyroid Assoc. 2002;12(10):879.
24. Davies L, Welch HG. Increasing incidence of thyroid cancer in the United States, 1973-2002. JAMA. 2006;295(18):2164.
25. Lei J, Zhong J, Li Z, et al. A nomogram based on the characteristics of metastatic lymph nodes to predict papillary thyroid carcinoma recurrence. Thyroid. 2018:
26. Bahl M, Sosa JA, Nelson RC, et al. Imaging-detected incidental thyroid nodules that undergo surgery: a single-center experience over 1 year. AJNR Am J Neuroradiol. 2014;35(11):2176–2180.
 © 2019 The Author(s). This work is published and licensed by Dove Medical Press Limited. The full terms of this license are available at https://www.dovepress.com/terms.php and incorporate the Creative Commons Attribution - Non Commercial (unported, v3.0) License.
By accessing the work you hereby accept the Terms. Non-commercial uses of the work are permitted without any further permission from Dove Medical Press Limited, provided the work is properly attributed. For permission for commercial use of this work, please see paragraphs 4.2 and 5 of our Terms.
© 2019 The Author(s). This work is published and licensed by Dove Medical Press Limited. The full terms of this license are available at https://www.dovepress.com/terms.php and incorporate the Creative Commons Attribution - Non Commercial (unported, v3.0) License.
By accessing the work you hereby accept the Terms. Non-commercial uses of the work are permitted without any further permission from Dove Medical Press Limited, provided the work is properly attributed. For permission for commercial use of this work, please see paragraphs 4.2 and 5 of our Terms.