")
Back to Journals » International Journal of General Medicine » Volume 15
LAMC1 is a Novel Prognostic Factor and a Potential Therapeutic Target in Gastric Cancer
Authors Xi D, Jia Q, Liu X, Zhang L, Xu B, Ma Z, Ma Y, Yu Y, Zhang F , Chen H
Received 24 December 2021
Accepted for publication 7 March 2022
Published 19 March 2022 Volume 2022:15 Pages 3183—3198
DOI https://doi.org/10.2147/IJGM.S353289
Checked for plagiarism Yes
Review by Single anonymous peer review
Peer reviewer comments 2
Editor who approved publication: Dr Scott Fraser
Dayong Xi,1,2 Qiufang Jia,1 XiaoLong Liu,1 Lei Zhang,3 Bo Xu,1 Zhen Ma,1 YanLing Ma,1 Yang Yu,1 Fan Zhang,1 Hao Chen1,4
1The Second Clinical Medical College, Lanzhou University, Lanzhou, Gansu, People’s Republic of China; 2Department of Gastroenterology, The Second Provincial People’s Hospital of Gansu, Lanzhou, Gansu, People’s Republic of China; 3The First Clinical Medical College, Lanzhou University, Lanzhou, Gansu, People’s Republic of China; 4Department of Surgical Oncology, Lanzhou University Second Hospital, Lanzhou, Gansu, People’s Republic of China
Correspondence: Hao Chen, Department of Surgical Oncology, Lanzhou University Second Hospital, No. 82, Cuiyingmen, Chengguan District, Lanzhou, Gansu, People’s Republic of China, Tel +86 15009467790, Fax +86 931-8458109, Email [email protected]
Purpose: To investigate the role of LAMC1 in gastric cancer (GC), if it is of great importance to identify tumour driver genes with prognostic value.
Patients and Methods: GC-related gene expression profile data were downloaded from TCGA. R-limma package and univariate Cox regression were used to identify the differentially expressed genes (DEGs) and survival-genes, respectively. Then, the ClusterProfiler package was used to analyse the Gene Ontology and pathway enrichment of DEGs. Cytoscape was used to build a protein interaction network (PPI) and identify key genes. The GEPIA2 and TIMER databases were used to validate the differential expression of LAMC1. The relationship between LAMC1 and the prognosis of GC was analysed by the KM. GSEA and GSVA were used to analyse the major activated and mutated pathways, respectively. Real-time fluorescence quantitative PCR (RT-qPCR) was used to reidentify the expression of LAMC1 in GES-1 and 5 GC cell lines. Finally, we explored the relationship between LAMC1 and FGFR1.
Results: A total of 266 DEGs were be selected, which were mainly enriched in extracellular structure organization. LAMC1 was identified as one of the hub genes. The expression of LAMC1 was significantly higher in GC tissue than in paracancerous tissues, and the prognosis of the GC patient with high expression of LAMC1 was relatively poor. Univariate and multivariate Cox analysis indicated that LAMC1 could be used as an independent prognostic indicator. The results of GSEA and GSVA showed that LAMC1 was mainly enriched in pathways such as MYOGENESIS and UV_RESPONSE_DN. The RT-qPCR results showed that the expression level in AGS cells was significantly higher than that in gastric epithelial cells. LAMC1 may play a role in the development of gastric cancer by influencing FGFR1.
Conclusion: LAMC1 may mediate the occurrence and development of GC and has potential as a biomarker for the prognosis and treatment of GC.
Keywords: GC, LAMC1, bioinformatics, prognosis, novel target
Introduction
Gastric cancer (GC) has become a major health problem, especially in East Asian countries, and China has the highest GC morbidity and mortality in the world.1 With improvements in examination and treatment availability, the overall survival rate has been improved over time, but the prognosis is still poor.2 Therefore, a deeper understanding of the prospective molecular mechanisms of GC is of great importance for developing novel treatment strategies for GC.
To date, many modern technologies have been developed to provide new methods to uncover new strategies and biomarkers for cancer diagnosis, treatment and prognosis.3 A variety of bioinformatics methods are used to analyse and explain biological information. For example, bioinformatics analysis can identify meaningful molecular interactions and assess the associated signal transduction pathways when it is used in combination with microarray technology.4
In this study, high-throughput data were downloaded from an online database, and then R language was used to build a database for annotation. STRING and Cytoscape software were used to analyse the data by bioinformatics methods. Publicly available statistical data were used to perform survival analysis to identify biomarkers associated with malignant progression of GC. Finally, RT-qPCR was used to verify gene expression levels in related cells.
Based on the results of this bioinformatics analysis, this research identified laminin subunit γ1 (LAMC1) as an invasion-related gene. Laminin is a heterotrimeric extracellular matrix protein composed of α, β and γ chains that regulates cellular signal transduction by interacting with cell membrane receptors.5 The effect of the expression levels of specific laminin isotypes on cancer progression has been studied in detail. For example, the LAMC2 gene encoding the laminin subunit γ2 chain is a prognostic marker for various types of cancer.6 In this research, we focused on the LAMC1 gene, which has recently been reported to be associated with the occurrence and development of tubal cancer.7 Moreover, LAMC1 overexpression is associated with poor prognosis in hepatocellular carcinoma and meningioma,8,9 but its role in GC remains to be clarified.
Materials and Methods
Data Download and Preprocessing
The Cancer Genome Atlas (TCGA, https://cancergenome.nih.gov/) provides publicly available cancer genome data sets. The TCGA database contains data on 408 STAD tissue samples and 36 normal stomach tissues. The raw TCGA data were normalized, and the limma software package was used to identify differentially expressed genes (DEGs). Univariate Cox regression analysis was performed to identify prognostic genes, and genes were considered significant with a cut-off of P < 0.05. The Search Tool for the Retrieval of Interacting Genes (STRING) (http://string-db.org; Version: 11.0) is an online tool used to predict the protein-protein interaction (PPI) network. Analysing the functional interactions between proteins can help us understand the mechanism of disease occurrence or development. Cytoscape is used to visualize complex networks, and it can be integrated with data on any type of attribute. The cytoHubba plug-in was used by Cytoscape software to identify hub nodes. First, the intersecting DEGs were imported into STRING for analysis, and the visual PPI network was constructed with Cytoscape. Then, the cytoHubba plug-in was used to identify the hub gene. Gene Ontology (GO) is a common method used for annotating genes and their products. Large-scale gene annotation often uses this analytical method, which includes three parts: molecular function (MF), biological process (BP) and cellular component (CC). The Kyoto Encyclopedia of Genes and Genomes (KEGG) is a bioinformatics resource that links the genome to biological functions and the environment. GO analysis and KEGG pathway analysis was performed for the intersecting genes.
Verification of Differential Expression of LAMC1 in GC
With the GEPIA2 (http://gepia2.cancer-pku.cn/) and TIMER (https://cistrome.shinyapps.io/timer/) databases, we verified the differential expression of LAMC1 between GC samples and adjacent samples. The GEPIA2 platform includes RNA sequencing data of 9736 tumour tissues and 8587 normal tissues from TCGA and GTEx, and its main functions are gene expression analysis, gene correlation analysis, survival analysis, similar gene prediction, dimension reduction analysis, etc.10 The mRNA expression level of LAMC1 in GC and other major cancers was assessed by the GEPIA2 and TIMER databases.
Analysis of the Association Between Prognosis and LAMC1
The Kaplan-Meier Plotter (http://kmplot.com/analysis/) platform can assess the impact of more than 50,000 genes (mRNA, miRNA, protein) on survival rates for 21 cancer types (mainly gastric (n=6234), ovarian (n=2190), lung (n=3452), and gastric (n=1440) cancers). GEPIA2 is a newly developed interactive web server used to analyse RNA sequencing expression data. We explored the correlation between LAMC1 and the prognosis of patients with GC using Kaplan-Meier Plotter and GEPIA2.
Verification of LAMC1 Expression Levels in Cells and Tissues
The Human Protein Atlas is an open-access database that maps all of the proteins in human organs, tissues and cells by integrating data from various omics techniques. The mRNA expression level of LAMC1 in organs, tissues and major cancers was assessed by using the Human Protein Atlas and TIMER databases. The Broad Institute Cancer Cell Line Encyclopedia (CCLE) database is a tumour genomics research project that has collected and collated histological data from more than 1000 tumour cell lines.11 We used these three databases to preliminarily verify the expression level of LAMC1 at different levels.
Analysis of the Correlation Between LAMC1 and Immune Cell Infiltration
Immune cell infiltration is closely related to the prognosis of patients with GC. With the increase in targeted therapy availability and the progress in research on the molecular mechanism underlying the occurrence and development of GC, molecular targeted therapy options for GC are gradually emerging. Immune checkpoint proteins play an important role in the immune response and interact with immune cells in many ways. To further explore the potential therapeutic targets of prognostic genes, we investigated the correlation between LAMC1 and immunity in the TIMER database.
Univariate and Multivariate Cox Regression Analysis of LAMC1
Univariate and multivariate Cox regression analyses were used to analyse survival. Multivariate Cox analysis was used to compare the effects of LAMC1 expression and other clinical characteristics on survival. Taking the optimal interception value as the standard, the data were divided into high and low LAMC1 expression groups. The threshold for statistical significance in the two-tailed test was set at 0.05.
LAMC1 Mutation and Gene Set Enrichment Analysis (GSEA)
We visually analysed the top 15 mutated genes in GC and LAMC1 through the maftools package of R language. To explore the important enriched pathways between the high-risk patients and low-risk patients, we conducted GSEA. “h.all.v.7.1.symbols. gmt” was used as the reference gene set, GSEA software GSEA 4.0.3 was used, and genome replacement was carried out 1000 times to obtain the standardized enrichment score of each analysis. To find the relevant pathways of LAMC1, Gene Set Variation Analysis (GSVA) was applied according to the gene sets from KEGG database. A nominal p < 0.05 and a false discovery rate < 0.05 were considered significant.
Analysis of the Correlation Between LAMC1 and FGFR1
We explored the genes with the most similar expression pattern to that of LAMC1 using GEPIA2 “Similar Genes” and found that the expression pattern of LAMC1 correlated the most with that oFGFR1. Then, we downloaded the original expression matrix from TCGA and GTEx and visualized the similarity between LAMC1 and FGFR1 using R language.12
Cell Culture
The normal human cell line GES-1 and human GC cell lines HGC-27, AGS, MKN45, NCI-N87 and KATO III were purchased from the Cell Resource Center, PMUC (Beijing China). All cells were maintained in Dulbecco’s modified Eagle’s medium (RPMI-1640; Gibco, USA) supplemented with 10% foetal bovine serum (FBS; Gibco) and 1% penicillin and streptomycin (Gibco). The cells were cultured in a 5% CO2-humidified atmosphere at 37°C.
RNA Extraction, Reverse-Transcription RNA, and Quantitative Real-Time Polymerase Chain Reaction
Total RNA was extracted from cell lines by using TRIzol reagent (Invitrogen), reverse transcription was performed by using the PrimeScript RT reagent Kit (Takara, Japan), and cDNA was synthesized according to the manufacturer’s instructions. The qPCR assay was performed using a LightCycler 480 system (Roche, Switzerland) and SYBR Green (Takara). The following primers were used to target LAMC1: (F), GTAAATGGCAAAGCTCTCCG and (R), CAGTACCCCAGCTCCATCAA. The following primers were used to target GAPDH: (F), GGAGCGAGATCCCTCCAAAAT and (R), GGCTGTTGTCATACTTCTCATGG.
Statistical Analysis
The statistical software SPSS 20.0 was used for data analysis. DEGs between GC tissues and normal breast tissues were identified using the limma package in R. Fold-change (FC) values were calculated and the DEGs were further selected based on the following cutoff criteria: P<0.05 and log |FC|>1. These DEGs were grouped and analyzed using the Gene Ontology (GO) enrichment analysis with the GOseq R package, in which gene length bias was corrected. GO terms with corrected P<0.05 were considered significantly enriched. Subsequently, these DEGs were grouped into gene pathways using the pathway enrichment analysis with the Kyoto Encyclopedia of Genes and Genomes database, the statistical enriched DEGs in KEGG pathways were considered significant with corrected P<0.05. Student’s t-test and analysis of variance were used to compare different groups. P< 0.05 was considered statistically significant.
Results
The original expression data from the TCGA dataset were preprocessed using functions built into the limma package, and the mean gene expression level of each sample was very similar. In total, 4656 DEGs were screened out from the TCGA dataset, and 4335 were screened out as prognosis-related genes. Additionally, 266 prognostic DEGs were identified in both datasets (Table 1). The results are shown in a Venn diagram (Figure 1A). A total of 266 DEGs were analysed by the STRING tool, and the protein interaction relationship data were imported into Cytoscape to construct a PPI network (Figure 1B). To detect important clustered modules in the PPI network, we used the cytoHubba plug-in to identify the hub genes. The MCC algorithm was used to identify FN1, FBN1, COL3A1, COL1A2, COL1A1, SP ARC, COL5A1, BGN, COL5A2, LUM, THBS2, VCAN, COL4A1, LOX, COL11A1, FSTL1, LAMC1, FGG, F5 and CDH2 as hub genes (Figure 1C, Table 1). We carried out functional enrichment analysis to further study the DEGs. The results of GO analysis showed that the DEGs were mainly concentrated in extracellular structure organization, extracellular matrix organization, cell substrate adhesion, collagen-containing extracellular matrix, endoplasmic reticulum lumen, and extracellular matrix structural constitution (Figure 2A). KEGG pathway enrichment analysis showed that the DEGs were mainly enriched in the PI3K/Akt signalling pathway, human papillomavirus infection, AGE-RAGE signalling pathway in diabetic complications, amoebiasis, protein digestion and absorption (Figure 2B).
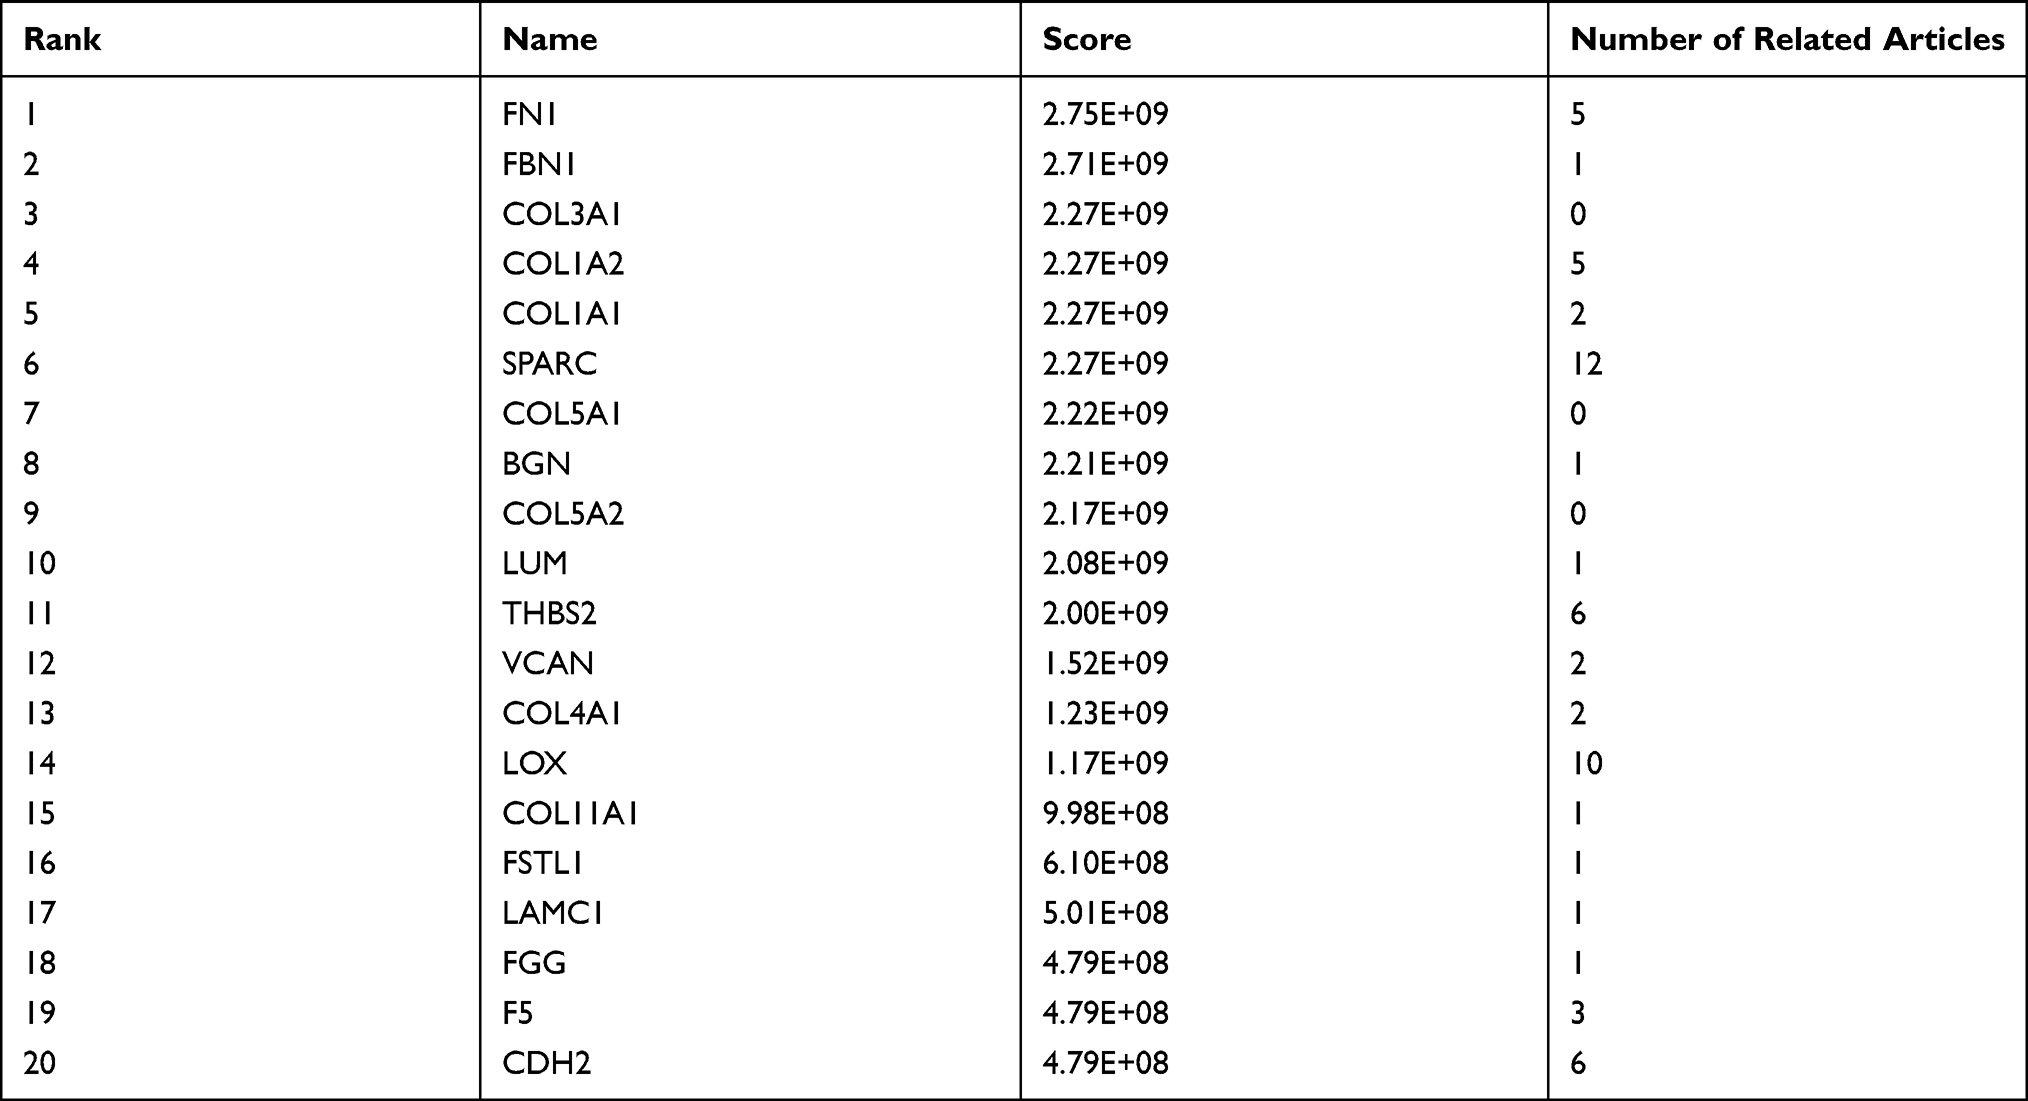 |
Table 1 Top 20 in Network and Number of Related Articles |
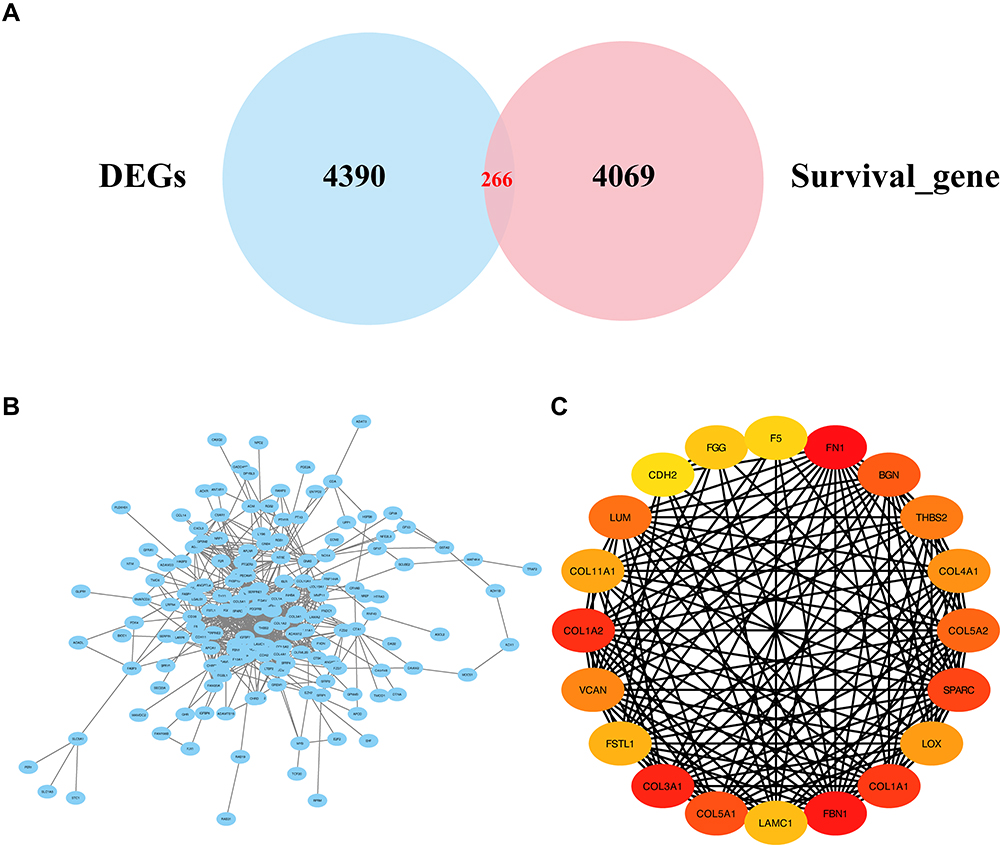 |
Figure 1 Venn diagram of the screened datasets and PPI network diagram. (A) The intersection of DEGs and survival genes. (B) Protein-protein interaction networks of 266 DEGs.Blue circular nodes represent proteins that interact with the proteins encoded by DEGs. (C)The top 20 hub genes in PPIN were identified by the Cytoscape (v3.6.1) plugin cytoHubba based on their connectivity degree. The 20 identified hub genes are displayed from red (high degree value) to yellow (low degree value). Abbreviation: PPIN, protein-protein interaction network. |
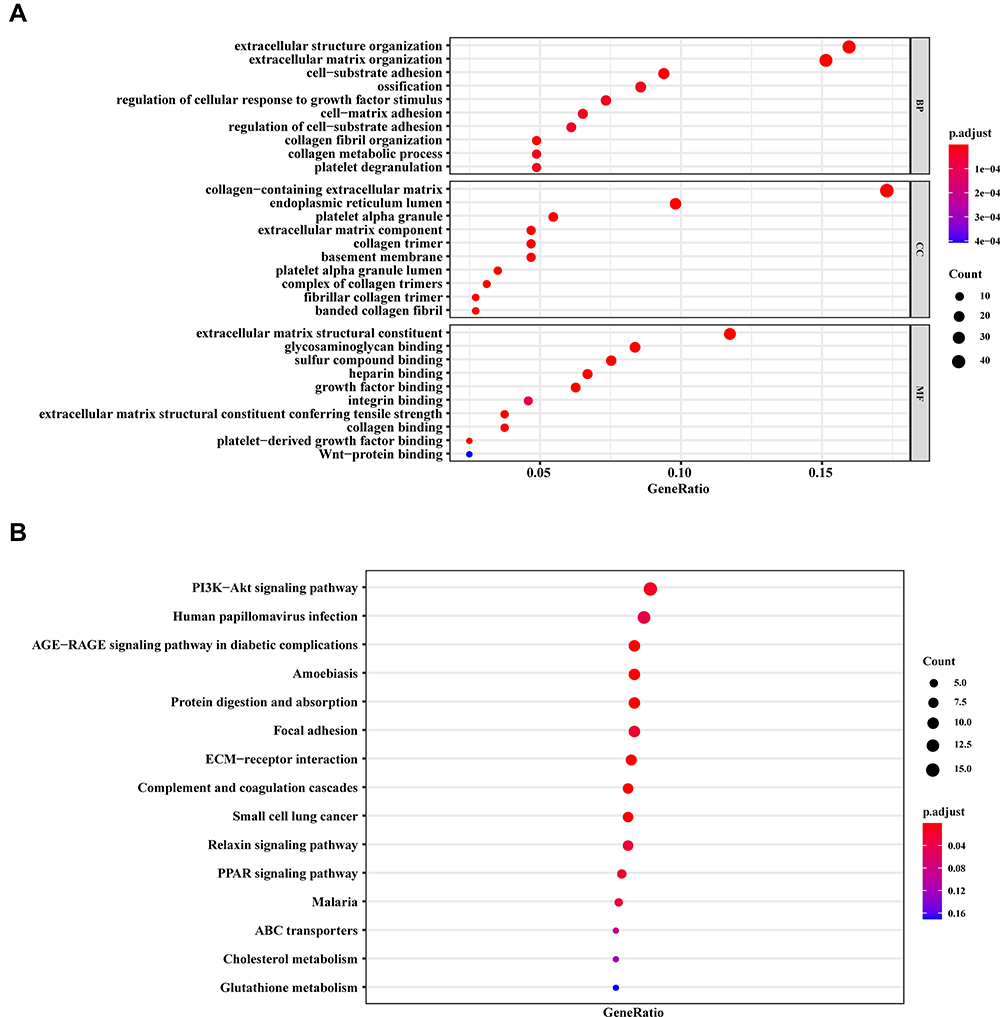 |
Figure 2 GO annotation and KEGG pathway enrichment analysis of DEGs. (A) The top 10 enriched GO, BP, CC and MF terms. (B) The top 15 KEGG pathways. Abbreviations: GO, Gene Ontology; KEGG, Kyoto Encyclopedia of Genes and Genomes; DEGs, differentially expressed genes; BP, biological process; CC, cellular component; MF, molecular function. |
The results of the LAMC1 expression analysis in various cancers showed that LAMC1 expression was increased in many cancers, such as GBM, LGG, STAD and PAAD, compared with the controls. However, the expression of LAMC1 was decreased in BLCA, BRCA, CESC and a few other cancers. The results from the GEPIA2 (Figure 3A) and TIMER (Figure 3C) databases showed that LAMC1 was increased in GC compared with the normal control tissue (Figure 3B).
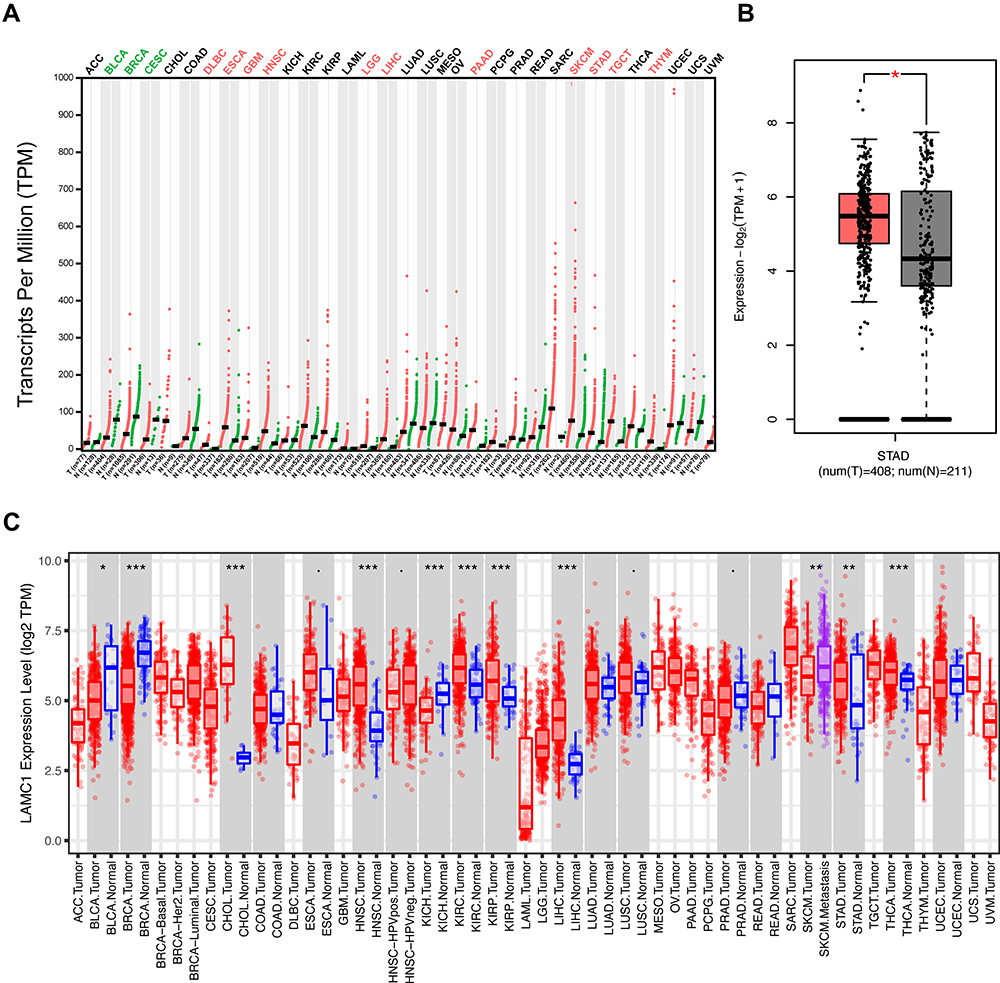 |
Figure 3 Differential expression of LAMC1 in various cancers. (A) The expression of LAMC1 in all cancers in the GEPIA2 database. Red indicates high expression in the indicated cancer, green indicates low expression in the indicated cancer, and black indicates no difference in expression. (B) The expression of LAMC1 in STAD according to GEPIA2. (C) The expression of LAMC1 in all cancers in the TIMER database (*P<0.05, **P<0.01, ***P<0.001). |
According to the results of the correlation analysis in GEPIA2 or the Kaplan-Meier database, LAMC1 expression is closely related to the prognosis of patients with GC, suggesting that it may be a potential prognostic marker in the GC. The results showed high LAMC1 expression in the groups with poor prognosis (Figure 4A and B), and the survival analysis results and survival map show that the expression of LAMC1 in the tumour to the prognosis of patients with LGG, UVM BLCA, CESC, KIRP, LGG, and UVM (Figure 4C).
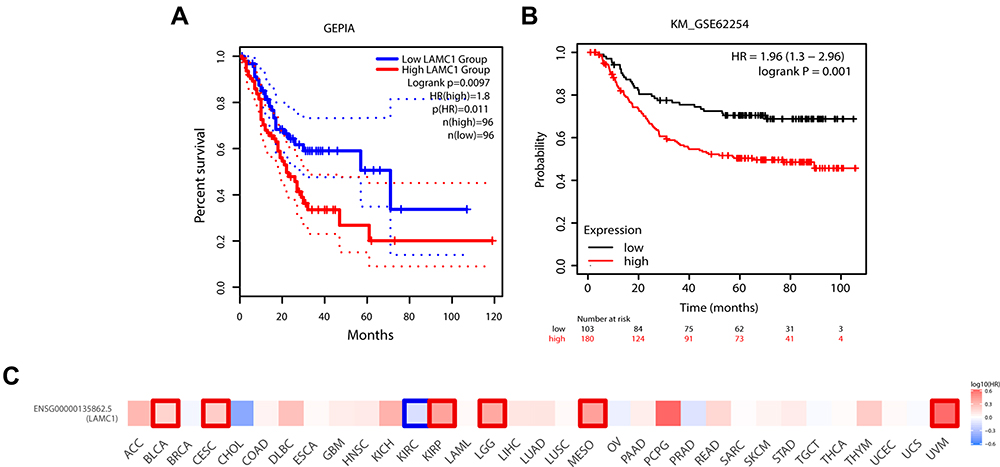 |
Figure 4 LAMC1 and its relationship with the prognosis of gastric cancer in different databases. (A) The relationship between the expression of LAMC1 and prognosis according to GEPIA2. (B) Survival analysis in the GSE62254. (C) The correlation between LAMC1 and prognosis according to GEPIA2. Red represents the highest correlation, and blue represents the lowest correlation. |
The results of the validation analysis of LAMC1 expression in human tissues showed that LAMC1 mRNA was highly expressed in normal kidney tissues, soft tissues, female-specific tissues and stomach tissues, and the pattern of LAMC1 protein expression in normal human tissues was basically consistent with that of LAMC1 mRNA expression (Figure 5). Verification experiments in cell lines showed that LAMC1 was highly expressed in gastric cancer cell lines (Figure 6A and B).
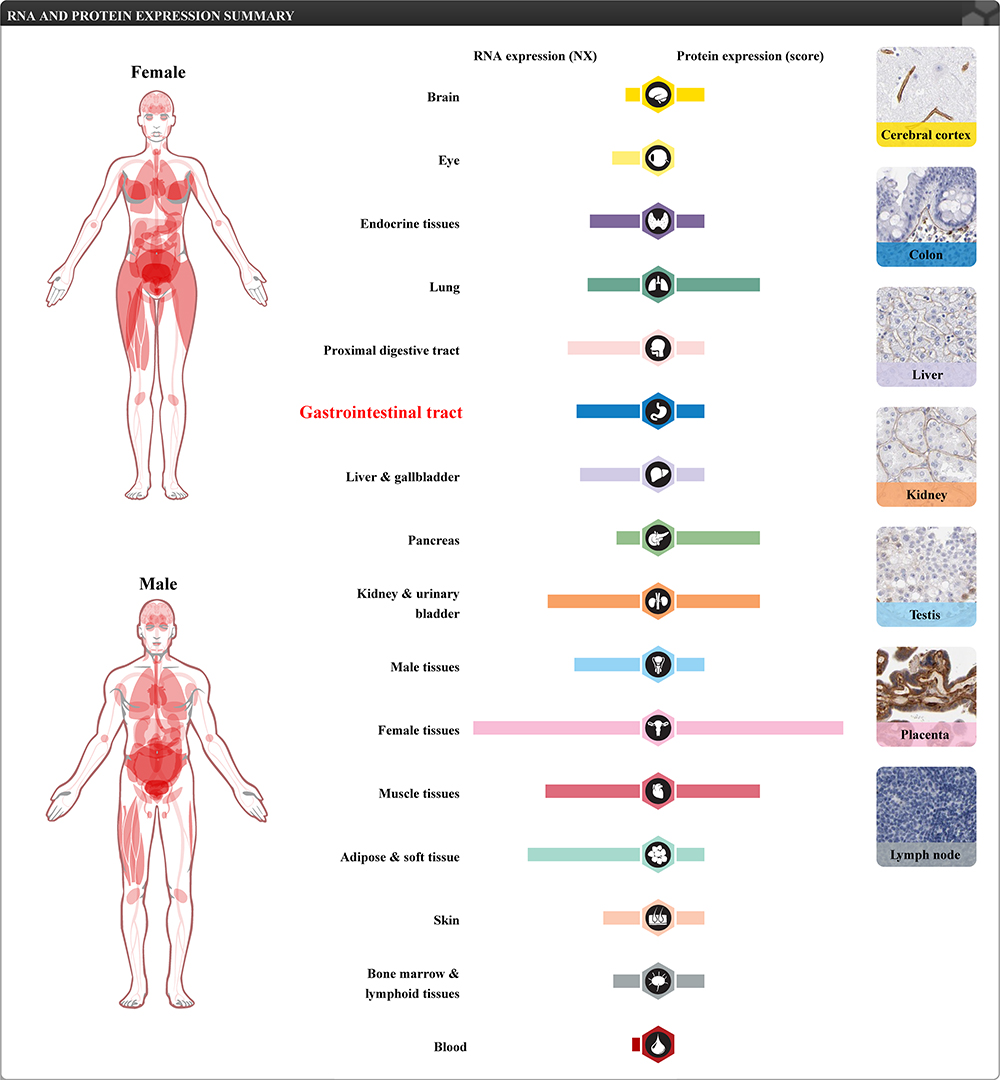 |
Figure 5 Verification of LAMC1 expression in human tissues. Red indicates high expression in the indicated part of the body. |
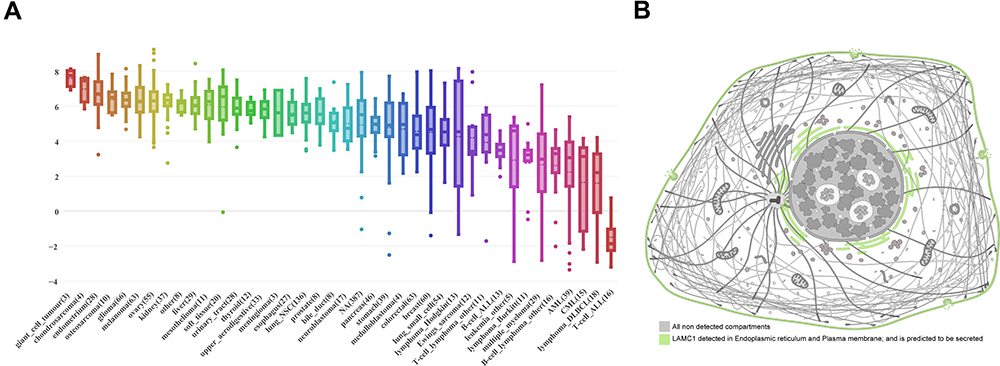 |
Figure 6 Verification of LAMC1 expression in cell lines. (A) The expression of LAMC1 in CCLE ranged from high to low in all tissues. (B) LAMC1 expression in cells. |
The results of univariate Cox analysis showed that age, stage 4 and LAMC1 can be used as independent prognostic factors for patients with gastric cancer (Table 2). Subsequent multivariate Cox regression analysis showed that age, stage 3, stage 4 and LAMC1 had an impact on the survival rate of patients with gastric cancer (Table 3).
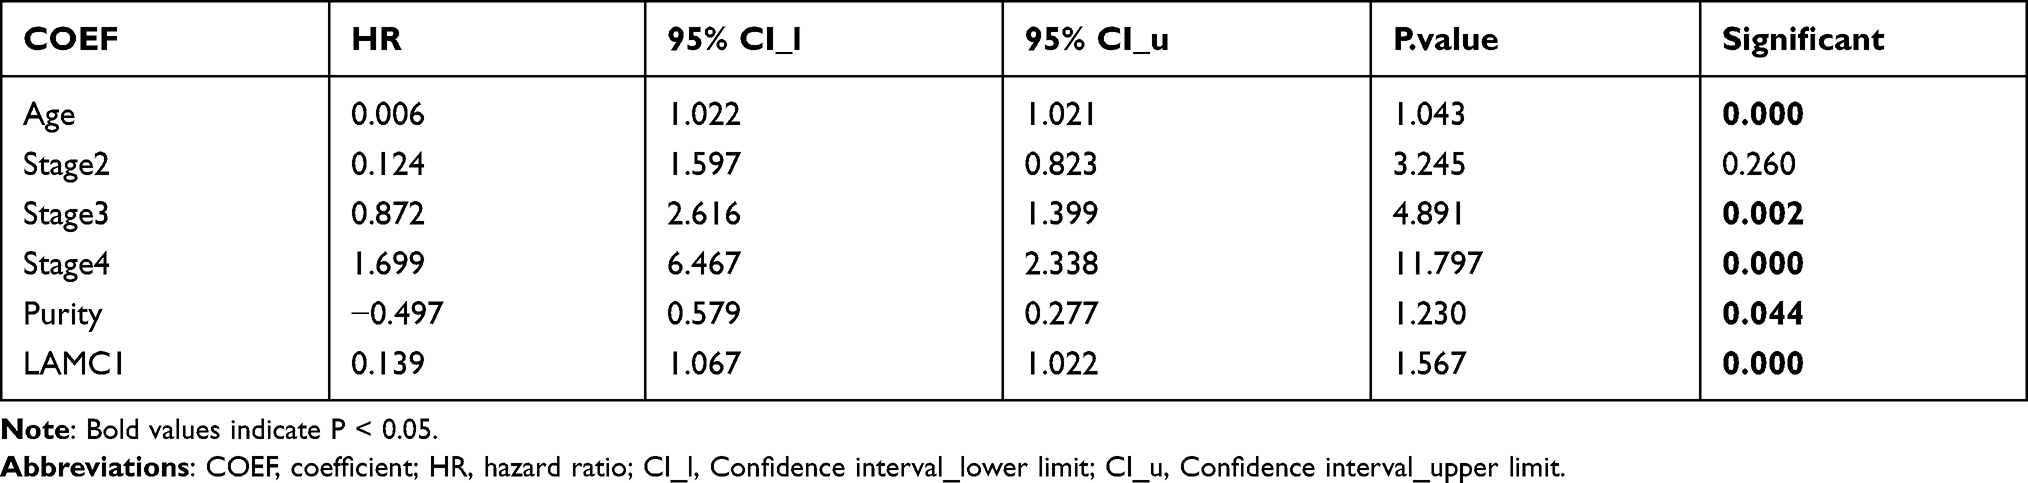 |
Table 2 Univariate COX Regression Analysis |
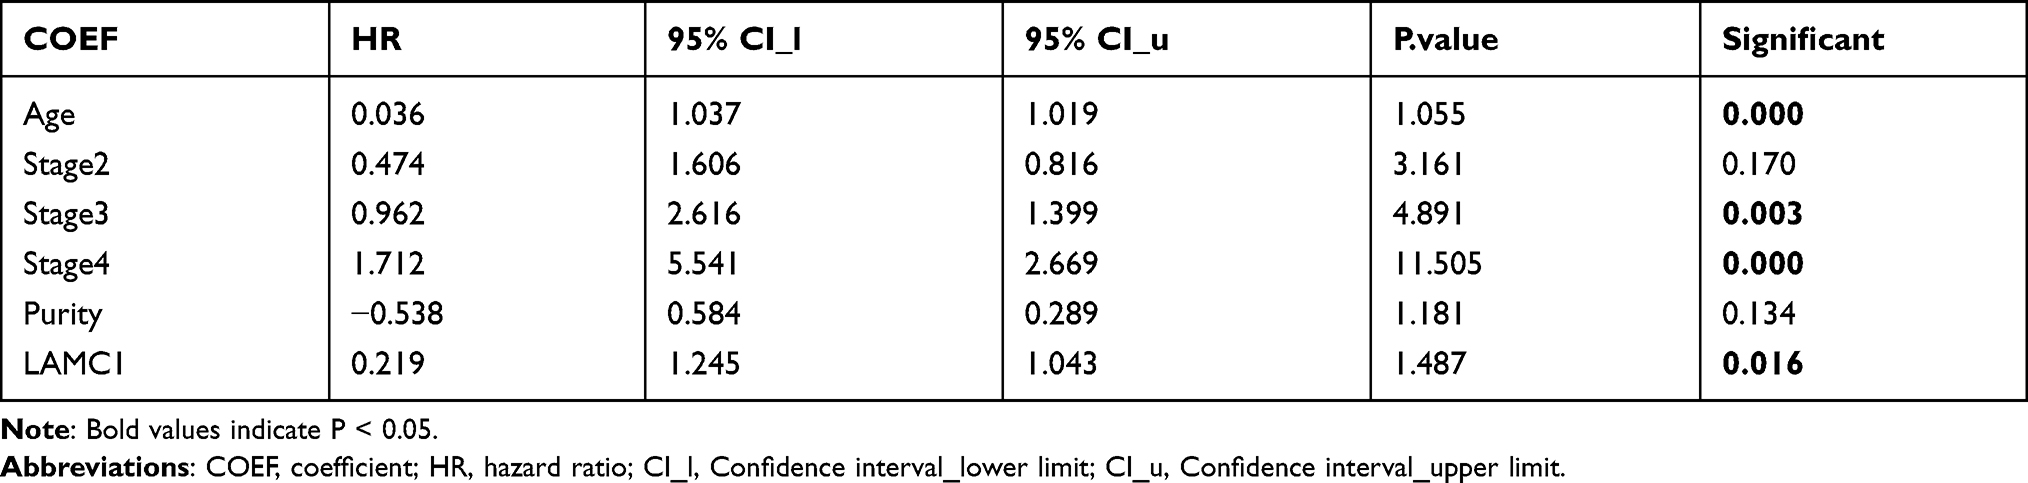 |
Table 3 Multivariate COX Regression Analysis |
The correlation analysis results of LAMC1 with tumour purity and immune cells showed that LAMC1 expression was significantly negatively correlated with tumour purity and CD8+ T cells (cor=−0.007, p=8.89e-01) and was significantly positively correlated with the levels of infiltrating CD4+ T cells, macrophages, neutrophils, and dendritic cells in STAD. The expression of LAMC1 was most correlated with macrophages (cor=0.463, p=4.43e-21) (Figure 7A). Similarly, the correlation analysis of LAMC1 gene copy number and immune cell infiltration showed that LAMC1 gene copy number was closely related to CD4+ T cells.In CD4+ T Cell, compared to Diploid/Normal, Arm-level Deletion, Arm-level Gain and High Amplification are all statistically different, so we describe it as the most relevant to CD4+ T Cell (Figure 7B). As shown in Figure 8A, we assessed the expression of LAMC1 in the two subtypes of CD4+ T cells and macrophages. The results show that in STAD, CD4+ memory resting _CIBERSORT-ABS T cells were most highly correlated with LAMC1 expression, and CD4+ Th1_XCELL T cells were the least correlated. The results of the macrophage analysis show that LAMC1 was most highly correlated with Macrophage_TIMER and least correlated with Macrophage_CIBERSORT-ABS (Figure 8B).
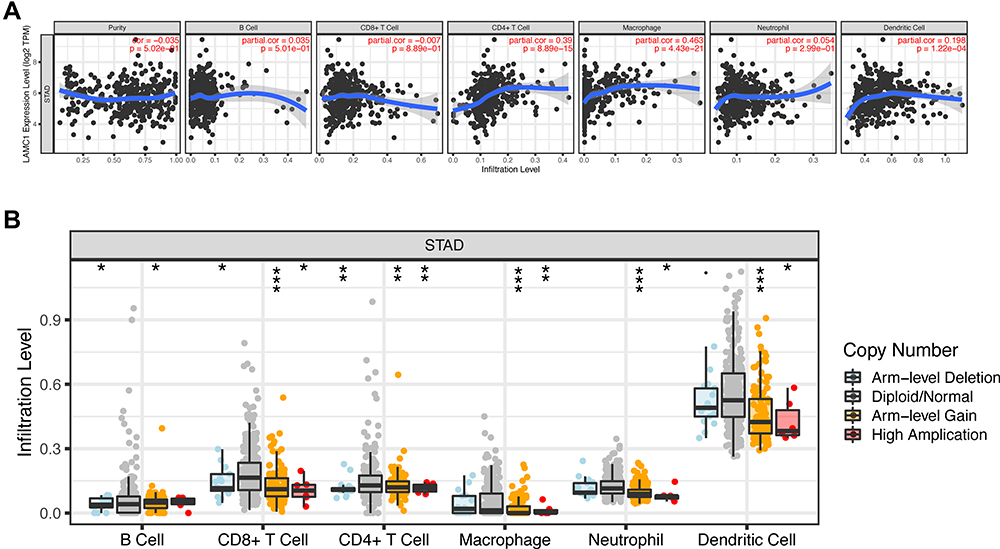 |
Figure 7 LAMC1 expression and the correlation between immune in gastric cancer. (A) Correlation between the expression of LAMC1 and immune cell infiltration. (B) Relationship between LAMC1 expression level and gene copy number in STAD. (*P<0.05, **P<0.01, ***P<0.001). |
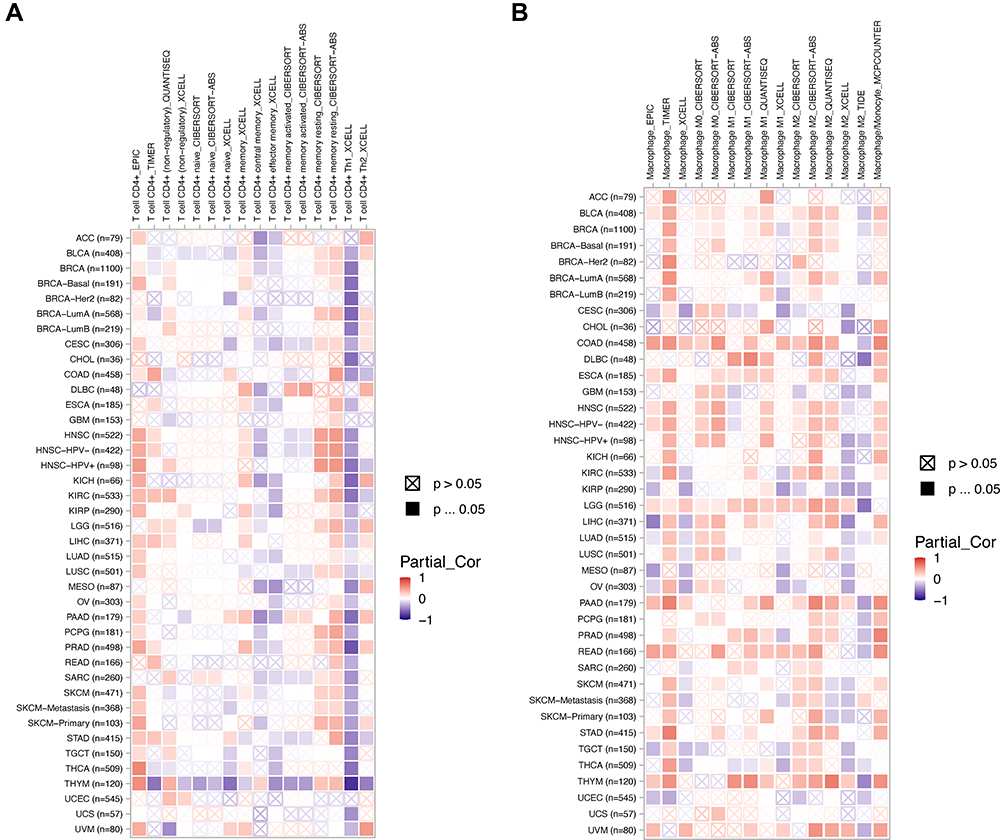 |
Figure 8 Relationship between LAMC1 and CD4+ T cell subtypes and macrophage subtypes in STAD. Correlation between LAMC1 and (A) CD4+ T cell subtypes and (B) macrophage subtypes. Red indicates high correlation, and purple indicates low correlation. |
To investigate the difference between LAMC1 and top 15 mutated genes in GC, mutation analysis was conducted. As shown in Figure 9, LAMC1 had few mutations in TTN mutations in gastric cancer account for 53%, while LAMC1 mutations are only 4% (Figure 9). The results of single gene GSEA of LAMC1 showed that the group with high LAMC1 expression was mainly enriched in myogenesis, apical junction, haem metabolism and other pathways (Figure 10A). The GSVA results showed that genes downregulated in response to UV signalling and those involved in hedgehog signalling, TGFβ signalling, haem metabolism and apoptosis were enriched, which were consistent with the results of GSEA (Figure 10B).
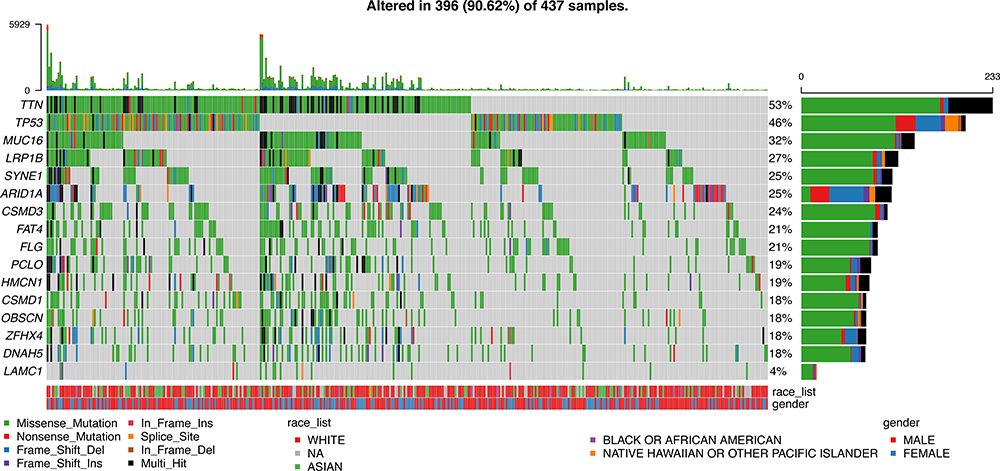 |
Figure 9 Mutation analysis of LAMC1. |
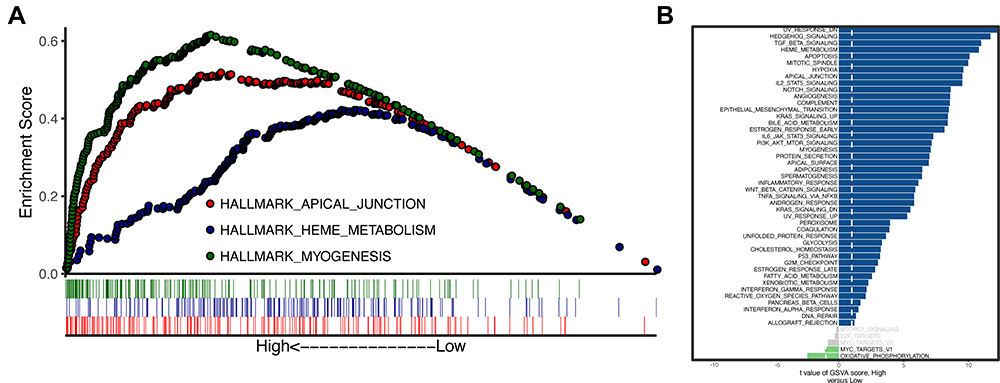 |
Figure 10 GSEA and GSVA of LAMC1. (A) The ordinate from left to right is high to low LAMC1 expression. (B) GSVA showed that the most obvious mutation was UV_RESPONSE_DN. |
The RT-qPCR results (Figure 11) showed that the AGS cell line showed higher LAMC1 expression than normal epithelial cells, that the KATOIII cell line showed lower expression than normal epithelial cells, and that the MKN45 cell line showed the same expression level as normal epithelial cells (* p < 0.05, **** p < 0.0001).
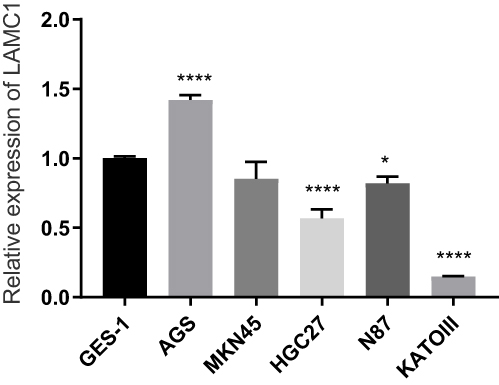 |
Figure 11 LAMC1 expression in normal gastric epithelial cell and 5 gastric cancer cell lines. (*P<0.05, ****P<0.0001). |
The results of the correlation analysis between LAMC1 and FGFR1 show that LAMC1 and FGFR1 have a strong correlation in all major tumours and GC tissues alone, among which LAMC1 and FGFR1 are obviously positively correlated in most cancers (r=0.38, p<0.01), while LAMC1 and FGFR1 are more obviously positive correlated in gastric cancer tissues (Figure 12).
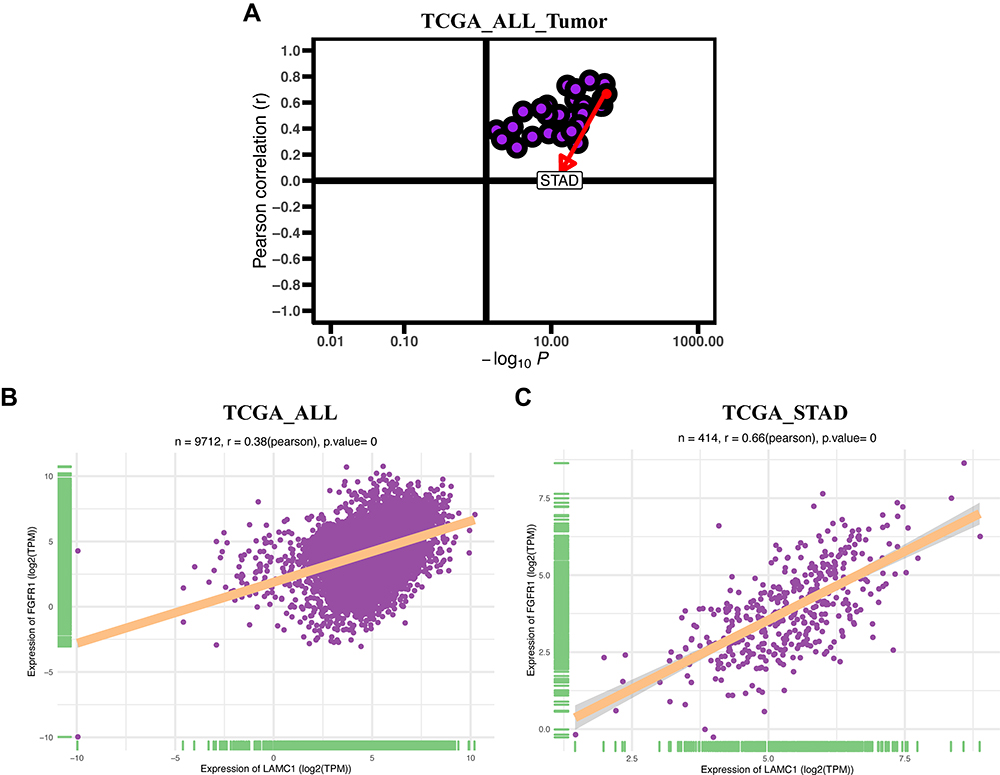 |
Figure 12 Correlation between LAMC1 and FGFR. (A) The Pearson correlation of all tumours in TCGA. (B) Correlation analysis between LAMC1 and FGFR1 in all tumours in TCGA. (C) Correlation analysis between LAMC1 and FGFR1 in STAD in TCGA. |
Discussion
The occurrence and development of GC is driven by a series of genomic changes. It is of great importance to understand the molecular mechanisms associated with GC for its diagnosis and treatment. The development of microarrays and high-throughput sequencing has been widely used to identify potential therapeutic and prognostic targets for a variety of cancers.13,14 We also used these methods to identify therapeutic and prognostic targets for GC.
Cell adhesion and the PI3K/Akt signalling pathway were identified as critical processes through the GO and KEGG analysis of DEGs. Cell adhesion is a biological interaction, and many adhesion molecules are abnormally expressed in GC and can be used as useful markers to predict tumour progression and prognosis.15 The PI3K/Akt signalling pathway also plays an important role in tumour progression.16 We identified LAMC1 as one of the hub genes through the analysis of DEGs with different software. We have not seen many reports on this gene in GC thus far. All the results in the major databases showed that LAMC1 was more highly expressed in GC tissues than in paracancerous tissues, and LAMC1 was also highly expressed in GC cell lines. Survival analysis showed that the survival rate of the high-expression group was significantly lower than that of the low-expression group. In addition, the same is true for other cancers. The transcriptome data from 247 HCC patients analysed by unbiased randomized forest analysis showed that high LAMC1 expression was associated with advanced tumour stage and poor overall and disease-free survival.17
LAMC1 can increase the occurrence and development of endometrial cancer by enhancing the invasion and movement ability of endometrial cancer cells, and the expression of LAMC1 increases gradually from atypical hyperplasia to low-grade endometrial cancer to high-grade endometrial cancer.18 In glioblastoma multiforme (GBM), LAMC1 is also considered to be a potential prognostic indicator.19 These findings suggest that LAMC1 may be used as a tumour marker, as a target for GC therapy and as a prognostic indicator.
Immunotherapy has revolutionized cancer therapy by providing additional alternative treatments.20 Immunotherapy activates an anti-tumour immune response to cancer cells by selectively recognizing and binding to immunosuppressive proteins expressed on tumour cells, macrophages, and T cells.21 We found that laminin supports and influences the migration and function of immune cells and can be used as a potential target for immune regulation.22–24 Therefore, our study also examined the correlation between LAMC1 and immunity, and the expression of LAMC1 was closely related to macrophages and CD4+ T cells. The relationship between laminin and macrophages was also indicated in 1985. Laminin subtypes also stimulate T cell proliferation.25 Our research provides a reference for the development of immunotherapy.
GSEA enabled us to understand the main enriched pathway in GC patients with high LAMC1 expression, and the activation of the myogenesis pathway may be due to muscle loss induced by tumours.26 Apical junctions are closely related to Helicobacter pylori, which is commonly found in patients with GC.27 The haem metabolism pathway also enhances the tumorigenicity of NSCLC cells.28 Activation of the hedgehog signalling pathway is strongly associated with the occurrence of cancer as evidenced by GSVA,29 and TGFβ signalling is a key factor in the regulation of cancer cell behaviour.30 Activation and enrichment of these pathways provide additional information for us to study the role of LAMC1 in GC. Although the biological significance of LAMC1 in tumours has been elucidated, the regulatory mechanism of abnormal LAMC1 expression and its functional mechanism remain to be studied. Activation of fibroblast growth factor receptor 1 (FGFR1) is associated with a large number of human cancers,31–33 and FGFR1 promotes the proliferation, survival, and migration of GC cells.34 We investigated the correlation between LAMC1 and FGFR1 in GC and found a high positive correlation between them. Because multiple genes can affect the tumour through FGFR1 signalling, we hypothesized that LAMC1 might also influence the occurrence and development of GC through its influence on FGFR1.35,36 Additionally, FGFR inhibitors have multiple mechanisms to overcome drug resistance, so FGFR-targeted therapy is an effective strategy for the treatment of refractory cancer.37 We identified LAMC1 as a potential therapeutic target for GC because of its high correlation with FGFR1, and a combination of FGFR1 inhibitors is a promising approach for GC treatment.38
Although we have performed much research on the role of LAMC1 in GC, we should acknowledge the limitations of our research. First, we need to experimentally validate the results. Second, this study was completely based on a public database. We only selected real-time polymerase chain reaction to verify LAMC1 expression in normal gastric epithelial cells and in different gastric cancer cells, so we need to further verify LAMC1 expression through Western blot analysis and other experiments. Finally, we only hypothesized that LAMC1 might influence the occurrence and development of GC by affecting FGFR1, but we did not further verify our conjecture.
Conclusion
In summary, our results indicate that LAMC1 is a gene with significant diagnostic and therapeutic potential in GC.
Ethics Statement
The authors are accountable for all aspects of the work in ensuring that questions related to the accuracy or integrity of any part of the work are appropriately investigated and resolved. The study was conducted in accordance with the Declaration of Helsinki (as revised in 2013). Approval was received for this study from the ethics committee of The Lanzhou University Second Hospital (2021A-605).
Acknowledgments
We thank Hao Chen of LanZhou University for help with the project design.
Funding
This research was supported by National Natural Science Foundation of China (No. 81670594, 81470791, 81376597), Key Talents Project of Gansu Province (No. 2019RCXM020), Key Project of Science and Technology in Gansu province (19ZD2WA001), Science and technology project of Chengguan District of Lanzhou City(2019RCCX0034), Cuiying Scientific and Technological Innovation Program of Lanzhou University Second Hospital(No. CY2017-ZD01) and Science and technology project of Chengguan District of Lanzhou City (2020SHFZ0039).
Disclosure
The authors report no conflicts of interest in this work.
References
1. GBD 2017 Stomach Cancer Collaborators. Systematic analysis for the Global Burden of Disease study 2017. Lancet. 2020;5(1):42–54. doi:10.1016/S2468-1253(19)30328-0.
2. Rebecca L, Siegel M, Kimberly D, Miller MP, Ahmedin Jemal DV. Cancer statistics, 2017. CA Cancer J Clin. 2017;67:7–30.
3. Kulasingam V, Diamandis EP. Strategies for discovering novel cancer biomarkers through utilization of emerging technologies. Nat Clin Pract Oncol. 2008;5(10):588–599. doi:10.1038/ncponc1187
4. Muhammad SA, Raza W, Nguyen T, Bai B, Wu X, Chen J. Cellular signaling pathways in insulin resistance-systems biology analyses of microarray dataset reveals new drug target gene signatures of type 2 diabetes mellitus. Front Physiol. 2017;8:13. doi:10.3389/fphys.2017.00013
5. Domogatskaya A, Rodin S, Tryggvason K. Functional diversity of laminins. Annu Rev Cell Dev Biol. 2012;28:523–553. doi:10.1146/annurev-cellbio-101011-155750
6. Marinkovich MP. Tumour microenvironment: laminin 332 in squamous-cell carcinoma. Nat Rev Cancer. 2007;7(5):370–380. doi:10.1038/nrc2089
7. Kuhn E, Kurman RJ, Soslow RA, et al. The diagnostic and biological implications of laminin expression in serous tubal intraepithelial carcinoma. Am J Surg Pathol. 2012;36(12):1826–1834. doi:10.1097/PAS.0b013e31825ec07a
8. Zhang Y, Xi S, Chen J, et al. Overexpression of LAMC1 predicts poor prognosis and enhances tumor cell invasion and migration in hepatocellular carcinoma. J Cancer. 2017;8(15):2992–3000. doi:10.7150/jca.21038
9. Ke HL, Ke RH, Li B, Wang XH, Wang YN, Wang XQ. Association between laminin γ1 expression and meningioma grade, recurrence, and progression-free survival. Acta Neurochir (Wien). 2013;155(1):165–171. doi:10.1007/s00701-012-1512-0
10. Tang Z, Kang B, Li C, et al. GEPIA2: an enhanced web server for large-scale expression profiling and interactive analysis. Nucleic Acids Res. 2019;47(W1):W556–W560. doi:10.1093/nar/gkz430
11. Ghandi M, Huang FW, Jané-Valbuena J, et al. Next-generation characterization of the cancer cell line encyclopedia. Nature. 2019;569(7757):503–508. doi:10.1038/s41586-019-1186-3
12. Wen X, Shao Z, Chen S, et al. Construction of an RNA-binding protein-related prognostic model for pancreatic adenocarcinoma based on TCGA and GTEx databases. Front Genet. 2021;11:610350. doi:10.3389/fgene.2020.610350
13. Huang H, Weng H, Zhou K, et al. Histone H3 trimethylation at lysine 36 guides m6A RNA modification co-transcriptionally. Nature. 2019;567(7748):414–419. doi:10.1038/s41586-019-1016-7
14. Argani P, Rosty C, Reiter RE, et al. Discovery of new markers of cancer through serial analysis of gene expression: prostate stem cell antigen is overexpressed in pancreatic adenocarcinoma. Cancer Res. 2001;61(11):4320–4324.
15. Wang YY, Li L, Zhao ZS, et al. L1 and epithelial cell adhesion molecules associated with gastric cancer progression and prognosis in examination of specimens from 601 patients. J Exp Clin Cancer Res. 2013;32(1):66. doi:10.1186/1756-9966-32-66
16. Polivka J, Janku F. Molecular targets for cancer therapy in the PI3K/AKT/mTOR pathway. Pharmacol Ther. 2014;142(2):164–175. doi:10.1016/j.pharmthera.2013.12.004
17. Désert MS, Desille M, Desille M, et al. “Fibrous nests” in human hepatocellular carcinoma express a Wnt-induced gene signature associated with poor clinical outcome. Int J Biochem Cell Biol. 2016;81:195–207. doi:10.1016/j.biocel.2016.08.017
18. Kashima H, Wu RC, Wang Y, et al. Laminin C1 expression by uterine carcinoma cells is associated with tumor progression. Gynecol Oncol. 2015;139(2):338–344. doi:10.1016/j.ygyno.2015.08.025
19. Huang SX, Zhao ZY, Weng GH, et al. The correlation of microRNA-181a and target genes with poor prognosis of glioblastoma patients. Int J Oncol. 2016;49(1):217–224. doi:10.3892/ijo.2016.3511
20. Riley RS, June CH, Langer R, et al. Delivery technologies for cancer immunotherapy. Nat Rev. 2019;18(3):175–196. doi:10.1038/s41573-018-0006-z
21. Kruger S, Ilmer M, Kobold S, et al. Advances in cancer immunotherapy 2019 - latest trends. J Exp Clin Cancer Res. 2019;38(1):268. doi:10.1186/s13046-019-1266-0
22. Johnston A, Murphy K, Jenkinson L, et al. Targeting of Fn14 prevents cancer-induced cachexia and prolongs survival. Cell. 2015;162(6):1365–1378. doi:10.1016/j.cell.2015.08.031
23. Simon T, Bromberg JS. Regulation of the immune system by laminins. Trends Immunol. 2017;38(11):858–871. doi:10.1016/j.it.2017.06.002
24. Warren KJ, Iwami D, Harris DG, et al. Laminins affect T cell trafficking and allograft fate. J Clin Invest. 2014;124(5):2204–2218. doi:10.1172/JCI73683
25. Saez A, Herrero-Fernandez B, Gomez-Bris R, et al. Lamin A/C and the immune system: one intermediate filament, many faces. Int J Mol Sci. 2020;21(17):6109. doi:10.3390/ijms21176109
26. Bohnsack JF, Kleinman HK, Takahashi T, et al. Connective tissue proteins and phagocytic cell function. Laminin enhances complement and Fc-mediated phagocytosis by cultured human macrophages. J Exp Med. 1985;161(5):912–923. doi:10.1084/jem.161.5.912
27. Wroblewski LE, Piazuelo MB, Chaturvedi R, et al. Helicobacter pylori targets cancer-associated apical-junctional constituents in gastroids and gastric epithelial cells. Gut. 2015;64(5):720–730. doi:10.1136/gutjnl-2014-307650
28. Sohoni S, Ghosh P, Wang T, et al. Elevated heme synthesis and uptake underpin intensified oxidative metabolism and tumorigenic functions in non-small cell lung cancer cells. Cancer Res. 2019;79(10):2511–2525. doi:10.1158/0008-5472.CAN-18-2156
29. Skoda AM, Simovic D, Karin V, et al. The role of the Hedgehog signaling pathway in cancer: a comprehensive review. Bosnian J Basic Med Sci. 2018;18(1):8–20. doi:10.17305/bjbms.2018.2756
30. Derynck R, Akhurst RJ, Balmain A, et al. TGF-beta signaling in tumor suppression and cancer progression. Nat Genet. 2001;29(2):117–129. doi:10.1038/ng1001-117
31. Neal DE, Bennett M, Hall R, et al. Epidermal-growth-factor receptors in human bladder cancer: comparison of invasive and superficial tumours. Lancet (London, England). 1985;325(8425):366–368. doi:10.1016/s0140-6736(85)91386-8
32. Turner N, Pearson A, Sharpe R, et al. FGFR1 amplification drives endocrine therapy resistance and is a therapeutic target in breast cancer. Cancer Res. 2010;70(5):2085–2094. doi:10.1158/0008-5472.CAN-09-3746
33. Schildhaus HU, Nogova L, Wolf J, et al. FGFR1 amplifications in squamous cell carcinomas of the lung: diagnostic and therapeutic implications. Transl Lung Cancer Res. 2013;2(2):92–100. doi:10.3978/j.issn.2218-6751.2013.03.03
34. Wu J, Du X, Li W, et al. A novel non-A TP competitive FGFR1 inhibitor with therapeutic potential on gastric cancer through inhibition of cell proliferation, survival and migration. Apoptosis. 2017;22(6):852–864. doi:10.1007/s10495-017-1361-7
35. Lu T, Li Z, Yang Y, et al. The Hippo/Y AP1 pathway interacts with FGFR1 signaling to maintain stemness in lung cancer. Cancer Lett. 2018;423:36–46. doi:10.1016/j.canlet.2018.02.015
36. Jones DTW, Hutter B, Jäger N, et al. Recurrent somatic alterations of FGFR1 and NTRK2 in pilocytic astrocytoma. Nat Genet. 2013;45(8):927–932. doi:10.1038/ng.2682
37. Katoh M, Nakagama H. FGF receptors: cancer biology and therapeutics. Med Res Rev. 2014;34(2):280–300. doi:10.1002/med.21288
38. Geberhiwot T, Assefa D, Kortesmaa J, et al. Laminin-8 (alpha4beta1gamma1) is synthesized by lymphoid cells, promotes lymphocyte migration and costimulates T cell proliferation. J Cell Sci. 2001;114(2):423–433. doi:10.1242/jcs.114.2.423
 © 2022 The Author(s). This work is published and licensed by Dove Medical Press Limited. The full terms of this license are available at https://www.dovepress.com/terms.php and incorporate the Creative Commons Attribution - Non Commercial (unported, v3.0) License.
By accessing the work you hereby accept the Terms. Non-commercial uses of the work are permitted without any further permission from Dove Medical Press Limited, provided the work is properly attributed. For permission for commercial use of this work, please see paragraphs 4.2 and 5 of our Terms.
© 2022 The Author(s). This work is published and licensed by Dove Medical Press Limited. The full terms of this license are available at https://www.dovepress.com/terms.php and incorporate the Creative Commons Attribution - Non Commercial (unported, v3.0) License.
By accessing the work you hereby accept the Terms. Non-commercial uses of the work are permitted without any further permission from Dove Medical Press Limited, provided the work is properly attributed. For permission for commercial use of this work, please see paragraphs 4.2 and 5 of our Terms.