")
Back to Journals » Drug Design, Development and Therapy » Volume 9
Lack of the effect of lobeglitazone, a peroxisome proliferator-activated receptor-γ agonist, on the pharmacokinetics and pharmacodynamics of warfarin
Authors Jung JA, Lee S, Kim T, Kim J , Kim C, Huh W, Ko J
Received 29 October 2014
Accepted for publication 12 December 2014
Published 2 March 2015 Volume 2015:9 Pages 737—743
DOI https://doi.org/10.2147/DDDT.S76591
Checked for plagiarism Yes
Review by Single anonymous peer review
Peer reviewer comments 3
Editor who approved publication: Prof. Dr. Wei Duan
Jin Ah Jung,1 Soo-Yun Lee,2 Tae-Eun Kim,3 Jung-Ryul Kim,1 Chin Kim,4 Wooseong Huh,1,5 Jae-Wook Ko1,2
1Department of Clinical Pharmacology and Therapeutics, Samsung Medical Center, 2Department of Health Sciences and Technology, Samsung Advanced Institute for Health Sciences and Technology, Sungkyunkwan University, 3Department of Clinical Pharmacology, Konkuk University Medical Center, 4Clinical Research Team, CKD Pharmaceuticals, 5Department of Internal Medicine, Samsung Medical Center, Sungkyunkwan University School of Medicine, Seoul, Republic of Korea
Aims: Lobeglitazone has been developed for the treatment of type 2 diabetes mellitus. This study was conducted to evaluate potential drug–drug interactions between lobeglitazone and warfarin, an anticoagulant with a narrow therapeutic index.
Methods: In this open-label, three-treatment, crossover study, 24 healthy male subjects were administered lobeglitazone (0.5 mg) for 1–12 days with warfarin (25 mg) on day 5 in one period. After a washout interval, subjects were administered warfarin (25 mg) alone in the other period. Pharmacokinetics of R- and S-warfarin and lobeglitazone, as well as pharmacodynamics of warfarin, as measured by international normalized ratio (INR) and factor VII activity, were assessed.
Results: The geometric mean ratios (GMRs) and 90% confidence intervals (CIs) for area under the curve from time zero to the time of the last quantifiable concentration (AUClast) for warfarin + lobeglitazone: warfarin alone were 1.0076 (90% CI: 0.9771, 1.0391) for R-warfarin and 0.9880 (90% CI: 0.9537, 1.0235) for S-warfarin. The maximum observed plasma concentration (Cmax) values were 1.0167 (90% CI: 0.9507, 1.0872) for R-warfarin and 1.0028 (90% CI: 0.9518, 1.0992) for S-warfarin, both of which were contained in the interval 0.80–1.25. Lobeglitazone had no effect on the area under the effect–time curve from time 0 to 168 hours (AUEC) of INR and factor VII activity, as demonstrated by the GMRs of 1.0091 (90% CI: 0.9872, 1.0314) and 0.9355 (90% CI: 0.9028, 0.9695), respectively. In addition, the pharmacokinetics of lobeglitazone was also unaffected by warfarin.
Conclusion: Concomitant administration of lobeglitazone and warfarin was well tolerated. Lobeglitazone had no meaningful effect on the pharmacokinetics or pharmacodynamics of warfarin. These findings indicate that lobeglitazone and warfarin can be coadministered without dosage adjustments for either drug.
Keywords: lobeglitazone, thiazolidinedione, warfarin, pharmacokinetics, pharmacodynamics
Introduction
Thiazolidinediones (TZDs) are synthetic ligands for peroxisome proliferator-activated receptor-gamma (PPAR-γ), which is expressed primarily in adipocytes and to a lesser extent in muscles. PPAR-γ activation stimulates fatty acid storage in adipocytes, which decreases the availability of free fatty acids and adipocyte-derived signaling molecules and improves insulin sensitivity in skeletal muscle.1 Lobeglitazone (CKD-501; Chong Kun Dang Pharmaceutical Corp, Seoul, Korea) is a PPAR-γ agonist with substituted pyrimidine derivatives containing TZD.2 Lobeglitazone has been shown to have more potent activity than the prototypic TZDs (ie, pioglitazone and rosiglitazone) in both in vitro and in vivo studies.2,3 In healthy volunteers, lobeglitazone has a favorable tolerability profile and exhibits linear pharmacokinetics (PK) over the dose range of 0.5–4.0 mg once daily.4 Following oral administration, lobeglitazone is rapidly absorbed with a time to maximum plasma concentration (Tmax) of 1.0–3.0 hours and is eliminated with a mean elimination half-life (t1/2) of 7.8–9.8 hours.1 On the basis of the favorable balance in the efficacy and safety profile, lobeglitazone was approved for the treatment of diabetes in 2013 by the Ministry of Food and Drug Safety, Republic of Korea.5
The use of warfarin, the mainstay of oral anticoagulant therapy, is often complicated by the narrow therapeutic index and wide interindividual variability. The dosage and administration of warfarin should be individualized for each patient according to the patient’s international normalized ratio (INR) response to the drug. Furthermore, small changes in its PK may lead to the need for dose adjustment.
Patients with diabetes are at increased risk of thromboembolic events.6 It has been estimated that higher blood glucose levels contribute to an additional 1.5 million deaths due to ischemic heart disease and 0.7 million deaths due to stroke every year.7 Patients with type 2 diabetes mellitus at risk of thromboembolic events are likely to be prescribed anticoagulation therapy, and the vitamin K antagonist warfarin is commonly used for this purpose.8 Hence, it is important to determine whether there are drug–drug interactions between warfarin and antidiabetic drugs. In vitro studies have indicated that lobeglitazone and its metabolites are unlikely to interfere with the PK of warfarin. However, because of the narrow therapeutic index of warfarin, the current clinical study was conducted to confirm the preclinical results that suggested a lack of clinical drug–drug interaction between lobeglitazone and warfarin. We believe that this information is needed because of the safety concerns associated with many TZDs9,10 and because case reports have identified interactions with warfarin.11,12 To this end, the present study (ClinicalTrials.gov registry number: NCT02002611) assessed PK, pharmacodynamics (PD), and safety of warfarin and lobeglitazone when administered alone and concomitantly in healthy subjects.
Materials and methods
Subjects
Eligible subjects were healthy males aged between 19 years and 55 years who had a body mass index within the range of 19–27 kg m−2. To be included, each subject had to have a clinically acceptable 12-lead electrocardiogram (ECG), vital signs, and physical examination results. Key exclusion criteria for the study included the following: 1) a history of hemorrhagic disease or bleeding tendency; 2) INR or activated partial thromboplastin time outside of the normal range; 3) within 30 days before screening, use of any medication that could affect the results of the study; 4) a history of hypersensitivity or allergic reaction to any of the study drugs; 5) a history of hereditary problems, such as galactose intolerance, Lapp lactase deficiency, or glucose–galactose malabsorption.
Study design
This was a single-center, open-label, randomized, two-sequence, two-period crossover study. One period (treatment AB) comprised treatment A, a once-daily oral dose of lobeglitazone (0.5 mg) for 4 days (days 1–4), and treatment B, a single oral dose of warfarin (25 mg) on day 5 and a single oral dose of lobeglitazone (0.5 mg) for 8 days (days 5–12). In the other period (treatment C), a single oral dose of warfarin (25 mg) was administered. Subjects received one of two dosing schedules: AB, followed by C, or C, followed by AB with a ≥10-day washout interval. The doses for all treatment periods were administered with 240 ml of water in the morning following an overnight fast. Blood samples were obtained for characterization of the PK and PD and were collected at the predose and selected time points. The study (Clinical trial registration number: NCT02002611) was conducted according to the ethical principles of the Declaration of Helsinki. The study protocol and any amendments were reviewed by the Institutional Review Board of Samsung Medical Center, Seoul, Republic of Korea. Written informed consent was obtained from each subject before enrollment in the study.
PK assessment
Lobeglitazone concentration was analyzed using a validated liquid chromatography procedure (Shimadzu UFLC; Shimadzu, Kyoto, Japan) and detected by tandem mass spectroscopy (5500 Qtrap; AB Sciex, Framingham, MA, USA) in the positive ionization mode. Pioglitazone was used as the internal standard, and the lower limit of quantification for lobeglitazone was 0.05 μg L−1. The coefficients of variation (CVs) for between-run and within-run variability were ≤6.88% and ≤8.29%, respectively, with mean deviations from the nominal concentration of no more than ±4.93%.
R- and S-warfarin concentrations were analyzed using a validated liquid chromatography method (Shiseido Nanospace SI-2; Shiseido, Tokyo, Japan) and detected by tandem mass spectroscopy (API 4000; AB Sciex) in the negative ionization mode. The lower limit of quantification for R- and S-warfarin was 2.5 μg L−1. The CVs for between-run variability were ≤3.14% for S-warfarin and ≤3.95% for R-warfarin. The between-run accuracy, expressed as mean deviation from the nominal concentration, was no more than ±6.04% for S-warfarin and ±4.48% for R-warfarin.
A noncompartmental approach was used for PK analysis using Phoenix WinNonlin (Version 6.3; Pharsight, Mountain View, CA, USA). The PK parameters determined for lobeglitazone included area under the plasma concentration–time curve in one dosing interval at steady state (AUCτ,ss), maximum observed plasma concentration at steady state (Cmax,ss), time to reach maximum plasma concentration at steady state (Tmax,ss), and t1/2. The PK parameters determined for R- and S-warfarin included area under the curve from time zero to the time of the last quantifiable concentration (AUClast), area under the curve from time zero to infinity (AUCinf), maximum observed plasma concentration (Cmax), Tmax, and t1/2.
PD assessment
Warfarin produces an anticoagulant effect by inhibiting hepatic vitamin K epoxide reductase, which is important for the activation of various coagulation factors including II, VII, IX, and X. The INR is the most widely used measure to determine the clotting tendency of blood after warfarin administration. Hence, the PD of warfarin was assessed by measuring the INR values and factor VII activity.
The PD parameters for INR and factor VII activity determined included area under the effect–time curve from time 0 to 168 hours (AUEC0–168 h), baseline-corrected AUEC0–168 h, maximum effect (Emax) and time to reach maximum effect (TEmax).
Safety assessment
Safety was assessed by physical examinations, vital signs, clinical laboratory evaluation (hematology, coagulation, blood chemistry, and urinalysis), ECG, and by monitoring of adverse events (AEs). AEs were monitored throughout the study and were evaluated in terms of seriousness (serious, not serious), duration, intensity (mild, moderate, severe), outcome, and relationship with the study drug. All subjects who took at least one dose of the study drug were included in the safety analysis.
Statistical analysis
Statistical analyses were performed using SAS version 9.1.3 (SAS Institute, Cary, NC, USA). A mixed-effect model was applied to the log-transformed PK and PD parameters. Summary statistics and 90% confidence intervals (CIs) of the AUEC0–168 h and Emax for INR and factor VII geometric mean ratios (GMRs) (warfarin + lobeglitazone: warfarin alone) were provided for the evaluation of the PD interaction. If the 90% CIs of the Cmax and AUClast of the GMRs (warfarin + lobeglitazone vs warfarin or lobeglitazone alone) were within the range of 0.80–1.25, the absence of a PK interaction was concluded.
Results
Study population
Twenty-four subjects were randomized, and their mean (range) values for age and body mass index were 29.8 (range: 21–47) years and 22.5 (range: 19.1–26.6) kg m−2, respectively. Twenty-three subjects completed the study, and one subject withdrew for personal reasons during period 2.
PK assessment
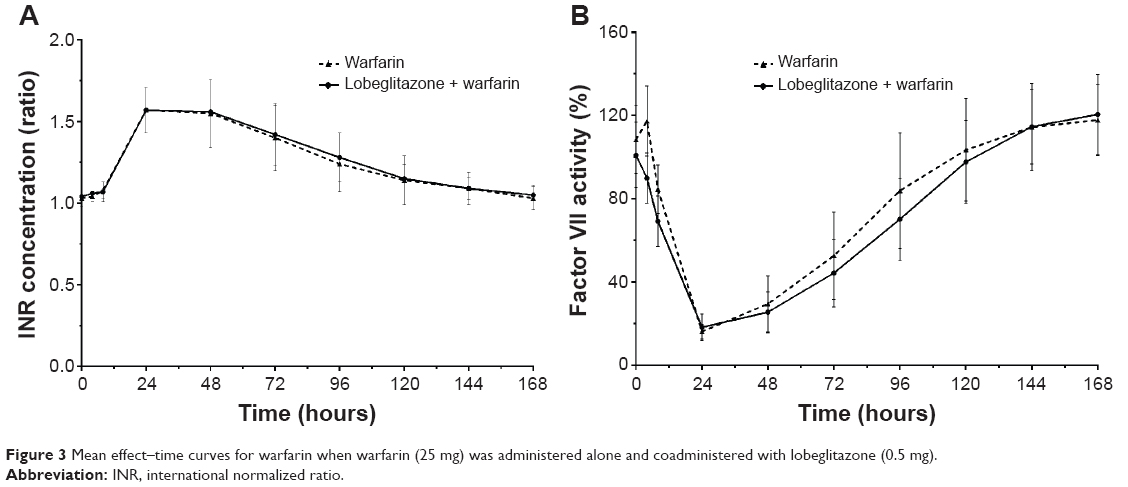
Mean plasma concentration–time curves for R- and S-warfarin following administration of warfarin alone and when combined with lobeglitazone are shown in Figure 1. Cmax, Tmax, and t1/2 for R- and S-warfarin did not differ significantly between the two treatments (Table 1). The 90% CIs for the ratios of AUClast and Cmax of R-warfarin and S-warfarin for the coadministration of warfarin with lobeglitazone vs warfarin alone were within the predetermined no-interaction range (0.80–1.25).
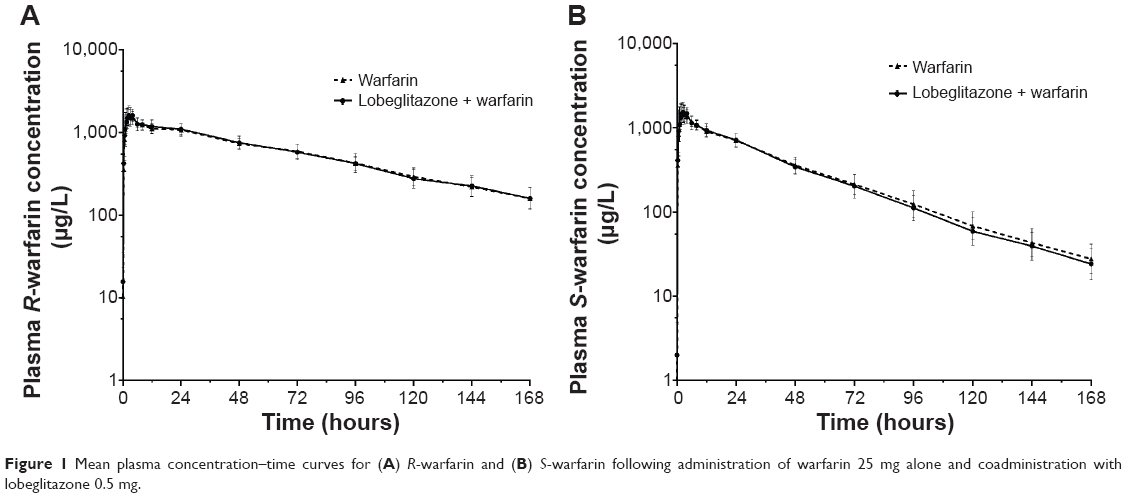 | Figure 1 Mean plasma concentration–time curves for (A) R-warfarin and (B) S-warfarin following administration of warfarin 25 mg alone and coadministration with lobeglitazone 0.5 mg. |
 | Table 1 Statistical comparison of plasma pharmacokinetics of R/S-warfarin and lobeglitazone following the administration of 0.5 mg lobeglitazone alone, 25 mg warfarin alone, and coadministration of each drug in healthy adult subjects |
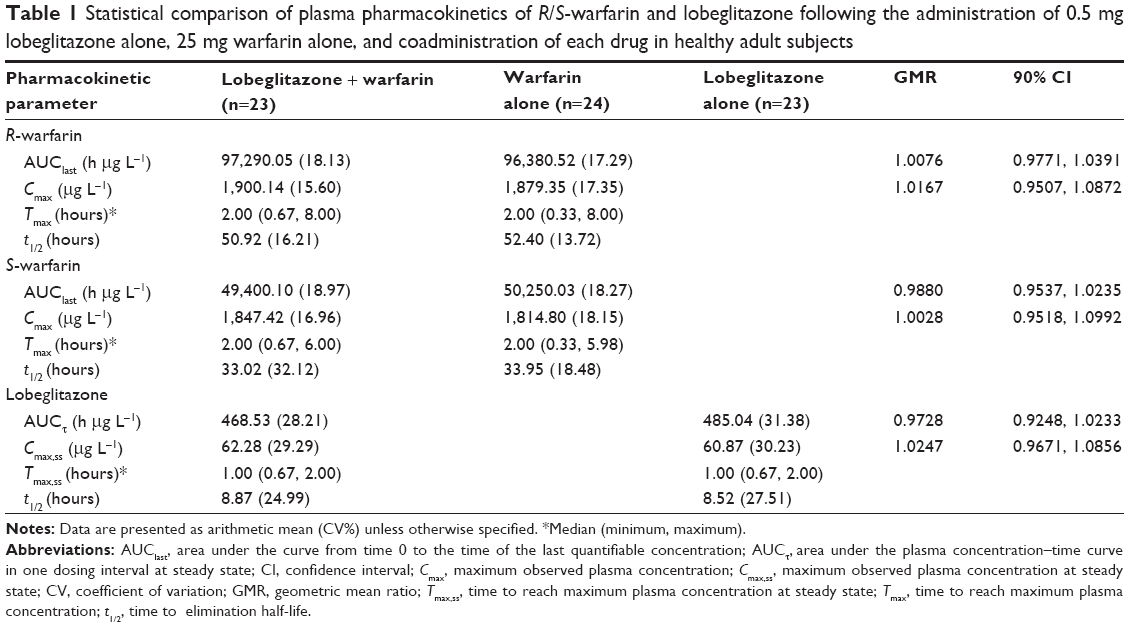
Steady-state plasma concentrations of lobeglitazone were achieved by day 4. None of the PK parameters for lobeglitazone were affected by the coadministration of lobeglitazone and warfarin (Figure 2). The GMRs and 90% CIs for the ratios of AUCτ,ss and Cmax,ss of lobeglitazone for coadministration of warfarin with lobeglitazone vs lobeglitazone alone were 0.9728 (90% CI: 0.9248, 1.0233) and 1.0247 (90% CI: 0.9671, 1.0856), respectively.
 | Figure 2 Mean plasma concentration–time curve for lobeglitazone following administration of lobeglitazone 0.5 mg alone and coadministration with warfarin 25 mg. |
PD assessment
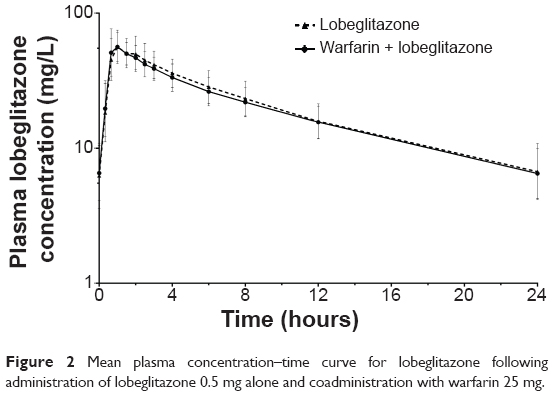
Baseline INR and factor VII levels were within ±5% of the normal range. Mean effect–time profiles over time when warfarin (25 mg) was administered alone and coadministered with lobeglitazone (0.5 mg) are shown in Figure 3. Summary statistics for the INR and factor VII activity following the administration of warfarin with and without lobeglitazone are shown in Table 2.
 | Figure 3 Mean effect–time curves for warfarin when warfarin (25 mg) was administered alone and coadministered with lobeglitazone (0.5 mg). |
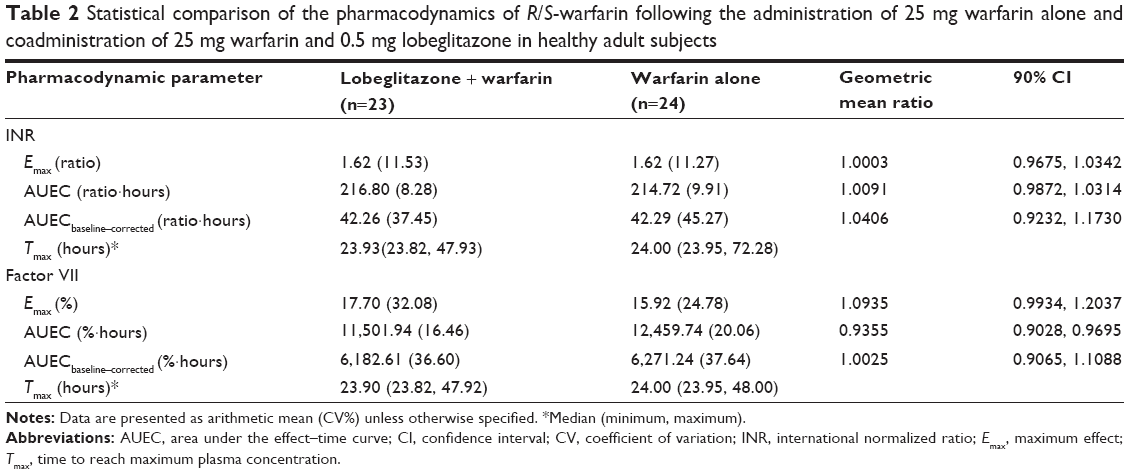 | Table 2 Statistical comparison of the pharmacodynamics of R/S-warfarin following the administration of 25 mg warfarin alone and coadministration of 25 mg warfarin and 0.5 mg lobeglitazone in healthy adult subjects |
Median INR levels increased to a maximum at 23.93 hours and 24.00 hours after administration of warfarin with and without lobeglitazone. About 168 hours after dosing, these values returned to the baseline under both treatments. Administration of warfarin with lobeglitazone did not affect the AUEC0–168 h or Emax of INR. The GMRs and 90% CIs for AUEC0–168 h and Emax for the INR were 1.0091 (90% CI: 0.9872, 1.0314) and 1.0003 (90% CI: 0.9675, 1.0342), respectively.
Mean (standard deviation [SD]) baseline factor VII activities were 100.91% (SD: 15.68) for warfarin + lobeglitazone and 108.33% (SD: 16.23) for warfarin alone (P=0.0198; Wilcoxon rank sum test). Factor VII activity decreased to 17.70% at 23.90 hours and to 15.92% at 24.00 hours following administration of warfarin with and without lobeglitazone. Thereafter, factor VII activity reached the baseline level by 144 hours after dosing under both treatments. The observed GMRs and 90% CIs of AUEC0–168 h and Emax for factor VII were 0.9355 (90% CI: 0.9028, 0.9695) and 1.0935 (90% CI: 0.9934, 1.2037), respectively. This indicates that lobeglitazone had no effect on the PD of warfarin.
Safety
Lobeglitazone was generally well tolerated when coadministered with warfarin in these healthy subjects. No serious AEs or AEs leading to discontinuation occurred in this study. Thirteen subjects (54%) reported a total of 28 treatment-emergent AEs, all of which were mild or moderate in severity. Among these AEs, three events reported by two subjects were treatment related: headache in the lobeglitazone-alone group, and epistaxis and nausea in the coadministration group. Epistaxis occurred 2 days after dosing in one subject whose INR value was <2.0 and who recovered without any medication. No clinically significant findings for vital signs or physical examination results were observed.
Discussion
The prevalence of diabetes is increasing, and aging of the population is the main driving factor for this increase in prevalence.13 Because older people with diabetes tend to have multiple comorbidities in addition to the traditional cardiovascular complications, it is likely that concomitant medications including warfarin may be used in these populations. Many studies have shown drug–drug interactions between warfarin and a wide variety of medications, including anticoagulants, antibiotics, and antidepressants, which are metabolized by hepatic microsomal enzymes. Salicylates potentiated the anticoagulant effect of warfarin, possibly because of their warfarin-like activity.14 Antibiotics such as trimethoprim and sulfamethoxazole potentiated the effect of warfarin by the inhibition of S-warfarin clearance.15 Selective serotonin reuptake inhibitor antidepressants, such as fluoxetine and fluvoxamine, impaired platelet aggregation by the inhibition of cytochrome P450 (CYP) 2C9-, CYP2C19-, and CYP1A2-mediated warfarin metabolism.16
Some TZDs also have shown a drug–drug interaction when used with warfarin. Troglitazone increased the INR in patients on concurrent warfarin therapy, which was theorized to be due to displacement of warfarin from plasma proteins or inhibition of the CYP system by troglitazone.12 Pioglitazone, a weak inducer of CYP3A4, significantly decreased patients’ INR.11 A case of INR increase was also reported on concurrent rosiglitazone therapy, which has no inhibitory effect on CYP2C9, 2C19, and 1A2 substrates.11 Due to the possibility of lobeglitazone being used concomitantly with warfarin in patients with type 2 diabetes mellitus, this open-label, crossover study to investigate potential clinical drug–drug interactions between lobeglitazone and warfarin was conducted. Lobeglitazone was administered at the approved daily dose of 0.5 mg for 4 consecutive days to reach steady state. Warfarin was administered during the steady state of lobeglitazone and, to maximize the interaction potential, the dosing of lobeglitazone continued until the effect of warfarin was maintained. In warfarin–drug interaction studies, warfarin is usually administered as a single large dose (eg, 25 mg) because the higher single dose of warfarin provides more opportunities to detect an interaction and reduces the exposure of healthy volunteers to a prolonged period of anticoagulation.17
In vitro assessment indicates that lobeglitazone is metabolized mainly by CYP3A4 and that its major metabolite, M7 (O-demethylation), is metabolized by CYP3A4, CYP2C19, and CYP2D6. Warfarin is eliminated almost entirely by metabolism; S-warfarin is metabolized to S-7-hydroxywarfarin mainly by CYP2C9, whereas R-warfarin is primarily metabolized by CYP1A2 and CYP3A4, yielding 6-, 8- and 10-hydroxywarfarin.18 S-warfarin is about twice as active as R-warfarin but is eliminated more rapidly.19
The exposure to lobeglitazone in this study is similar to that in a published study using the same dose.4 The observed PK profiles of R- and S-warfarin in the absence of lobeglitazone are also consistent with those reported in previous studies.20,21 In this study, the 90% CIs for the GMRs (warfarin + lobeglitazone vs warfarin) of Cmax and AUClast for R- and S-warfarin were within the bioequivalence guidelines-specified comparability bounds of 0.80–1.25. The 90% CIs were also entirely within the tightened interval of 90.00%–111.11% for narrow therapeutic index drugs.22,23 In line with the lack of an effect on warfarin PK, concomitant administration of lobeglitazone had no effect on the PD of single-dose warfarin, which was assessed through the measurement of INR and factor VII. The 90% CIs for the GMRs (warfarin + lobeglitazone vs warfarin) of INR and factor VII were within the range of 0.80–1.25. Because of the observed baseline differences in factor VII, baseline correction was also performed in the analysis. The 90% CIs for the GMRs of baseline-corrected AUEC0–168 h for factor VII were 0.9065–1.1088 (Table 2). As a result, coadministration of lobeglitazone is unlikely to be associated with an increase in warfarin-associated bleeding risk.
The results of this study imply that lobeglitazone does not inhibit CYP2C9 and CYP3A4, the main enzymes involved in the metabolism of R- and S-warfarin. These findings may be applicable to other drugs metabolized by these pathways, suggesting that the coadministration of lobeglitazone with other drugs that are CYP2C9 or CYP3A4 substrates is unlikely to cause a clinically significant PK drug interaction.
This study has a limitation. All participants were healthy young males, which is not typical of cardiovascular patients seen in the clinical setting. There was no sex difference for systemic lobeglitazone exposure at a 2 mg dose, which is four times the approved maximum dose of 0.5 mg.24 Because the anticoagulant response to warfarin is affected by several factors, the warfarin response must be monitored carefully even in the absence of drug interactions.
Conclusion
In summary, concomitant administration of lobeglitazone and warfarin was generally well tolerated in healthy subjects. There were no significant changes in the PK or PD of warfarin when a single dose of warfarin was coadministered with repeated once-daily doses of lobeglitazone. Therefore, dose adjustment of warfarin is not required when these two drugs are administered in clinics.
Acknowledgments
This study was supported by grants from Chong Kun Dang Pharmaceutical Corp, Seoul, Republic of Korea, and from the Korea Healthcare Technology R&D Project, Ministry of Health, Welfare and Family Affairs, Republic of Korea (A070001).
Disclosure
Chin Kim is an employee of Chong Kun Dang Pharmaceutical Corp, Seoul, Republic of Korea. The other authors report no conflicts of interest in this work.
References
Ferre P. The biology of peroxisome proliferator-activated receptors: relationship with lipid metabolism and insulin sensitivity. Diabetes. 2004;53(suppl 1):S43–S50. | ||
Lee HW, Kim BY, Ahn JB, et al. Molecular design, synthesis, and hypoglycemic and hypolipidemic activities of novel pyrimidine derivatives having thiazolidinedione. Eur J Med Chem. 2005;40(9):862–874. | ||
Kim BY, Ahn JB, Lee HW, et al. Synthesis and biological activity of novel substituted pyridines and purines containing 2,4-thiazolidinedione. Eur J Med Chem. 2004;39(5):433–447. | ||
Kim JW, Kim JR, Yi S, et al. Tolerability and pharmacokinetics of lobeglitazone (CKD-501), a peroxisome proliferator-activated receptor-gamma agonist: a single- and multiple-dose, double-blind, randomized control study in healthy male Korean subjects. Clin Ther. 2011;33(11):1819–1830. | ||
Kim SG, Kim DM, Woo JT, et al. Efficacy and safety of lobeglitazone monotherapy in patients with type 2 diabetes mellitus over 24-weeks: a multicenter, randomized, double-blind, parallel-group, placebo controlled trial. PloS One. 2014;9(4):e92843. | ||
Kakouros N, Rade JJ, Kourliouros A, Resar JR. Platelet function in patients with diabetes mellitus: from a theoretical to a practical perspective. Int J Endocrinol. 2011;2011:742719. | ||
Stroke Risk in Atrial Fibrillation Working Group. Independent predictors of stroke in patients with atrial fibrillation: a systematic review. Neurology. 2007;69(6):546–554. | ||
Singer DE, Albers GW, Dalen JE, et al; American College of Chest Physicians. Antithrombotic therapy in atrial fibrillation: American college of chest physicians evidence-based clinical practice guidelines. Chest. 2008;133(6 suppl):546S–592S. | ||
Nissen SE, Wolski K. Effect of rosiglitazone on the risk of myocardial infarction and death from cardiovascular causes. N Engl J Med. 2007;356(24):2457–2471. | ||
Zhu Z, Shen Z, Lu Y, Zhong S, Xu C. Increased risk of bladder cancer with pioglitazone therapy in patients with diabetes: a meta-analysis. Diabetes Res Clin Pract. 2012;98(1):159–163. | ||
Hoffmann TK, Parker DL, Buch HA, Balusu P. Suspected suppression of the INR by thiazolidinediones: interaction between warfarin and TZDs. Ann Pharmacother. 2006;40(5):994–996. | ||
Plowman BK, Morreale AP. Possible troglitazone-warfarin interaction. Am J Health Syst Pharm. 1998;55(10):1071. | ||
Abdelhafiz AH, Sinclair AJ. Management of type 2 diabetes in older people. Diabetes Ther. 2013;4(1):13–26. | ||
Bell WR. Acetaminophen and warfarin: undesirable synergy. JAMA. 1998;279(9):702–703. | ||
O’Reilly RA. Stereoselective interaction of trimethoprim-sulfamethoxazole with the separated enantiomorphs of racemic warfarin in man. N Engl J Med. 1980;302(1):33–35. | ||
Duncan D, Sayal K, McConnell H, Taylor D. Antidepressant interactions with warfarin. Int Clin Psychopharmacol. 1998;13(2):87–94. | ||
Malhotra B, Alvey C, Gong J, Li X, Duczynski G, Gandelman K. Effects of fesoterodine on the pharmacokinetics and pharmacodynamics of warfarin in healthy volunteers. Br J Clin Pharmacol. 2011;72(2):257–262. | ||
Holbrook AM, Pereira JA, Labiris R, et al. Systematic overview of warfarin and its drug and food interactions. Arch Intern Med. 2005;165(10):1095–1106. | ||
Maddison J, Somogyi AA, Jensen BP, James HM, Gentgall M, Rolan PE. The pharmacokinetics and pharmacodynamics of single dose (R)- and (S)-warfarin administered separately and together: relationship to VKORC1 genotype. Br J Clin Pharmacol. 2013;75(1):208–216. | ||
Zhou H, Patat A, Parks V, Buckwalter M, Metzger D, Korth-Bradley J. Absence of a pharmacokinetic interaction between etanercept and warfarin. J Clin Pharmacol. 2004;44(5):543–550. | ||
Yan JH, Meyers D, Lee Z, et al. Pharmacokinetic and pharmacodynamic drug–drug interaction assessment between pradigastat and digoxin or warfarin. J Clin Pharmacol. 2014;54(7):800–808. | ||
Davit B, Braddy AC, Conner DP, Yu LX. International guidelines for bioequivalence of systemically available orally administered generic drug products: a survey of similarities and differences. AAPS J. 2013;15(4):974–990. | ||
Verbeeck RK, Musuamba FT. The revised EMA guideline for the investigation of bioequivalence for immediate release oral formulations with systemic action. J Pharm Pharm Sci. 2012;15(3):376–388. | ||
Park MK, Kim TE, Kim J, et al. Tolerability and pharmacokinetics of lobeglitazone, a novel peroxisome proliferator-activated receptor-gamma agonist, after a single oral administration in healthy female subjects. Clin Drug Investig. 2014;34(7):467–474. |
 © 2015 The Author(s). This work is published and licensed by Dove Medical Press Limited. The full terms of this license are available at https://www.dovepress.com/terms.php and incorporate the Creative Commons Attribution - Non Commercial (unported, v3.0) License.
By accessing the work you hereby accept the Terms. Non-commercial uses of the work are permitted without any further permission from Dove Medical Press Limited, provided the work is properly attributed. For permission for commercial use of this work, please see paragraphs 4.2 and 5 of our Terms.
© 2015 The Author(s). This work is published and licensed by Dove Medical Press Limited. The full terms of this license are available at https://www.dovepress.com/terms.php and incorporate the Creative Commons Attribution - Non Commercial (unported, v3.0) License.
By accessing the work you hereby accept the Terms. Non-commercial uses of the work are permitted without any further permission from Dove Medical Press Limited, provided the work is properly attributed. For permission for commercial use of this work, please see paragraphs 4.2 and 5 of our Terms.