")
Back to Journals » International Journal of Nanomedicine » Volume 11
Labeling of mesenchymal stem cells for MRI with single-cell sensitivity
Authors Ariza de Schellenberger A, Kratz H , Farr T, Loewa N, Hauptmann R, Wagner S, Taupitz M, Schnorr J, Schellenberger E
Received 23 November 2015
Accepted for publication 29 January 2016
Published 12 April 2016 Volume 2016:11 Pages 1517—1535
DOI https://doi.org/10.2147/IJN.S101141
Checked for plagiarism Yes
Review by Single anonymous peer review
Peer reviewer comments 3
Editor who approved publication: Dr Thomas Webster
Angela Ariza de Schellenberger,1 Harald Kratz,1 Tracy D Farr,2,3 Norbert Löwa,4 Ralf Hauptmann,1 Susanne Wagner,1 Matthias Taupitz,1 Jörg Schnorr,1 Eyk A Schellenberger1
1Department of Radiology, 2Department of Experimental Neurology, Center for Stroke Research Berlin, Charité – Universitätsmedizin Berlin, Berlin, Germany; 3School of Life Sciences, University of Nottingham, Medical School, Nottingham, UK; 4Department of Biomagnetic Signals, Physikalisch-Technische Bundesanstalt Berlin, Berlin, Germany
Abstract: Sensitive cell detection by magnetic resonance imaging (MRI) is an important tool for the development of cell therapies. However, clinically approved contrast agents that allow single-cell detection are currently not available. Therefore, we compared very small iron oxide nanoparticles (VSOP) and new multicore carboxymethyl dextran-coated iron oxide nanoparticles (multicore particles, MCP) designed by our department for magnetic particle imaging (MPI) with discontinued Resovist® regarding their suitability for detection of single mesenchymal stem cells (MSC) by MRI. We achieved an average intracellular nanoparticle (NP) load of >10 pg Fe per cell without the use of transfection agents. NP loading did not lead to significantly different results in proliferation, colony formation, and multilineage in vitro differentiation assays in comparison to controls. MRI allowed single-cell detection using VSOP, MCP, and Resovist® in conjunction with high-resolution T2*-weighted imaging at 7 T with postprocessing of phase images in agarose cell phantoms and in vivo after delivery of 2,000 NP-labeled MSC into mouse brains via the left carotid artery. With optimized labeling conditions, a detection rate of ~45% was achieved; however, the experiments were limited by nonhomogeneous NP loading of the MSC population. Attempts should be made to achieve better cell separation for homogeneous NP loading and to thus improve NP-uptake-dependent biocompatibility studies and cell detection by MRI and future MPI. Additionally, using a 7 T MR imager equipped with a cryocoil resulted in approximately two times higher detection. In conclusion, we established labeling conditions for new high-relaxivity MCP, VSOP, and Resovist® for improved MRI of MSC with single-cell sensitivity.
Keywords: magnetic field microdistortions, single-cell imaging, mesenchymal stem cells, VSOP, MCP, Resovist®
Introduction
Many clinical studies (clinicaltrials.gov) exploit the immunomodulatory and regenerative capacities1–6 of multipotent mesenchymal stem cells (MSC).7,8 However, the role of MSC in regenerative medicine is not fully understood and their direct or paracrine effects remain to be clarified.9,10 In addition, parameters such as cell injection site and dose, cell survival, and cell engraftment require optimization in some disease models.11–15
For these reasons, monitoring of cell therapies is of high clinical relevance and, despite several challenges to overcome, magnetic resonance imaging (MRI) continues to be the method of choice, offering high tissue penetration depth and spatial resolution in comparison with alternative methods.16,17 Drawbacks of MRI such as low specificity due to unspecific signal from phagocytosed injected cells, dead cells, or local hemorrhage14,18,19 have been shown to limit the use of MRI for cell imaging in longitudinal studies, and considerable research efforts are devoted to finding alternative/complementary methods.19,20
With their strong negative contrast in T2- or T2*-weighted MR images, superparamagnetic iron oxide nanoparticles (NPs) are the most common contrast agents used to label cells for MRI cell tracking. The two most widely used NPs were initially developed and approved by the US Food and Drug Administration (FDA) for liver imaging.21 These are dextran-coated Endorem/Feridex® (AMAG Pharmaceuticals, Inc., Waltham, MA, USA), with hydrodynamic particle sizes ranging from 80 to 100 nm, and carboxymethyl dextran-coated ferucarbotran (Resovist®; Schering AG – now Bayer Pharma AG, Berlin, Germany) with a hydrodynamic particle size by a number of 24–44 nm.14,22,23 However, these products are no longer on the market.12,24 Alternatively, FDA-approved ferumoxytol/Feraheme (AMAG Pharmaceuticals Inc), developed to treat iron deficiency anemia,25 has been used for MRI,26 and cell labeling has been achieved after cell incubation with nanocomplexes of ferumoxytol-heparin-protamine. To the best of our knowledge, the most sensitive MRI detection has been accomplished for 1,000 ferumoxytol-labeled cells after intracerebral implantation when cells were labeled with 2.2 pg Fe per cell.27–30 However, no attempts have been made to visualize single cells with any of these approaches. Alternatively, Bulte31 proposed in vivo labeling of MSC obtained by bone marrow (BM) aspiration from rats after prior IV injection with ferumoxytol. The authors reported an average NP load of 4.3 pg Fe per cell, and MRI was achieved in vivo after implantation of 100,000 cells embedded in hydrogel scaffolds in rats with osteochondreal defects.31 Despite these results and the relevance of exploiting the potential of ferumoxytol to label MSC, the NP load per cell might not be sufficient for single-cell detection, as we discuss later. The limit of detection that can be achieved with ferumoxytol-labeled MSC remains to be determined.
Alternative contrast agents commercially available for research, such as Molday ION EverGreen (BioPAL Inc, Worcester, MA, USA; single core with a carboxydextran shell), FeraTrack (Miltenyi Biotec, Surrey, UK), and Dragon Green-encapsulated Magnetic Polymers (Bangs Beads; Stratech Scientific Ltd, Suffolk, UK; micrometer-sized polysterene matrix formed by several magnetic cores), are compared elsewhere for MSC labeling.32 Overall, these contrast agents are reported to achieve biocompatible intracellular MSC labeling, with an uptake of 5–9 pg [Fe] per cell.17 More recently, the cellular uptake of 69.1 pg Fe per hMSC (human MSC) has been reported for citrate-coated superparamagnetic iron oxide nanoparticles from MagneticFluids (Berlin, Germany).27
Although many studies have investigated MSC labeling for MRI, the results are difficult to compare due to the wide range of NPs and methodologies used to label cells.14,33–35 One of the most commonly used methods to enhance NP uptake by nonphagocytic cells is to use polycationic transfection agents (TAs) such as protamine sulfate (PS) (FDA approved) to form positively charged NP complexes, which penetrate cell membranes more easily.36,37 However, using TAs in human cell therapies will require additional FDA validation of the NP–TA, as previously suggested for the Feridex®–PS complex;38 moreover, simplified protocols would facilitate bench-to-bedside translation.
Electrostatically stabilized very small iron oxide particles (VSOP), with a hydrodynamic diameter of only 7 nm, combine high cellular uptake with low cytotoxicity due to their biocompatible citrate coating.39–44 Earlier produced as VSOP-C184 (Ferropharm, Teltow, Germany),45 these have been used for MSC labeling and found to have a detection limit of 40,000 cells in an 11.7 T MRI setting.46 These NPs are no longer available. In the past decade, VSOP have been further developed in our laboratory for magnetic resonance angiography and MRI of atherosclerotic plaques.47–51 They have been tested for MSC labeling and MRI detection with single-cell sensitivity.
Increased MRI sensitivity at the cellular level has been achieved using postprocessed phase images that visualize magnetic field microdistortions (MFMDs) caused by NP-labeled cells in the magnetic field of an MR scanner. The cells visualized as dipole figures in phase images acquired with T2*-weighted pulse sequences allow detection with improved sensitivity and selectivity of the cells. Moreover, this procedure can be used to predict the iron load of VSOP-labeled HeLa cells based on frequency maps52 and of monocytes/macrophages labeled with encapsulated Feridex or micrometer-sized iron oxide particles based on particle magnetic moments.53
The relevance of MRI in cell therapy monitoring is broadly recognized.54–58 We think that improved MRI-based cell detection with single-cell sensitivity will provide a useful tool for establishing cell injection doses and the best injection site and for monitoring biodistribution without the need for administration of large cell numbers in developing new cell therapies.
In this study, we investigate optimized intracellular labeling methods of MSC for MRI single-cell detection using multicore superparamagnetic carboxymethyl dextran-coated iron oxide nanoparticles (MCP) and citrate-coated VSOP, both developed in the Department of Radiology, Charité – Universitätsmedizin Berlin, and compare them with Resovist®.
Methods
Nanoparticle analysis
Relaxivities (T1 and T2) were measured with a Minispec MQ 40 time-domain nuclear magnetic resonance spectrometer at 40°C, 40 MHz, and 0.94 T (Bruker Corporation, Billerica, MA, USA). Relaxation coefficients R1 and R2 were obtained by linear fitting of T1 and T2 relaxation rates and normalized to iron concentrations.
Hydrodynamic diameters, polydispersity index, and zeta potentials were determined using a Zetasizer Nano ZS particle analyzer (Malvern Instruments, Malvern, UK) at 1 mmol Fe/L (NP concentration). Zeta potentials were measured for unformulated particles in 10 mM NaCl solution until constant values were reached.
Cell labeling
Primary MSC from murine (C57BL/6) BM (Thermo Fisher Scientific, Waltham, MA, USA) were maintained for up to ten passages with Dulbecco’s Modified Eagle’s Medium (DMEM) F-12 (Thermo Fisher Scientific) with 10% fetal bovine serum (FBS) as growth medium at 5,000 cells/cm2, avoiding confluence. Cells were passaged at standardized cell density (15,000 cells/cm2), followed by overnight recovery in growth medium. Cells were labeled with Resovist®, MCP, or VSOP (variant of VSOP doted with 0.66 mol% europium for laser ablation inductively coupled plasma mass spectrometry [LA-ICP-MS] detection in histology, Scharlach et al, accepted for publication in Journal of Biomedical Nanotechnology) using NP-labeling concentrations of 0.2 mM Fe with TA or 2 mM Fe without TA in growth medium without phenol red and with 1% FBS by incubation for 4 hours or 24 hours at 37°C.
The ratio of Resovist® or MCP to protamine sulfate (PS) as TA was optimized to increase NP uptake and to limit NP aggregation. The optimal NP:PS ratio was 0.2 mM Fe (denoted as 1×) to 12 μg/mL PS (denoted as 1× PS). VSOP were incubated without TA for both concentrations, 0.2 mM Fe (1×) and 2 mM (10×). NP incubation with cells was followed by three washing steps using phosphate-buffered saline (PBS), extracellular matrix (ECM) disruption by incubation with TrypLe (Thermo Fisher Scientific) for 5 minutes at 37°C and cell passage at 15,000 cells/cm2 either into new culture flasks or into chamber slides. Before further use, cells were left in complete growth medium for overnight recovery and NP internalization at 37°C.
Cell collection was followed by cell quantification, controlling viability and aggregation, on a CASY Model TT (Innovatis, Hoffman-La Roche Ltd., Basel, Switzerland).
Iron stain
Labeled cells incubated in adherent chamber slides (Thermo Fisher Scientific, Waltham, MA, USA) were washed 3× with PBS and fixed in zinc (BD Pharmingen, Franklin Lakes, NJ, USA) (1:1 dH2O) for 20 minutes at room temperature (RT). Zinc removal was followed by iron staining using the standard Prussian Blue protocol. In brief, cells were incubated with 1% potassium hexacyanoferrate (II) solution (Sigma-Aldrich Co, St Louis, MO, USA) (5 minutes at RT) and 1% potassium hexacyanoferrate with 1% HCl (20 minutes at RT), followed by 3× washing with dH2O and counterstained with nuclear red solution (Merck & Co, Inc, Whitehouse Station, NJ, USA) for 30 seconds. Slides were washed 3× and dehydrated by dipping into 70%, 80%, 96%, and 100% ethanol solutions for 30 seconds each, followed by 5 minutes’ treatment with xylol and 5 minutes’ drying, and then covered with Pertex (Medite, Burgdorf, Germany). Photomicrographs were obtained on an Axio Observer.Z1 Zeiss microscope equipped with Zen 2012 imaging software (Carl Zeiss microscopy GmbH, Oberkochen, Germany).
Iron quantification
Fractions of cells (50,000 cells) used for MRI phantoms were also used for iron quantification applying the colorimetric phenanthroline method.59,60 The method was adapted for cell pellets stored at −20°C. Cell pellets were disrupted by 1 hour ultrasound exposure, and the incorporated iron was dissolved in 5 μL concentrated HCl. Dissolved iron in HCl was diluted in water (1:50) and treated at the ratio of 2:7:1 with phenanthroline and hydroxylamine hydrochloride for 15 minutes at RT. Developed colorimetric reaction was measured photometrically at 510 nm to quantify iron.
Cell biocompatibility
NP-labeled and unlabeled MSC were compared using the following assays:
Population doubling time
Population doubling time (PDT) was assessed as described elsewhere.61 In brief, MSC labeled with NPs were plated into six-well plates at 2,000 cells per well with complete growth medium and medium was changed every 2 days. The living cell population was assessed by automatic cell counting with the CASY Model TT, every 2 days from Day 2 to Day 10. The following formula was used to calculate the PDT: PDT = T × ln2/ln(Nt/N0), where N0 = initial cell number, Nt = end point cell number, and T = time interval.
Fibroblast colony-forming unit assay
After completion of the NP-labeling protocol, MSC cultures with no more than 70%–80% confluence were harvested with TrypLe (Thermo Fisher Scientific) as described by Gibco® Mouse MSC Catalog number S1502-100. The fibroblast colony-forming unit (CFU-F) assay was performed as described elsewhere,62 with some modifications. In brief, MSC were plated in six-well plates with 16 cells per well (Falcon, Corning Science Tewksbury, MA, USA) in complete growth medium. The cells were cultured for 14 days at 37°C in a humidified incubator with 5% CO2, with medium exchange every 2 days. Colonies were washed with PBS and stained with 0.5% crystal violet (Sigma-Aldrich Co.) in methanol for 5 minutes. The wells were washed twice in distilled water, and the number of colonies was determined. Colonies <2 mm in diameter and faintly stained were ignored.
Differentiation assays
All differentiation assays were performed with MSC not older than passage 4 and after 48-hour incubation in MSC basal medium (Thermo Fisher Scientific; alpha-minimum essential media with GlutaMAX-I, 10% MSC-qualified FBS, and gentamicin). Differentiation protocols were performed as described by Gibco® Mouse MSC Catalog number S1502-100.
Adipogenesis assay
MSC were plated at 20,000 cells/cm2 in 12-well plates (Costar Corning Incorporated, Corning, NY, USA) for induction of adipogenic differentiation as described by provider (Thermo Fisher Scientific). In brief, after 48-hour incubation in MSC Basal Medium (Thermo Fisher Scientific), the medium was replaced by adipogenic differentiation medium (StemPro® Adipocyte Differentiation Basal Medium 1×, StemPro® Adipogenesis supplement 1×, and gentamicin (10 mg/mL). This medium was renewed twice a week over the incubation period of 11–14 days. Adipogenesis was studied by staining using the oil red standard stain procedure with some modifications to achieve costaining for iron. Twelve-well plates were washed 3× with PBS and cells were fixed for 15 minutes at RT with zinc (1:10) in dH2O,63 washed 2× with dH2O and processed for Oil Red O staining. For staining, wells were rinsed with 60% isopropanol and 0.5% (w/v) Oil Red O (Sigma-Aldrich Co) stock solution was prepared. Fat deposits were stained by incubation with Oil Red O for 15 minutes. Finally, the cells were rinsed with 60% isopropanol and stained for iron as described earlier.
Chondrogenesis
Labeled MSC in monolayer were trypsinized and transferred into 15 mL Falcon tubes at a concentration of 20,000 cells/2 mL to stimulate micromass formation by centrifugation for 4 minutes at 800× g. Micromasses were incubated at 37°C and 5% CO2 in MSC Basal Medium (Thermo Fisher Scientific), followed by detachment from the bottom by gentle flicking. Chondrogenic differentiation was then induced by incubation with Chondrogenic Differentiation Medium as described by supplier (StemPro® differentiation kits; Thermo Fisher Scientific) for 20 days with medium change twice a week. Condensates were collected, gently washed in PBS, and frozen in cryomolds with OCT Cryomedium (Tissue Tek Sakura Finetek Europe B.V, Alphen aan den Rijn, the Netherlands) and stored at −20°C. Cryosections of 5–10 μm thickness were used to stain glycosaminoglycans with a modified Alcian Blue protocol (www.ihcworld.com). Cryosections were dried at RT and fixed with 4% paraformaldehyde for 10 minutes, followed by several washes. Then, the sections were stained with Alcian Blue, pH 1.0 (1 N HCl) for 20 minutes and counterstained with filtered 1% Neutral Red (Applichem GmbH, Darmstadt Germany) in glacial acetic acid.
Osteogenesis
MSC were plated at 5,000 cells/cm2 in 12-well plates for osteogenic differentiation as described in the supplier’s protocol (StemPro® differentiation kits, Thermo Fisher Scientific). In brief, after 48 hours’ incubation at 37°C and 5% CO2 in MSC Basal Medium (Thermo Fisher Scientific), the medium was replaced with osteogenic differentiation medium (StemPro® differentiation kits; Thermo Fisher Scientific) for 11–14 days, with medium change twice a week. Osteogenesis was stained using the von Kossa protocol. Briefly, cells were fixed with 1% paraformaldehyde for 15 minutes, washed twice with dH2O, and dried at RT. This was followed by incubation with 1% silver nitrate under ultraviolet lamp exposure for 20 minutes, washed thrice with dH2O, then incubated for 5 minutes with 5% sodium thiosulfate, and lastly washed thrice with dH2O and counterstained for 5 minutes with Nuclear red (Merck).
Cell phantoms for MRI
Agarose cell phantoms were prepared as previously described by our group.52 Three nuclear magnetic resonance tubes were placed in a 15 mL Falcon tube filled with agarose (1w%, w/w). Nuclear magnetic resonance tubes were used to immobilize cells in 1 mL of 0.5% m/w degassed low-melting agarose. Each phantom consists of three tubes with 1,000 or 2,000 labeled cells per milliliter and one tube with 2,000 unlabeled cells.
Delivery of iron-labeled MSC to mouse brain
Male 6-week-old C57BL/6 mice were anesthetized with 3% isoflurane in a 70:30 nitrous oxide: oxygen mixture, maintaining a core body temperature of 37.2°C±0.8°C using an automated heat blanket.
Mice were placed in the supine position. The neck was shaved, cleaned, and a midline incision was made. The left sternomastoid muscle was retracted to expose the left carotid artery (CA). A silk suture was tied around the CA below the bifurcation into the internal and external carotid arteries (ICA and ECA, respectively). A loose suture was placed around the ECA and secured externally. Another loose suture was placed on the ICA and a microclip placed directly above it. A small incision was made in the CA and a plastic cannula (diameter 200 μm) connected to a syringe was inserted into the incision. The cannula was advanced to the ICA and secured with the loose ICA thread and the thread around the CA.
After MRI and infusion of cells, the cannulated CA was ligated around the incision site. All other threads were removed, muscles and glands guided back into place, and the incision sutured. Bupivacaine gel was applied to the sutured wound prior to recovery, and the animals were injected with 1.5 mL of sterile saline for rehydration. All animal experiments were approved by Das Landesamt für Gesundheit und Soziales (LaGeSo) animal license G0453/12.
Animals were sacrificed under anesthesia after MRI, and brains were extracted and fixed in zinc solution (1:10). Animal experiments were approved by the local authority (Landesamt für Gesundheit und Soziales, Berlin) and were performed according to institutional guidelines (BGBl. I S. 2178).
Magnetic resonance imaging
All in vitro phantoms and mouse brains were imaged on a 7 T Pharmascan MRI scanner (Bruker) with a 35 mm-diameter mouse volume resonator coil or 20 mm diameter mouse head coil. In vitro phantoms were imaged with a fast low-angle shot (FLASH) sequence (flip angle [FA]: 9°, echo time [TE]: 5.4 milliseconds, repetition time [TR]: 20 milliseconds) acquired with a 192×256 matrix, 82 μm in-plane resolution, and a slice thickness of 400 μm.
In vivo imaging was performed using FLASH 3D sequences with a 256×256 matrix, 82 μm in-plane resolution, FA of 30°, slice thickness of 350 μm, TE 5.4 milliseconds, and TR 400 milliseconds.
Image postprocessing was performed as previously published by our group.52
Additional in vitro phantoms were imaged with a 7 T BioSpec 70/20 MRI system (Bruker), equipped with a CryoProbe™ coil. Imaging was done with a susceptibility-weighted imaging-FLASH sequence acquired with a 256×256 matrix, 80 μm in-plane resolution, FA of 30°, TE of 18 milliseconds, TR of 800 milliseconds, and a slice thickness of 200 μm.
Total detected cell numbers were calculated based on the volume of at least 12 MR image slices per agarose phantom.
Ex vivo iron quantification by magnetic particle spectroscopy in mouse brains
Murine brains with Resovist®-, MCP-, or VSOP-labeled MSC were dissected, washed in cold PBS, and maintained in formalin at 4°C until further use. All preparations for magnetic particle spectroscopy (MPS) were carried out with a ceramic dissecting set to prevent false results through possible abrasion of magnetic material, as previously described by Scharlach et al.51 Mouse brains were longitudinally cut in two halves (right and left). Each half was fit into 0.1 mL polymerase chain reaction (PCR) tubes for MPS.
For MPS measurement, the sample was exposed to a strong sinusoidal oscillating magnetic field (Bexcite =25 mT) at a drive frequency, fexcite, of 25 kHz. The magnetization response was detected for 10 seconds by a pickup coil (sensitivity: 5×10¹² Am2) tightly enclosing the tip region of the PCR tube. Filtering and gradiometric assembly of the pickup coil ensured that the fundamental excitation frequency was heavily suppressed. Due to the nonlinear magnetization response of magnetic NPs, the spectral components of the Fourier-transformed response signal have distinct amplitudes at odd multiples of the drive frequency (fexcite) constituting the MPS spectrum. All MPS measurements were performed at 37°C.
For quantification of magnetic NP uptake, the moment of the third harmonic μ3 of the MPS spectra of each brain sample was normalized to the amplitude μ3 of a reference sample of known NP content (by iron concentration) measured under identical conditions.64
Results
Cell labeling and biocompatibility
As expected, our initial experiments showed that Resovist®, MCP, and VSOP uptake by MSC increased with incubation time (4 hours vs 24 hours, data not shown). We therefore continued with a 24-hour protocol, wherein NP uptake was up to three-fold higher in comparison to 4-hour protocols, in a particle-dependent manner. The results for 24-hour labeling are presented in Figure 1.
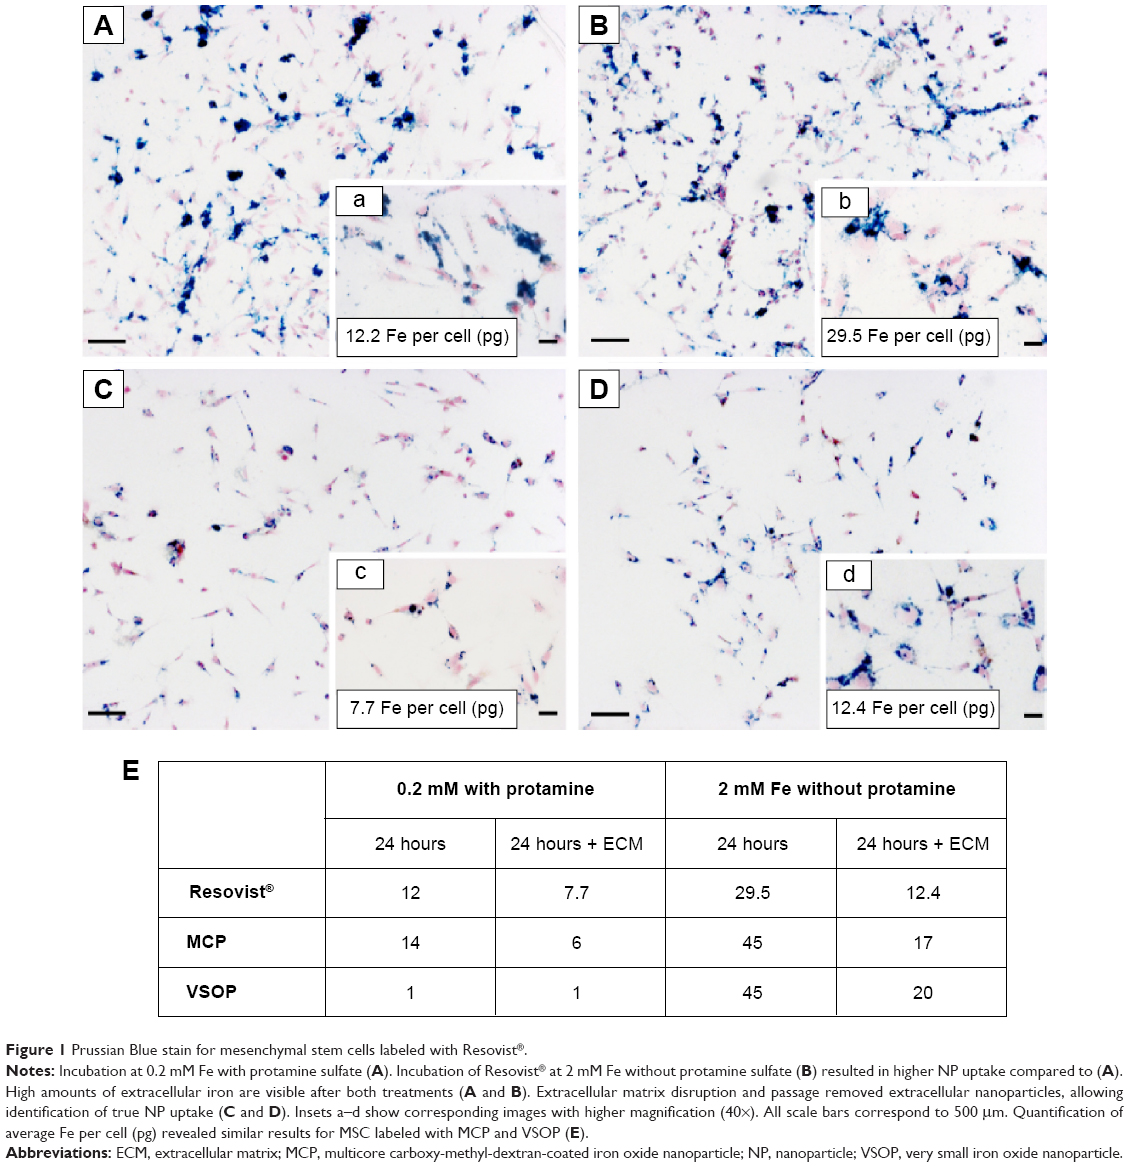 | Figure 1 Prussian Blue stain for mesenchymal stem cells labeled with Resovist®. |
Cells incubated with NP for 4 hours and 24 hours showed substantial extracellular iron clusters, mostly attached to the ECM. Clustering was observed irrespective of the particle type, the incubation concentration, or the use of PS as TA. Figure 1 shows representative micrographs of cells labeled with Resovist®. For meaningful quantification of NP uptake into cells, the extracellular NP clusters were significantly reduced by ECM disruption with trypsin and cell passage (Figure 1C and D). Following ECM disruption, the quantified averaged NP iron per cell was also reduced but now represented the real intracellular NP uptake (Figure 1E). Comparison of intracellular NP between cells incubated with 0.2 mM Resovist® or MCP, alone or with PS, showed that the conditions used with PS were ideal to increase intracellular uptake of MCP and Resovist® by a factor of ~2.5 and ~1.5, respectively (data not shown). However, increasing the NP loading concentration to 2 mM was sufficient to avoid the use of PS and resulted in significantly increased intracellular NP uptake for both MCP and Resovist® (three-fold and 1.5-fold, respectively) and even more significantly for smaller NPs such as VSOP, for which a ten-fold uptake was observed (Figure 2).
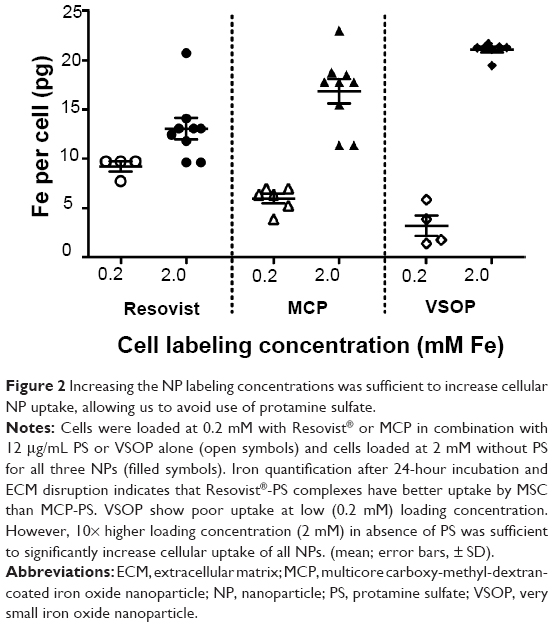 | Figure 2 Increasing the NP labeling concentrations was sufficient to increase cellular NP uptake, allowing us to avoid use of protamine sulfate. |
We chose to continue further experiments with highly labeled MSC without PS to test the biocompatibility of these labeling protocols in comparison with unlabeled cells. Assays for PDT, in vitro cell differentiation, CFU-F (Figure 3), and MSC marker expression (Figure S1) were performed. Overall, PDT assessed for 10 days after NP uptake was similar for labeled and unlabeled cells (Figure 3A). Labeled MSC showed a similar CFU capacity compared to unlabeled cells (Figure 3B). Furthermore, characteristic pluripotent features of MSC were not modified by VSOP or MCP labeling. Therefore, adipogenic, osteogenic, and chondrogenic differentiation could be similarly induced in labeled and unlabeled cells after in vitro stimulation (Figure 3C).
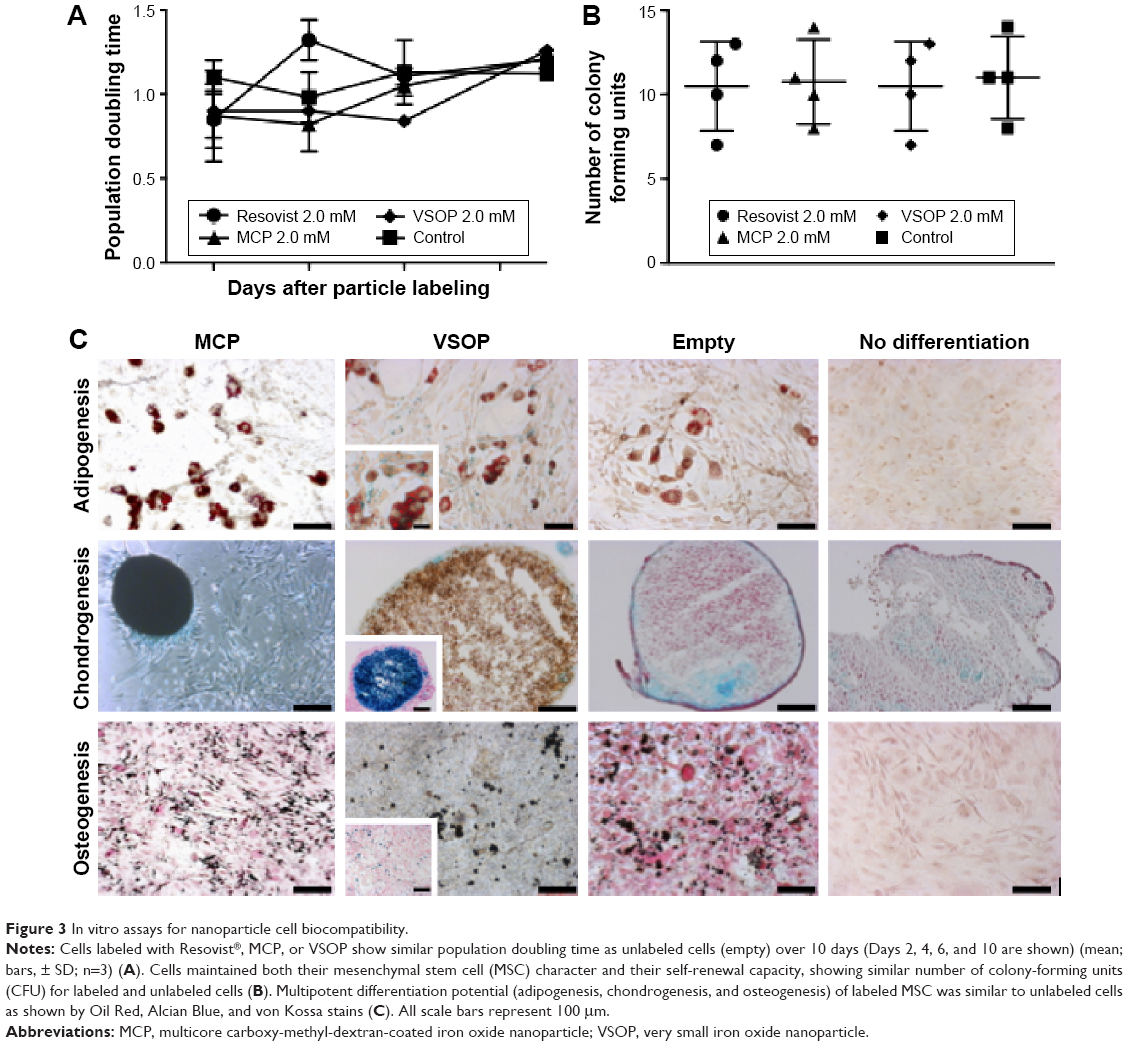 | Figure 3 In vitro assays for nanoparticle cell biocompatibility. |
We attempted to label MSC with ferumoxytol (Feraheme®) as described by Thu et al,65 but in our hands, no significant NP load per cell was achieved after MSC incubation with heparin-protamine-ferumoxytol complexes (4 hours + overnight [OV] culture) as described. Only an average NP load of 0.10 pg Fe per cell vs 0.07 pg Fe per cell for unlabeled cells was achieved. In addition, MSC labeled with the heparin-protamine-ferumoxytol complexes with longer incubation time (24 hours) showed an average NP uptake of 0.24 pg Fe per cell, and iron detection by Prussian Blue stain was below its detection sensitivity (data not shown). We only achieved a two-fold increase in Ferumoxytol® uptake per cell (0.54 pg Fe per cell to 0.73 pg Fe per cell) after MSC were incubated for 24 hours in DMEM plus 1% FBS with Ferumoxytol® at 4.5 mM Fe and 8.9 mM Fe correspondingly. However, after performing ECM disruption and overnight culture, as done for MSC in our experiments, to remove unbound NPs, the NP load decreased to ~0.22 pg Fe per cell. Taken together, these observations suggest that, in the case of ferumoxytol also, some of the iron measured after 24-hour incubation under in vitro adherent cell conditions and quantified as NP load per cell was not intracellular (data not shown).
Single-cell MRI in vitro
To assess the contrast effect of cells magnetically labeled with Resovist®, MCP, and VSOP, cells were quantified in vitro using postprocessed high-resolution phase images, which visualize MFMDs caused by the magnetically labeled cells when introduced into the magnetic field of the MR scanner. T2*-weighted FLASH sequences acquired on a 7 T Bruker Pharmascan animal scanner, as described in the “Methods” section, were used to image several cell phantoms from different experiments to establish a suitable cell dilution that allows single-cell identification. Herein, we show results of representative experiments with 2,000 cells and 1,000 cells per tube. In addition to labeled cells, controls containing unlabeled cells were imaged to ascertain the proportion of false-positives primarily caused by air bubbles, which exhibit similar dipole figures (Figure 4).
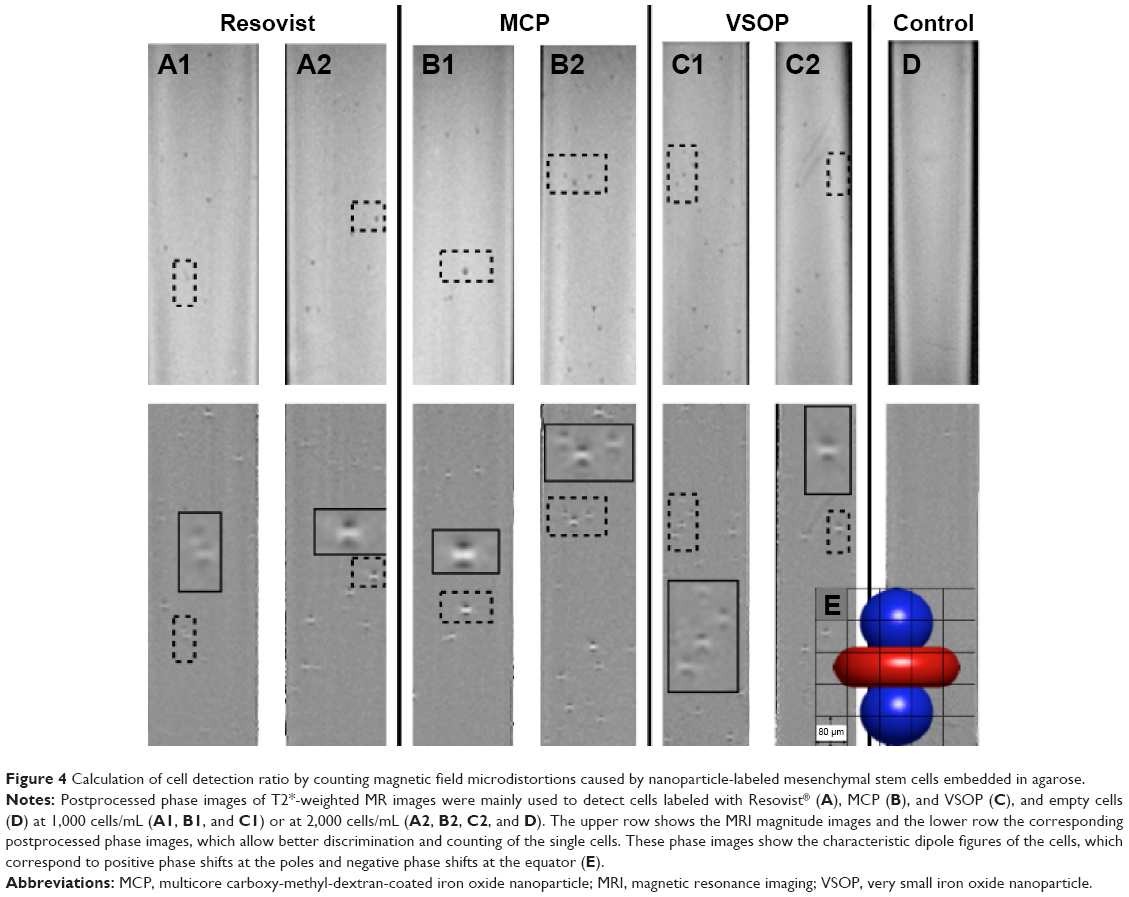 | Figure 4 Calculation of cell detection ratio by counting magnetic field microdistortions caused by nanoparticle-labeled mesenchymal stem cells embedded in agarose. |
A correlation between the average NP uptake per cell and the number of detected cells by MRI was used to determine the sensitivity of the 7 T Pharmascan setting used in our experiments (Figure 5).
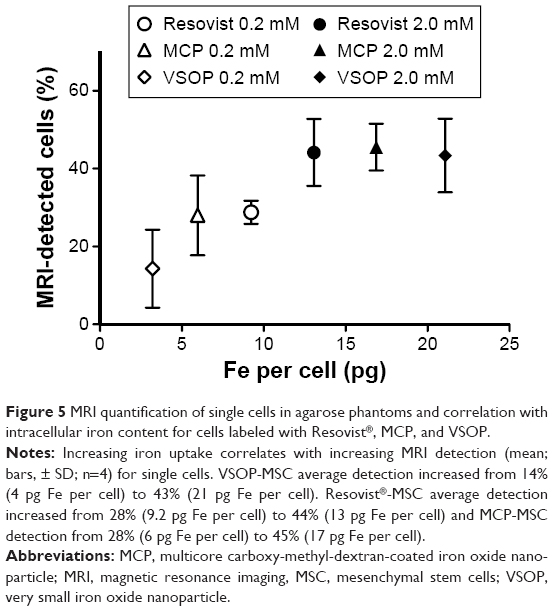 | Figure 5 MRI quantification of single cells in agarose phantoms and correlation with intracellular iron content for cells labeled with Resovist®, MCP, and VSOP. |
NP uptake per cell correlated with the percentage of single cells detected with the 7 T Pharmascan MRI setting as used here. Fourteen percent of VSOP-MSC were detected in a selected volume of interest when cells were loaded with an average of 4 pg Fe per cell. Approximately 28% of cells labeled with MCP or Resovist®-MSC were detected when average iron uptake reached 6 pg Fe per cell and 9 pg Fe per cell, respectively (Figure 5). Furthermore, 43%–45% of cells were detected when higher intracellular NP uptake was accomplished (VSOP-MSC 21 pg Fe per cell, Resovist®-MSC 13 pg Fe per cell, and MCP-MSC 17 pg Fe per cell) by incubation with 2 mM Fe NP without TA (Figure 5).
Some agarose phantoms imaged on the 7 T Pharmascan system were additionally measured on a 7 T BioSpec (imaging protocol as described in the “Methods” section). The higher resolution and the resulting improved signal-to noise-ratio (SNR = mean signal/standard deviation of background), eg, from 60 with 7 T Pharmascan to 86 with 7 T BioSpec, resulted in a more than two-fold increase in the percentage of cell detection, for Resovist®, MCP, and VSOP-MSC (Figure S2).
In vivo MRI of NP-labeled MSC in mouse brains
MRI single-cell detection of MSC labeled with Resovist®, MCP, and VSOP was performed on murine brains after delivery of only 2,000 cells into the CA (Figure 6) and 1,000 cells for MCP-labeled MSC (Figure S3). The high-resolution T2*-weighted FLASH sequences, as described in the “Methods” section, allowed detection of MFMDs caused by labeled MSC immediately after cell injection for all tested NPs, as shown in Figure 6 (total scanning time: 20 minutes).
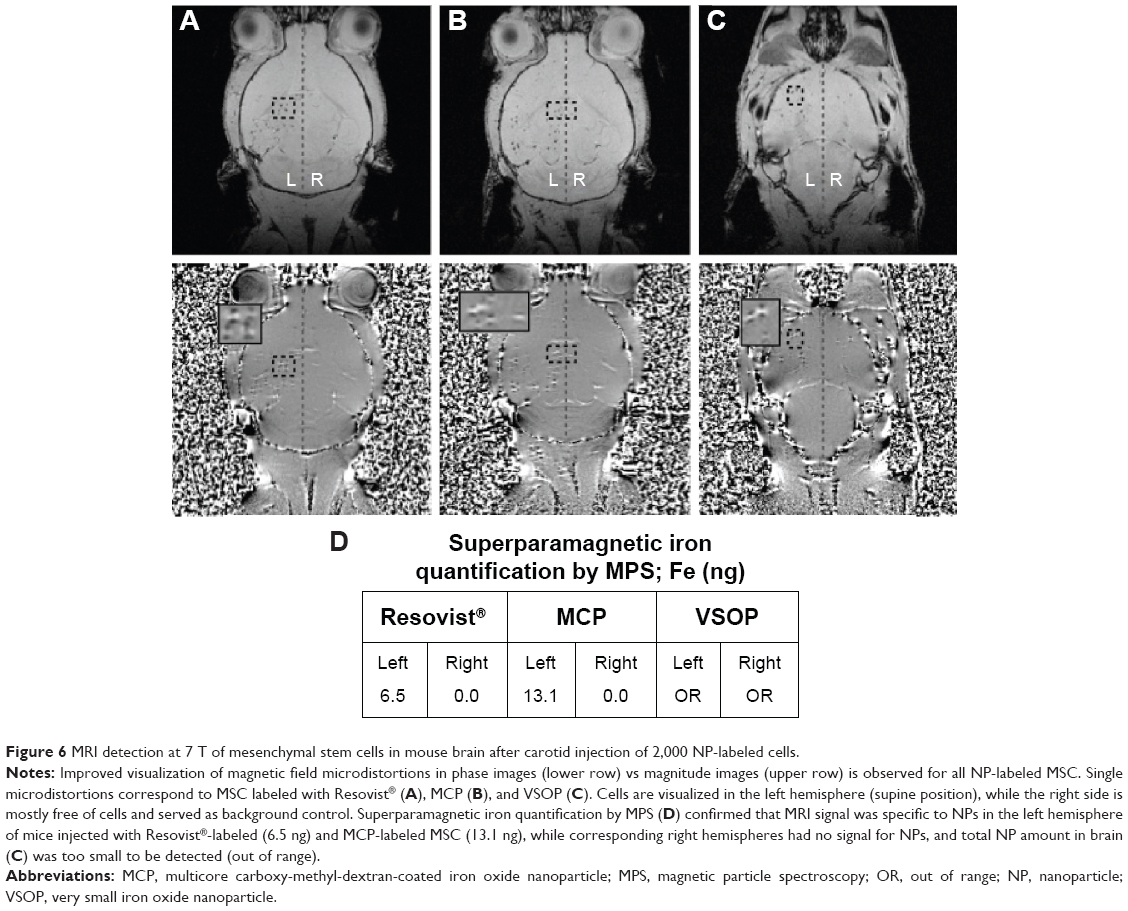 | Figure 6 MRI detection at 7 T of mesenchymal stem cells in mouse brain after carotid injection of 2,000 NP-labeled cells. |
Resovist® and MCP-labeled MSC accumulated in the left side of the brain (injection side), while the right side was free of MFMDs. In comparison, mice injected with VSOP-MSC showed MFMDs in both hemispheres. This might be due to differences in circulation of labeled cells depending on the NP used.
To confirm that the detected MFMDs correspond to trapped NP-labeled MSC, ex vivo NP quantification on imaged mouse brains was conducted by MPS. MPS specifically detects superparamagnetic iron oxide cores of the NP, and hence, neither paramagnetic endogenous iron nor diamagnetic tissue contributes to the MPS signal. Background-free detection enables highly sensitive NP quantification in tissues or organs down to the nanogram range (Figure 6D). MPS particle quantification showed that superparamagnetic NPs were only detectable on the left side (injection side), while on the right side, signals were below the detection limit of 1.1 ng and 1.3 ng for MCP-labeled and Resovist®-labeled MSC, respectively. In addition, a higher amount of NP iron (13.1 ng) was detected in mouse brain injected with MCP-MSC than with Resovist®-MSC (6.5 ng), while quantification of VSOP in the brain injected with VSOP-MSC failed due to the lower sensitivity of MPS for VSOP. Thus, the measurements were below a secure detection limit of 5.3 ng.
Discussion
Increasing the sensitivity of MRI can contribute to the monitoring and development of cell therapies. In this study, we present new MCP and compare them with VSOP and Resovist® for MSC labeling and MRI with single-cell sensitivity.
Labeling MSC with ferumoxytol (Feraheme®), as described by Thu et al65 (average NP load with ≥2.2 pg Fe per cell),65 was not successful in our hands and did not result in a significant NP load per cell. This poor uptake of ferumoxytol, as also the uptake reported by other authors,28–30 might not be sufficient to achieve single-cell detection by MRI as discussed in this report. Therefore, we chose MCP, VSOP, and Resovist® to accomplish single-cell detection by MRI.
Optimized cell culture conditions and NP-labeling protocols with reliable characterization are required to help advance cell MRI. The protocol presented here is the result of careful standardization with BM MSC (Thermo Fisher Scientific). Factors such as cell synchronization and cell density significantly affect NP uptake (as illustrated in Figure S4), which emphasizes the relevance of standardization when using different cell types.
In addition, strong NP adherence to surface-activated polystyrene cell culture material was observed after 24-hour incubation of NPs without cells (retention of ~75% [Fe] for VSOP and ~25% [Fe] for MCP or Resovist® by the plastic flasks). This NP adherence was also observed in presence of MSC, which produced large amounts of ECM. Therefore, special care is required in performing downstream iron staining and NP uptake quantification, and the results must be interpreted with caution. For instance, unbound and ECM-bound NPs are not completely removed by PBS washes (3×) and centrifugation, as carried out for standard cell collection, and might result in erroneous determination of NP Fe per cell.
Reduction of extracellular NPs is essential for the correct interpretation of downstream cell toxicity assays66,67 and for improving MRI single-cell detection, because extracellular NPs will be most probably lost during cell migration.
After ECM disruption and overnight cell recovery in new adherent culture plates, we observed a significant reduction of NPs adhering to plastic flasks and extracellular iron for all NPs investigated here. Intracellular NPs are shown as perinuclear iron by Prussian Blue stain (Figure 1). We also confirmed the intracellular localization of VSOP and MCP by transmission electron microscopy (TEM) (Figure S5). Overall, we could standardize a protocol for intracellular labeling of MSC using our MCP and VSOP with and without TA, thereby removing extracellular NP.
Although the cellular routes of MCP and VSOP internalization are beyond the scope of this report, differences in the characteristics of the NPs used here (Table 1 and Figure S6) need to be discussed. NP coating and surface charge (zeta potential) influence not only NP stabilization but also their interaction with cell membrane components and proteins such as FBS, a component of incubation media. Additionally, interactions between NP coatings and extracellular proteins such as FBS might result in NP protein coronas that modify their hydrodynamic size and surface properties and therefore influence their cellular uptake.12,68
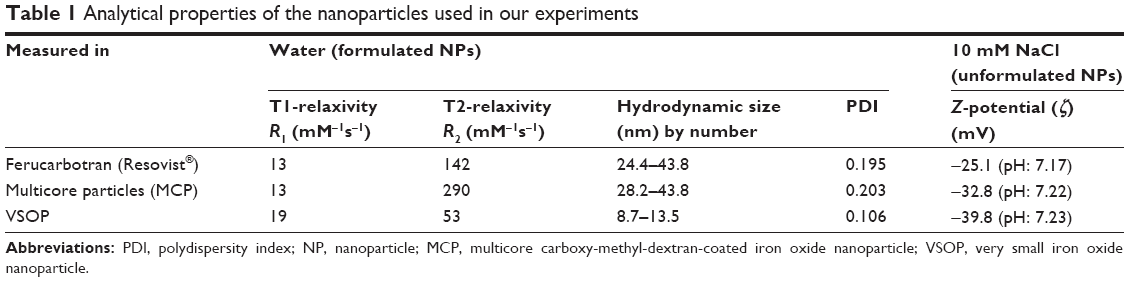 | Table 1 Analytical properties of the nanoparticles used in our experiments |
Resovist® and MCP are sterically stabilized with the sugar polymers carboxydextran and carboxymethyldextran, respectively, and thus are very similar to each other. The additional carboxymethyl groups in carboxymethyldextran account for the difference in surface charge (zeta potential) of MCP (−38.8 mV) and Resovist® (−25.1 mV). In contrast, VSOP are electrostatically stabilized with citrate molecules and have a zeta potential value of −39.8 mV. The negative surface charge of VSOP and their small particle diameter result in a higher surface energy, which explains the observed stronger affinity of VSOP to cell culture dish surfaces pretreated to improve cell adhesion (chemically modified and positively charged polystyrene or poly-D-lysine-coated surfaces). In the case of Resovist® and MCP, electrostatic attraction to positively charged surfaces is reduced by steric repulsion of the polymer coating. This is in concordance with higher NP binding after 24 hours’ incubation (2 mM) for VSOP in comparison with Resovist® (Figure 1E).
Biocompatibility is an essential property of contrast agents developed for cell labeling. We are aware that even when most cells are labeled (>90%), NP uptake highly differs from cell to cell, as later discussed. Thus, downstream assays for testing NP biocompatibility are performed with nonhomogeneous cell populations and represent net effects. Downstream biocompatibility assays with cell populations showing narrow distribution of NP uptake are needed to address concerns about NP cell toxicity.
We performed assays similar to other investigators for comparison and therefore only report biocompatibility assays of cells with high averages of internalized NPs. Therefore, the effect of labeling with MCP (average NP uptake: 17 pg Fe per cell) and VSOP (average NP uptake: 21 pg Fe per cell) (Figure 2) was tested on MSC and compared with unlabeled (empty) cells. Biocompatibility of Resovist® has been shown before.69
In general, labeling with MCP and VSOP results in similar PDT compared with unlabeled cells over 10 days. However, because the NP load is diluted over time, this assay reflects a realistic NP effect on MSC proliferation until Day 6. Characteristically, cells labeled with Resovist® had a 1.8 times higher PDT than empty cells (Figure 3A). An effect of free iron released from lysosomal degradation on cell cycle progression has been suggested for human MSC after Resovist® exposure.70 The release of free iron over longer periods of time would need to be tested for MCP and VSOP under undiluted conditions. Nevertheless, MSC proliferation until Day 6 was not influenced by MCP or VSOP under the experimental conditions used here.
Further assays revealed no significant effect of MCP or VSOP on in vitro MSC self-renewal potential (Figure 3B) or multilineage differentiation (Figure 3C).
Despite the expected dilution of NPs over time,71 the applied differentiation protocols do not allow much cell division, and iron was still detectable after differentiation protocols were completed (2–3 weeks), as seen by double-positive stain for iron and adipogenesis- or chondrogenesis-induced cells (Figure 3C). This confirms active differentiation of cells loaded with NPs.
The effect of Resovist® on MSC osteogenic differentiation is controversial, and observations ranging from complete osteogenesis inhibition,72 to a dose- and MSC-origin-dependent effect,61 to no effect69 have been reported. However, direct comparison of these results is difficult because they are based on different amounts of intracellular NPs.
In our hands, VSOP- and MCP-labeled MSC remained adherent throughout the time required for osteogenesis and stained positive with von Kossa stain after induced osteogenesis differentiation. However, alizarin red stain and osteogenic gene expression should be analyzed before using VSOP-MSC or MCP-MSC in regenerative animal models, in which their osteogenic capacity is required.
Single-cell MRI in vitro
As shown for the NPs investigated here, the detection rate of single cells depends on NP T2 relaxivity (R2), the amount of internalized NPs per cell, the MRI protocol, and scanner specifications. Intracellular NPs are usually clustered in organelles (phagolysosomes), which can increase the MRI contrast effect in the presence of high NP accumulation.73 In our experiments, with sufficient cell dilution, single MSC labeled with VSOP, Resovist®, or MCP could be identified by their MFMDs with high-resolution MRI. These MFMDs, which locally alter the proton resonance frequencies,52 are visible as the signal decreases in MRI magnitude images but are especially conspicuous in postprocessed phase images, which reveal the positive and negative resonance frequency shifts (Figure 4).
Moreover, an increased average amount of intracellular NP increased the percentage of detected cells for all tested NPs. In addition, cells labeled with NPs with high R2 such as MCP or Resovist® required less iron uptake for similar MRI detection than cells labeled with VSOP, which have a smaller R2 (Table 1 and Figure 5). Nevertheless, higher uptake of VSOP compensated for the lower R2 and resulted in comparable sensitivity for single MSC (Figure 5). Thus, all three NPs investigated here seem suitable for sensitive MSC detection by MRI. Further applications and advantages of using MSC and other cells labeled with VSOP or MCP need to be explored. Results emerging from the ongoing development of magnetic particle imaging (MPI) suggest that particle aggregation as observed for Resovist® might be advantageous for optimal MPS/MPI signal.74 Consequently, multicore particles such as MCP have been developed for MPI and require further investigation of how the MPI signal is affected when MCP cluster in cells. Advantages of combining MRI anatomical information with MPI sensitivity and quantification have been outlined by Kratz et al.75 Therefore, cell labeling for single-cell detection by MRI, as carried out in this study, could make an important contribution to improve cell tracking when combined with MPI.
Micrograph quantification of iron-positive cells showed that 80%–90% had intracellular NPs. However, measurement of blue areas per cell was highly variable (data not shown), indicating high heterogeneity of NP load per cell, as is also apparent in Figure 1. This could explain why only 50% of the labeled cells contained enough NPs to be detected with the 7 T Pharmascan MRI setup.
Later, experiments with a recently available 7 T BioSpec scanner improved image quality and allowed the visualization of single cells with smaller MFMDs (lower NP load per cell) (Supplementary materials). Therefore, detection of cells with a given NP load can be increased using more advanced MRI equipment. Nevertheless, because intracellular NP uptake is dependent on the cell’s surface area,36,76 the high variability of NP load among cell populations remains a problem to be solved, eg, by using magnetic cell separation techniques.
Single-cell MRI in vivo
All three NPs investigated here allowed clear visualization of MFMDs of the labeled MSC in postprocessed phase images obtained by 7 T Pharmascan MRI (Figures 6 and S3). Cell transfer into the mouse brain via the CA required standardized injection volumes to acquire MRI scans with comparable numbers of entrapped cells before the cells were washed out by the blood stream. Although no other tissues in the brain have such a high magnetic susceptibility as NP-labeled cells, large blood vessels perpendicular to the imaging plane can cause magnetic distortions that appear similar to MFMDs in a single imaging slice; however, they are easily distinguishable from labeled cells by comparison with adjacent imaging slices. Furthermore, in the magnitude images, the signal loss of blood vessels is lower than that of the labeled cells (Figure S3).
Ex vivo quantification of magnetic iron by MPS and by comparison of the left and right brain hemispheres confirmed that the MRI signal was caused by labeled MSC. Using MPS, we estimated the amount of MSC entrapped in the brains to be ~700 MCP-labeled MSC (18 pg Fe per cell) and 500 Resovist®-labeled MSC (13 pg Fe per cell).
Overall, we believe that high-resolution MRI with single-cell sensitivity and MPS iron quantification are useful tools to optimize and standardize cell delivery parameters and overcome one of the key challenges of cell therapy.
We observed that Resovist®- and MCP-labeled MSC were in general more “sticky” in adherent cell culture conditions and were also better retained in brain capillaries than VSOP-MSC for the time required between injection and tissue collection (~1 hour). Therefore, we speculate that these observations might be attributable to the different effects of labeling with MCP or VSOP on cell adherence. Further experiments in different setups should be conducted to explore the effect of VSOP- vs MCP-labeled cells on cell migration or tissue engraftment.
Conclusion
In summary, we assessed the suitability of VSOP and new MCP for MRI of MSC with high sensitivity. For this purpose, we standardized an in vitro protocol for intracellular labeling of MSC with high NP load (iron average per cell >10 pg Fe per cell) without the use of TAs. This protocol allowed detection of MSC labeled with VSOP, MCP, and Resovist® with single-cell sensitivity by their MFMDs in agarose phantoms and in vivo in mouse brains using a 7 T animal scanner. Additionally, we point out that high amounts of NPs adhere to positively charged plastic surfaces, which are commonly used to culture adherent cells and which need to be removed for accurate quantification of internalized NPs.
Acknowledgments
This work was supported by the Clinical Research Unit (KFO 213, TA 166/3-1, TA 166/3-2, TA 166/7-2, and WA 3105/1-2). We thank Bettina Herwig for language editing; Susanne Mueller from the Center for Stroke Research, Charité, Berlin, for assistance with MRI; Petra Schrade from the Core Facility for Electron Microscopy, Charité, Berlin, for cell TEM imaging; Sören Selve from the ZELMI, Technische Universität Berlin, for nanoparticle TEM imaging; Monika Ebert from the Experimental Radiology Division, Charité, Berlin, for assistance with nanoparticle analysis; and Frank Wiekhorst, Physikalisch-Technische Bundesanstalt (PTB), Berlin, for collaboration with magnetic particle spectroscopy.
Disclosure
The authors report no conflicts of interest in this work.
References
Uccelli A, Moretta L, Pistoia V. Mesenchymal stem cells in health and disease. Nat Rev Immunol. 2008;8:726–736. | ||
Mias C, Lairez O, Trouche E, et al. Mesenchymal stem cells promote matrix metalloproteinase secretion by cardiac fibroblasts and reduce cardiac ventricular fibrosis after myocardial infarction. Stem Cells. 2009;27:2734–2743. | ||
Forostyak S, Jendelova P, Sykova E. The role of mesenchymal stromal cells in spinal cord injury, regenerative medicine and possible clinical applications. Biochimie. 2013;95(12):2257–2270. | ||
Lee W-Y, Wei H-J, Wang J-J, et al. Vascularization and restoration of heart function in rat myocardial infarction using transplantation of human cbMSC/HUVEC core-shell bodies. Biomaterials. 2012;33:2127–2136. | ||
Mathiasen AB, Hansen L, Friis T, Thomsen C, Bhakoo K, Kastrup J. Optimal labeling dose, labeling time, and magnetic resonance imaging detection limits of ultrasmall superparamagnetic iron-oxide nanoparticle labeled mesenchymal stromal cells. Stem Cells Int. 2013;2013:353105. | ||
Edmundson M, Thanh NT, Song B. Nanoparticles based stem cell tracking in regenerative medicine. Theranostics. 2013;3:573–582. | ||
Horwitz EM, Le Blanc K, Dominici M, et al. Clarification of the nomenclature for MSC: The International Society for Cellular Therapy position statement. Cytotherapy. 2005;7:393–395. | ||
Dominici M, Le Blanc K, Mueller I, et al. Minimal criteria for defining multipotent mesenchymal stromal cells. The International Society for Cellular Therapy position statement. Cytotherapy. 2006;8:315–317. | ||
Parekkadan B, Milwid JM. Mesenchymal stem cells as therapeutics. Annu Rev Biomed Eng. 2010;12:87–117. | ||
Bianco P, Cao X, Frenette PS, et al. The meaning, the sense and the significance: translating the science of mesenchymal stem cells into medicine. Nat Med. 2013;19:35–42. | ||
Arbab AS, Frank JA. Cellular MRI and its role in stem cell therapy. Regen Med. 2008;3:199–215. | ||
Barrow M, Taylor A, Murray P, Rosseinsky MJ, Adams DJ. Design considerations for the synthesis of polymer coated iron oxide nanoparticles for stem cell labelling and tracking using MRI. Chem Soc Rev. 2015;44(19):6733–6748. | ||
Cromer Berman SM, Walczak P, Bulte JW. Tracking stem cells using magnetic nanoparticles. Wiley Interdiscip Rev Nanomed Nanobiotechnol. 2011;3:343–355. | ||
Srivastava AK, Bulte JW. Seeing stem cells at work in vivo. Stem Cell Rev. 2014;10:127–144. | ||
Bernardo ME, Fibbe WE. Mesenchymal stromal cells and hematopoietic stem cell transplantation. Immunol Lett. 2015;168(2):215–221. | ||
Rogers WJ, Meyer CH, Kramer CM. Technology insight: in vivo cell tracking by use of MRI. Nat Clin Pract Cardiovasc Med. 2006;3:554–562. | ||
Taylor A, Herrmann A, Moss D, et al. Assessing the efficacy of nano- and micro-sized magnetic particles as contrast agents for MRI cell tracking. PLoS One. 2014;9:e100259. | ||
Hachani R, Lowdell M, Birchall M, Thanh NT. Tracking stem cells in tissue-engineered organs using magnetic nanoparticles. Nanoscale. 2013;5:11362–11373. | ||
Ma N, Cheng H, Lu M, et al. Magnetic resonance imaging with superparamagnetic iron oxide fails to track the long-term fate of mesenchymal stem cells transplanted into heart. Sci Rep. 2015;5:9058. | ||
Andrzejewska A, Nowakowski A, Janowski M, et al. Pre- and postmortem imaging of transplanted cells. Int J Nanomedicine. 2015;10:5543–5559. | ||
Wahajuddin, Arora S. Superparamagnetic iron oxide nanoparticles: magnetic nanoplatforms as drug carriers. Int J Nanomedicine. 2012;7:3445–3471. | ||
Reimer P, Tombach B, Daldrup H, et al. Neue MR-Kontrastmittel in der Leberdiagnostik. [New MR contrast media in liver diagnosis. Initial clinical results with hepatobiliary Eovist (gadolinium-EOB-DTPA) and RES-specific Resovist (SH U 555 A)]. Radiologe. 1996;36:124–133. German. | ||
Lawaczeck R, Bauer H, Frenzel T, et al. Magnetic iron oxide particles coated with carboxydextran for parenteral administration and liver contrasting. Pre-clinical profile of SH U555A. Acta Radiol. 1997;38:584–597. | ||
Weissleder R, Nahrendorf M, Pittet MJ. Imaging macrophages with nanoparticles. Nat Mater. 2014;13:125–138. | ||
Coyne DW. Ferumoxytol for treatment of iron deficiency anemia in patients with chronic kidney disease. Expert Opin Pharmacother. 2009;10:2563–2568. | ||
Simon GH, von Vopelius-Feldt J, Fu Y, et al. Ultrasmall supraparamagnetic iron oxide-enhanced magnetic resonance imaging of antigen-induced arthritis: a comparative study between SHU 555 C, ferumoxtran-10, and ferumoxytol. Invest Radiol. 2006;41:45–51. | ||
Andreas K, Georgieva R, Ladwig M, et al. Highly efficient magnetic stem cell labeling with citrate-coated superparamagnetic iron oxide nanoparticles for MRI tracking. Biomaterials. 2012;33:4515–4525. | ||
Khurana A, Nejadnik H, Chapelin F, et al. Ferumoxytol: a new, clinically applicable label for stem-cell tracking in arthritic joints with MRI. Nanomedicine (Lond). 2013;8:1969–1983. | ||
Vandergriff AC, Hensley TM, Henry ET, et al. Magnetic targeting of cardiosphere-derived stem cells with ferumoxytol nanoparticles for treating rats with myocardial infarction. Biomaterials. 2014;35:8528–8539. | ||
Yin Y, Zhou X, Guan X, Liu Y, Jiang CB, Liu J. In vivo tracking of human adipose-derived stem cells labeled with ferumoxytol in rats with middle cerebral artery occlusion by magnetic resonance imaging. Neural Regen Res. 2015;10:909–915. | ||
Bulte JW. Science to practice: can stem cells be labeled inside the body instead of outside? Radiology. 2013;269:1–3. | ||
Wang Y, Xu C, Ow H. Commercial nanoparticles for stem cell labeling and tracking. Theranostics. 2013;3:544–560. | ||
Walczak P, Kedziorek DA, Gilad AA, Lin S, Bulte JW. Instant MR labeling of stem cells using magnetoelectroporation. Magn Reson Med. 2005;54:769–774. | ||
Laurent S, Forge D, Port M, et al. Magnetic iron oxide nanoparticles: synthesis, stabilization, vectorization, physicochemical characterizations, and biological applications. Chem Rev. 2008;108:2064–2110. | ||
Pickard M, Chari D. Enhancement of magnetic nanoparticle-mediated gene transfer to astrocytes by ‘magnetofection’: effects of static and oscillating fields. Nanomedicine (Lond). 2010;5:217–232. | ||
Arbab AS, Yocum GT, Kalish H, et al. Efficient magnetic cell labeling with protamine sulfate complexed to ferumoxides for cellular MRI. Blood. 2004;104:1217–1223. | ||
Frank JA, Anderson SA, Kalsih H, et al. Methods for magnetically labeling stem and other cells for detection by in vivo magnetic resonance imaging. Cytotherapy. 2004;6:621–625. | ||
Arbab AS, Yocum GT, Wilson LB, et al. Comparison of transfection agents in forming complexes with ferumoxides, cell labeling efficiency, and cellular viability. Mol Imaging. 2004;3:24–32. | ||
Fleige G, Seeberger F, Laux D, et al. In vitro characterization of two different ultrasmall iron oxide particles for magnetic resonance cell tracking. Invest Radiol. 2002;37:482–488. | ||
Taupitz M, Schmitz S, Hamm B. Superparamagnetische Eisenoxidpartikel: Aktueller Stand und zukünftige Entwicklungen. [Superparamagnetic iron oxide particles: current state and future development]. Rofo. 2003;175:752–765. German. | ||
Stroh A, Zimmer C, Gutzeit C, et al. Iron oxide particles for molecular magnetic resonance imaging cause transient oxidative stress in rat macrophages. Free Radic Biol Med. 2004;36:976–984. | ||
Stroh A, Faber C, Neuberger T, et al. In vivo detection limits of magnetically labeled embryonic stem cells in the rat brain using high-field (17.6 T) magnetic resonance imaging. Neuroimage. 2005;24:635–645. | ||
Winkler T, von Roth P, Schuman MR, et al. In vivo visualization of locally transplanted mesenchymal stem cells in the severely injured muscle in rats. Tissue Eng Part A. 2008;14:1149–1160. | ||
Lobsien D, Dreyer AY, Stroh A, Boltze J, Hoffmann KT. Imaging of VSOP labeled stem cells in agarose phantoms with susceptibility weighted and T2* weighted MR Imaging at 3T: determination of the detection limit. PLoS One. 2013;8:e62644. | ||
Pilgrimm H. Super-paramagnetic particles with increased R1 relaxivity, process for producing said particles and use thereof. US Patent 6,638,494. 2003. | ||
Heymer A, Haddad D, Weber M, et al. Iron oxide labelling of human mesenchymal stem cells in collagen hydrogels for articular cartilage repair. Biomaterials. 2008;29:1473–1483. | ||
Warmuth C, Schnorr J, Kaufels N, et al. Whole-heart coronary magnetic resonance angiography: contrast-enhanced high-resolution, time-resolved 3D imaging. Invest Radiol. 2007;42:550–557. | ||
Wagner M, Wagner S, Schnorr J, et al. Coronary MR angiography using citrate-coated very small superparamagnetic iron oxide particles as blood-pool contrast agent: initial experience in humans. J Magn Reson Imaging. 2011;34:816–823. | ||
Schnorr J, Taupitz M, Schellenberger EA, et al. Cardiac magnetic resonance angiography using blood-pool contrast agents: comparison of citrate-coated very small superparamagnetic iron oxide particles with gadofosveset trisodium in pigs. Rofo. 2012;184:105–112. | ||
Wagner S, Schnorr J, Ludwig A, et al. Contrast-enhanced MR imaging of atherosclerosis using citrate-coated superparamagnetic iron oxide nanoparticles: calcifying microvesicles as imaging target for plaque characterization. Int J Nanomedicine. 2013;8:767–779. | ||
Scharlach C, Kratz H, Wiekhorst F, et al. Synthesis of acid-stabilized iron oxide nanoparticles and comparison for targeting atherosclerotic plaques: evaluation by MRI, quantitative MPS, and TEM alternative to ambiguous Prussian blue iron staining. Nanomedicine. 2015;11(5):1085–1095. | ||
Lindquist RL, Papazoglou S, Scharlach C, et al. Imaging of magnetic micro field distortions allows sensitive single cell detection. Mol Imaging. 2013;12(2):83–89. | ||
Mills PH, Hitchens TK, Foley LM, et al. Automated detection and characterization of SPIO-labeled cells and capsules using magnetic field perturbations. Magn Reson Med. 2012;67:278–289. | ||
Lederman RJ, Guttman MA, Peters DC, et al. Catheter-based endomyocardial injection with real-time magnetic resonance imaging. Circulation. 2002;105:1282–1284. | ||
Kraitchman DL, Heldman AW, Atalar E, et al. In vivo magnetic resonance imaging of mesenchymal stem cells in myocardial infarction. Circulation. 2003;107:2290–2293. | ||
Bulte JW. In vivo MRI cell tracking: clinical studies. AJR Am J Roentgenol. 2009;193:314–325. | ||
de Vries IJ, Lesterhuis WJ, Barentsz JO, et al. Magnetic resonance tracking of dendritic cells in melanoma patients for monitoring of cellular therapy. Nat Biotechnol. 2005;23:1407–1413. | ||
Kraitchman DL, Tatsumi M, Gilson WD, et al. Dynamic imaging of allogeneic mesenchymal stem cells trafficking to myocardial infarction. Circulation. 2005;112:1451. | ||
Fortune WB, Mellon MG. Determination of iron with O-phenanthroline: a spectrophotometric study. Ind Eng Chem Anal Ed. 1938;10:60–64. | ||
Braunschweig J, Bosch J, Heister K, Kuebeck C, Meckenstock RU. Reevaluation of colorimetric iron determination methods commonly used in geomicrobiology. J Microbiol Methods. 2012;89:41–48. | ||
Crabbe A, Vandeputte C, Dresselaers T, et al. Effects of MRI contrast agents on the stem cell phenotype. Cell Transplant. 2010;19:919–936. | ||
Castro-Malaspina H, Gay RE, Resnick G, et al. Characterization of human bone marrow fibroblast colony-forming cells (CFU-F) and their progeny. Blood. 1980;56:289–301. | ||
Haeckel A, Schoenzart L, Appler F, et al. Combined in situ zymography, immunofluorescence, and staining of iron oxide particles in paraffin-embedded, zinc-fixed tissue sections. Mol Imaging. 2012;11:383–388. | ||
Loewa N, Wiekhorst F, Gemeinhardt I, et al. Cellular uptake of magnetic nanoparticles quantified by magnetic particle spectroscopy. IEEE Trans Magn. 2013;49:275–278. | ||
Thu MS, Bryant LH, Coppola T, et al. Self-assembling nanocomplexes by combining ferumoxytol, heparin and protamine for cell tracking by magnetic resonance imaging. Nat Med. 2012;18:463–467. | ||
Naumova AV, Modo M, Moore A, Murry CE, Frank JA. Clinical imaging in regenerative medicine. Nat Biotechnol. 2014;32:804–818. | ||
Griffiths SM, Singh N, Jenkins GJ, et al. Dextran coated ultrafine superparamagnetic iron oxide nanoparticles: compatibility with common fluorometric and colorimetric dyes. Anal Chem. 2011;83:3778–3785. | ||
Eberbeck D, Kettering M, Bergemann C, Zirpel P, Hilger I, Trahms L. Quantification of the aggregation of magnetic nanoparticles with different polymeric coatings in cell culture medium. J Phys D Appl Phys. 2010;43:405002. | ||
Hsiao JK, Tai MF, Chu HH, et al. Magnetic nanoparticle labeling of mesenchymal stem cells without transfection agent: cellular behavior and capability of detection with clinical 1.5 T magnetic resonance at the single cell level. Magn Reson Med. 2007;58:717–724. | ||
Huang DM, Hsiao JK, Chen YC, et al. The promotion of human mesenchymal stem cell proliferation by superparamagnetic iron oxide nanoparticles. Biomaterials. 2009;30:3645–3651. | ||
Kim JA, Åberg C, Salvati A, Dawson KA. Role of cell cycle on the cellular uptake and dilution of nanoparticles in a cell population. Nat Nanotechnol. 2012;7:62–68. | ||
Chen YC, Hsiao JK, Liu HM, et al. The inhibitory effect of superparamagnetic iron oxide nanoparticle (Ferucarbotran) on osteogenic differentiation and its signaling mechanism in human mesenchymal stem cells. Toxicol Appl Pharmacol. 2010;245:272–279. | ||
Dodd SJ, Williams M, Suhan JP, Williams DS, Koretsky AP, Ho C. Detection of single mammalian cells by high-resolution magnetic resonance imaging. Biophys J. 1999;76:103–109. | ||
Eberbeck D, Wiekhorst F, Wagner S, Trahms L. How the size distribution of magnetic nanoparticles determines their magnetic particle imaging performance. Appl Phys Lett. 2011;98:182502. | ||
Kratz H, Eberbeck D, Wagner S, Taupitz M, Schnorr J. Synthetic routes to magnetic nanoparticles for MPI. Biomed Tech (Berl). 2013;58:509–515. | ||
Arbab AS, Janic B, Haller J, Pawelczyk E, Liu W, Frank JA. In vivo cellular imaging for translational medical research. Curr Med Imaging Rev. 2009;5:19–38. |
Supplementary materials
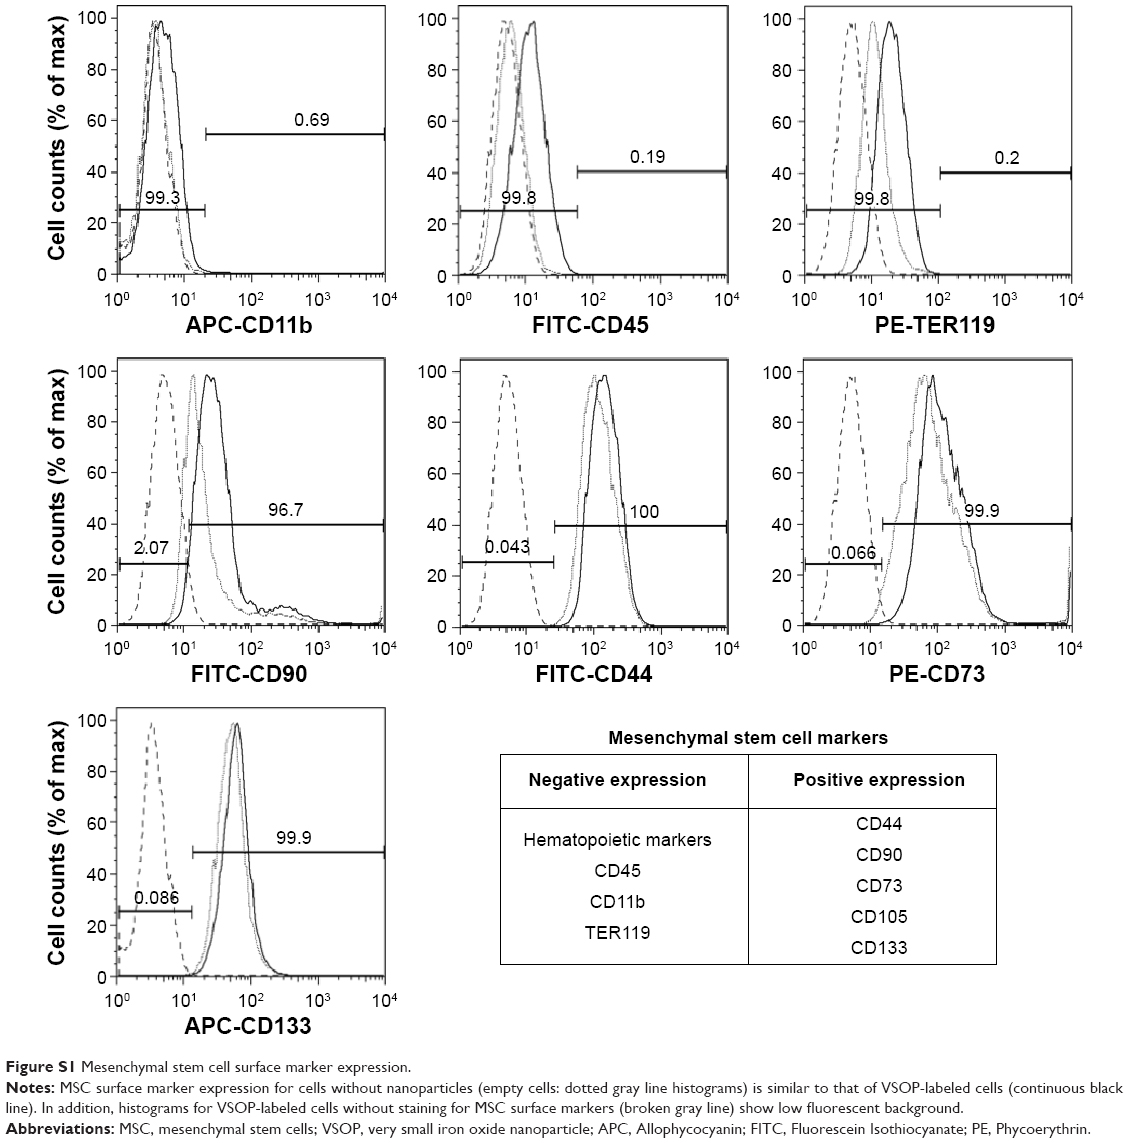 | Figure S1 Mesenchymal stem cell surface marker expression. |
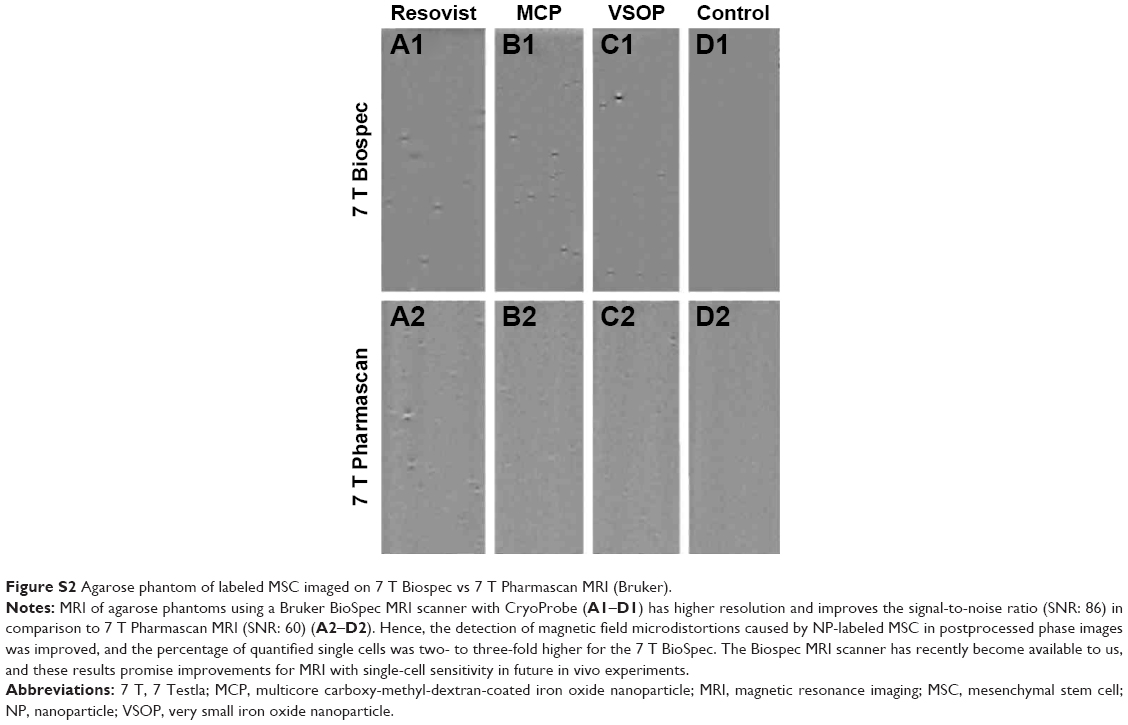 | Figure S2 Agarose phantom of labeled MSC imaged on 7 T Biospec vs 7 T Pharmascan MRI (Bruker). |
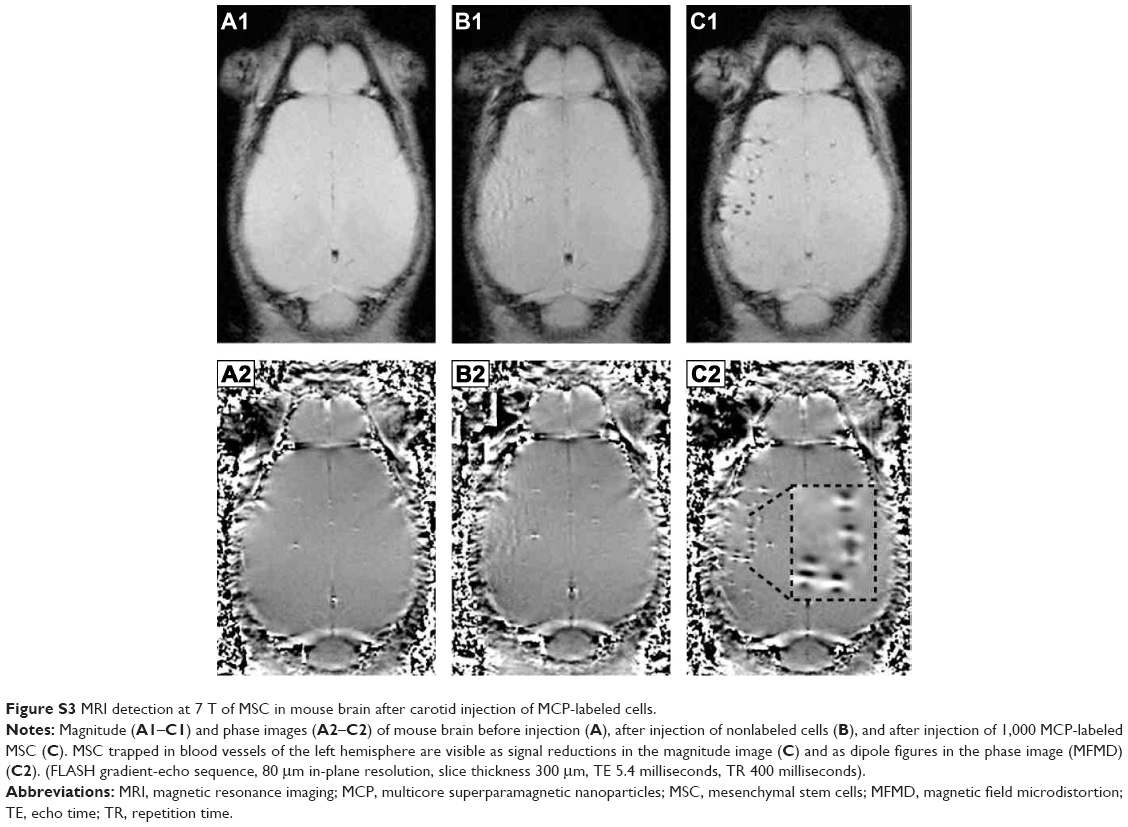 | Figure S3 MRI detection at 7 T of MSC in mouse brain after carotid injection of MCP-labeled cells. |
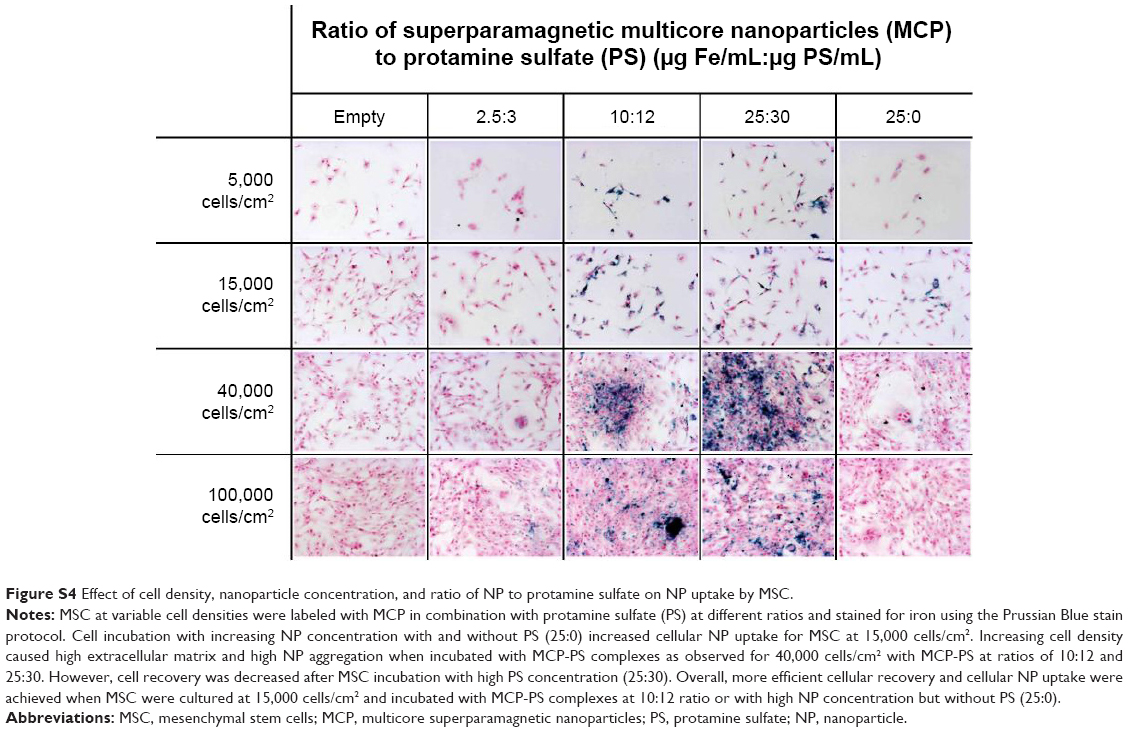 | Figure S4 Effect of cell density, nanoparticle concentration, and ratio of NP to protamine sulfate on NP uptake by MSC. |
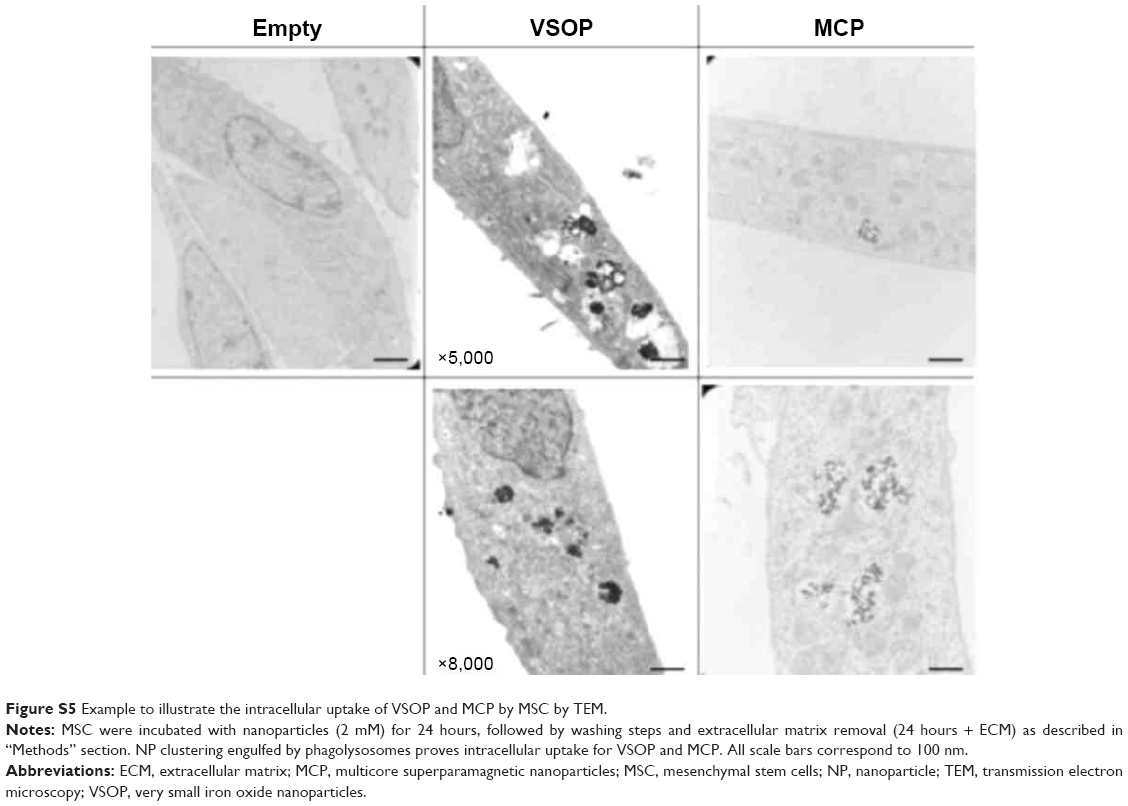 | Figure S5 Example to illustrate the intracellular uptake of VSOP and MCP by MSC by TEM. |
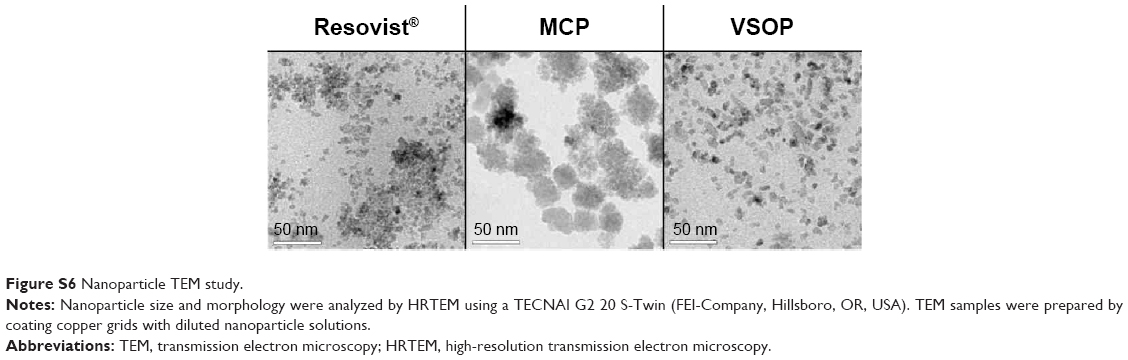 | Figure S6 Nanoparticle TEM study. |
 © 2016 The Author(s). This work is published and licensed by Dove Medical Press Limited. The full terms of this license are available at https://www.dovepress.com/terms.php and incorporate the Creative Commons Attribution - Non Commercial (unported, v3.0) License.
By accessing the work you hereby accept the Terms. Non-commercial uses of the work are permitted without any further permission from Dove Medical Press Limited, provided the work is properly attributed. For permission for commercial use of this work, please see paragraphs 4.2 and 5 of our Terms.
© 2016 The Author(s). This work is published and licensed by Dove Medical Press Limited. The full terms of this license are available at https://www.dovepress.com/terms.php and incorporate the Creative Commons Attribution - Non Commercial (unported, v3.0) License.
By accessing the work you hereby accept the Terms. Non-commercial uses of the work are permitted without any further permission from Dove Medical Press Limited, provided the work is properly attributed. For permission for commercial use of this work, please see paragraphs 4.2 and 5 of our Terms.