")
Back to Journals » Cancer Management and Research » Volume 11
L3 skeletal muscle index (L3SMI) is a surrogate marker of sarcopenia and frailty in non-small cell lung cancer patients
Authors Portal D , Hofstetter L , Eshed I, Dan-Lantsman C, Sella T, Urban D , Onn A , Bar J , Segal G
Received 24 November 2018
Accepted for publication 23 February 2019
Published 1 April 2019 Volume 2019:11 Pages 2579—2588
DOI https://doi.org/10.2147/CMAR.S195869
Checked for plagiarism Yes
Review by Single anonymous peer review
Peer reviewer comments 3
Editor who approved publication: Dr Chien-Feng Li
D Portal,1 L Hofstetter,2 I Eshed,3 C Dan-Lantsman,3 T Sella,4,5 D Urban,5 A Onn,5,6 J Bar,5 G Segal2
1Sackler Faculty of Medicine, Tel-Aviv University, Tel Aviv, Israel; 2Department of Internal Medicine ‘T’, Chaim Sheba Medical Center, affiliated to the Sackler Faculty of Medicine, Tel-Aviv University, Tel Aviv, Israel; 3Department of Diagnostic Imaging, Chaim Sheba Medical Center, affiliated to the Sackler Faculty of Medicine, Tel-Aviv University, Tel Aviv, Israel; 4The Dr. Pinchas Borenstein Talpiot Medical Leadership Program, Sheba Medical Center, Ramat Gan, Israel; 5Institute of Oncology, Chaim Sheba Medical Center, affiliated to the Sackler Faculty of Medicine, Tel-Aviv University, Tel Aviv, Israel; 6Institute of Pulmonary Medicine, Chaim Sheba Medical Center, affiliated to the Sackler Faculty of Medicine, Tel-Aviv University, Tel Aviv, Israel
Background: Non-small cell lung cancer (NSCLC) is a common and highly lethal disease. As advanced treatment modalities are being developed, improved prognostication methods are sought. L3 skeletal muscle index (L3SMI) and alanine aminotransferase (ALT) levels are accepted surrogate markers of sarcopenia and related frailty. We aimed to evaluate the potential association of these markers with NSCLC patients’ survival.
Methods: A retrospective, single-center study of an NSCLC patients’ cohort. L3SMI was calculated based on skeletal muscle area on computed tomography scans at the level of the L3 vertebra. Clinical data were extracted from clinical charts.
Results: A total of 140 patients (56.4% males, median age 66 [range 37–86]) were included in this study, 32% were diagnosed at stage 3 and 45% at stage 4. During the follow-up duration (median of 1.9 years; range 1 month to 6.4 years), 102 patients (72.8%) died. Patients’ characteristics that were found to be associated with increased mortality were performance status, albumin and tumor stage at diagnosis. Sarcopenia, defined as low L3SMI (lower than 41 cm2,/m2, for women and lower than 53 cm2,/m2, for men) was significantly associated with higher risk of mortality compared with patients with normal L3SMI values (77.2%, vs 64.6%, p=0.013) in univariate analysis, but not in a multiple regression analysis.
Conclusion: Low L3SMI could serve as a surrogate marker for sarcopenia and frailty and, as such, facilitate the prognostication process of NSCLC patients.
Keywords: sarcopenia, skeletal muscle index, lung cancer, tomography, ALT, prognosis
Background
Reliable clinical tools for assessing patient’s physiological reserves are of great importance in helping physicians make decisions about future treatments and appraising patients’ prognosis. The Eastern Cooperative Oncology Group (ECOG) performance status (ECOG-PS) score is a good example for such tools. In recent years, additional measures have been proposed in an attempt to evaluate patients’ capacity to cope with, at times, highly aggressive treatments. The frailty status, along with sarcopenia evaluation, were suggested as being parallel to determination of PS and could potentially improve the selection of patients eligible for more aggressive therapies.1 Many authors relate to sarcopenia and frailty as a continuum, or as a cause and outcome. Cederholm T. even connect this, so-called, overlapping continuum to mortality, stating that “… robustness passes from sarcopenia over frailty to disability leading eventually to a mortal outcome”.2 Lorenzi et al defined sarcopenia as the “biologic substrate” of frailty and tried to establish an association between leukocytes telomere length and this continuum.3 Wilson et al defined sarcopenia as the “precursor syndrome or the physical manifestation of frailty”.4 There is no doubt that this continuum is associated with nutritional status but also with inherited patterns of muscle mass and distribution. The overall result may define the patients' robustness and potential for successful combat of potentially lethal illnesses, such as lung cancer.
Subjective, qualitative measures for sarcopenia and frailty, such as the “eyeball test”, tend to be less accurate.5 Therefore, we focused on two quantitative parameters of frailty that could add important information to the cancer patients’ clinical, overall evaluation, imaging-based sarcopenia evaluation and alanine aminotransferase (ALT) serum levels.
Sarcopenia evaluation via muscle mass assessment in computed tomography scans
Sarcopenia is defined as a change in body composition that includes a pathological decrease in muscle mass which affects performance.6 It is generally assigned to the realm of geriatric medicine, but at all phases of life, it is associated with a huge burden of both financial and functional costs.7 Several methods are available for evaluation of the overall skeletal muscle mass, with different accuracy levels. These include dual-energy X-ray absorptiometry and bioelectrical impedance analysis, the first being more accurate than the second but requires specialized equipment. Computed tomography (CT) is considered today the gold standard for sarcopenia evaluation due to its accuracy in body composition measurement and its availability in the clinical setting.8–10
Several studies have shown that sarcopenia can be quantified through an estimation of three-dimensional muscle mass at the level of L3 vertebra on two-dimensional planar sections (cm2 of muscle tissue) of CT scans. This cross-section was found to be the most accurate predictor to whole-body muscle mass.11 The muscle area at L3 vertebra level, divided by the patient height (squared), is accepted as a surrogate marker of sarcopenia and cachexia, and is also known as the third lumbar vertebra skeletal muscle index (L3SMI).9,12,13 L3SMI were found to be clinically predictive and associated with clinical endpoints such as survival and length of hospitalization in various patients’ populations including postliver transplantation10,12 and in various cancer types.13–16
ALT activity in the peripheral blood
ALT (SGPT) is a liver enzyme, commonly monitored in routine bloodwork. Its biochemical activity is catalyzing pyruvate to alanine reaction in the skeletal muscle and catalyzing alanine to pyruvate reaction in the liver.17 It is commonly used as a biomarker for hepatocellular injury. No data have been available regarding the clinical significance of lower-than-normal ALT values. Recently, several publications have demonstrated a low serum ALT activity to be associated with shortened survival in middle-aged healthy adults,18 and in patients hospitalized for various causes.19 Low ALT values, potentially representing low muscle mass (sarcopenia), may be associated with increased frailty and subsequently shortened survival.
Lung cancer is the most common cancer worldwide, and it the most common cause of cancer-related death.20 The most common type of lung cancer is non-small cell lung cancer (NSCLC), amounting to about 80% of all lung cancers. Lung cancer patients are mostly elderly and with significant comorbidities; thus, fragility assessment in those patients is a crucial element of their initial and ongoing evaluation. Both ALT and L3SMI values have the advantage of being quantitative parameters in the assessment of frailty, and are available to clinicians in the routine clinical practice (ALT being part of routine bloodworks and L3SMI easily derived from CT scans done with every new case of lung cancer diagnosis). We conducted the current research in order to examine whether ALT and L3SMI carry prognostic value in patients with NSCLC.
Methods
Study population
We retrospectively studied records of lung cancer patients diagnosed, treated and followed in a tertiary referral oncology center, the Chaim Sheba Institute of Oncology, from September 2011 to November 2014. For this study, adult (over 18 years of age) patients with a diagnosis of NSCLC were included. Additional laboratory and clinical data were collected from patients’ records. Included were only patients that performed a CT scan that included L3 vertebra, performed at any time within 2 months of diagnosis. As mentioned earlier, the L3 level was included, as part of the standard chest CT, in all our patients’ population and CT scans were done for both diagnosis and follow-up assessments. Cases with elevated ALT levels (above the upper limit of normal value in the local laboratory; 40 IU/L), representing hepatocellular liver damage, were excluded, as were cases with missing relevant data (weight or height measurements, laboratory results).
Variables measurement and definition
Sarcopenia was evaluated using L3SMI, based on CT scans of the study population, performed within 2 months of pathologic diagnosis. This 2-month period was arbitrarily determined in order to have a sarcopenia assessment that would be as close as possible to the premorbid condition of patients (prior to disease progression and treatment results). Skeletal muscle area was calculated using AW Server (General Electric Healthcare Inc., USA) and performed by one investigator (PD) after a thorough instruction by a radiology expert (DLC), including cross-verification of results (18 review cases, correlation coefficient: R =0.996, p<0.001). The muscle area was corrected for the slice thickness and divided by the patient squared height. L3SMI is reported with cm2/m2 units. The study population was divided into two groups of normal and low L3SMI, according to threshold values described previously:21 low L3SMI was defined as under 41 cm2/m2 for females and under 53 cm2/m2 for males. Demographic information (including age, sex and marital status), cancer type, disease stage at diagnosis and ECOG-PS were obtained from the Oncology Institute Working Registry. Blood levels of ALT, albumin, hemoglobinand creatinine at the time of diagnosis were obtained manually from electronical medical records for the study population, as were past diagnosis of comorbidities including diabetes mellitus, chronic kidney disease, cerebrovascular disease, chronic obstructive pulmonary disease and ischemic heart disease.
Outcome and definition
The primary outcome was all-cause mortality. Mortality data were obtained from the national Israeli Population registry in August 2017. Follow-up duration was calculated from diagnosis date to mortality or end of study.
Statistical analysis
Categorical variables were described as number and percentage. Continuous variables were examined for their distribution using histogram and Q–Q plot and described as mean and standard deviation for normally distributed variables or median and IQR for other variables. Continuous variables were compared between categories using Kruskal Wallis and Mann–Whitney tests. Length of follow-up was described using reverse censoring method. Kaplan–Meier curve was used to describe mortality, and the log-rank test was applied to compare between L3SMI categories. All variables were explored for an association with all-cause mortality using univariate Cox regression. The set of covariates included in the multiple regression analysis were age, sex and variables that were associated with the studied outcome at a significant level of p<0.2 in the univariate analysis. Propensity score matching was performed in order to control of baseline characteristics between the normal and low L3SMI groups. Multivariate logistic regression on all patients’ baseline characteristics was used to calculate the propensity score as the probability of patients to be in a low L3SMI group. Patients were matched according to propensity score, and an upmost difference of 5% was considered acceptable. Matched groups were compared using McNemar test for categorical variables, and paired sample t-tests or Wilcoxon test for continued variables. Stratified Cox regression was used to evaluate the HR between the groups after the matching. All statistical tests were two-sided, and a p-value <0.05 was considered significant. All statistical analyses were performed using SPSS (IBM Corp. Released 2017. IBM SPSS Statistics for Windows, Version 25.0. Armonk, NY, USA).
Results
Patient characteristics
Records of 203 patients diagnosed with lung cancer were obtained. Of those, 175 were diagnosed with NSCLC. Twenty-one patients were excluded due to missing height and/or weight data, 9 were excluded due to unavailable laboratory results, 2 for elevated ALT values and 3 for missing relevant CT slides (ie, missing L3 sections). The remaining 140 patients were included in our analysis (patients’ characteristics described in Table 1). The median follow-up was 1.9 years (range: 1 month to 6.4 years). Event-free follow-up duration range was 2.8 years–6.4 years.
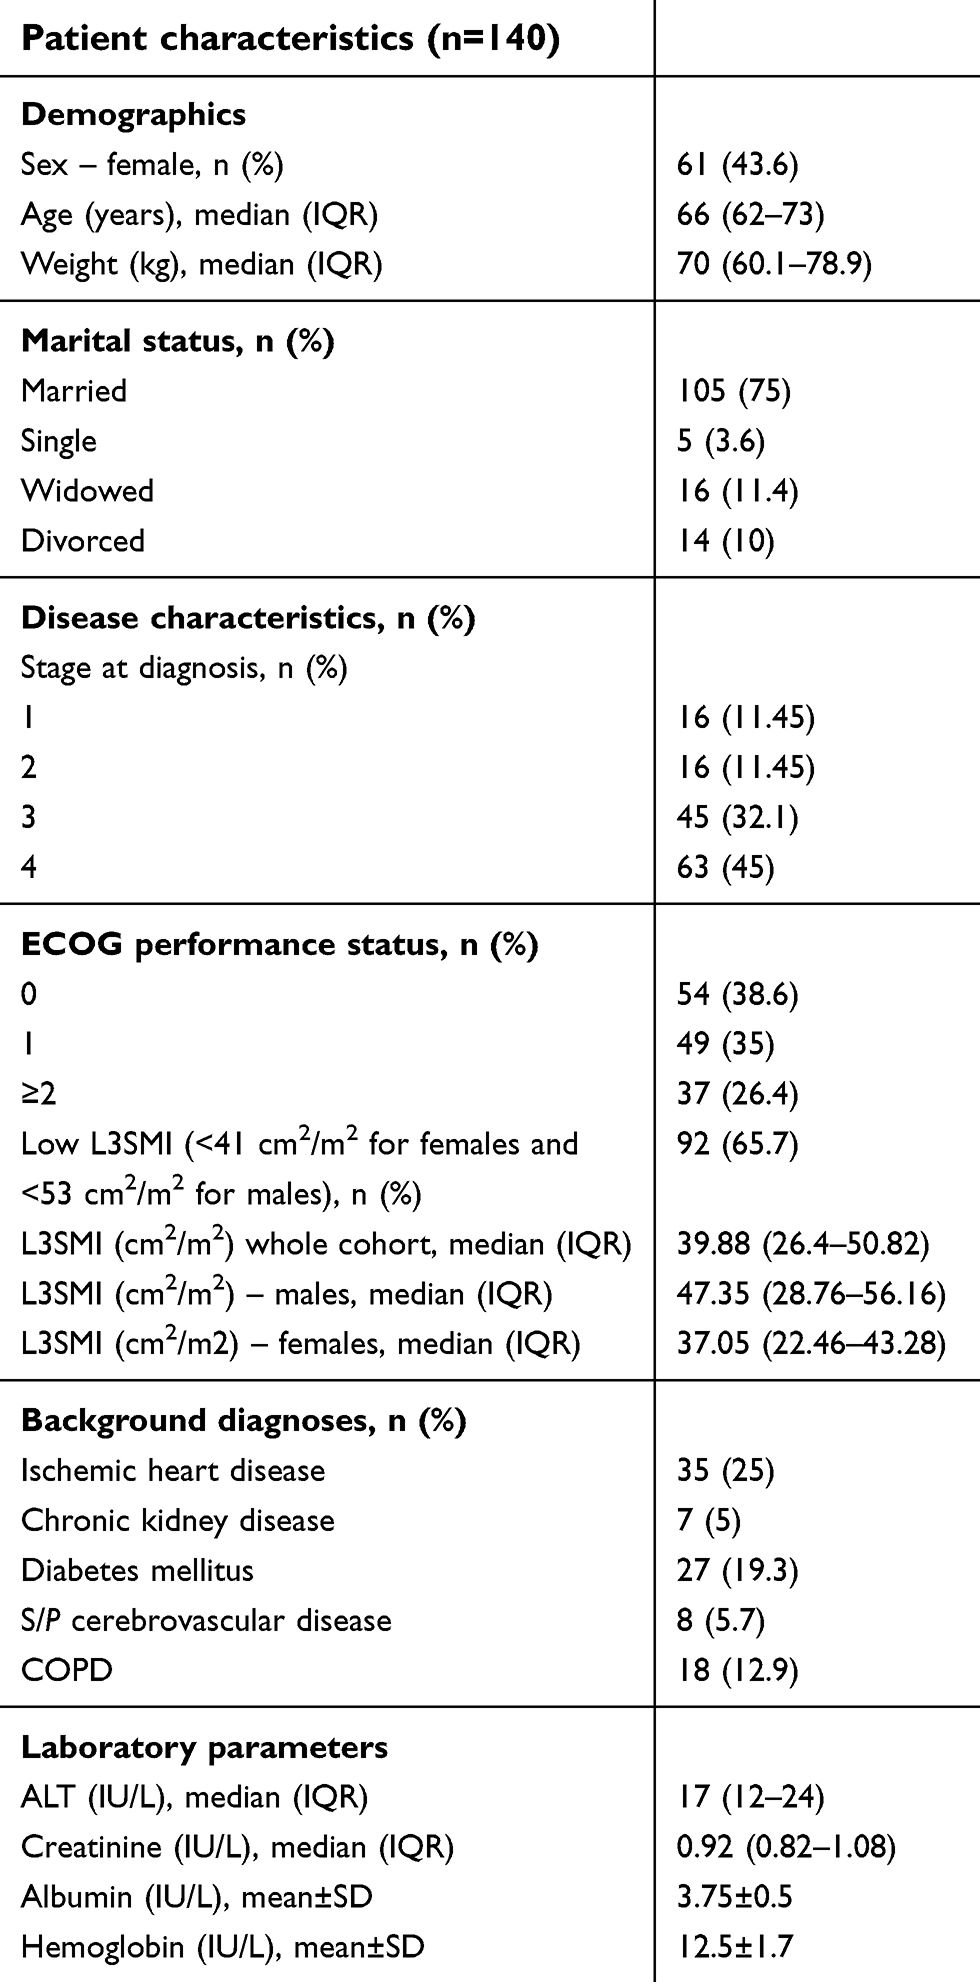 | Table 1 Patients’ characteristics – whole cohort |
The cohort consisted of 56% males, and the median age at diagnosis was 66 years (range 37–86). Over 77% of participants were diagnosed with NSCLC stages 3 and 4, while similar proportions were diagnosed with ECOG PS of 0 or 1. Low L3SMI was common amongst our patient population (65.7%). Low ALT values were also common in this patient population with a median value of 17 IU/L (normal range 7–45 IU/L), while the mean albumin values were only mildly lower than normal (3.75 gr/dL ±0.5). As shown in Table 1, aside from lung cancer, there was no other significant load of morbidity in our patients’ population, potentially contributing to excess mortality.
ECOG PS, weight, ALT and albumin levels were found to be distributed differently between the patients with normal L3SMI and patients with low L3SMI, as can be seen in Table 2. Therefore, matching was performed, as described in the “Methods“ section, and 34 pairs were identified.
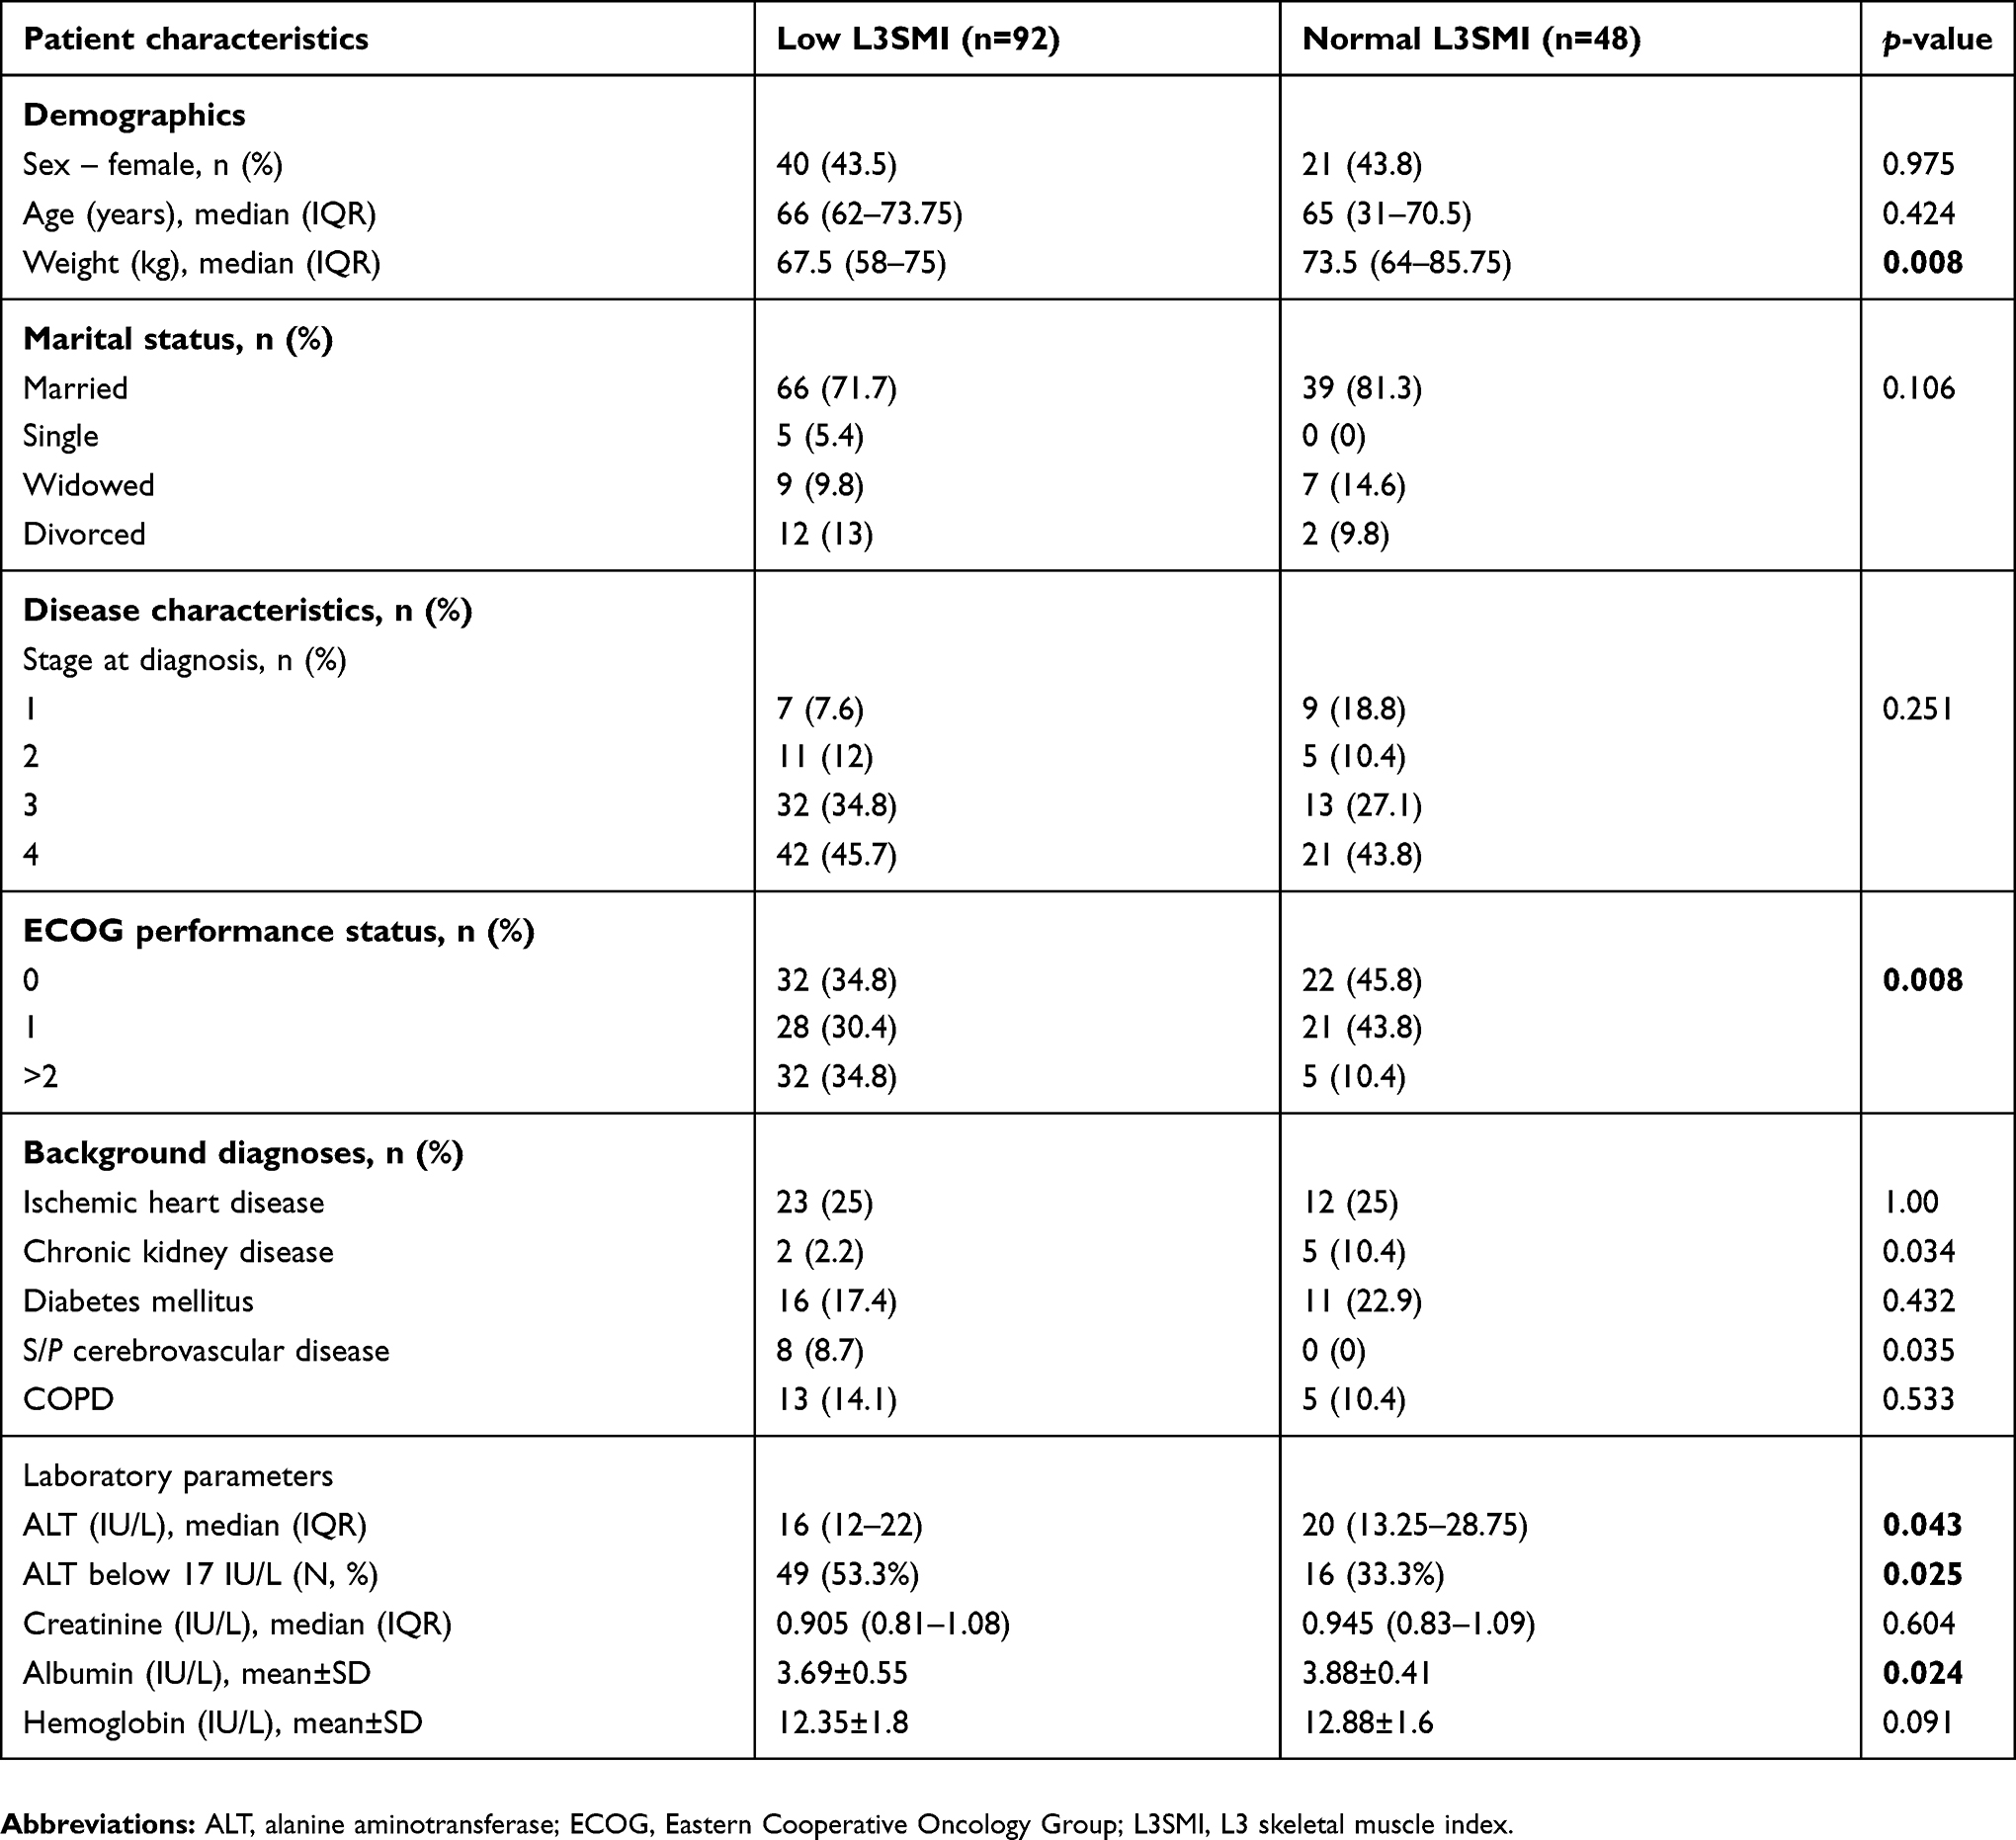 | Table 2 Patient characteristics by L3SMI groups |
Association between L3SMI and ECOG PS
Lower L3SMI values were found to be in correlation with poor ECOG PS in males, while no such correlation was found among female patients (p=0.032 for males (Figure 1), p=0.904 for females). Males with ECOG PS score of “0” had L3SMI (median 52.9, IQR 44.3–59.6) that did not differ significantly (p=0.138) from that in males with ECOG PS score of “1” (median 46.1, IQR 26–56.4). However, in male patients with ECOG PS score of 2 and above (“2+”), the L3SMI (median 41.3, IQR 27.6–48.7) was significantly lower than in male patients with ECOG PS score of “0” (p=0.005) but not from that in males with ECOG PS score of “1” (p=0.498).
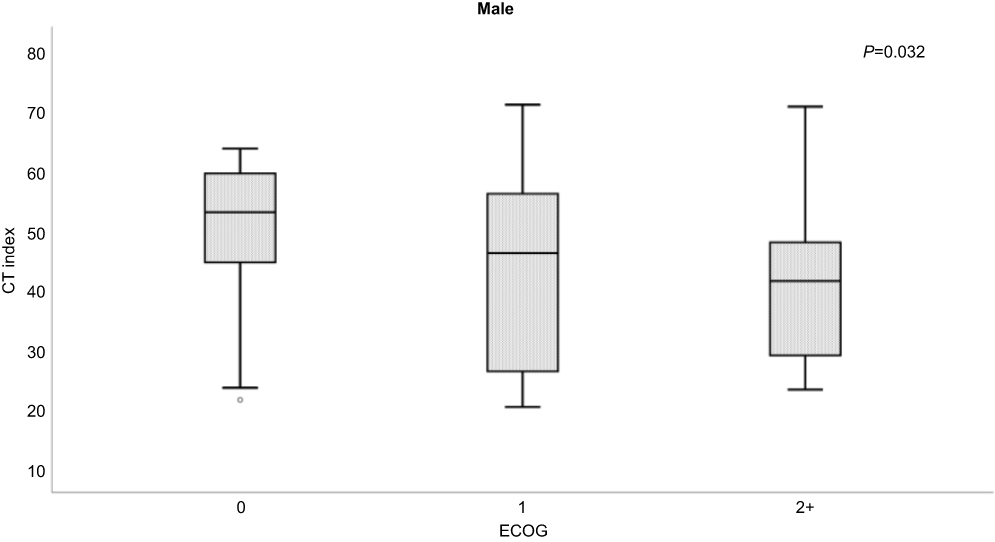 | Figure 1 L3SMI correlation with ECOG performance status in males.Abbreviations: CT, computed tomography; ECOG, Eastern Cooperative Oncology Group; L3SMI, L3 skeletal muscle index. |
Mortality
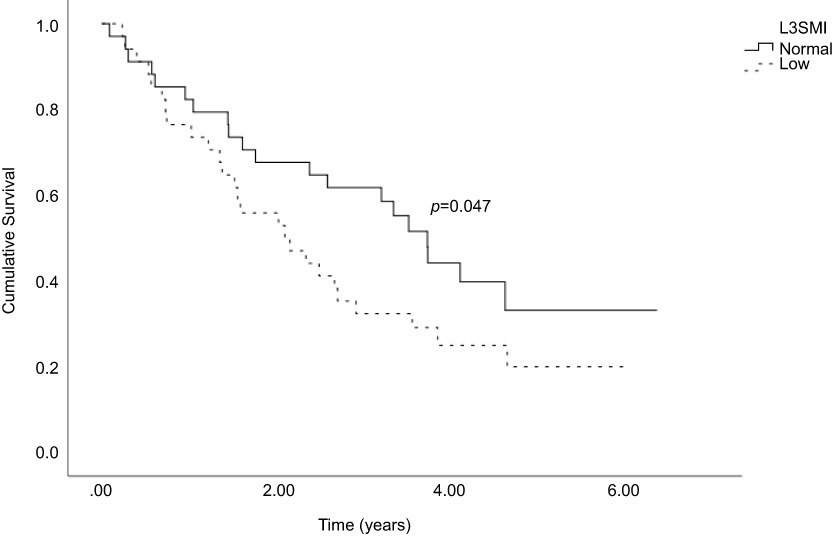
During the follow-up period, 102 (72.9%) of the patients died. Patients with low L3SMI were at a significantly higher risk for mortality, compared to normal values (Figure 2).
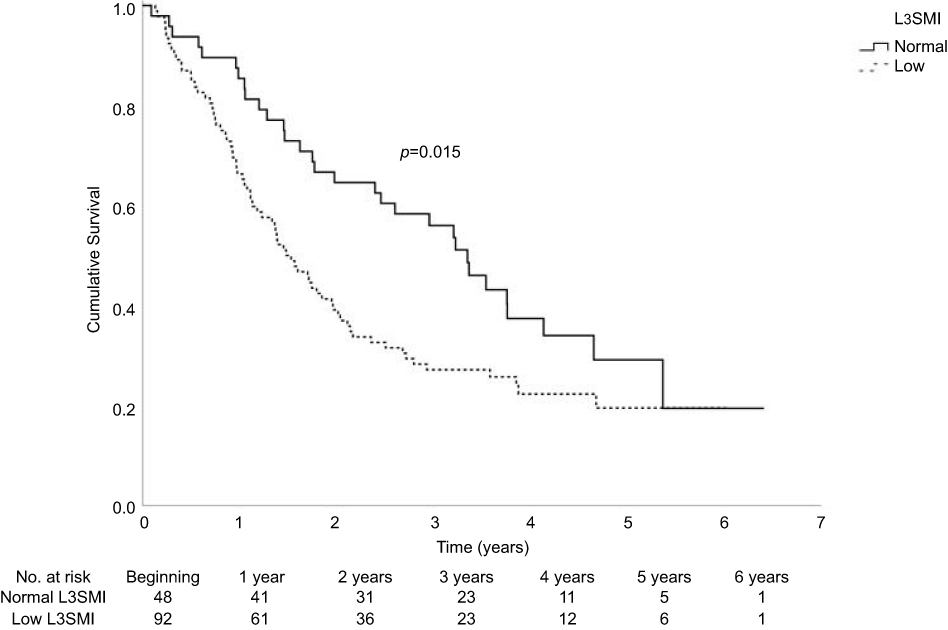 | Figure 2 Kaplan–Meier mortality curve according to L3SMI.Abbreviation: L3SMI, L3 skeletal muscle index. |
Univariate analysis of parameters associated with increased risk of mortality
Results of univariate analysis are presented in Table 3. Low L3SMI was found to be associated with increased risk of mortality (77.2% of patients with low L3SMI died vs 64.6% of patients with normal L3SMI, HR =1.683, 95% CI 1.102–2.573, p=0.015). Comorbidities were not found to be associated with increased risk of mortality, including ischemic heart disease, diabetes mellitus, state post cerebrovascular disease, chronic kidney disease and chronic obstructive pulmonary disease. Lower ALT values were not found to be associated with increased risk of mortality, either as a categorical or as a continuous variable.
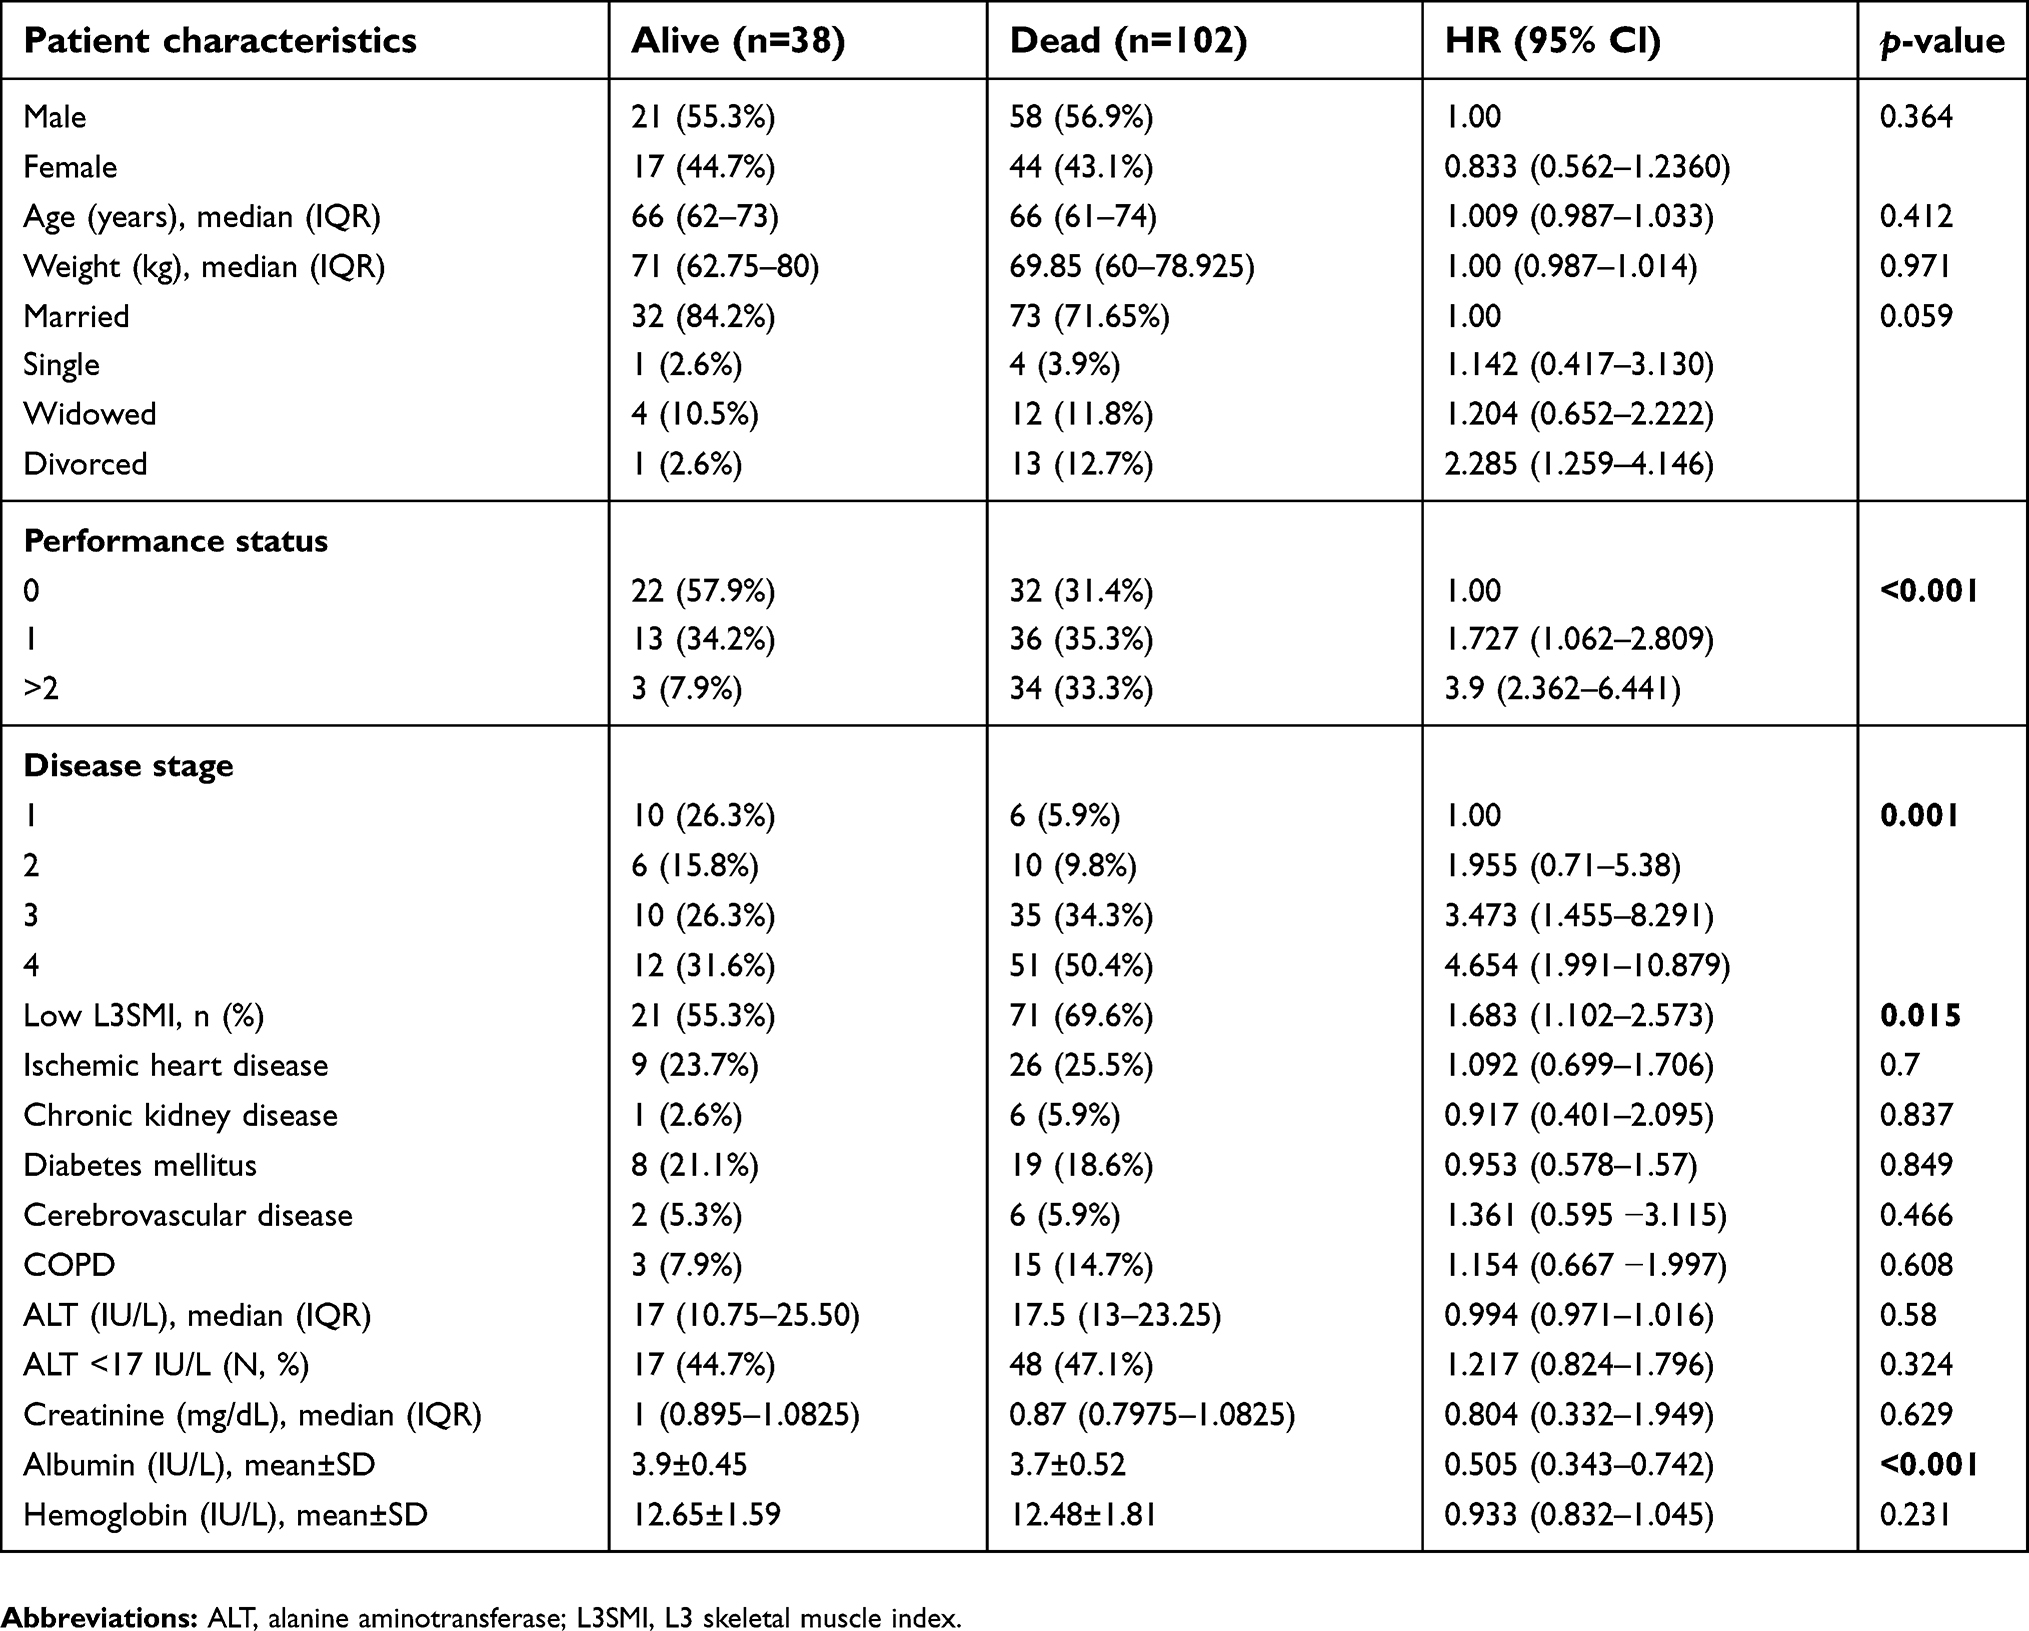 | Table 3 Univariate analysis of patients’ characteristics associated with mortality (% indicated are within-mortality group, defined at the end of the follow-up duration) |
While several patients’ characteristics were not found to be associated with increased risk of mortality (sex, age, weight and comorbidities), others were significantly associated with increased mortality: in comparison to patients with a good ECOG performance status (0), patients with higher ECOG scores had higher risk for death (for ECOG =1, HR =1.727; 95% CI 1.062–2.809; for ECOG ≥2, HR =3.9; 95% CI 2.362–6.441). Relative to patients with a lower disease stage upon diagnosis (1), patients at higher stages were at increased risk for mortality (for stage 2, HR =1.955; 95% CI 0.71–5.38, p=0.195; for stage 3, HR =3.473; 95% CI 1.455–8.291, p<0.001; for stage 4, HR =4.654; 95% CI 1.99–10.879, p<0.001). Higher concentration of blood albumin was found to be associated with decreased risk of mortality (3.7±0.52 vs 3.9±0.45, HR =0.505; 95% CI 0.343–0.742, p<0.001).
Multiple regression analysis of parameters associated with increased risk of mortality
Results of the multiple regression analysis are presented in Table 4. Worse ECOG PS (score ≥2 vs 0, HR =4.293, 95% CI 2.282–8.073, p<0.001), advanced disease stage upon diagnosis (stage 3 vs 1, HR =3.439, 95% CI 1.325–8.924, p=0.011; stage 4 vs 1 HR =6.076, 95% CI 2.345–15.741, p<0.001) and low albumin blood concentration (HR =1.548, 95% CI 1.007–2.375, p=0.046) were all found to be significantly correlated with increased risk of mortality in this multivariate model. Low L3SMI was not found to be associated with mortality after being incorporated into a multiple regression analysis (p=0.334). After adjustment, patients with ECOG performance status score of “1” did not have a significantly higher risk for mortality compared to patients with ECOG PS score of “0”.
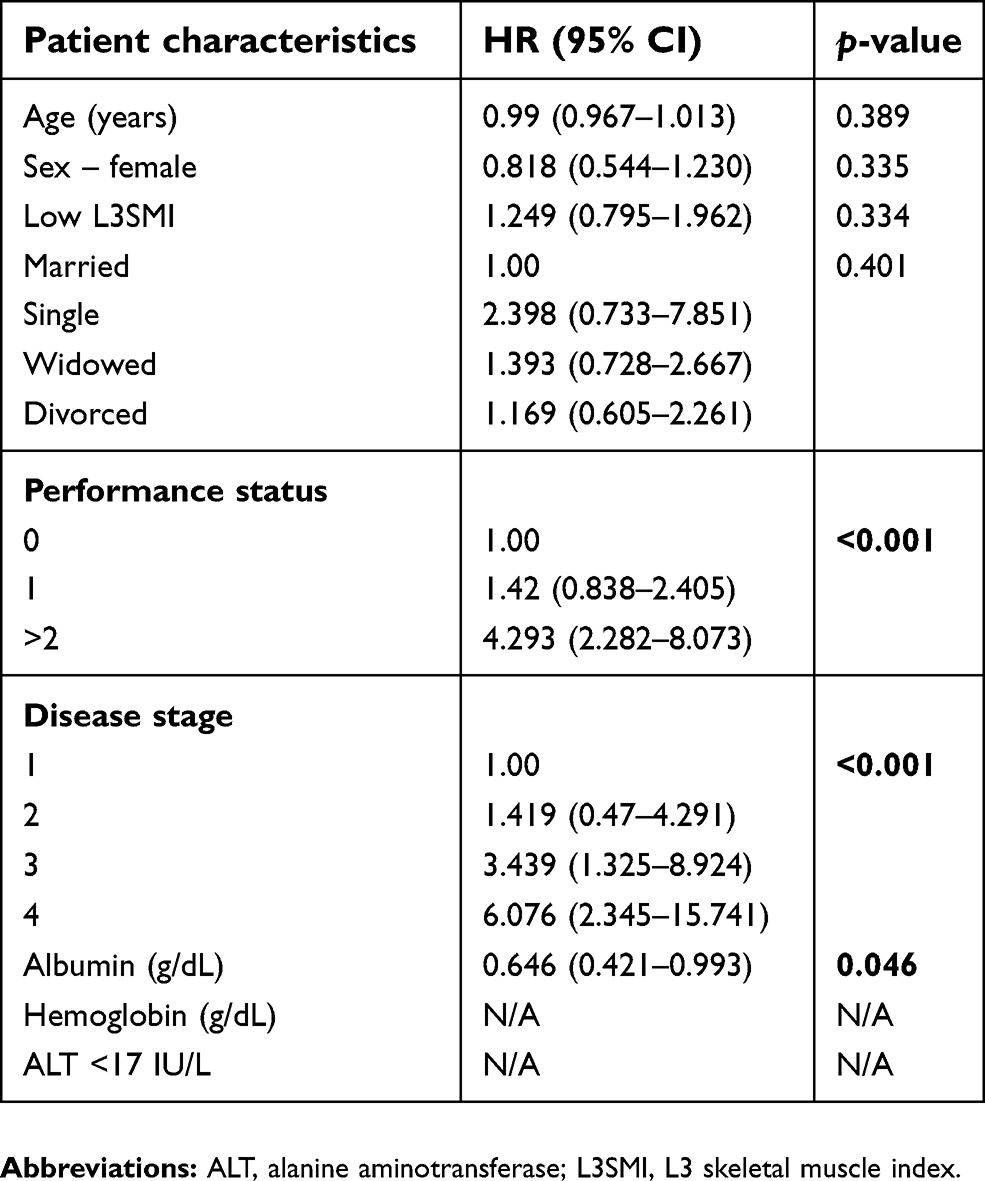 | Table 4 Multiple regression analysis of patient characteristics associated with mortality |
Propensity score matching
Using propensity score matching, 34 pairs were matched. Within the matched cohort of 68 patients, patients with low L3SMI were found to be at higher risk compared to patients with normal L3SMI (HR =2.222, 95% CI 1.012–4.88, p=0.047). See Figure 3.
 | Figure 3 Kaplan–Meier mortality curve according to L3SMI after PSM.Abbreviations: L3SMI, L3 skeletal muscle index; PSM, propensity score matching. |
Discussion
In contrast to the cancer-related cachexia that shatters lung cancer patients, premorbid sarcopenia and frailty are patients’ characteristics that set the stage for the future battle of patients with cancer. As such, baseline sarcopenia and frailty assessment could have a major role in determination of prognosis of NSCLC patients. Our study is not the first to investigate quantitative measures for sarcopenia evaluation in lung cancer patients. Focusing on imaging studies and related modalities, Kim et al14,15 have shown that sarcopenia, as determined by CT, could be used to predict prognosis in patients with small cell lung cancer (SCLC). Sjoblom et al22 have failed to demonstrate this correlation in NSCLC patients, but stated that further research is warranted to establish whether muscle measures should be integrated into routine practice to improve prognostic accuracy. In our study, lower L3SMI was found to be associated with increased risk of mortality when appreciated in a univariate analysis. We used L3SMI threshold values calculated by Martin et al on a Canadian population,21 as this population was assumed to be similar to the Israeli population in lifestyle and western culture. Asian researches, such as Kim and Zheng, noticed that western thresholds do not necessarily fit with their study populations, and adjusted accordingly.14,16 Indeed, different normal ranges and thresholds of L3SMI exist in the literature, each calculated to fit mortality trends of a specific population group.13,14,16,21 Therefore, more research is needed on larger cohorts in order to calculate an agreed-upon and prognostic relevant value.
Taking several patients’ characteristics into a multiple regression analysis, the association of sarcopenia with mortality did not reach statistical significance. This finding could be viewed in several ways. One should take into account the short, overall survival of these patients’ cohort. It may be reasonable to assume that sarcopenia develops at a slower rate when compared to this devastating disease similar to the results of other studies on rapid progressing cancers, such as pancreatic cancer.23,24 Therefore, sarcopenia would become more valuable, as a prognostic tool, in cases of prolonged survival, as in cases of other, less lethal cancer types which are evidently heterogeneous with regard to the impact of sarcopenia and frailty on survival.13
In this study population, low ALT levels were not found to be associated with shortened survival, in contrast to other studies which showed an association between low ALT levels and mortality in the general population.18,25,26 Nevertheless, a trend of association was demonstrated in males (correlation between ALT and L3SMI, using Spearman’s Rho – correlation coefficient of 0.241 [p=0.058]). Once again, this finding potentially indicates that the short survival of NSCLC patients would not “allow” them to go through a phase of prolonged, deteriorating cachexia and frailty before dying. The high rate of mortality (72.8%) in a relatively short follow-up duration in our cohort supports this hypothesis.
Both the stage of the disease at diagnosis and ECOG PS were found to be strong indicators of mortality in cancer patients, and are accepted as survival predictors worldwide. Accordingly, in our study patients with higher ECOG, PS had an increased HR for death. Importantly, low L3SMI values, indicating sarcopenia, were found to be correlated with poorer ECOG scores in males (Figure 1), while in female patients this correlation did not reach statistical significance.
Conclusion
As advanced treatment modalities emerge in the field of disease-centered medicine and oncology, there is an increasing need for more patient-oriented personalized medicine. Frailty and sarcopenia evaluation are leading patient characteristics for such personalized approach. In this study, we have demonstrated that sarcopenia evaluation, by means of CT scan analysis and L3SMI calculation, has the potential to improve evaluation of NSCLC patients. We assume that prolonged survival may intensify the value of sarcopenia evaluation in the future.
Study limitations
This is a retrospective study and therefore, causality could not be inferred from our data. The relatively small cohort size and the high mortality rates deny the ability to reach statistically significant conclusions regarding some of the study parameters being evaluated. Larger, prospective studies should be done in order to further evaluate the practical benefits of sarcopenia evaluation for lung cancer patients and define agreed-upon L3SMI sarcopenia threshold for the general population. In addition, prospective studies could better evaluate the yield of consecutive sarcopenia and frailty assessments along disease progression and treatment delivery. It should be stated that qualitative parameter of frailty was not available. Therefore, our findings are especially relevant for the muscle mass component of sarcopenia and frailty and do not address the whole phenotype of these syndromes.
Ethics, consent and conflict of interest
The Institutional Review Board of the Chaim Sheba Medical Center approved this study, in accordance with the ethical standards laid down in the 1964 Declaration of Helsinki and its later amendments. As a retrospective study, informed consent was unnecessary. Patients’ confidentiality was assured by accepted guidelines for data de-identification and anonymization. There were no external fundings for this study.
Availability of data and materials
All clinical and imaging data are available from the authors.
Author contributions
All authors contributed to data analysis, drafting and revising the article, gave final approval of the version to be published, and agree to be accountable for all aspects of the work.
Disclosure
Dr J Bar reports grants and personal fees from MSD and Astrazeneca, and personal fees from Roche, Pfizer, VBL, and BMS, outside the submitted work. The other authors report no conflicts of interest in this work.
References
1. Korc-Grodzicki B, Downey RJ, Shahrokni A, Kingham TP, Patel SG, Audisio RA. Surgical considerations in older adults with cancer. J Clin Oncol. 2014;32(24):2647–2653. doi:10.1200/JCO.2014.55.0962
2. Cederholm T. Overlaps between frailty and sarcopenia definitions. In: Nestle Nutrition Institute Workshop Series. Vol. 83. 2015;65–70. doi: 10.1159/000382063
3. Lorenzi M, Bonassi S, Lorenzi T, Giovannini S, Bernabei R, Onder G. A review of telomere length in sarcopenia and frailty. Biogerontology. 2018;19:209–221. doi:10.1007/s10522-018-9749-5
4. Wilson D, Jackson T, Sapey E, Lord JM. Frailty and sarcopenia: the potential role of an aged immune system. Ageing Res Rev. 2017;36:1–10. doi:10.1016/j.arr.2017.01.006
5. Afilalo J. The clinical frailty scale. Circulation. 2017;135(21):2025–2027. doi:10.1161/CIRCULATIONAHA.116.025958
6. Rosenberg IH. Sarcopenia: origins and clinical relevance. Clin Geriatr Med. 2011;27(3):337–339. doi:10.1016/j.cger.2011.03.003
7. Robinson SM, Reginster JY, Rizzoli R, et al. Does nutrition play a role in the prevention and management of sarcopenia? Clin Nutr. 2018;37(4):1121–1132. doi:10.1016/j.clnu.2017.08.016
8. Mourtzakis M, Prado CMM, Lieffers JR, Reiman T, McCargar LJ, Baracos VE. A practical and precise approach to quantification of body composition in cancer patients using computed tomography images acquired during routine care. Appl Physiol Nutr Metab. 2008;33(5):997–1006. doi:10.1139/H08-075
9. Fearon K, Strasser F, Anker SD, et al. Definition and classification of cancer cachexia: an international consensus. Lancet Oncol. 2011;12(5):489–495. doi:10.1016/S1470-2045(10)70218-7
10. Montano-Loza AJ, Meza-Junco J, Baracos VE, et al. Severe muscle depletion predicts postoperative length of stay but is not associated with survival after liver transplantation. Liver Transpl. 2014;20(6):640–648. doi:10.1002/lt.23863
11. Shen W. Total body skeletal muscle and adipose tissue volumes: estimation from a single abdominal cross-sectional image. J Appl Physiol. 2004;97(6):2333–2338. doi:10.1152/japplphysiol.00744.2004
12. Golse N, Bucur PO, Ciacio O, et al. A new definition of sarcopenia in patients with cirrhosis undergoing liver transplantation. Liver Transpl. 2017;23(2):143–154. doi:10.1002/lt.24671
13. Prado CM, Lieffers JR, McCargar LJ, et al. Prevalence and clinical implications of sarcopenic obesity in patients with solid tumours of the respiratory and gastrointestinal tracts: a population-based study. Lancet Oncol. 2008;9(7):629–635. doi:10.1016/S1470-2045(08)70153-0
14. Kim EY, Kim YS, Park I, Ahn HK, Cho EK, Jeong YM. Prognostic significance of CT-determined sarcopenia in patients with small-cell lung cancer. J Thorac Oncol. 2015;10(12):1795–1799. doi:10.1097/JTO.0000000000000690
15. Kim EY, Lee HY, Kim YS, et al. Prognostic significance of cachexia score assessed by CT in male patients with small cell lung cancer. Eur J Cancer Care (Engl). 2017:e12695. doi:10.1111/ecc.12695.
16. Zheng ZF, Lu J, Zheng CH, et al. A novel prognostic scoring system based on preoperative sarcopenia predicts the long-term outcome for patients after r0 resection for gastric cancer: experiences of a high-volume center. Ann Surg Oncol. 2017;24(7):1795–1803. doi:10.1245/s10434-017-5813-7
17. Liu Z, Que S, Xu J, Peng T. Alanine aminotransferase-old biomarker and new concept: a review. Int J Med Sci. 2014;11(9):925–935. doi:10.7150/ijms.8951
18. Ramaty E, Maor E, Peltz-Sinvani N, et al. Low ALT blood levels predict long-term all-cause mortality among adults. A historical prospective cohort study. Eur J Intern Med. 2014;25(10):919–921. doi:10.1016/j.ejim.2014.10.019
19. Ruhl CE, Everhart JE. The association of low serum alanine aminotransferase activity with mortality in the us population. Am J Epidemiol. 2013;178(12):1702–1711. doi:10.1093/aje/kwt209
20. Jemal A, Ward EM, Johnson CJ, et al. Annual report to the nation on the status of cancer, 1975-2014, featuring survival. J Natl Cancer Inst. 2017;109(9):1–22. doi:10.1093/jnci/djx030
21. Martin L, Birdsell L, MacDonald N, et al. Cancer cachexia in the age of obesity: skeletal muscle depletion is a powerful prognostic factor, independent of body mass index. J Clin Oncol. 2013;31(12):1539–1547. doi:10.1200/JCO.2012.45.2722
22. Sjøblom B, Grønberg BH, Wentzel-Larsen T, et al. Skeletal muscle radiodensity is prognostic for survival in patients with advanced non-small cell lung cancer. Clin Nutr. 2016;35(6):1386–1393. doi:10.1016/j.clnu.2016.03.010
23. Ozola Zalite I, Zykus R, Francisco Gonzalez M, et al. Influence of cachexia and sarcopenia on survival in pancreatic ductal adenocarcinoma: A systematic review. Pancreatology. 2015;15(1):19–24. doi:10.1016/j.pan.2014.11.006
24. Clark W, Swaid F, Luberice K, et al. Can pancreatic cancer behavior be predicted based on computed tomography measurements of fat and muscle mass? Int J Surgery Oncol. 2016;1(2):e04. doi:10.1097/IJ9.0000000000000004
25. Elinav E, Ackerman Z, Maaravi Y, Ben-Dov IZ, Ein-Mor E, Stessman J. Low alanine aminotransferase activity in older people is associated with greater long-term mortality. J Am Geriatr Soc. 2006;54(11):1719–1724. doi:10.1111/j.1532-5415.2006.00921.x
26. Peltz-Sinvani N, Klempfner R, Ramaty E, Sela BA, Goldenberg I, Segal G. Low ALT levels independently associated with 22-Year all-cause mortality among coronary heart disease patients. J Gen Intern Med. 2016;31(2):209–214. doi:10.1007/s11606-015-3480-6
 © 2019 The Author(s). This work is published and licensed by Dove Medical Press Limited. The full terms of this license are available at https://www.dovepress.com/terms.php and incorporate the Creative Commons Attribution - Non Commercial (unported, v3.0) License.
By accessing the work you hereby accept the Terms. Non-commercial uses of the work are permitted without any further permission from Dove Medical Press Limited, provided the work is properly attributed. For permission for commercial use of this work, please see paragraphs 4.2 and 5 of our Terms.
© 2019 The Author(s). This work is published and licensed by Dove Medical Press Limited. The full terms of this license are available at https://www.dovepress.com/terms.php and incorporate the Creative Commons Attribution - Non Commercial (unported, v3.0) License.
By accessing the work you hereby accept the Terms. Non-commercial uses of the work are permitted without any further permission from Dove Medical Press Limited, provided the work is properly attributed. For permission for commercial use of this work, please see paragraphs 4.2 and 5 of our Terms.