")
Back to Journals » OncoTargets and Therapy » Volume 13
Knockdown of T Cell Immunoglobulin and Mucin 1 (Tim-1) Suppresses Glioma Progression Through Inhibition of the Cytokine-PI3K/AKT Pathway
Authors Zhou P, Fei M, Han Y, Zhou M, Wang H
Received 19 April 2020
Accepted for publication 13 July 2020
Published 4 August 2020 Volume 2020:13 Pages 7433—7445
DOI https://doi.org/10.2147/OTT.S255117
Checked for plagiarism Yes
Review by Single anonymous peer review
Peer reviewer comments 3
Editor who approved publication: Prof. Dr. Nicola Silvestris
Peng Zhou,* Maoxing Fei,* Yanling Han, Mengliang Zhou, Handong Wang
Department of Neurosurgery, Jinling Hospital, Jinling School of Clinical Medicine, Nanjing Medical University, Nanjing 210002, Jiangsu, People’s Republic of China
*These authors contributed equally to this work
Correspondence: Handong Wang Department of Neurosurgery
Jinling Hospital, Jinling School of Clinical Medicine, Nanjing Medical University, No. 305 Zhongshan East Road, Nanjing 210002, Jiangsu, People’s Republic of China
Tel +86-2551805396
Email [email protected]
Background: Glioma is formed by abnormal proliferation of glial cells in the brain. T cell immunoglobulin and mucin 1 (Tim-1) is linked to cancer development. This study aimed to assess Tim-1 functions in biological behaviors.
Methods: The glioma tissues and paracancerous tissues were collected. The pathological morphology of glioma and positive expression of Tim-1 were evaluated. The sh-Tim-1 lentivirus vector was infected into U251 and U87 cells to evaluate glioma cell malignant behaviors. The differentially expressed terms in glioma cells were analyzed by Agilent microarray analysis, and enrichment analyses were performed. Levels of cytokines (TGF-β 1, IL-6, IL-4 and IL-10) and the PI3K/AKT pathway were measured. U87 cells with sh-Tim-1 were transplanted into nude mice, and the volume and weight of tumors were measured.
Results: Tim-1 levels in glioma tissues and cells were higher than those in glial tissues and cells. Tim-1 knockdown prevented glioma cell proliferation, invasion and migration, and reduced TGF-β 1, IL-6, IL-4 and IL-10 levels of glioma. Co-treatment of PI3K/AKT pathway activator and knockdown Tim-1 partially reversed these outcomes. After Tim-1 knockdown, tumor volume and weight and Ki67-positive rate of nude mice were diminished.
Conclusion: Tim-1 knockdown inhibited biological behaviors of glioma cells through the PI3K/AKT pathway, which may provide a novel therapy for glioma.
Keywords: glioma, Tim-1, PI3K/AKT pathway, proliferation, tumor xenografts
Introduction
Glioma is a lethal primary malignant tumor in the brain, taking up about 80% of brain tumors and 30% in central nervous system (CNS).1,2 The mean survival time of glioma is nearly 15 months, featured by strong invasion, extensive intracranial invasion and poor prognosis.1,2 Glioma initiates in precursors and glial cells within CNS, most commonly in adult populations.2–4 At present, the conventional treatment for glioma mainly includes radiotherapy, surgical resection, chemotherapy and targeted treatment.5 Despite advanced improvements in therapeutic regimen, the efficacy of conventional approaches for glioma remains very undesirable.2,6,7 Therein, an in-depth understanding of molecular regulations and biological dysfunctions during glioma progression is pivotal for glioma prevention and clinical practice.
T cell immunoglobulin and mucin 1 (Tim-1), which was firstly discovered by Kaplan et al over 20 years ago,8 in African green monkey kidney cells, is an imperative cell receptor of hepatitis A virus (HAV). Tim-1 (also known as havcr1) belongs to a class of transmembrane proteins with immunoglobulin-like domains that consist of Tim-1, Tim-3 and Tim-4 in human and Tim-1 to Tim-8 in mice.9–12 These proteins are typically presented on cell surface, where the c-terminal sequence is in the cytoplasm and the n-terminal is in the extracellular environment.13–15 Notably, Tim-1 and Tim-4 can promote the adhesion of various enveloped viruses, like filoviruses, alphaviruses and flaviviruses.16–18
Previous studies on Tim-1 regulation of the immune function have suggested that Tim-1 can be used as a co-stimulatory molecule of T cells.9 However, the role of Tim-1 in cancers is rarely reported. Wang et al have documented that Tim-1 activation can induce the apoptosis of colon cancer cells by regulating Fas ligand expression.19 Recently, the prognostic significance of Tim-1 expression has been reported in human non-small-cell lung cancer (NSCLC).20 But the biological functions of Tim-1 in glioma remain elusive. Therefore, this study attempted to mainly evaluate the expression and regulatory roles of Tim-1 in glioma. In addition, glioblastoma is always accompanied by overexpressed epidermal growth factor receptor, which leads to activation of the PI3K/AKT/mTOR pathway.21 The activated PI3K/AKT axis stimulates glioma growth and invasion.22 Thereby, we hypothesize that Tim-1 may exert functions in glioma progression via regulating the potential PI3K/AKT pathway.
Patients and Methods
Ethics Statement
All samples and experiment procedures were examined and ratified by the ethics committee of Jinling Hospital Affiliated to Nanjing Medical University. All the subjects signed the informed consents. This study was conducted in accordance with the Declaration of Helsinki. Great efforts were made to minimize the animals and their pains. The code of ethics for this study followed the guidelines for the care and use of laboratory animals (NIH Pub. No. 85–23, revised 1996) compiled by the National Institutes of Health of the United States.
Patients and Samples
From January 2014 to January 2017, 68 pairs of glioma tissues and paracancerous tissues (peritumoral tissue within 2 cm from the tumor edge) were collected from the glioma patients (46 males and 22 females, aged between 24 and 72 years) who received the first surgical resection in Jinling Hospital. In addition, according to the World Health Organization (WHO) classification of tumors in CNS in 2007, there were 29 cases of low-grade glioma (I–II) and 39 cases of high-grade glioma (III–IV). The gliomas and paracancerous tissues were collected and stored at −80°C. Inclusion criteria were as follows: (1) all patients were hospitalized for the first time, without any radiotherapy, chemotherapy or immunotherapy before the operation; (2) patients were free of tumors and metastasis in other parts; (3) all cases were performed by the same group of neurosurgeons under the microscope; (4) tumor tissue was confirmed as glioma by pathology after the operation; (5) clinical data of all specimens were detailed and complete.
Immunohistochemistry
Tim-1 expression in human glioma tissues was analyzed by an EnVisionTM immunohistochemistry assay. Tumor tissues were embedded in paraffin and sectioned at 3 μm, and then tissue sections were dewaxed in xylene and dehydrated in gradient alcohol. Next, sections were heated in 100°C citrate solution (10 mM, pH 6.0) for 35 minutes for antigen extraction. After incubation for 30 minutes in 3% hydrogen peroxide solution to block endogenous peroxidase activity, sections were rinsed three times in phosphate buffer saline (PBS) and cultured with Tim-1 antibody (10 µg/mL, ab47635) at 4°C overnight. Subsequently, tissue sections were cultured for 30 minutes with goat anti-rabbit immunoglobulin G (IgG) H&L horseradish peroxidase (HRP) (1:2000, ab205718). Afterwards, sections were dyed with diaminobenzene and nuclei were stained with hematoxylin and eosin. Finally, tissue sections were dehydrated, cleared and mounted. The positive cells were represented as brown or light brown particles in the cytoplasm or the nucleus.
Immunofluorescence Double Staining
Glioma tissue sections were dewaxed, hydrated, antigen repaired and circled. Next, sections were cultured with bovine serum albumin (G5001, Wuhan Servicebio Co., Ltd., Wuhan, Hubei, China) after adding spontaneous fluorescence quenching agent for 5 minutes. Sections were cultured with primary antibody glial fibrillary acidic protein (GFAP) (1:500, GB12096, Servicebio), Tim-1 (3 µg/mL, ab47635, Abcam) in a wet box at 4°C overnight, and incubated with different fluorescent secondary goat anti-mouse antibodies CY3-labeled IgG (GB21301, Servicebio) and Alexa 488-labeled IgG (GB25303, Servicebio) in the dark for 50 minutes. The nuclei were stained with 4, 6-diamidino-2-phenylindole (DAPI) in dark. Finally, sections were mounted with an anti-fluorescence quenching agent (G1401, Servicebio) and observed and photographed under a fluorescence inverted microscope (Zeiss, Germany). The DAPI-stained nuclei were blue, the normal astrocytes stained by GFAP were green, and Tim-1 positive cells were stained in red.
Cell Culture
Human glioma cell lines (U87, the STR analysis of U87 cells was in the Supplementary information S1, U251, U343 and LN229) and human brain glial cells HEB were purchased from FuHeng Cell Cente (Shanghai, China) and cultivated in Dulbecco’s modified Eagle’s medium (DMEM; Invitrogen, Carlsbad, CA, USA) with heat-inactivated 10% fetal bovine serum (FBS; Sigma, St Louis, MO, USA) and 1% penicillin/streptomycin (Sigma) at 37°C with 5% CO2.
RNAi Lentivirus Infection
Small hairpin RNA (shRNA) targeting human Tim-1 (NM_012206.2; GenBank) was constructed. The forward sequence of sh-Tim-1 was 5ʹ-gatccACGACTGTTCTGACGACAATGTTCAAGAGACATTGTCGTCAGAACAGTCGTTTTTTTg-3ʹ, and the reverse sequence was 5ʹ-aattcAAAAAAACGACTGTTCTGACGACAATGTCTCTTGAACATTGTCGTCAGAACAGTCGTg-3ʹ, which were obtained from Shanghai Generay Biotech Co., Ltd. (Shanghai, China) and cloned into a lentiviral vector pLVX-Tim-1-shRNA. The recombinant Tim-1-targeting lentivirus (Tim-1-shRNA virus) and control mock lentivirus (sh-NC virus) were transfected into U251 or U87 cells.
Reverse Transcription Quantitative Polymerase Chain Reaction (RT-qPCR)
Total RNA of cells was extracted by TRIzol methods (Invitrogen). The RNA concentration and purity were determined using ultramicro spectrophotometer (Shanghai Puyuan Instrument Co., Ltd., Shanghai, China). After reverse transcription of 1 μg RNA into cDNA with a reverse transcription kit (Thermo Fisher Scientific, Rockford, IL, USA), mRNA expression was calculated by real-time fluorescence qPCR with GAPDH as loading controls by 2−ΔΔCT method.22 All primers (Table 1) were designed and synthesized by Sangon Biotech Co., Ltd. (Shanghai, China).
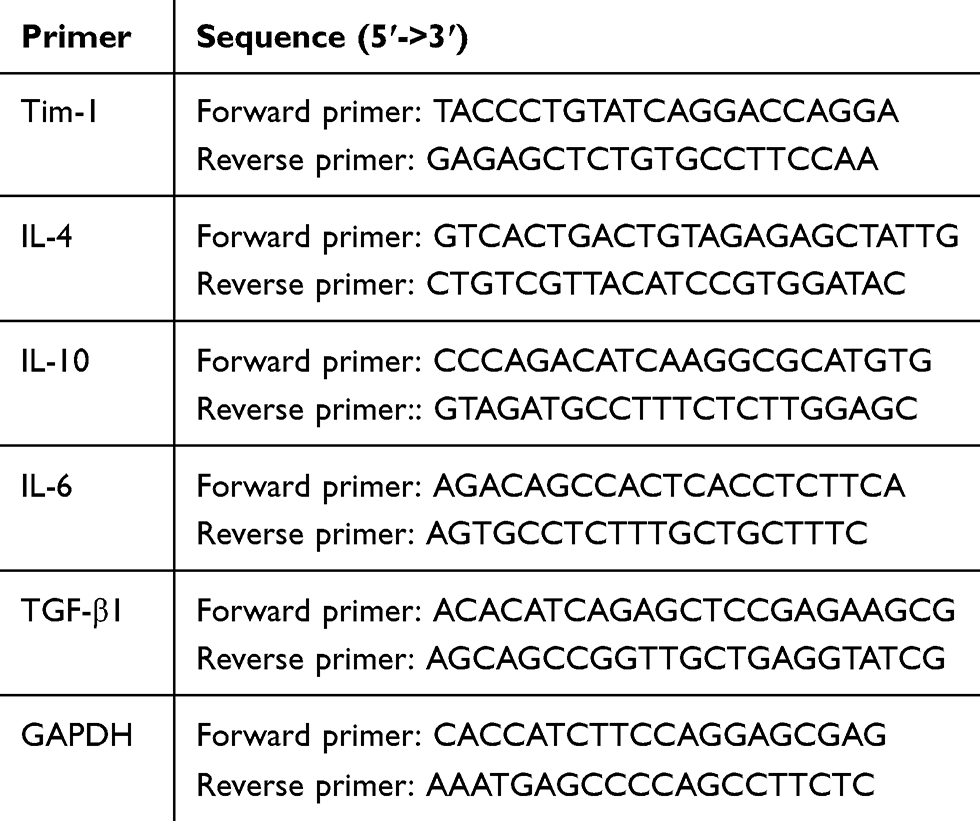 |
Table 1 Primer Sequences for RT-PCR |
Western Blot Analysis
Following total protein extraction with radio-immunoprecipitation assay buffer, samples (35 μg) were loaded after protein concentration measurement by a bicinchoninic acid (BCA) kit (Thermo). Then, proteins were run on electrophoresis and transferred to polyvinylidene difluoride membranes. Subsequently, membranes were mounted with 5% skim milk for 1 hour and probed with primary antibodies against Tim-1 (2 µg/mL, ab47635, Abcam Inc., Cambridge, MA, USA), p-PI3K (1:1000, ab182651), PI3K (1:1000, ab32089), p-AKT (1:1000, ab38449) and AKT (2 µg/mL, ab18785) at 4°C overnight. After washes with Tris buffered saline with Tween 20, membranes were probed with HRP-conjugated anti-mouse secondary antibodies for 1 hour. Finally, protein bands were processed with an enhanced chemiluminescence system (Thermo). The band intensity was quantified with Image-Pro Plus 6.0 software (Olympus Optical Co., Ltd, Tokyo, Japan).
Cell Counting Kit-8 (CCK-8) Assay
With three duplicated wells set, cells were planted in 96-well plates at 2 × 10⁴ cells/mL. After cell adherence, cell transfection was performed as the corresponding grouping. When culturing for 0, 24, 48 and 72 hours, 10 μL CCK8 solution (Beijing Wobisen Biotechnology Co., Ltd., Beijing, China) was placed into each well, and cells were cultivated for 4 hours, followed by medium removal and addition of 100 µL formazan solution in each well. The optical density at 450 nm was measured by a microplate reader (Bio-Rad, Inc., Hercules, CA, USA).
Cell Cycle Analysis
Glioma cells were collected 72 hours after transfection, fixed overnight with 80% ethanol, and stained with propidium iodide (50 μg/mL, BD Biosciences, Franklin Lakes, NJ, USA) for 30 minutes. The ratio of cells in each cycle was determined with FACS Calibur system (BD Biosciences).
Enzyme-Linked Immunosorbent Assay (ELISA)
After culturing for 24 hours, cells were centrifuged at 500 g for 5 minutes with the supernatant collected. Cell protein was extracted after lysis of pelleted cells, and protein concentration was detected by BCA kit. Following centrifugation, the concentrations of transforming growth factor β1 (TGF-β1), interleukin (IL)-6, IL-4 and IL-10 in supernatant were determined using ELISA kits (Beyotime Biotechnology Co., Ltd, Shanghai, China). The ratio of the measured concentration to the total protein concentration was used to evaluate the expression changes after normalization.
Transwell Assay
Regarding invasion experiment, 10,000 cells in the sera-free media were plated into each upper chamber pre-coated with 50 mg/L Matrigel, while culture media were filled in each lower chamber. After culturing for 1 day, cells were stained by 0.1% crystal violet (Shanghai Yiyan biological technology Co., Ltd., Shanghai, China).
Wound Healing Test
Cells were planted in 6-well plates overnight till confluence. After culturing for 1 day, cells with monolayer were linearly scratched using a 200-μL pipette, and then cells were washed twice with PBS to remove cell debris and incubated in DMEM with 2.5% fetal bovine serum. After that, scratched region was photographed as soon or 24 hours later using a microscope (Nikon, Tokyo, Japan). The resulting images were analyzed using ImageJ software.
Agilent Microarray Analysis
The purified RNA was labeled and hybridized to the Agilent Human Gene Expression Analysis platform (8*60K, 039494, Oebiotech Co., Ltd., Shanghai, China). The threshold of differential expression genes (DEGs) was set as fold change ≥2.0. After that, Gene Ontology (GO) and Kyoto Encyclopedia of Genes and Genomes (KEGG) analyses were performed to study the roles of these DEGs.
Tumor Xenograft in Nude Mice
Specific pathogen-free BALB/c nude mice (4–6 weeks old) from Jinling Hospital Affiliated to Nanjing Medical University were assigned into sh-NC group and sh-Tim-1 group. Five nude mice in the sh-NC group were subcutaneously injected with 5 × 10⁶ U87 cells suspended in 80 μL PBS, and five nude mice in the sh-Tim-1 group were subcutaneously injected with 5 × 10⁶ sh-Tim-1-treated U87 cells suspended in 80 μL PBS. When the tumors reached a touchable size on the 5th day, the tumor volume was recorded every 5 days and calculated as: volume (mm3) = (length × width2)/2. After recording for 25 days, mice were euthanized by intraperitoneal injection of excessive pentobarbital sodium. Briefly, after pentobarbital sodium injection, abdominal contraction and hind leg extension occurred in mice, which means euthanasia was successful.23,24 Then, tumors were carefully removed and weighed for immunohistochemistry staining. Ki67 (5 μg/mL, ab15580) expression was detected.
Statistical Analysis
SPSS 21.0 software (IBM Corp. Armonk, New York, USA) was applied for data processing. The Kolmogorov–Smirnov test checked whether data were in normal distribution. Measurement data are presented as mean ± standard deviation. Comparisons between two groups were processed by the t-test and comparisons among multi-groups were processed by one-way or two-way analysis of variance (ANOVA), followed by Tukey’s multiple comparisons test. Kaplan-Meier method was used for survival analysis. The p value was calculated using a two-tailed test and p < 0.05 indicated a significant difference.
Result
Tim-1 is Upregulated in Glioma and Associated with Poor Prognosis
Biology website http://gepia.cancer-pku.cn/predicted that the 5-year survival rate of patients with high Tim-1 expression was lower than that of patients with low Tim-1 expression in GBM/LGG (p < 0.05) (Figure 1A). To understand Tim-1 expression in glioma patients, the basic clinicopathological information and tissue samples of glioma patients were collected, and Tim-1 expression in tissue samples was measured. Tim-1 expression was upregulated in gliomas relative to paracancerous tissues (Figure 1B). According to the mean value of Tim-125 measured by RT-qPCR, glioma patients were classified into two groups: the group with relatively low Tim-1 expression (n = 37) and with relatively high Tim-1 expression (n = 31), to analyze the relationship between Tim-1 expression and clinical pathology. A positive correlation was discovered between Tim-1 expression and WHO grade of glioma patients (p < 0.05), but no other clinicopathological parameters (including gender, age and tumor diameter) (Supplementary Table S1). Kaplan-Meier method (Figure 1E) found that patients with relatively low Tim-1 expression had longer overall survival, which was consistent with TCGA prediction. In addition, immunohistochemical staining (Figure 1C) and immunofluorescence staining (Figure 1D) indicated the Tim-1 positive expression in glioma tissues was higher than that in paracancerous tissues. Compared with that in normal human brain glial cells HEB, Tim-1 level in glioma cell lines was increased (p < 0.01) (Figure 1F and G). In conclusion, Tim-1 expression in glioma tissues and glioma cell lines was upregulated and was correlated with poor prognosis.
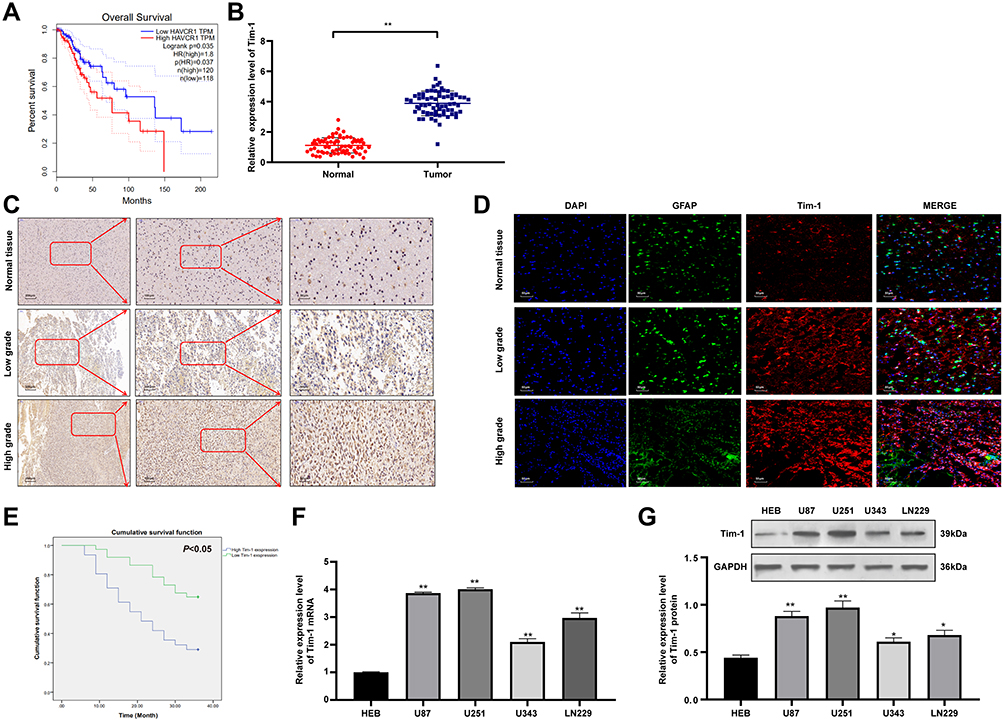 |
Figure 1 Tim-1 is upregulated in glioma and associated with poor prognosis. (A), the biology website http://gepia.cancer-pku.cn/predicted that the 5-year survival rate of patients with high expression of Tim-1 in GBM/LGG was lower than that of patients with low expression of Tim-1; (B), Tim-1 expression in glioma and paracancerous tissues detected by RT-qPCR (n = 68); (C), the positive expression of Tim-1 detected by immunohistochemistry (n = 3); (D), the positive expression of Tim-1 detected by immunofluorescence (n = 3); (E), Kaplan-Meier method was used for survival analysis in glioma patients with low Tim-1 expression (n = 37) and those with high Tim-1 expression (n = 31); (F/G), Tim-1 levels in glioma cell lines and HEB cells detected with RT-qPCR and Western blot analysis. *p < 0.05, **p < 0.01. Data in panel B were analyzed by the t-test, and data in panels F and G were processed with one-way ANOVA, followed by Tukey’s multiple comparisons test. |
Knockdown of Tim-1 Inhibits Malignant Behaviors of Glioma Cells
Knockdown of Tim-1 prevents the proliferation and invasion of gastric adenocarcinoma cells.26 Therefore, we speculated that Tim-1 might also have an impact on the growth of glioma. To confirm this conjecture, we designed three shRNAs of Tim-1 and, respectively, transfected them into U251 cells. The transfection efficiency of the three shRNAs of Tim-1 was verified by RT-qPCR and Western blot analysis. It was showed that the transfection efficiency of sh-Tim-1-1 (sh-Tim-1 in the study) and sh-Tim-1-2 were higher than that of sh-Tim-1-3. Then, CCK-8 and flow cytometry were used to detect the effects of sh-Tim-1 and sh-Tim-1-2 on the proliferation of U251 cells. The results showed that sh-Tim-1-1 (sh-Tim-1 in the study) had a better inhibitory effect on the proliferation of U251 cells than sh-Tim-1-2 (Supplementary Fig S1 A-D). Therefore, we selected sh-Tim-1-1 with a better interference effect for subsequent experiments. We knocked down Tim-1 expression in U251 cells and U87 cells with relatively high Tim-1 expression and confirmed the transfection (Figure 2A and B).
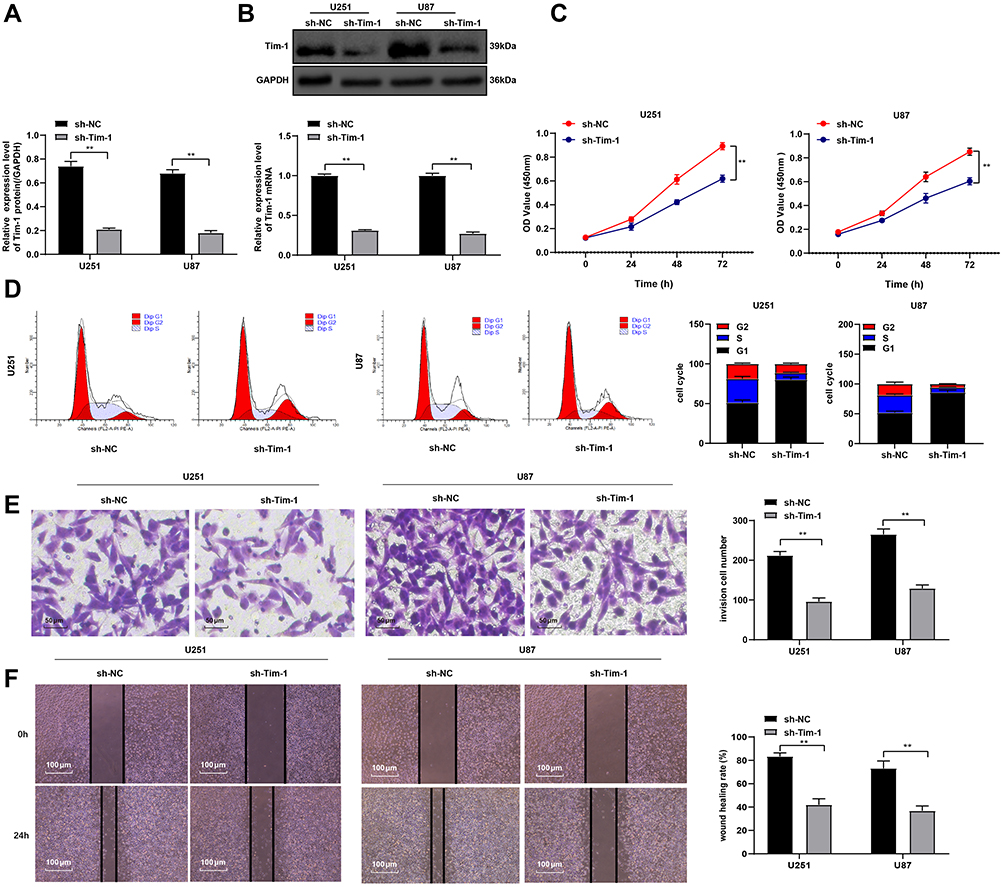 |
Figure 2 Knockdown of Tim-1 inhibits malignant behaviors of glioma cells. (A and B), Tim-1 levels in glioma cells after Tim-1 was knocked down detected by RT-qPCR and Western blot analysis; (C), OD values in U87 and U251 cells detected by CCK-8 assay; (D), cell cycle detected by flow cytometry; (E), cell invasion detected by Transwell assay. (F), cell migration detected by wound healing test. **p < 0.01. Replicates = 3. Data in panels (A and B), (E and F) were processed with two-way ANOVA, and data in panel (D) were processed with one-way ANOVA, followed by Tukey’s multiple comparisons test. |
CCK-8 assay, flow cytometry, Transwell assay, and wound healing test measured U251 and U87 cell proliferation, cell cycle, invasion and migration, respectively, after Tim-1 knockdown. The results displayed that U251 and U87 cell proliferation (Figure 2C), invasion (Figure 2E) and migration (Figure 2F) were notably lower than those of control cells after knocking down Tim-1, and more cells were arrested in G1 stage (Figure 2D) (all p < 0.01). In conclusion, Tim-1 knockdown can inhibit glioma cell malignant behaviors.
Tim-1 Regulates the Level of Cytokines
Blocking Tim-1 has been reported to inhibit immune rejection.27 Downregulating TGF-β1 can reduce the invasion ability of glioma cells.28 Through the bioinformatics website (https://string-db.org/cgi/input.pl? Sessionid), we found protein interactions between Tim-1 and cytokines IL-6, IL-4 and IL-10 (Figure 3A), so we speculated that Tim-1 could affect TGF-β1 expression and cytokine secretion in glioma cells. To confirm this conjecture, the levels of TGF-β1 and IL-6, IL-4 and IL-10 in glioma after Tim-1 knockdown were detected. As expected, TGF-β1, IL-6, IL-10 and IL-4 were lowly expressed in U87 and U251 cells after Tim-1 knockdown (all p < 0.01) (Figure 3B and C).
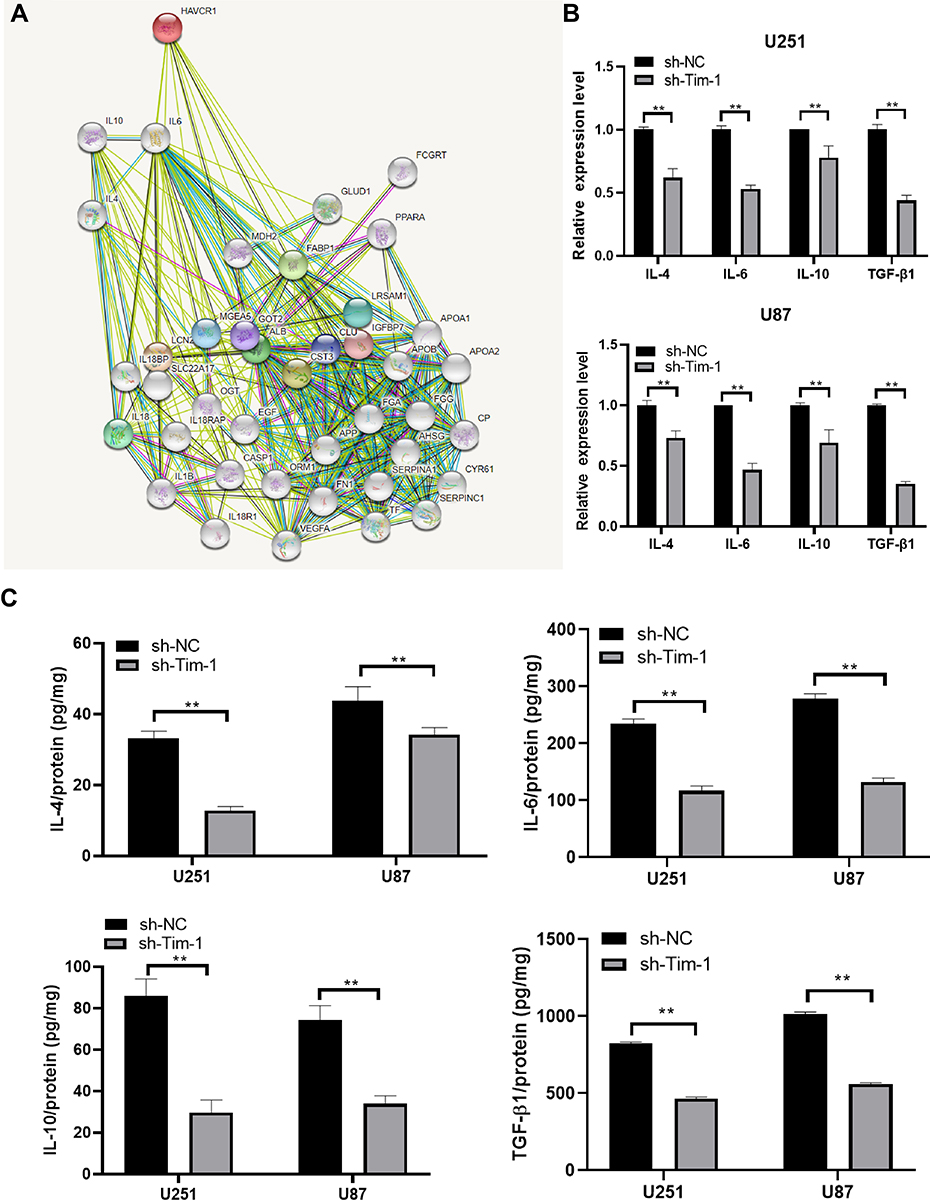 |
Figure 3 Tim-1 regulates the level of cytokines. (A), through the bioinformatics website (https://string-db.org/cgi/input.pl? Sessionid), we found that Tim-1 (also known as HAVCR1), IL-6, IL-4 and IL-10 were correlated; (B), TGF-β1, IL-6, IL-4 and IL-10 detected by RT-qPCR after Tim-1 knockdown; (C), TGF-β1, IL-6, IL-4 and IL-10 measured by ELISA kits. **p < 0.01. Replicates = 3. Data were processed with two-way ANOVA, followed by Tukey’s multiple comparisons test. |
Downregulation of Tim-1 Inactivates the PI3K/AKT Pathway
From the above analyses, we knew that Tim-1 inhibited the malignant biological behaviors of glioma. However, we do not know via which mechanism Tim-1 affects glioma. Based on this, Agilent microarray analysis was performed to analyze the DEGs between sh-NC group and sh-Tim-1 group. As shown in Figure 4A, many DEGs were found. After that, the enrichment analysis of KEGG and GO (Figure 4B) on DEGs showed many enriched terms, including the PI3K/AKT pathway. As recently reported, activation of PI3K/Akt signaling pathway can promote malignant biological behaviors of glioma.22 Therefore, we speculated the PI3K/AKT pathway may be the downstream factor involved in Tim-1 mechanism in glioma. After that, Western blot analysis (Figure 4C) showed that after knocking down Tim-1 expression, p-PI3K/P13K and p-AKT/AKT were reduced (all p < 0.01).
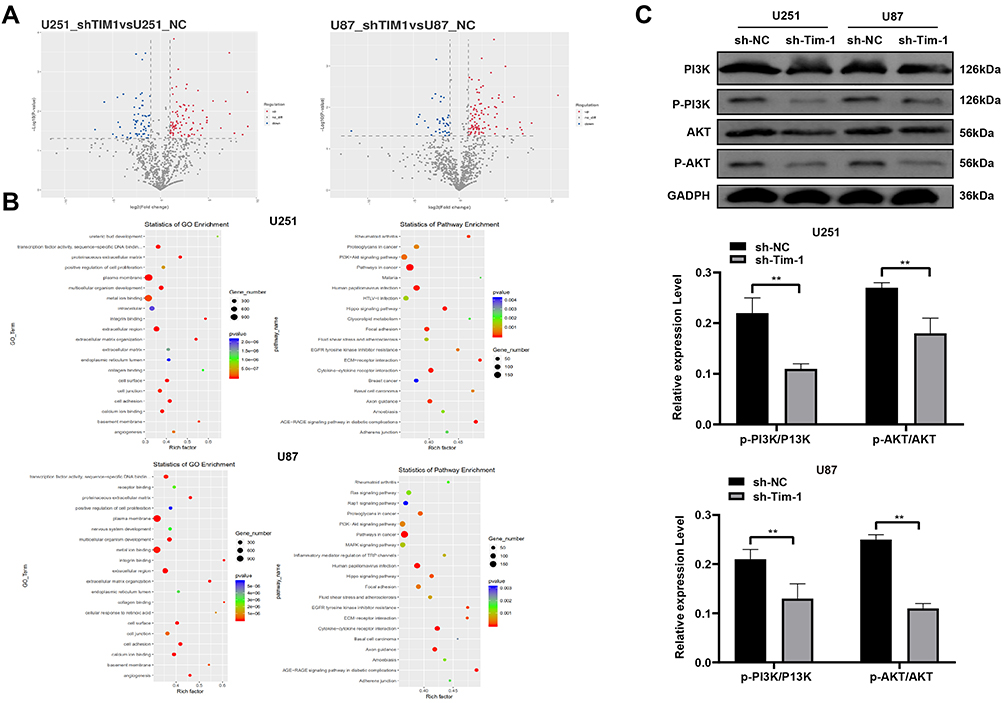 |
Figure 4 Tim-1 downregulation inactivates the PI3K/AKT pathway. (A), the volcano plot of DEGs; (B), enrichment analysis of KEGG and GO of differentially expressed terms; (C), Western blot analysis detected the PI3K/AKT pathway-related proteins in cells after Tim-1 knockdown. **p < 0.01. Replicates = 3. Data in panel (C) were processed with two-way ANOVA, followed by Tukey’s multiple comparisons test. |
Activation of PI3K/AKT Pathway Partially Reverses the Inhibition of sh-Tim-1 on the Biological Behaviors of Glioma Cells
To determine whether Tim-1 affects biological behaviors of glioma via the PI3K/AKT axis, the PI3K/AKT pathway activator SC79 and knockdown Tim-1 were imposed together in cells. The functional rescue experiments were carried out and cells were allocated into the sh-Tim-1 and sh-Tim-1 + SC79 group. Compared with pure Tim-1 knockdown, SC79 plus Tim-1 knockdown presented with longer S stage and promoted proliferation, invasion and migration (Figure 5AD). Additionally, ELISA kits detected the cytokines and unveiled that relative to pure Tim-1 knockdown, SC79 plus Tim-1 knockdown presented with increases in TGF-β1, IL-6, IL-4 and IL-10 levels (Figure 5E) (all p < 0.05).
 |
Figure 5 Activation of PI3K/AKT pathway partially reverses the inhibition of sh-Tim-1 on the biological behaviors of glioma cells (A). OD values at 0 h, 24 h, 4872 h detected by CCK-8 method; (B), cell cycle detected by flow cytometry; (C), Transwell assay detected cell invasion after Tim-1 knockdown; (D), wound healing assay detected cell migration after Tim-1 knockdown; (E), TGF-β1, IL-6, IL-4 and IL-10 measured by ELISA kits. Replicates = 3. Data in panels (A and B), (CE) were processed with two-way ANOVA, followed by Tukey’s multiple comparisons test. *p < 0.05, **p < 0.01. |
Knockdown of Tim-1 Inhibits Glioma Growth in vivo
To further evaluate Tim-1 effect on glioma, we conducted in vivo experiments. U87 cells with knockdown Tim-1 were transplanted into nude mice, and the volume and weight of tumors were calculated. The results revealed that the volume and weight of tumors with knocking down Tim-1 were notably lower than those of tumors in control mice (p < 0.01) (Figure 6AC). Ki67 is a nuclear antigen related to proliferating cells, which can determine the cell proliferation in tumors. Immunohistochemistry staining of Ki67 discovered that Ki67-positive rate in tumors with knocking down Tim-1 was markedly lower than that in tumors in control mice (p < 0.01) (Figure 6D).
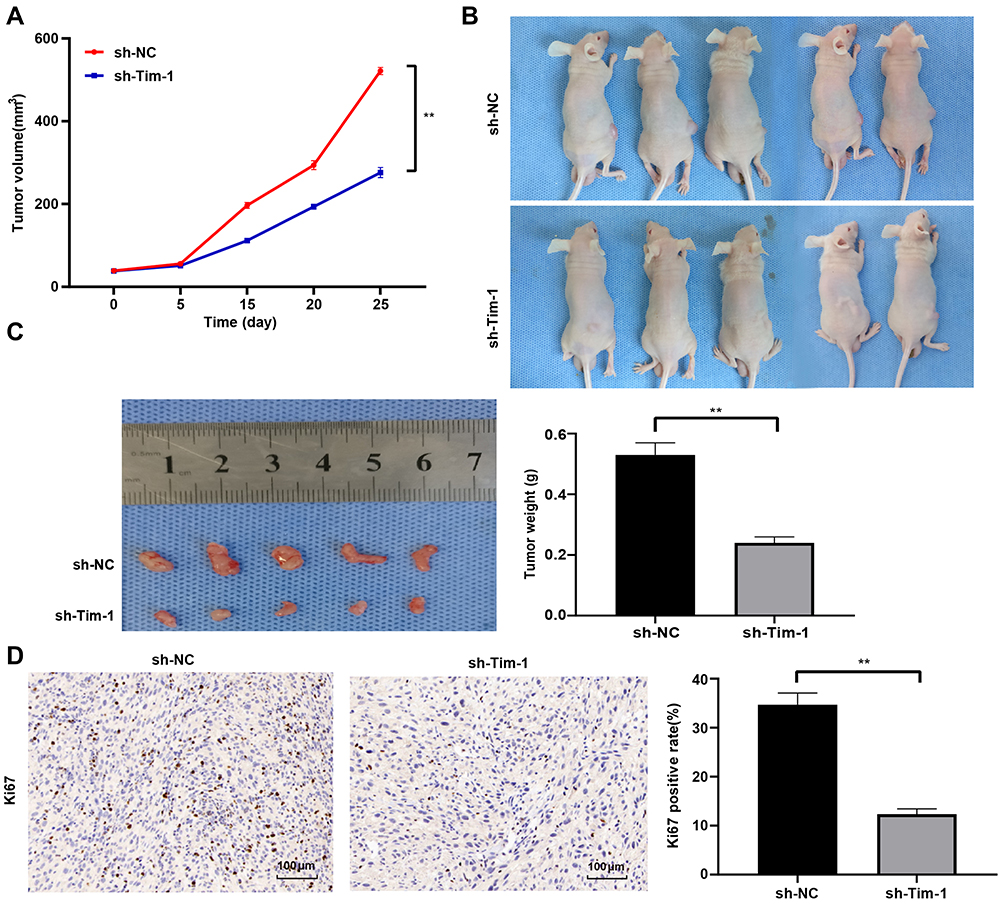 |
Figure 6 Knockdown of Tim-1 inhibits glioma growth in vivo. (A), tumor volume measured at day 5, 10, 15, 20 and 25 (n = 5); (B and C), tumor weight measured at day 25 (n = 5); (D), Ki67-positive rate in tumors detected by immunohistochemistry staining (n = 5). **p < 0.01. Data in panel A were processed with two-way ANOVA, and data in panels (C and D) were processed with the t-test, followed by Tukey’s multiple comparisons test. |
Discussion
Tim-1 expression and regulatory mechanism in glioma were evaluated. In vitro, Tim-1 silencing in U87 and U251 cells impaired cellular biological functions and improved the microenvironment. In vivo (Figure 7), knocking down Tim-1 inhibited glioma growth in nude mice. Collectively, we provided a novel mechanism of the involvement of Tim-1 in glioma development.
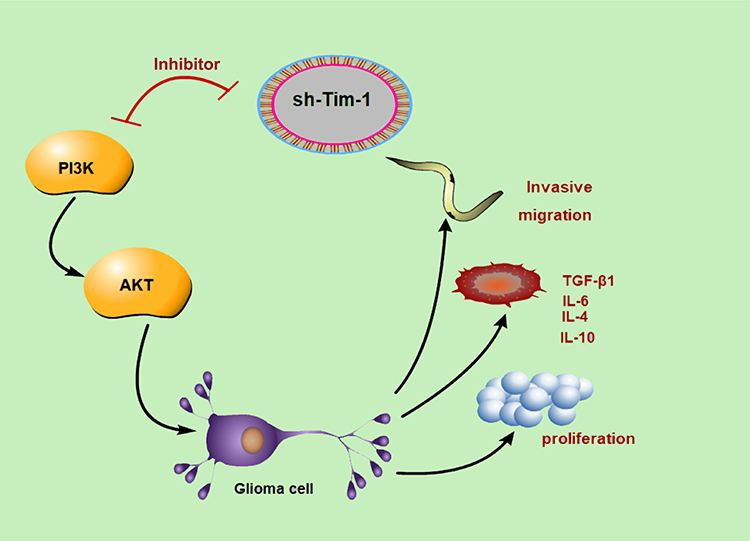 |
Figure 7 Tim-1 knockdown inhibits biological behaviors of glioma cells, reduces the production of cytokines (TGF-β1, IL-6, IL-4 and IL-10), and improves the microenvironment through the PI3K/AKT pathway. The red symbol of PI3K and sh-Tim-1 indicated that sh-Tim-1 inhibited the activation of PI3K. |
Tim-1 exerts function in modulating T cell function, and there are also reports showing an association between the Tim family and autoimmunity, as well as allergic diseases.11 Studies have identified that Tim-1 is expressed in many human tumor tissues.19,20,29,30 Tim-1 is presented in cancer cells, in CD68-positive macrophages and CK-18-positive epithelial cells29 in human Langerhans cell sarcoma. Liu et al30 have revealed Tim-1 levels in human gastric cancer tissues are upregulated, indicating the prognostic application of Tim-1 in gastric cancer patients. In addition, Tim-1 is presented in the urine of some lung cancer patients, and Tim-1 expression is correlated with tumor characteristics.31 Similarly, a previous study confirmed the presence of Tim-3 in glioblastoma multiforme, provided preclinical evidence for a new treatment to prolong the survival of glioblastoma patients.32 At present, we initially disclosed that Tim-1 expression was elevated in glioma tissues and cell lines and was associated with poor prognosis, highlighting that Tim-1 upregulation may lead to malignant progression of glioma.
To assess the underlying mechanism of Tim-1 in glioma, we did in vitro experiments on the effect of Tim-1 silencing on cellular biological functions of glioma cells. Our data showed that Tim-1 knockdown impaired proliferation, migration and invasion of U87 and U251 cells, suggesting that Tim-1 has functions in promoting growth and metastasis of glioma. The inhibitory effects of Tim-1 knockdown on cell malignant behaviors were observed in other types of cancers. Zheng et al found down-regulation of Tim-1 caused by RNA interference could block cellular events of NSCLC cells.20 Accordingly, Tim-1 is an underlying therapeutic target for human cancers.
Tim-1 blockade could prevent immunological rejection and prolong the survival of corneal allograft through regulating T cell responses.27 As expected, TGF-β1, IL-6, IL-10 and IL-4 were lowly expressed in U87 and U251 cells after Tim-1 knockdown. TGF-β and IL-10 are commonly studied cytokines which have immunosuppressive effects to trigger tumor progression.33 The ratio of TGF-β1-immunopositive tumor cells in glioma cells is notably higher than in the control cells.34 TGF-β1 downregulation decreases the invasive ability of glioma cells.28 Over 3-fold increases in IL-6, IL-1β, TNF-α and IL-10 are involved in brain tumor progression and aggressiveness.35 Tim-1, expressed by IL-10-expressing regulatory B cells monitors immune responses and CD4+ T cell effector differentiation.10 Tim-1 is linked with IL-10 production in primary central nervous system lymphoma.36 Taken together, knockdown of Tim-1 affects the expression of the cytokines in glioma cells.
Moreover, the enrichment analysis showed the differential expression of the PI3K/AKT pathway, and downregulation of Tim-1 inactivated the PI3K/AKT pathway in glioma cells. The activation of PI3K/Akt/mTOR pathway contributes to the tumorigenesis and therapy resistance in glioma.21 Glioblastoma patients with activated PI3K/AKT/mTOR axis show poor prognosis.37 FN1 promotes glioma growth by activating the PI3K/AKT axis.22 A recent study has also verified that PI3K/AKT axis is involved in the Tim-1-mediation of cellular functions in NSCLC cells.20 Furthermore, we used an activator SC97 of the PI3K/AKT pathway to identify its molecular mechanism in glioma. When SC79 was combined with knockdown Tim-1, the malignant behaviors and the secretion levels of cytokines in glioma cells were significantly increased. Activation of PI3K/AKT pathway partially reverses the inhibition of Tim-1 knockdown on the biological behaviors of glioma cells. The PI3K/AKT pathway elevates IL-1β and IL-6 production in keratinocytes.38 TGF-β1 activates the PI3K/AKT axis to induce the metastasis and metabolic reprogramming of glioma cells.39 Propofol treatment inhibits cell invasion in glioma through the inactivation of the PI3K/AKT pathway.40 However, there are little researches on the interaction between Tim-1 and the PI3K/AKT axis in glioma, which proved the novelty of our study to some degree.
In conclusion, our results suggested that abnormal expression of Tim-1 was closely related to the development of human glioma by regulating the PI3K/AKT pathway. Tim-1 can not only affect the production of cytokines in immune cells to regulate tumor progression but also directly regulate tumor cell functions. Tim-1 may be a potential therapeutic target for cancers including glioma. However, we have not made a further study on the association between Tim-1 and immunology in glioma and on the cascade relationship between Tim-1 and PI3K/Akt due to limitations of experimental funding and experimental conditions the mechanism of action of Tim-1 on the PI3K/Akt cascade. We suppose there may be a transitional factor between Tim-1 and the PI3K/Akt cascade in regulating glioma development. In the future research, we will focus on an in-depth and comprehensive exploration of this point.
Data Sharing Statement
All the data generated or analyzed during this study are included in this published article.
Disclosure
The authors declare no conflicts of interest in this work.
References
1. Aldape K, Brindle KM, Chesler L, et al. Challenges to curing primary brain tumours. Nat Rev Clin Oncol. 2019;16(8):509–520. doi:10.1038/s41571-019-0177-5
2. Stupp R, Lukas RV, Hegi ME. Improving survival in molecularly selected glioblastoma. Lancet. 2019;393(10172):615–617. doi:10.1016/S0140-6736(18)33211-2
3. Baratta MG. Glioblastoma is ‘hot’ for personalized vaccines. Nat Rev Cancer. 2019;19(3):129. doi:10.1038/s41568-019-0118-8
4. Ito H, Nakashima H, Chiocca EA. Molecular responses to immune checkpoint blockade in glioblastoma. Nat Med. 2019;25(3):359–361. doi:10.1038/s41591-019-0385-7
5. Crunkhorn S. Targeting cancer cell metabolism in glioblastoma. Nat Rev Cancer. 2019;19(5):250. doi:10.1038/s41568-019-0139-3
6. IDH inhibitors target common glioma mutation. Cancer Discov. 2019;9(8):992. doi:10.1158/2159-8290.CD-ND2019-007
7. Weller M, Le Rhun E. Immunotherapy for glioblastoma: quo vadis? Nat Rev Clin Oncol. 2019;16(7):405–406. doi:10.1038/s41571-019-0195-3
8. Kaplan G, Totsuka A, Thompson P, Akatsuka T, Moritsugu Y, Feinstone SM. Identification of a surface glycoprotein on African green monkey kidney cells as a receptor for hepatitis A virus. EMBO J. 1996;15(16):4282–4296. doi:10.1002/j.1460-2075.1996.tb00803.x
9. Angiari S, Donnarumma T, Rossi B, et al. TIM-1 glycoprotein binds the adhesion receptor P-selectin and mediates T cell trafficking during inflammation and autoimmunity. Immunity. 2014;40(4):542–553. doi:10.1016/j.immuni.2014.03.004
10. Ding Q, Yeung M, Camirand G, et al. Regulatory B cells are identified by expression of TIM-1 and can be induced through TIM-1 ligation to promote tolerance in mice. J Clin Invest. 2011;121(9):3645–3656. doi:10.1172/JCI46274
11. Kobayashi N, Karisola P, Pena-Cruz V, et al. TIM-1 and TIM-4 glycoproteins bind phosphatidylserine and mediate uptake of apoptotic cells. Immunity. 2007;27(6):927–940. doi:10.1016/j.immuni.2007.11.011
12. Meyers JH, Chakravarti S, Schlesinger D, et al. TIM-4 is the ligand for TIM-1, and the TIM-1-TIM-4 interaction regulates T cell proliferation. Nat Immunol. 2005;6(5):455–464. doi:10.1038/ni1185
13. Miyanishi M, Tada K, Koike M, Uchiyama Y, Kitamura T, Nagata S. Identification of Tim4 as a phosphatidylserine receptor. Nature. 2007;450(7168):435–439. doi:10.1038/nature06307
14. Nakae S, Iikura M, Suto H, et al. TIM-1 and TIM-3 enhancement of Th2 cytokine production by mast cells. Blood. 2007;110(7):2565–2568. doi:10.1182/blood-2006-11-058800
15. Rodriguez-Manzanet R, DeKruyff R, Kuchroo VK, Umetsu DT. The costimulatory role of TIM molecules. Immunol Rev. 2009;229(1):259–270. doi:10.1111/j.1600-065X.2009.00772.x
16. Ueno T, Habicht A, Clarkson MR, et al. The emerging role of T cell Ig mucin 1 in alloimmune responses in an experimental mouse transplant model. J Clin Invest. 2008;118(2):742–751. doi:10.1172/JCI32451
17. Umetsu SE, Lee WL, McIntire JJ, et al. TIM-1 induces T cell activation and inhibits the development of peripheral tolerance. Nat Immunol. 2005;6(5):447–454. doi:10.1038/ni1186
18. Du P, Xiong R, Li X, Jiang J. Immune regulation and antitumor effect of TIM-1. J Immunol Res. 2016;2016:8605134. doi:10.1155/2016/8605134
19. Wang H, Zhang X, Sun W, et al. Activation of TIM1 induces colon cancer cell apoptosis via modulating Fas ligand expression. Biochem Biophys Res Commun. 2016;473(2):377–381. doi:10.1016/j.bbrc.2016.02.085
20. Zheng X, Xu K, Chen L, Zhou Y, Jiang J. Prognostic value of TIM-1 expression in human non-small-cell lung cancer. J Transl Med. 2019;17(1):178. doi:10.1186/s12967-019-1931-2
21. Li X, Wu C, Chen N, et al. PI3K/Akt/mTOR signaling pathway and targeted therapy for glioblastoma. Oncotarget. 2016;7(22):33440–33450. doi:10.18632/oncotarget.7961
22. Liao YX, Zhang ZP, Zhao J, Liu JP. Effects of fibronectin 1 on cell proliferation, senescence and apoptosis of human glioma cells through the PI3K/AKT signaling pathway. Cell Physiol Biochem. 2018;48(3):1382–1396. doi:10.1159/000492096
23. Kopaladze RA. [Methods for the euthanasia of experimental animals–the ethics, esthetics and personnel safety]. Usp Fiziol Nauk. 2000;31(3):79–90.
24. Zatroch KK, Knight CG, Reimer JN, Pang DS. Refinement of intraperitoneal injection of sodium pentobarbital for euthanasia in laboratory rats (Rattus norvegicus). BMC Vet Res. 2017;13(1):60. doi:10.1186/s12917-017-0982-y
25. Wang K, Yang S, Gao Y, Zhang C, Sui Q. MicroRNA-769-3p inhibits tumor progression in glioma by suppressing ZEB2 and inhibiting the Wnt/beta-catenin signaling pathway. Oncol Lett. 2020;19(1):992–1000. doi:10.3892/ol.2019.11135
26. Xue J, Li Y, Yi J, Jiang H. HAVCR1 affects the MEK/ERK pathway in gastric adenocarcinomas and influences tumor progression and patient outcome. Gastroenterol Res Pract. 2019;2019:6746970. doi:10.1155/2019/6746970
27. Tan X, Jie Y, Zhang Y, Qin Y, Xu Q, Pan Z. Tim-1 blockade with RMT1-10 increases T regulatory cells and prolongs the survival of high-risk corneal allografts in mice. Exp Eye Res. 2014;122:86–93. doi:10.1016/j.exer.2014.02.019
28. Yang L, Liu M, Deng C, Gu Z, Gao Y. Expression of transforming growth factor-beta1 (TGF-beta1) and E-cadherin in glioma. Tumour Biol. 2012;33(5):1477–1484. doi:10.1007/s13277-012-0398-z
29. Li J, Cao D, Guo G, Wu Y, Chen Y. Expression and anatomical distribution of TIM-containing molecules in Langerhans cell sarcoma. J Mol Histol. 2013;44(2):213–220. doi:10.1007/s10735-012-9475-2
30. Liu L, Song Z, Zhao Y, et al. HAVCR1 expression might be a novel prognostic factor for gastric cancer. PLoS One. 2018;13(11):e0206423. doi:10.1371/journal.pone.0206423
31. Vila MR, Kaplan GG, Feigelstock D, et al. Hepatitis A virus receptor blocks cell differentiation and is overexpressed in clear cell renal cell carcinoma. Kidney Int. 2004;65(5):1761–1773. doi:10.1111/j.1523-1755.2004.00601.x
32. Kim JE, Patel MA, Mangraviti A, et al. Combination therapy with Anti-PD-1, Anti-TIM-3, and focal radiation results in regression of murine gliomas. Clin Cancer Res. 2017;23(1):124–136. doi:10.1158/1078-0432.CCR-15-1535
33. Sun LX, Lin ZB, Duan XS, et al. Suppression of the production of transforming growth factor beta1, interleukin-10, and vascular endothelial growth factor in the B16F10 cells by Ganoderma lucidum polysaccharides. J Interferon Cytokine Res. 2014;34(9):667–675. doi:10.1089/jir.2012.0101
34. Liubich LD, Kovalevska L, Lisyany MI, et al. TGF-beta1 expression by glioma C6 cells in vitro. Exp Oncol. 2017;39(4):258–263. doi:10.31768/2312-8852.2017.39(4):258-263
35. Albulescu R, Codrici E, Popescu ID, et al. Cytokine patterns in brain tumour progression. Mediators Inflamm. 2013;2013:979748. doi:10.1155/2013/979748
36. Kishimoto W, Nishikori M, Arima H, et al. Expression of Tim-1 in primary CNS lymphoma. Cancer Med. 2016;5(11):3235–3245. doi:10.1002/cam4.930
37. Chakravarti A, Zhai G, Suzuki Y, et al. The prognostic significance of phosphatidylinositol 3-kinase pathway activation in human gliomas. J Clin Oncol. 2004;22(10):1926–1933. doi:10.1200/JCO.2004.07.193
38. Kanda N, Kamata M, Tada Y, Ishikawa T, Sato S, Watanabe S. Human beta-defensin-2 enhances IFN-gamma and IL-10 production and suppresses IL-17 production in T cells. J Leukoc Biol. 2011;89(6):935–944. doi:10.1189/jlb.0111004
39. Rodriguez-Garcia A, Samso P, Fontova P, et al. TGF-beta1 targets Smad, p38 MAPK, and PI3K/Akt signaling pathways to induce PFKFB3 gene expression and glycolysis in glioblastoma cells. FEBS J. 2017;284(20):3437–3454. doi:10.1111/febs.14201
40. Wang D, Yang T, Liu J, et al. Propofol inhibits the migration and invasion of glioma cells by blocking the PI3K/AKT pathway through miR-206/ROCK1 Axis. Onco Targets Ther. 2020;13:361–370. doi:10.2147/OTT.S232601
 © 2020 The Author(s). This work is published and licensed by Dove Medical Press Limited. The full terms of this license are available at https://www.dovepress.com/terms.php and incorporate the Creative Commons Attribution - Non Commercial (unported, v3.0) License.
By accessing the work you hereby accept the Terms. Non-commercial uses of the work are permitted without any further permission from Dove Medical Press Limited, provided the work is properly attributed. For permission for commercial use of this work, please see paragraphs 4.2 and 5 of our Terms.
© 2020 The Author(s). This work is published and licensed by Dove Medical Press Limited. The full terms of this license are available at https://www.dovepress.com/terms.php and incorporate the Creative Commons Attribution - Non Commercial (unported, v3.0) License.
By accessing the work you hereby accept the Terms. Non-commercial uses of the work are permitted without any further permission from Dove Medical Press Limited, provided the work is properly attributed. For permission for commercial use of this work, please see paragraphs 4.2 and 5 of our Terms.