")
Back to Journals » OncoTargets and Therapy » Volume 12
Knockdown of SLC35F2 Inhibits the Proliferation and Metastasis of Bladder Cancer Cells
Authors Chen M , Gao X, Huang D , Wang S, Zheng L, Chen Y, Wen X, Gao Y, Cao H, Zhang S
Received 30 August 2019
Accepted for publication 19 November 2019
Published 10 December 2019 Volume 2019:12 Pages 10771—10786
DOI https://doi.org/10.2147/OTT.S229332
Checked for plagiarism Yes
Review by Single anonymous peer review
Peer reviewer comments 2
Editor who approved publication: Prof. Dr. Takuya Aoki
Mei Chen,1 Xin Gao,2 Denggao Huang,1 Shunlan Wang,1 Linlin Zheng,1 Yinyi Chen,3 Xiaohong Wen,1 Yuanhui Gao,1 Hui Cao,1 Shufang Zhang1
1Central Laboratory, Affiliated Haikou Hospital of Xiangya Medical College, Central South University, Haikou 570208, People’s Republic of China; 2Clinical Laboratory, The First People’s Hospital of Huaihua, Huaihua 418000, People’s Republic of China; 3Clinical Laboratory, The First Affiliated Hospital of University of South China, Hengyang 421001, People’s Republic of China
Correspondence: Shufang Zhang
Central Laboratory, Affiliated Haikou Hospital of Xiangya Medical College, Central South University, No.43 Renmin Avenue, Haikou City, Haikou Province 570208, People’s Republic of China
Email [email protected]
Background: Many studies have shown that solute carrier family 35 member F2 (SLC35F2) plays a key role in the biological processes of multiple cancers. However, there have been no reports on the role of SLC35F2 in the occurrence and development of bladder cancer (BC).
Methods: SLC35F2 expression data and clinical and prognostic information from BC patients were obtained from databases. SLC35F2 expression in BC was verified by quantitative real-time PCR (qRT-PCR). The influence of SLC35F2 knockdown on the proliferation, apoptosis, migration and invasion in the 5637 and T24 cell lines was studied, and tumor formation experiments were performed in nude mice. Gene set enrichment analysis (GSEA) was used to predict the pathways and functions of SLC35F2 in BC.
Results: SLC35F2 was highly expressed in BC tissues and was associated with invasiveness and T stage in BC patients. SLC35F2 knockdown can inhibit the proliferation, migration and invasion of BC cells and can promote apoptosis. SLC35F2 knockdown significantly reduced tumorigenesis in nude mice. GSEA showed that BC, pathways in cancer, apoptosis and the P53 signaling pathway were significantly enriched in SLC35F2 high expression phenotype.
Conclusion: SLC35F2 can promote malignant progression and is a potential therapeutic target in BC.
Keywords: bladder cancer, SLC35F2, proliferation, migration, invasion
Introduction
Bladder cancer (BC) is one of the most common cancers of the genitourinary system, causing approximately 200,000 deaths per year.1 BC is divided into non-muscle invasive bladder cancer (NMIBC) and muscle invasive bladder cancer (MIBC). NMIBC accounts for 70% ~ 80% of BC, 20% ~ 25% of which have poor prognosis and can progress to MIBC. MIBC is highly malignant and metastatic, with high rates of recurrence and mortality. Although there are many treatments, the prognosis is poor, and the treatment effects are not satisfactory.2 Since the development of BC is the result of the of multiple genes and molecules, the mechanism remains unclear,3 and the treatment of BC is expensive.4 Therefore, new therapeutic targets urgently need to be identified. Biomarkers are critical to the diagnosis and treatment of BC.5
Solute carrier family 35 member F2 (SLC35F2) belongs to the solute carrier family and is located on the long arm of human chromosome 11. This gene encodes a membrane-bound transporter involved in the transport of various substrates, such as amino acids, glucose, vitamins, fatty acids and ions.6 SLC35F2 expression was initially reported in ataxia telangiectasia.7 The highest expression of SLC35F2 was found in adult salivary glands.8 Targeted genome editing confirmed that SLC35F2 is the main determinant of YM155-mediated DNA damage and toxicity.9 SLC35F2 is a specific transcript in microvascular endothelial cells in brain.10 The expression of SLC35F2 is related to the androgen receptor in prostate cancer. As the activity score of the androgen receptor decreases, SLC35F2 expression increases. SLC35F2 can be used as a biomarker of susceptibility to YM155, which is a therapy for prostate cancer.11 SLC35F2 can promote the entry of YM155 into human pluripotent stem cells (hPSCs) and can act as a stem cell toxin.12 Other solute carrier family members, such as SLC12A5 and SLC34A2, are highly expressed in BC.13 However, the expression, function and mechanism of SLC35F2 in BC are still unclear.
In this study, we explored the regulatory mechanism and clinical significance of SLC35F2 in BC. SLC35F2 is highly expressed in BC tissues and is associated with the invasiveness and T stage of BC. In vitro and in vivo studies revealed that SLC35F2 knockdown can inhibit the proliferation, migration and invasion of BC cells and can promote apoptosis and that SLC35F2 may regulate BC through pathways in cancer and apoptosis and the P53 signaling pathway. These findings highlight the function of SLC35F2 in BC for the first time and suggest that SLC35F2 may be a therapeutic target for BC patients.
Materials and Methods
Bioinformatics Analysis
BC gene expression data were downloaded from The Cancer Genome Atlas (TCGA) database (https://cancergenome.nih.gov/), which included data from 408 BC tissues and 19 normal tissues, to examine the mRNA expression level of SLC35F2. The BC dataset GSE13507 (n=165) and corresponding clinicopathological and prognostic information were downloaded from the Gene Expression Omnibus (GEO) database (https://www.ncbi.nlm.nih.gov/geo/). Table 1 shows the clinicopathological information of 165 BC patients in the GSE13507 data set.
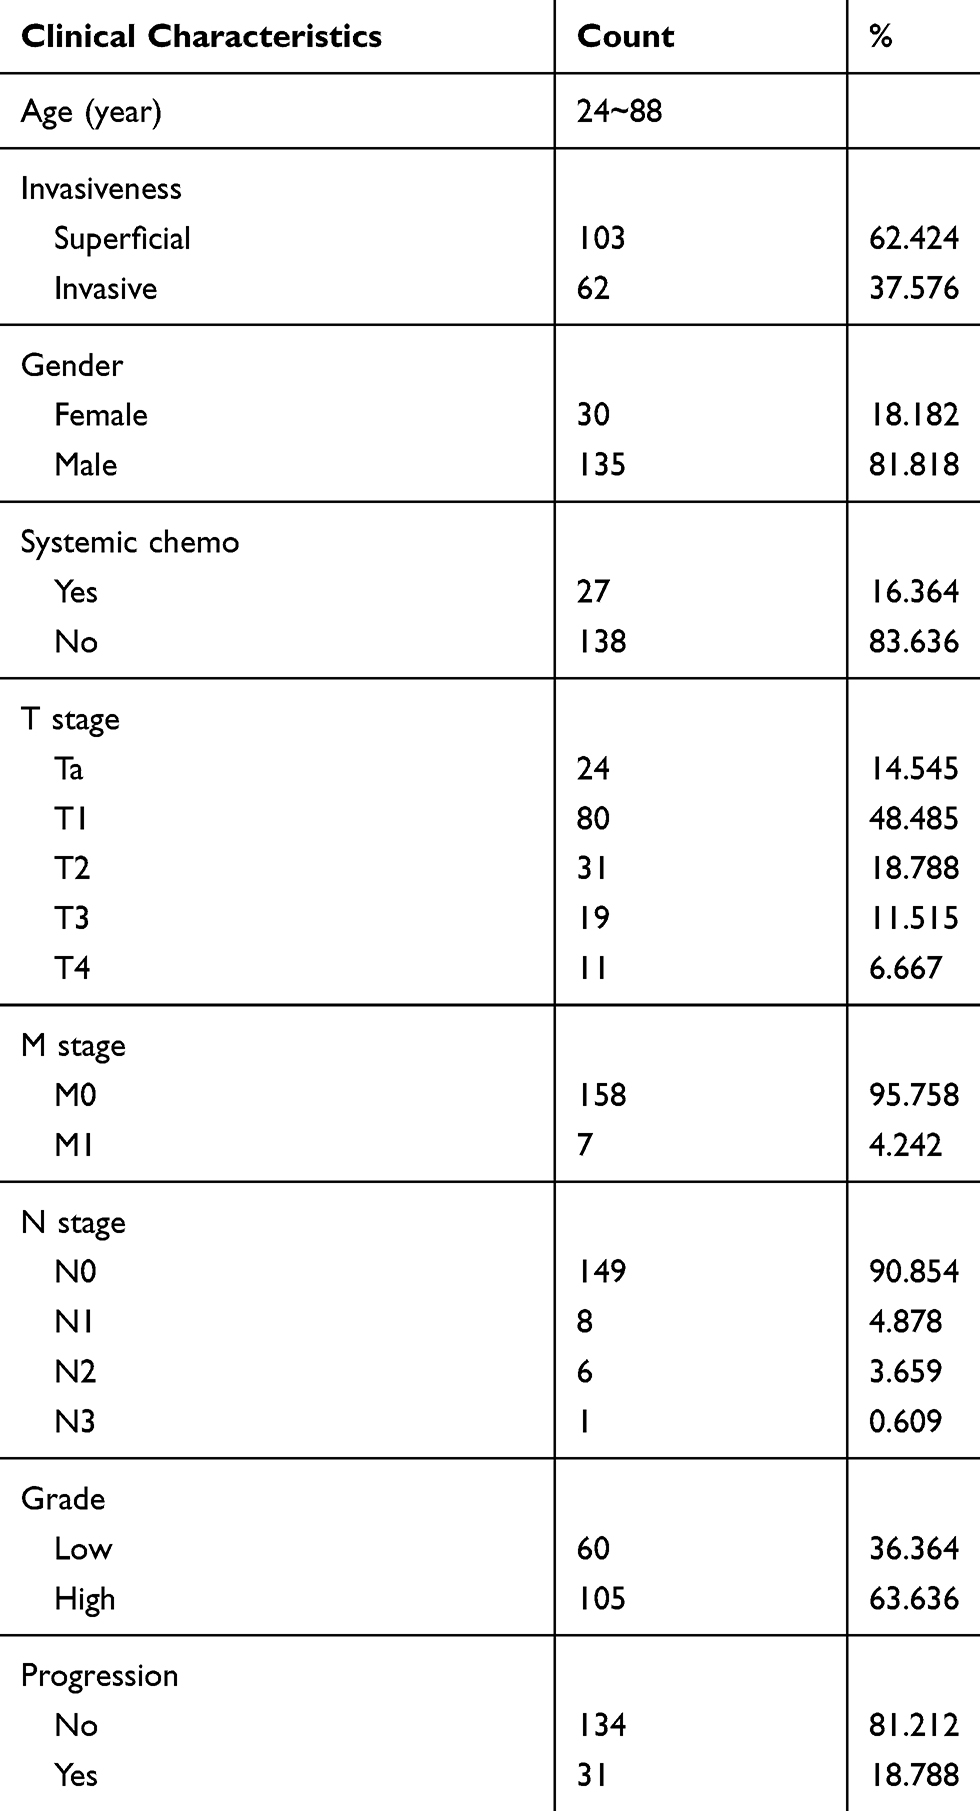 |
Table 1 Clinicopathological Information of 165 Bladder Cancer Patients in the GSE13507 Data Set |
Human Tissue Specimens
BC specimens (n = 10) and normal bladder tissues (n = 10) were collected from patients at the Affiliated Haikou Hospital of Xiangya Medical College, Central South University, in 2019. The mRNA levels of SLC35F2 in these tissues were measured by quantitative real-time polymerase chain reaction (qRT-PCR). Written informed consent from all patients and approval from the Ethics Committee of the Affiliated Haikou Hospital of Xiangya Medical College, Central South University, were obtained before specimen collection.
Cell Lines
The human BC cell line 5637 was purchased from the American Type Culture Collection (Manassas, VA, USA), and the human BC cell line T24 was purchased from the Chinese Academy of Sciences Cell Bank Culture Collection (CBTCCCAS, Shanghai, China). Both 5637 and T24 cells were cultured in RPMI 1640 medium (Gibco, New York, USA).
Construction of RNA Interference (RNAi) Lentiviral Vectors and the Transfection of Cells
A SLC35F2 short hairpin RNA (shRNA) encoding a green fluorescent protein (GFP) transfer vector sequence was constructed by GeneChem (Shanghai, China). Small interfering RNA (siRNA) recombinant lentivirus (SLC35F2-RNAi-Lentivirus) targeting SLC35F2 was used in the experimental group (KD). The shRNA target sequence was 5’-CTACCAGTACAACTCTA-3’, whereas scrambled shRNA sequence (5’-TTCTCCGAACGTGTCACGT-3’) was used as the negative control (NC). The lentiviral vectors were transfected into 5637 and T24 cells using Lipofectamine 2000 (Invitrogen, CA, USA). Infection efficiency after 72 h was determined by GFP expression observed under a fluorescence microscope (Olympus Corporation, Tokyo, Japan). Knockdown efficiency was verified by qRT-PCR and Western blotting.
qRT-PCR
Total RNA was extracted from the cells with TRIzol reagent (Pufei, Shanghai, China). RNA concentration was detected with a NanoDrop spectrophotometer (Thermo Scientific, Waltham, MA, USA). Total RNA was reverse transcribed into cDNA with a Promega M-MLV kit (Promega, Wisconsin, USA) according to the manufacturer’s instructions. qRT-PCR was performed according to the instructions of SYBR Master Mixture (Takara, Guangzhou, China). The primers for SLC35F2 and glyceraldehyde-3-phosphate dehydrogenase (GAPDH) were designed and synthesized by Sangon Biotech (Shanghai, China). The primer sequences were as follows: SLC35F2 (forward: 5’-GTGAGGAATACATCGTGAA-3’, reverse: 5’-CAAACAGAAAGAGTCCAACA-3’) and GAPDH (forward: 5’- TGACTTCAACAGCGACACCCA-3’, reverse: 5’-CACCCTGTTGCTGTAGCCAAA-3’). To assess differential gene expression, the cycle threshold (Ct) values were normalized using GAPDH as an internal reference, and the relative mRNA expression was calculated using the 2−ΔΔCt method. All trials were performed in triplicate.
Western Blotting Analysis
Protein was extracted by RIPA lysate buffer (Biyun Tian, Shanghai, China), and the protein concentration was determined using a BCA Protein Assay Kit (Biyun Tian). Proteins were separated by 10% SDS-PAGE, transferred to a PVDF membrane (Millipore, Bedford, MA, USA), and specifically probed for SLC35F2 (1:1000, Proteintech, Chicago, USA) and GAPDH (1:2000; Bioss, Wuhan, China). Then, the membrane was incubated with a goat anti-rabbit antibody (1:2000; Abcam, Cambridge, UK) and a goat anti-mouse antibody (1:2000; Abcam). After the membranes were washed, the protein bands were detected using a Pierce™ ECL Western Blotting Substrate kit (Thermo Scientific, Waltham, MA, USA).
Cell Counting Kit-8 (CCK-8) Assay
Transfected cells were plated at 100 μL per well, with 3 wells per group. Starting on the second day after plating, 10 μL of CCK-8 reagent (Sigma, Germany) was added to the wells for 3 h before the culture was terminated. The 96-well plate was shaken for 3 min after 4 h, and the optical density (OD) at 450 nm was measured using a microplate reader (Tecan, Switzerland).
Cell Colony Formation Assay
Transfected cells were seeded into a 6-well plate at a density of 800 cells per well and were incubated for 5 days. Then, 1 mL of 4% paraformaldehyde was added to each well, the cells were fixed for 60 min, and the cells were washed once in PBS. Next, 1000 µL of crystal violet (Sangon Biotech, Shanghai, China) was added to each well, and the cells were stained for 20 min. Finally, the colonies were imaged and counted. All trials were performed in triplicate.
Apoptosis Analysis
Transfected cells were washed twice with 1× PBS and digested with trypsin. The trypsin was inactivated with complete medium, and the cell pellet was resuspended in 200 μL of 1× binding buffer. Annexin V-APC was added and incubated away from light for 10 min at room temperature. Analysis was performed by flow cytometry (Millipore).
Wound-Healing Assay
Transfected cells were plated, and scratches were made in wells in the central portion of the lower end of a 96-well plate (VP scientific, Shanghai, China). Serum-free medium was used to gently rinse the cells 2–3 times, low-serum medium was added, and photos were taken under a fluorescence microscope. Cells were cultured at 37°C in a 5% CO2 incubator, and the plates were scanned with a Celigo (Nexcelom, USA) at the indicated times to record the degree of healing. The areas with migratory cells were analyzed on the Celigo.
Transwell Assay
According to the instructions of a transwell kit (Corning Life Sciences, USA), 100 µL of cell suspension was added to the upper chamber, and 600 µL of medium supplemented with 30% FBS was added to the lower chamber. After incubation, the transwell inserts were inverted on absorbent paper to remove the medium, and any cells remaining in the upper chamber were gently removed with a cotton swab. The chamber was fixed in 4% paraformaldehyde for 30 min, and 1 drop of stain was applied to the lower surface of the membrane to stain cells for 3 min, after which they were photographed under a microscope.
Tumor Formation in Nude Mice
Four-week-old female athymic BALB/c nude mice (body weight 18–20 g, 10 in each group) were obtained from GemPharmatech Co., Ltd. T24 cells (1×10⁷ cells per group, n = 10) transfected with shSLC35F2 and NC lentivirus were injected into the abdominal cavity of the nude mice. The width (W) and length (L) of the tumors were measured with a caliper, and the volume (V) of the tumors was calculated using the formula V =π/ 6×L×W×W. The nude mice were euthanized on day 50 after inoculation, and the tumors were removed and weighed. The animal experiments were approved by the Animal Management Committee of the Affiliated Haikou Hospital of Xiangya Medical College, Central South University (permission number: 2016–005). The welfare of the animals was guaranteed under the criteria of the “Laboratory Animal Management Regulations in China”.
Gene Ontology (GO) and Kyoto Encyclopedia of Genes and Genomes (KEGG) Analyses of Coexpressed Genes
Genes that were coexpressed with SLC35F2 with a Pearson correlation coefficient greater than 0.3 were identified with cBioportal (http://www.cbioportal.org/). GO and KEGG analyses were performed on these coexpressed genes with the Database for Annotation, Visualization, and Integrated Discovery (DAVID, https://david.ncifcrf.gov/, Version 6.8) to predict the possible pathways associated with SLC35F2.
Gene Set Enrichment Analysis (GSEA)
BC patients were divided according to the expression level of SLC35F2 (high expression group and low expression group). The c2.cp.kegg.v6.2.symbols.gmt dataset was downloaded from the Molecular Signatures Database (MSigDB) and was analyzed by using GSEA 3.0 (http://www.broad.mit.edu/gsea/). Then, enrichment analysis was carried out with default weighted enrichment statistics, and the analysis was randomly repeated 1,000 times. A nominal P<0.05 and a false discovery rate (FDR)<0.25 were used as the significance cutoff criteria.
Statistical Analysis
Statistical analyses were performed using SPSS 23.0, GraphPad Prism 8.0, and R 3.5.1. A t-test was used to compare the difference in SLC35F2 expression between cancer tissues and normal tissues. A chi-square test was used to evaluate the correlation between SLC35F2 expression and the clinicopathological characteristics of BC patients. Univariate and multivariate Cox analyses were performed to evaluate the overall survival and tumor-specific survival of BC patients. P<0.05 was considered significant.
Results
Overexpression of SLC35F2 in BC
The RNA sequencing (RNA-seq) data from the TCGA database indicated that SLC35F2 expression in BC tissues was higher than that in normal bladder tissues (Figure 1A, P=0.0013). The receiver-operating characteristic (ROC) curve indicated that the RNA expression level of SLC35F2 has great diagnostic value for distinguishing BC tissues from normal bladder tissue, with an area under the curve of 0.814 (Figure 1B). Considering individual differences, we analyzed matched pairs of cancer tissues and normal tissues. SLC35F2 expression was significantly higher in the BC tissues than in the matched normal bladder tissues (Figure 1C, P=0.0015), with an area under the curve of 0.846 (Figure 1D). We obtained the GSE13507 dataset from the GEO database to compare SLC35F2 expression between BC tissues and normal tissues. The results showed that SLC35F2 expression was higher in BC tissues than in normal tissues (Figure 1E, P=0.0047). For further validation, we used qRT-PCR to detect differences in SLC35F2 mRNA expression in 10 matched pairs of BC tissues and normal tissues, and SLC35F2 was overexpressed in the BC tissues compared to matched normal bladder tissues (Figure 1F, P= 0.028). All of these studies indicate that SLC35F2 expression was higher in cancer tissues than in normal tissues.
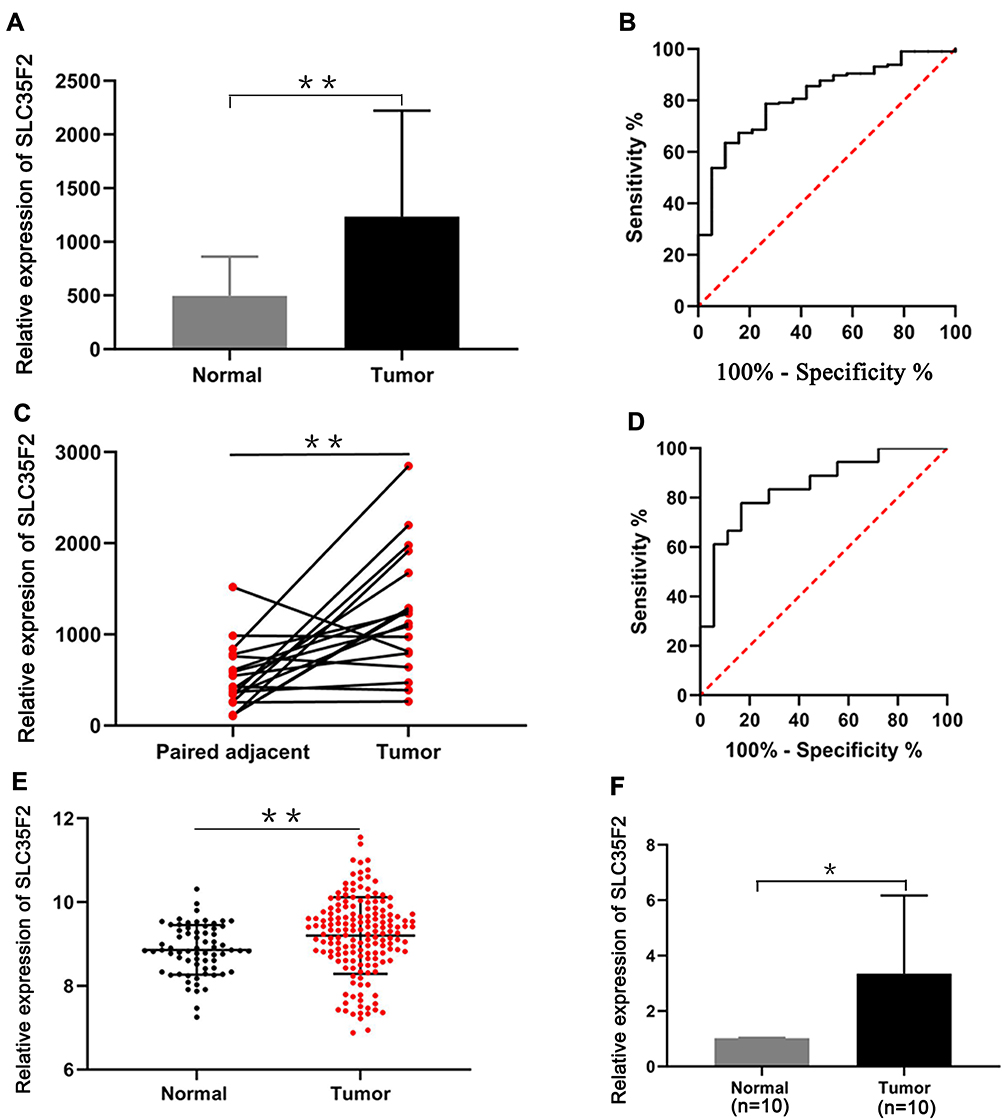 |
Figure 1 Overexpression of SLC35F2 in BC. (A) SLC35F2 expression in nonpaired tissues from the TCGA database; (B) ROC curves of SLC35F2 expression in unpaired tissues from the TCGA database; (C) mRNA expression of SLC35F2 in paired tissues from the TCGA database; (D) ROC curves of SLC35F2 expression in paired tissues from the TCGA database; (E) SLC35F2 expression in BC tissues and normal tissues in the GSE13507 dataset; (F) mRNA expression of SLC35F2 in BC tissues and normal tissues was verified by qRT-PCR (*p<0.05; **p<0.01). |
The Association Between SLC35F2 Expression and Clinical Characteristics of BC Patients
To research the association between SLC35F2 expression and the clinical features of BC patients, the clinicopathological data (invasiveness, gender, systemic chemotherapy, grade, T stage, M stage, and N stage) of 165 BC patients in the GSE13507 dataset were extracted from the GEO database. The results showed that SLC35F2 expression in tumor tissues was significantly correlated with invasiveness (P=0.029) and T stage (P=0.018) (Table 2). These results indicate that the high expression of SLC35F2 may be related to the invasiveness and T stage of tumors and may promote BC progression.
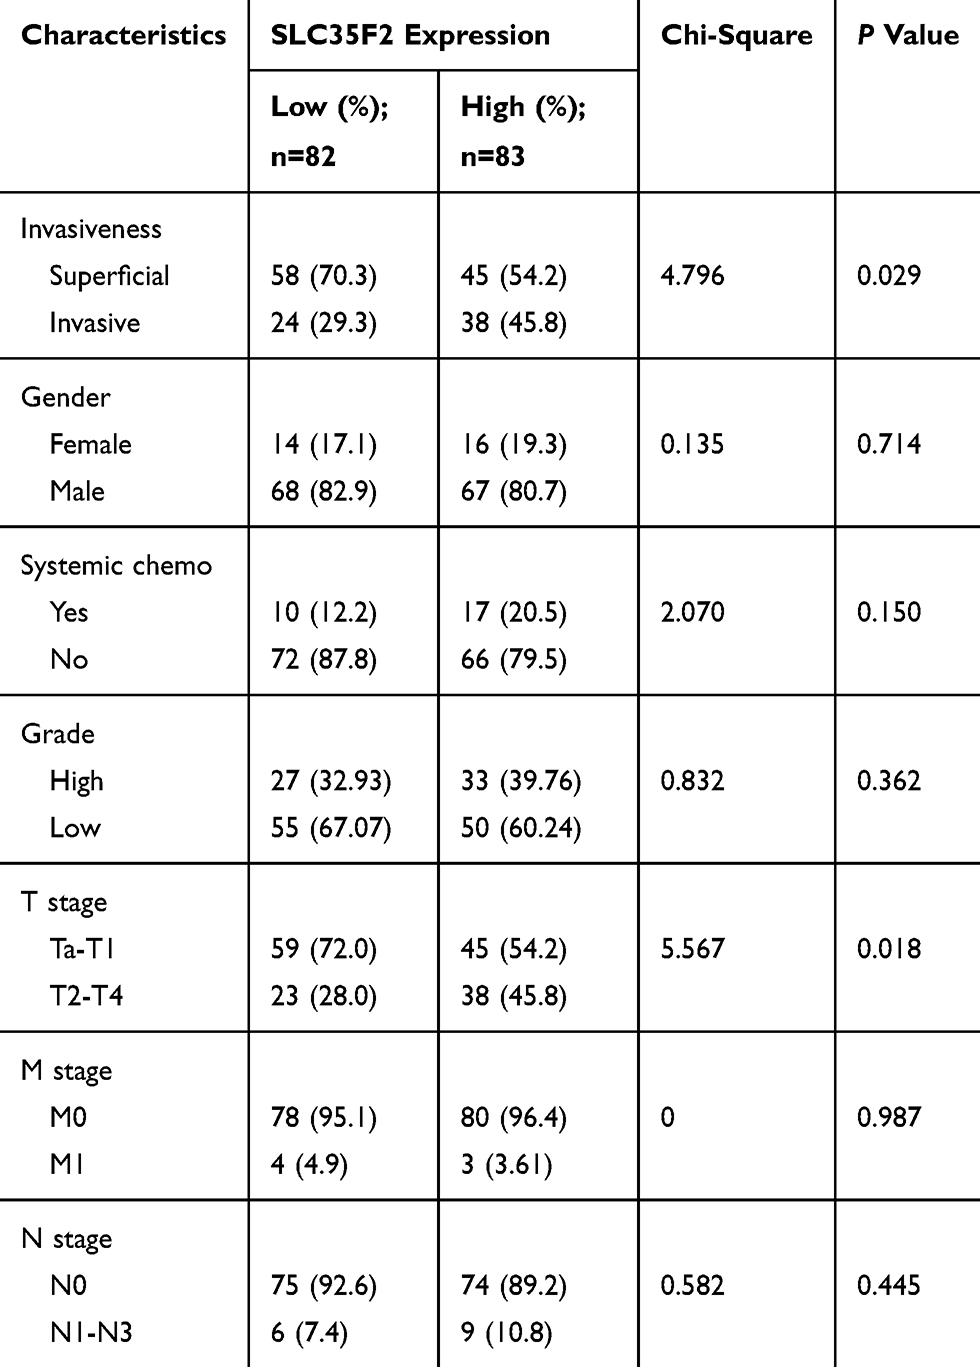 |
Table 2 Association Between SLC35F2 Expression and Clinicopathological Variables in BC Patients |
Univariate and Multivariate Cox Analyses of Overall Survival and Tumor-Specific survival in BC Patients
Univariate Cox analysis showed that age, invasiveness, T stage and M stage affected overall survival, whereas age, invasiveness, systemic chemotherapy, T stage, M stage, N stage, progression and gender affected cancer-specific survival. Multivariate Cox analysis showed that age, T stage, and M stage were independent factors that affected overall survival, whereas only T stage was an independent factor that influenced cancer-specific survival. These results indicated that T stage is closely related to the survival of BC patients. As the T stage progressed, the prognosis became worse; thus, the T stage is a risk factor for BC patients. However, SLC35F2 expression was not significantly associated with either overall survival or cancer-specific survival (Tables 3 and 4).
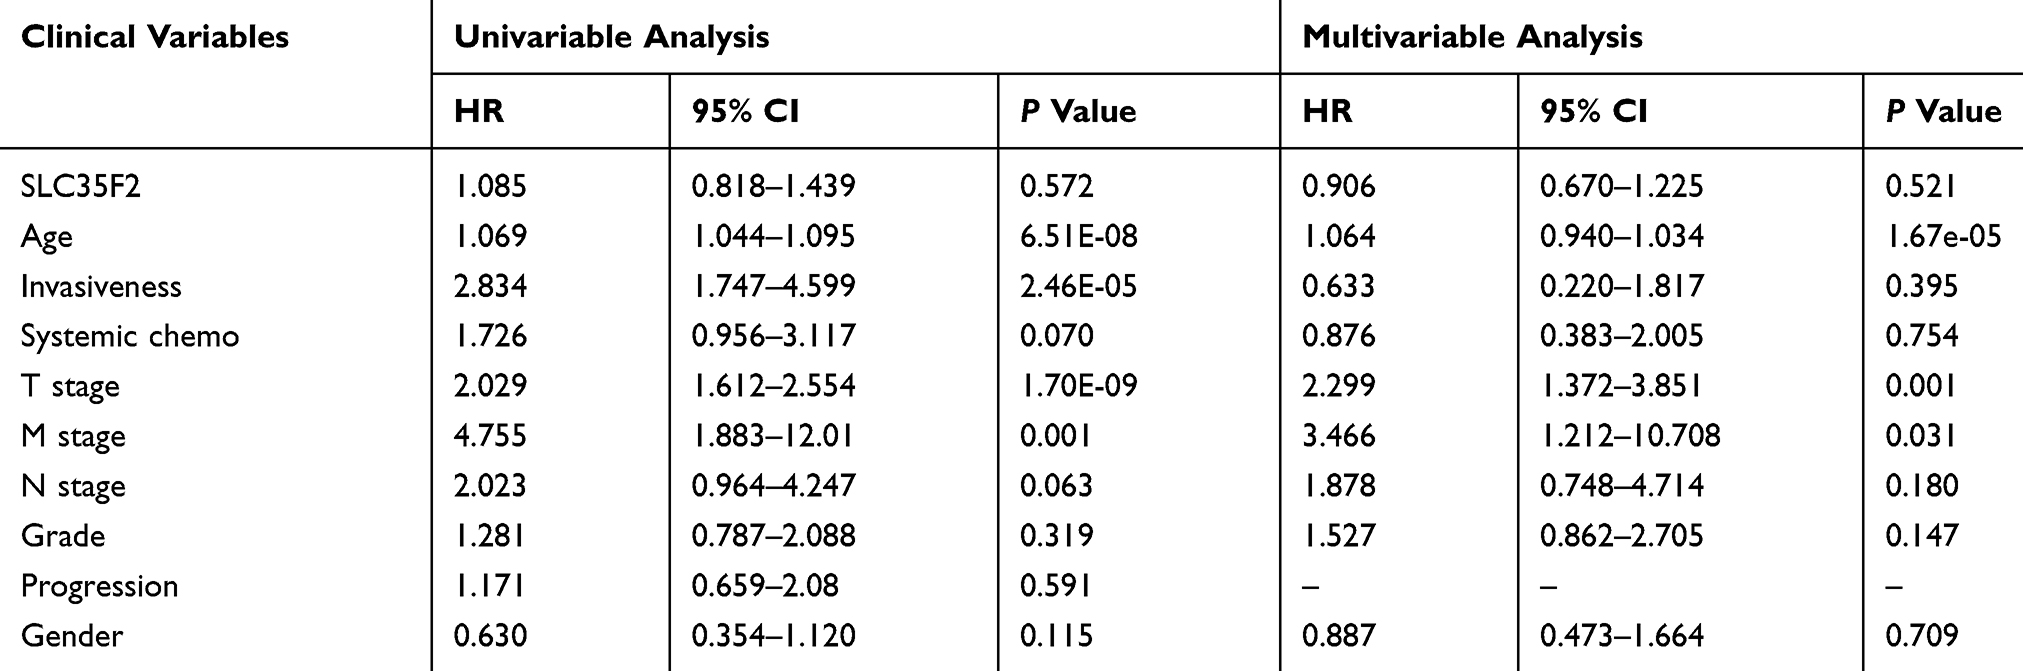 |
Table 3 Univariate and Multivariate Cox Analyses of Overall Survival in Patients with BC |
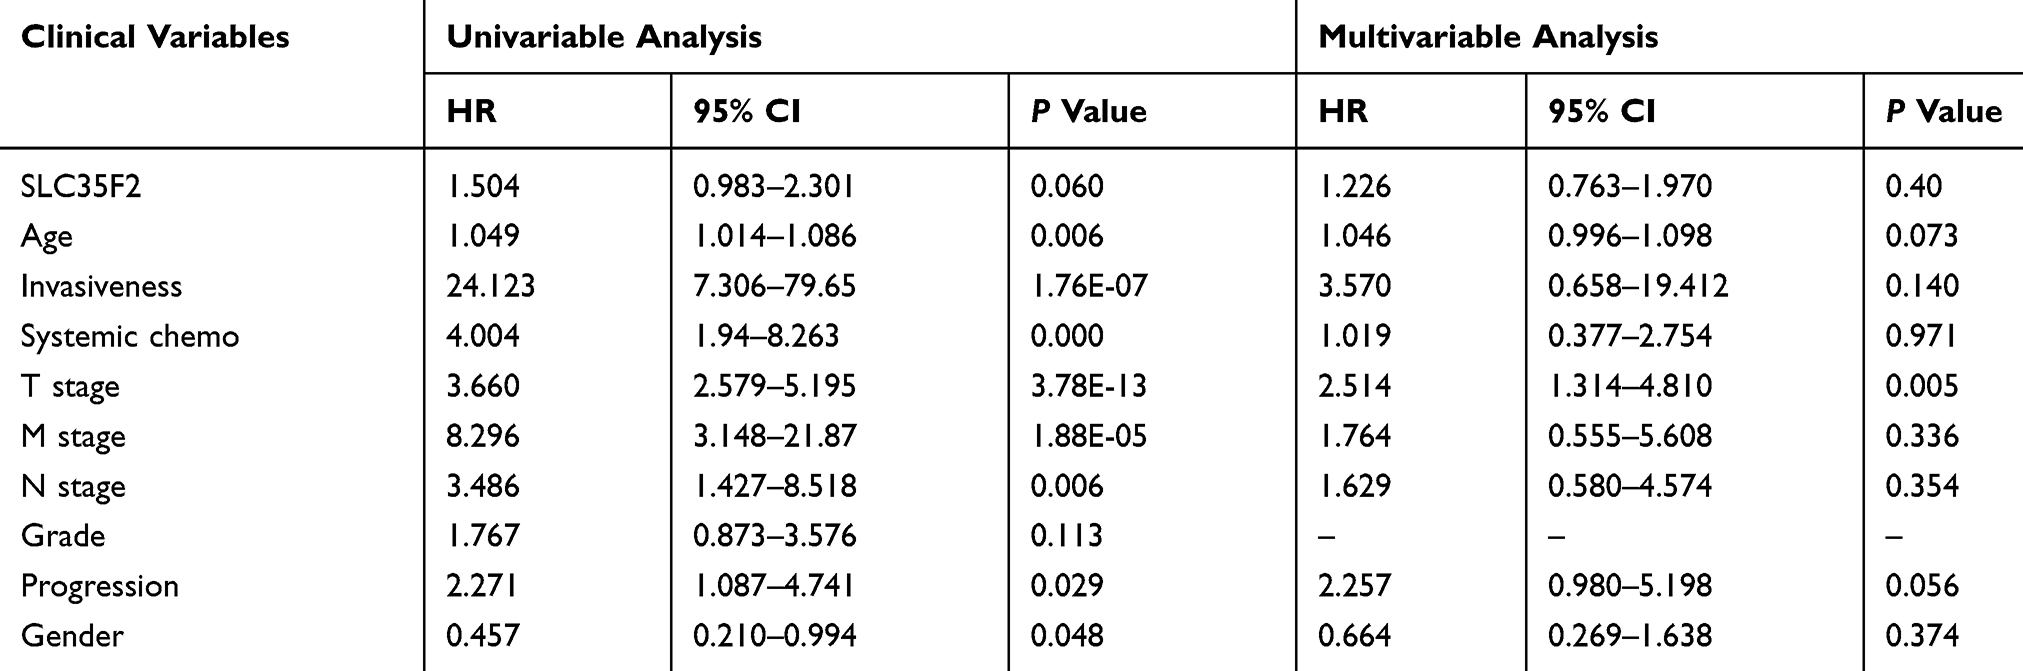 |
Table 4 Univariate and Multivariate Cox Analyses of Cancer-Specific Survival in Patients with BC |
Construction and Validation of Lentiviral Vectors for Silencing SLC35F2 in BC Cell Lines
Since data from the database showed that SLC35F2 overexpression was associated with BC invasiveness and T stage, we then studied whether SLC35F2 had the same effect on BC cell invasion and proliferation by knocking down SLC35F2 in BC cell lines.
A lentiviral vector targeting SLC35F2 was successfully transfected into 5637 and T24 cells. We observed GFP in 5637 and T24 cells from their respective NC and KD groups with inverted fluorescence microscopy (Figure 2A), suggesting that the lentiviral vector had been successfully transfected into the cell genome and was stably expressed. SLC35F2 expression was significantly decreased at both the mRNA and protein levels compared to those in the control groups (Figure 2B and C), with mRNA knockdown efficiency reaching 95.5% and 85.9% in 5637 and T24 cells, respectively.
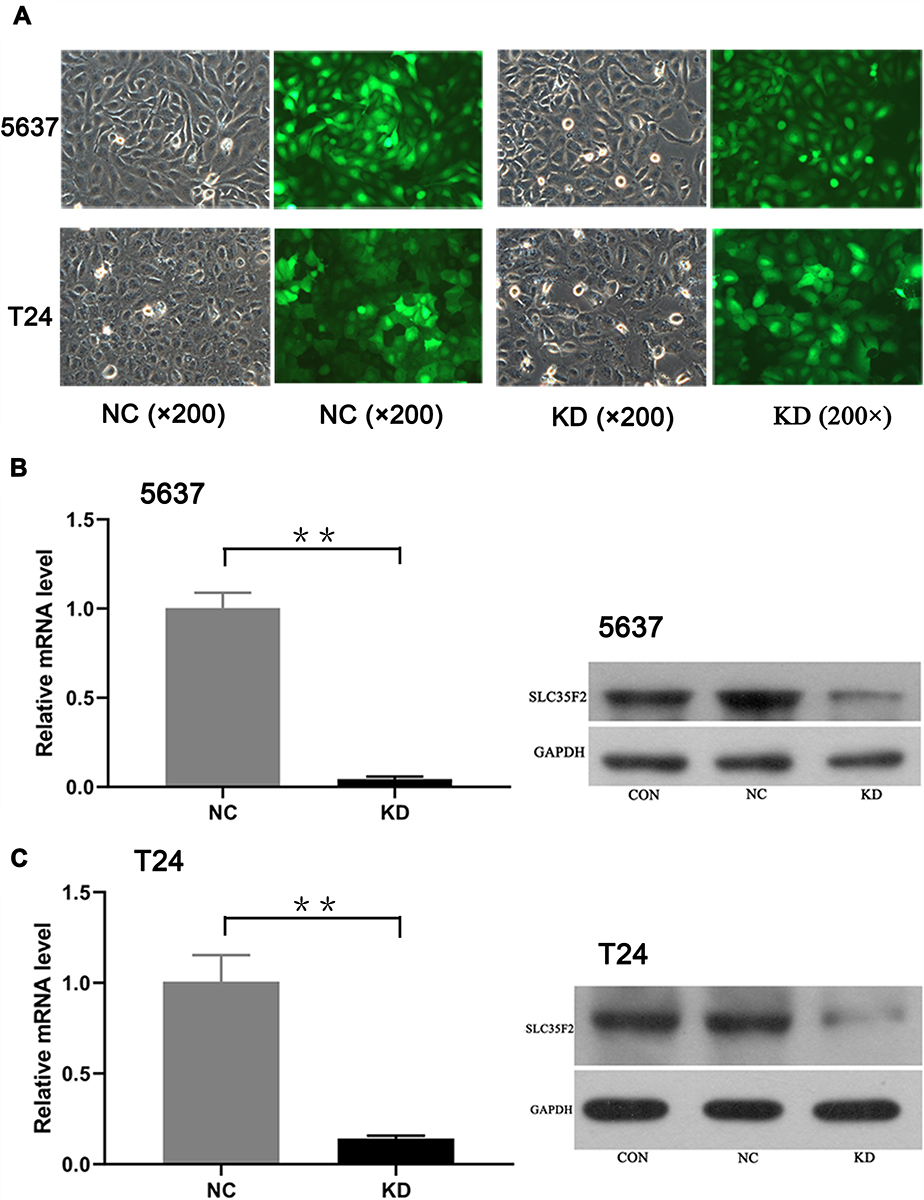 |
Figure 2 Expression and knockdown efficiency of green fluorescent protein after transfection of 5637 and T24 cells as observed under a fluorescence microscope. (A) Expression of green fluorescent protein after transfection of 5637 and T24 cells, as observed under a fluorescence microscope; (B) Expression of SLC35F2 at the mRNA and protein levels in both groups of 5637 cells; (C) Expression of SLC35F2 at the mRNA and protein levels in both groups of T24 cells (**p <0.01). Abbreviations: CON, cells were not infected with a virus; NC, cells were infected with a nontargeted lentiviral sequence; KD, cells were infected with a recombinant lentivirus containing an siRNA targeting SLC35F2. |
Influences of the SLC35F2 Gene on the Proliferation of BC Cells in vitro
The influence of SLC35F2 knockdown on the proliferation of 5637 and T24 cells in vitro was examined with CCK8 and clonogenic assays. The CCK8 assay showed a significant decrease in cell proliferation after SLC35F2 knockdown (Figure 3A), and colony formation experiments showed that SLC35F2 knockdown reduced the colony-forming ability (Figure 3C). The same results were observed in T24 cells (Figure 3B and D). These results suggest that SLC35F2 can promote the proliferation of BC cells in vitro.
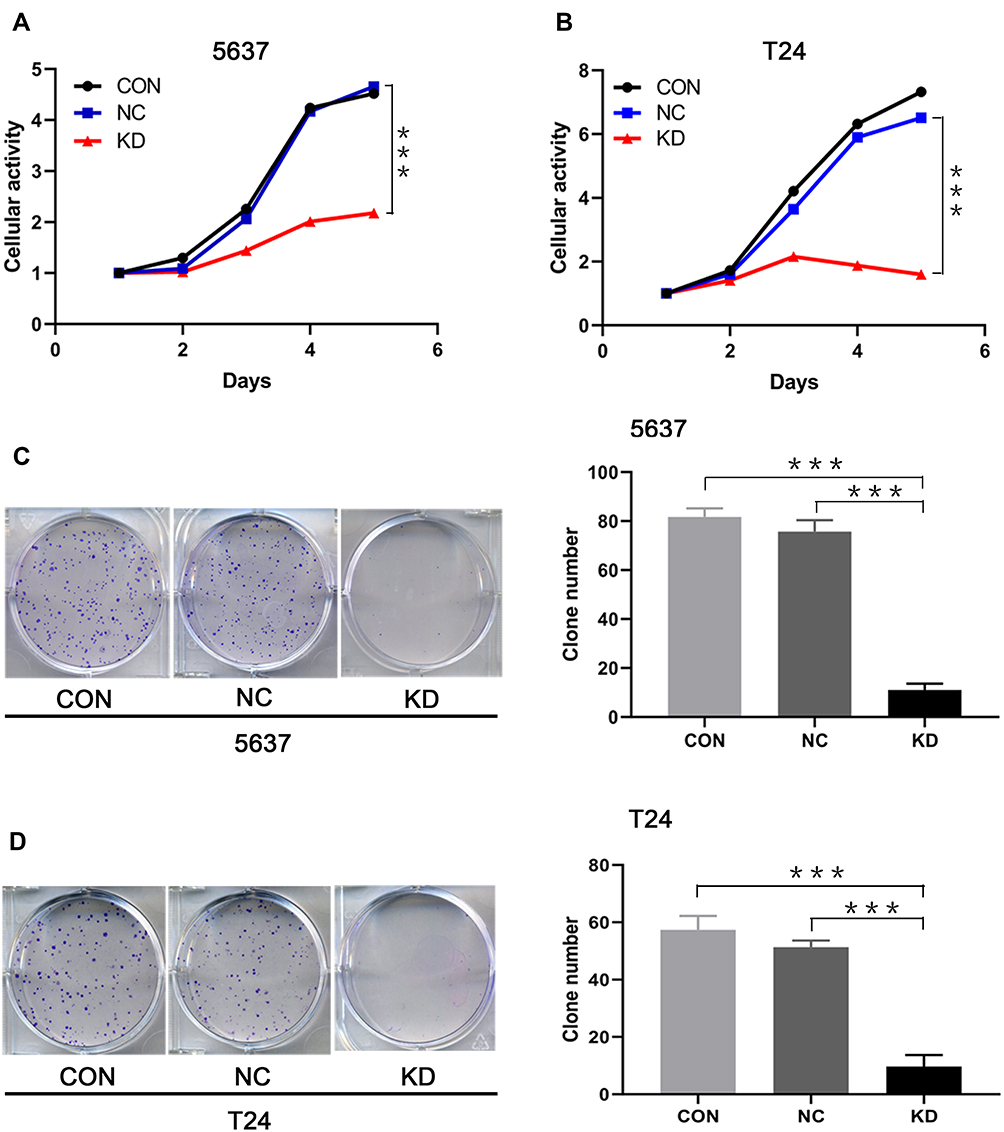 |
Figure 3 Effect of SLC35F2 knockdown on BC cell proliferation in vitro. (A) Comparison of the cellular activity of 5637 cells in each group over time; (B) Comparison of the cellular activity of T24 cells in each group over time; (C) Number of colonies arising from 5637 cells; (D) Number of colonies arising from T24 cells (***p <0.001). |
Influences of SLC35F2 on the Proliferation of BC Cells in vivo
To assess the effect of SLC35F2 on BC cell proliferation in vivo, we investigated the effect of SLC35F2 knockdown on tumor growth in nude mice. We injected shSLC35F2- and NC lentivirus-transfected T24 cells into the abdominal cavity of nude mice and then performed in vivo imaging and tumor size measurements. In vivo imaging of the nude mice showed that the fluorescence of the KD group was weaker than that of the NC group (Figure 4A and B). The quantitative results showed that the total fluorescence decreased from 3.50×10¹⁰ to 2.64×10¹⁰, and this difference was statistically significant (Figure 4C, P=0.016). To confirm the imaging results, the tumors were removed after the mice were euthanized, and the tumor size was measured (Figure 4D and G). From these measurements, the tumor volume and growth rate were calculated (Figure 4E). To exclude the influence of body weight of nude mice on the tumor volume, the body weight and growth rate of the nude mice were also calculated (Figure 4F). The results suggested that SLC35F2 knockdown inhibited BC growth in vivo.
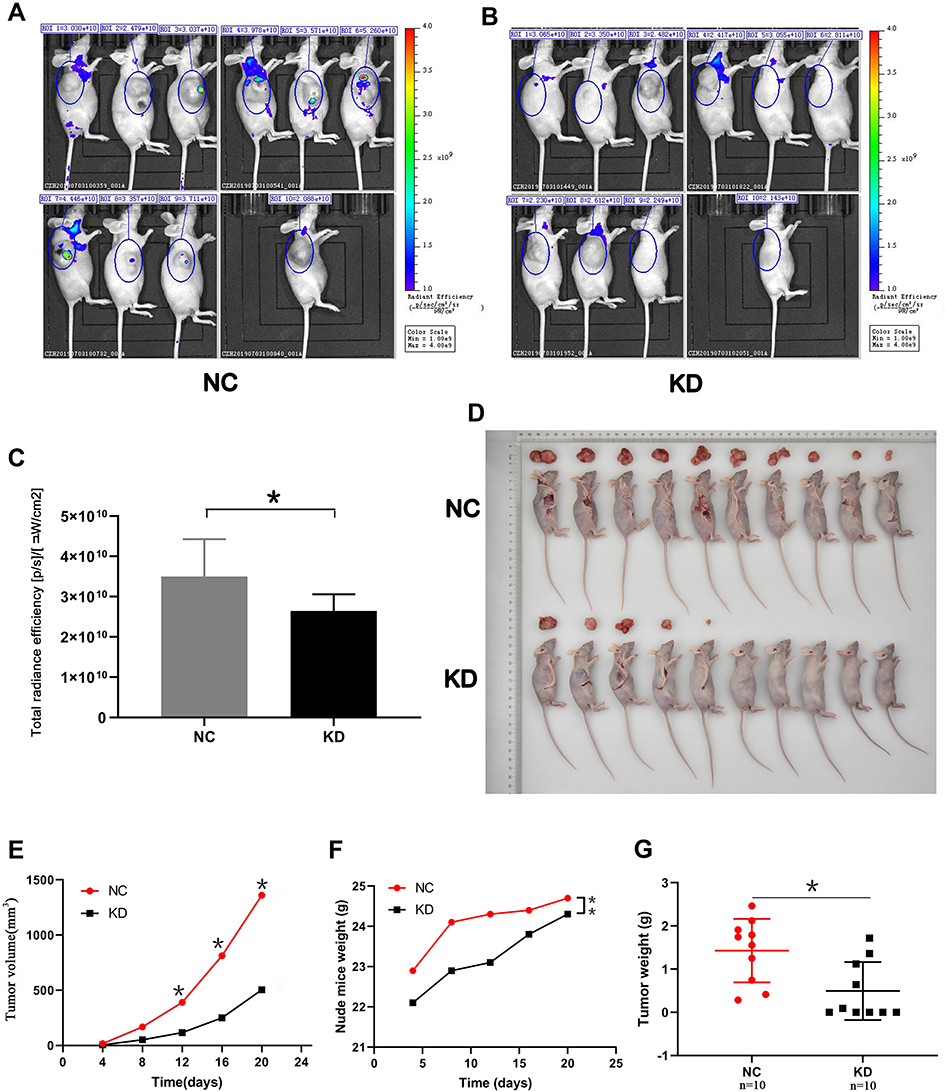 |
Figure 4 Effect of SLC35F2 knockdown on BC cell proliferation in vivo. (A) Bioluminescence imaging of tumors in the NC group; (B) Bioluminescence imaging of tumors in the KD group; (C) Quantification of the fluorescence levels from the bioluminescence imaging; (D) Images of sacrificed nude mice and their excised tumors; (E) The tumor growth curve in the SLC35F3 knockdown and control groups; (F) Body weight of nude mice in the SLC35F3 knockdown and control groups; (G) Tumor weight in the SLC35F3 knockdown and control groups (*p<0.05, **p<0.01). |
Influences of SLC35F2 on the Apoptosis in BC Cells
Flow cytometry was used to detect apoptosis of 5637 and T24 cells. We found that the apoptotic rate of 5637 cells in the SLC35F2 knockdown group was significantly higher than that in the control group (Figure 5A, P<0.001). The same results were observed in T24 cells (Figure 5B, P<0.001). At the same time, we found that knocking down SLC35F2 in 5637 and T24 cells increased the expression levels of the proapoptotic proteins caspase 3 and P53 (Figure 5C).
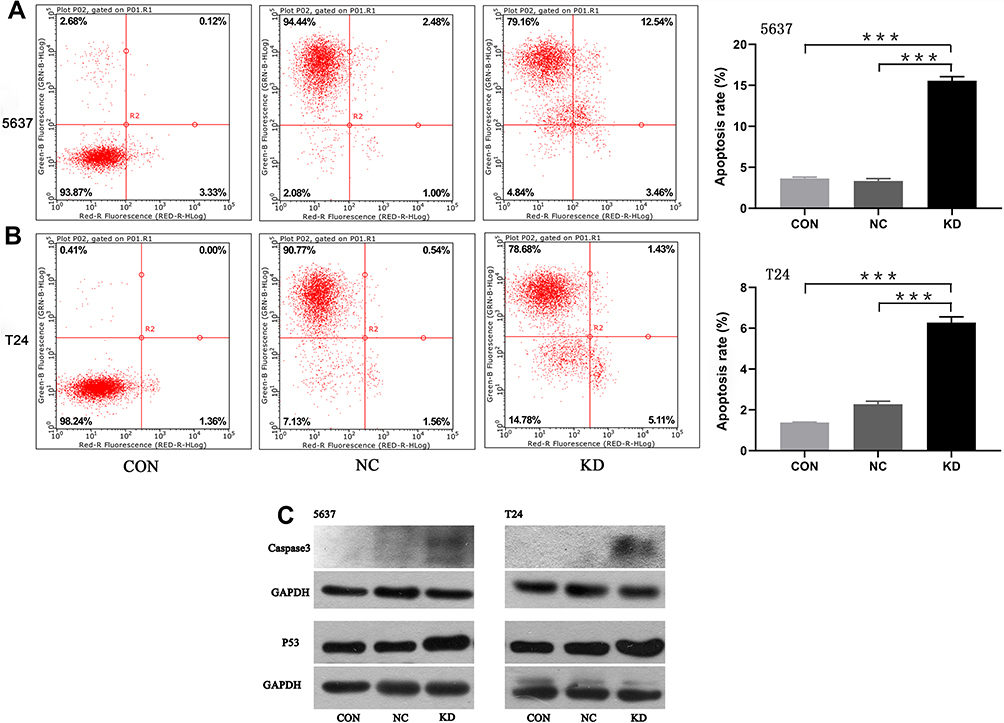 |
Figure 5 Detection of apoptotic cells by flow cytometry and validation of proapoptotic protein expression. (A) Detection of apoptosis in 5637 cells by flow cytometry; (B) Detection of apoptosis in T24 cells by flow cytometry; (C) Detection of proapoptotic proteins by Western blotting (***p<0.001). |
Influences of SLC35F2 on the Migration and Invasion of BC Cells
To determine whether SLC35F2 is involved in the migration and invasion of BC cells, wound healing and transwell assays were performed. The wound healing assay showed that the cell migration rate in the SLC35F2 knockdown group was significantly lower than that in the control group (Figure 6A and C, P<0.001). The transwell experiments showed that the number of migratory 5637 and T24 cells in the SLC35F2 knockdown group was significantly lower than that in the control group (Figure 6B and D, P<0.01). These studies indicate that SLC35F2 knockdown can significantly inhibit the migration and invasion of BC cells in vitro.
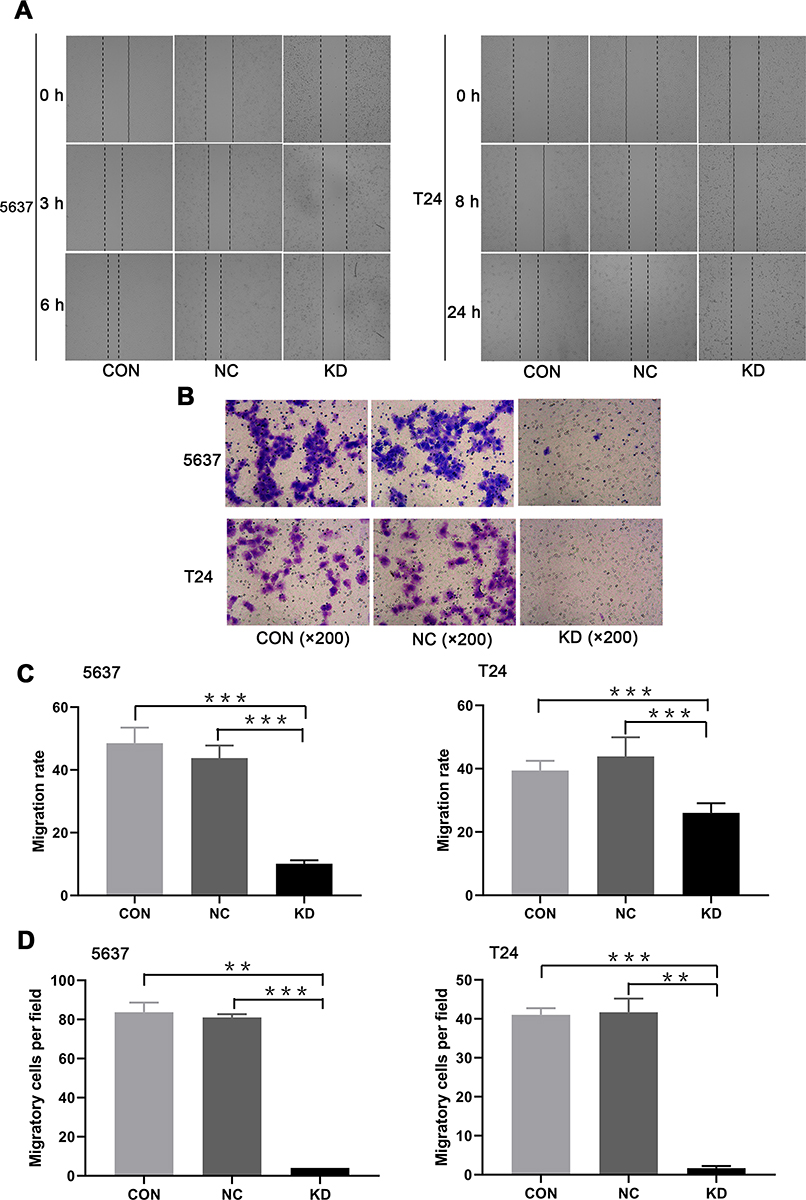 |
Figure 6 Migration and invasion abilities of 5637 and T24 cells in treatment different groups. (A) Images of the 5736 and T24 cells in the different groups in the wound healing assay; (B) Transwell micrographs of 5637 and T24 cells in each group; (C) Cell migration rate of 5637 and T24 cells in each group; (D) Comparison of the number of migratory 5637 and T24 cells in each group (**p<0.01, ***p <0.001). |
GO and KEGG Analyses of Genes That Were Coexpressed with SLC35F2
To predict the function of SLC35F2, genes that were coexpressed with SLC35F2 with a Pearson correlation coefficient greater than 0.3 were identified with cBioportal, and the coexpressed genes were subjected to GO and KEGG analyses with DAVID. GO analysis showed that in the biological process, these coexpressed genes were mainly related to cell division, the epidermal growth factor receptor (EGFR) signaling pathway and the transforming growth factor beta (TGF-β) receptor signaling pathway (Figure 7A). With regard to cellular components, these genes were mainly enriched in the mitochondrial matrix, microtubules, Golgi membrane and focal adhesion (Figure 7B). With regard to molecular functions, these genes were mainly enriched in Rab GTPase binding, GTP binding and EGFR binding (Figure 7C). In the KEGG pathway analysis, the coexpressed genes were mainly enriched in BC, the calcium signaling pathway, the cAMP signaling pathway, the GnRH signaling pathway, arachidonic acid metabolism and the Rap1 signaling pathway (Figure 7D).
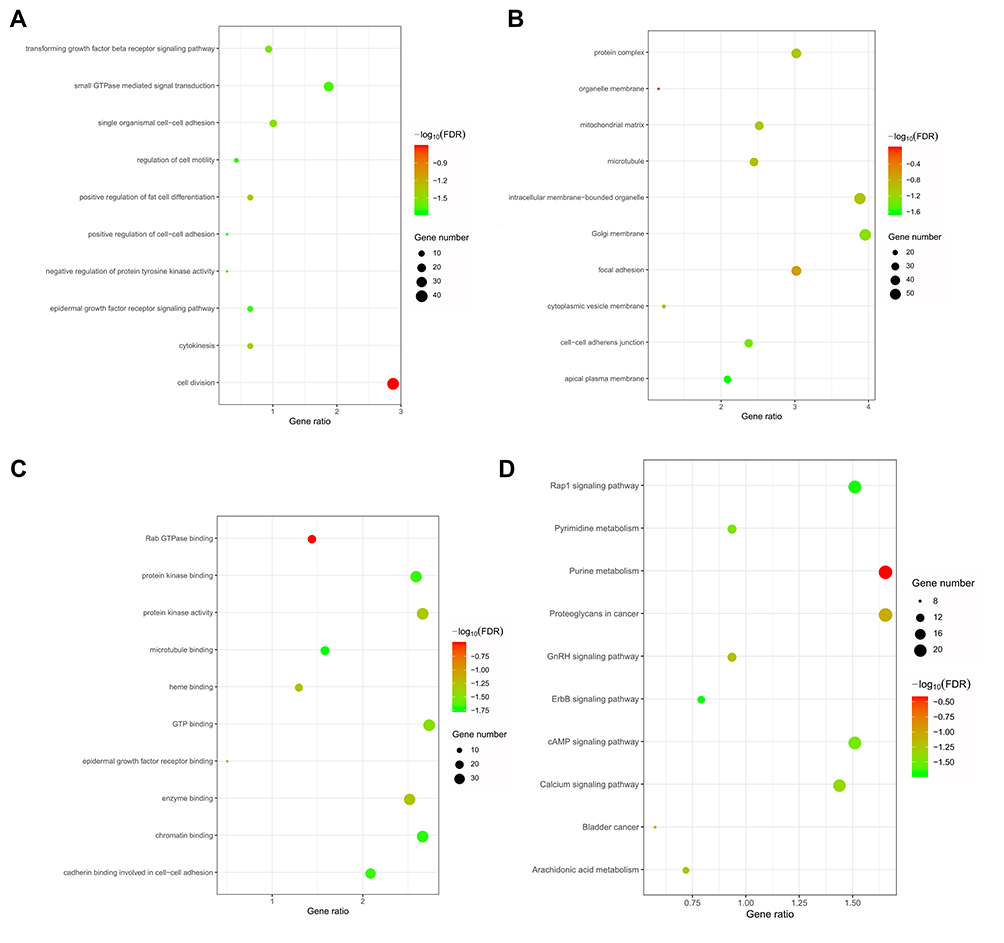 |
Figure 7 GO and KEGG analyses of genes that were coexpressed with SLC35F2. (A) Biological process; (B) Cell component; (C) Molecular function; (D) KEGG pathway. |
Signal Transduction Pathways Related to SLC35F2 Expression
To investigate the possible pathways associated with SLC35F3 in BC, we performed GSEA using data from the TCGA database. BC, pathways in cancer, apoptosis, and the P53 signaling pathway were significantly enriched in the group with high SLC35F2 expression (Figure 8 and Table 5). GSEA indicated that SLC35F2 may play an important role in the development of BC through pathways in cancer and apoptosis and the P53 signaling pathway.
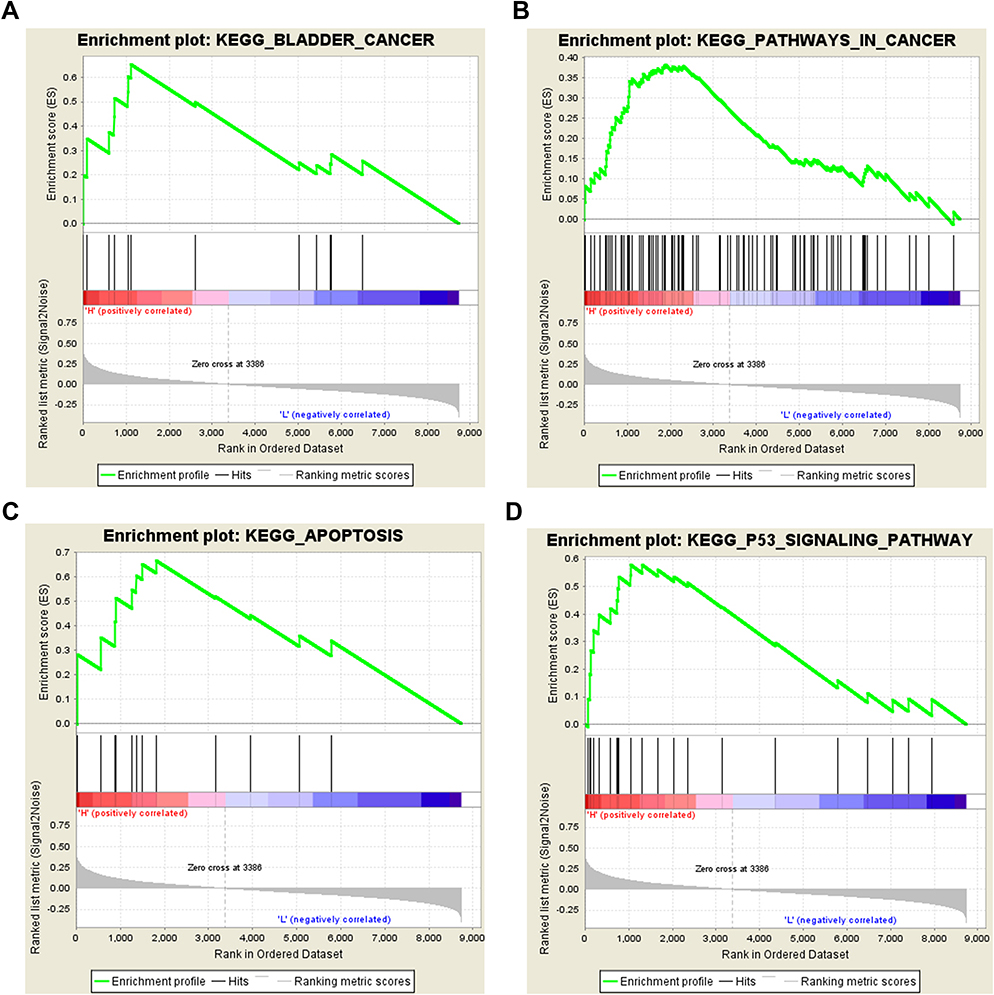 |
Figure 8 Enrichment plots from GSEA. (A) Bladder cancer; (B) Pathways in cancer; (C) Apoptosis; (D) P53 signaling pathway. GSEA, gene set enrichment analysis. |
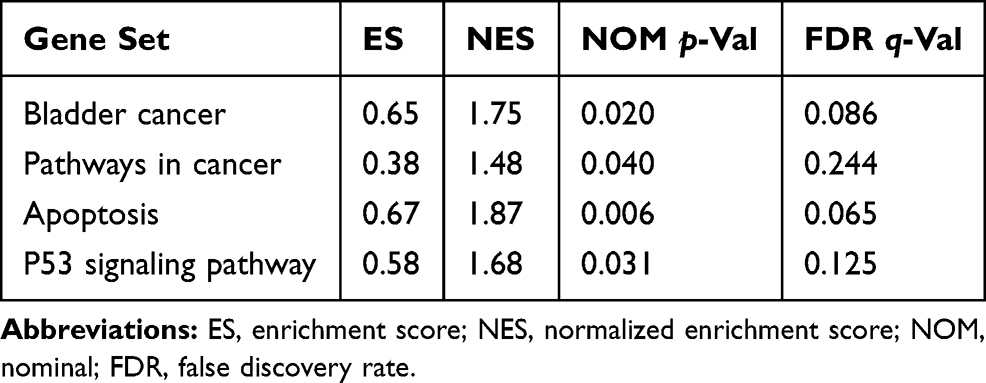 |
Table 5 SLC35F2 High Expression Phenotype Gene Set |
Discussion
SLC35F2 is highly expressed in non-small-cell lung cancer (NSCLC) tissues and is associated with pathological staging.14 SLC35F2 is also highly expressed in papillary thyroid carcinoma (PTC) tissues and is positively correlated with lymph node metastasis.15 In this study, we found that SLC35F2 expression was higher in BC tissues than in normal bladder tissues based on information extracted from relevant databases. Ten BC tissue specimens were used to verify SLC35F3 expression in BC tissues, and the results showed that SLC35F3 was highly expressed in BC tissues. High SLC35F2 expression was correlated with invasiveness and T stage in BC, and the T stage was significantly correlated with poor prognosis in BC patients. However, univariate and multivariate Cox analyses showed that SLC35F2 expression was not correlated with the prognosis of BC patients, and SLC35F2 overexpression is not a prognostic factor even in univariate analyses; however, it is correlated with T stage and invasiveness.
Because the data from the databases indicated that the high expression of SLC35F2 was related to invasiveness and T stage in BC, we performed functional experiments to examine whether SLC35F2 had the same effect on BC cells and whether SLC35F2 could promote the invasion and proliferation of BC cells. RNA interference-mediated downregulation of SLC35F2 expression attenuates the proliferation, migration and invasion of H1299 lung cancer cells, and the percentage of cells in S and G2/M phase was significantly reduced.16 CRISPR/Cas9-mediated knockdown of SLC35F2 attenuates the malignant phenotypes of papillary thyroid cancer (PTC), such as proliferation, migration and invasion, and induces cell cycle arrest at G1 phase.15 After knocking down SLC35F2 in 5637 and T24 cells, cell proliferation decreased, the apoptotic rate and apoptotic protein expression increased, and the migration and invasion abilities decreased. In vivo experiments showed that the tumors that formed after knocking down SLC35F2 in nude mice were significantly smaller than those in the control group. The rapid proliferation of cells is the cause of rapid tumor growth.17 Caspase 3 and P53 are proteins related to apoptosis.18,19 Tumors invade the intestinal wall during metastasis, enter the lymphatic system or circulatory system, settle at a distal site, and induce angiogenesis.20
To study the role of SLC35F2 in BC, we investigated genes that were coexpressed with SLC35F2 by GO and KEGG analyses. With regard to biological pathways, these coexpressed genes were mainly enriched in cell division, the EGFR signaling pathway, small GTPase-mediated signal transduction, and the TGF-β receptor signaling pathway. These results indicate that genes coexpressed with SLC35F2 can participate in the progression of cancer by regulating cell division. One study showed that circular RNA ciRS-7 inhibited the autophagy of esophageal squamous cell carcinoma cells by acting as a miR-1299 sponge targeting the EGFR signaling pathway.21 Inhibitors and monoclonal antibodies can target the EGFR and TGF-β signaling pathways in breast cancer therapy.22 Small GTPase-mediated signal transduction can stimulate the immune response, control cell replication, play a role in cytoskeletal reconstruction and cell migration, and participate in protein transport.23 In the KEGG pathway analysis, the coexpressed genes were mainly enriched in BC, the calcium signaling pathway, the cAMP signaling pathway, the GnRH signaling pathway, arachidonic acid metabolism and the Rap1 signaling pathway. These results indicate that genes coexpressed with SLC35F2 may be involved in the progression of BC. These three pathways play an important role in cancer progression. Transcriptome analysis indicated that the calcium signaling pathway plays an important role in BC.24 DRD1 regulates the proliferation, migration and invasion of gliomas through the cAMP signaling pathway.25 SHARPIN promotes melanoma progression through the Rap1 signaling pathway.26 GSEA using data from the TCGA database revealed that BC, pathways in cancer, apoptosis and the P53 signaling pathway were significantly enriched in the group with high SLC35F2 expression. These results suggest that SLC35F2 may play an important role in the development of BC. Propyl isothiocyanate activates mitochondria-dependent apoptosis and the P53 signaling pathway to promote cell death of gastric cancer cells.27 We used flow cytometry to show that knockdown of SLC35F2 can induce apoptosis. GSEA indicated that the apoptotic pathway was significantly enriched in group with high SLC35F2 expression. These results suggest that inhibition of apoptosis is a crucial mechanism during which SLC35F2 plays a carcinogenic role in BC. Several studies have shown that oncogenes promote cancer cell proliferation by inhibiting apoptosis.28,29,30 Oncogenes can induce apoptosis through the P53 signaling pathway.31,32 Fasone induces BC cell apoptosis by activating the P53 signaling pathway.33 The long noncoding RNA (lncRNA) GClnc1 promotes cancer progression by inhibiting the P53 signaling pathway.34 Inotodiol inhibits cell migration and invasion and induces apoptosis via a P53-dependent pathway in HeLa cells.35
There are some limitations to this study. There are no experimental data relating to the biological mechanism. Although our results show that SLC35F2 knockdown can induce apoptosis, the exact apoptotic mechanism has not been studied. More work is needed to validate the possible mechanism of SLC35F2 in BC.
Conclusion
SLC35F2 expression is higher in BC tissues than in normal tissues, is related to invasiveness and T stage in BC, can promote the proliferation, migration and invasion of BC cells and can inhibit apoptosis. SLC35F2 may regulate the progression of BC through pathways in cancer and apoptosis and the P53 signaling pathway. SLC35F2 is an oncogene in BC and plays a crucial role in its development, thus potentially serving as a new therapeutic target for BC. However, the specific molecular mechanism of SLC35F2 in BC needs to be verified by further experiments.
Ethical Approval and Informed Consent
All procedures performed in studies involving human participants were in accordance with the 1964 Helsinki Declaration. Consent from all patients was obtained before specimen collection.
Disclosure
The authors report no conflicts of interest in this work.
References
1. Bray F, Ferlay J1, Soerjomataram I, Siegel RL, Torre LA, Jemal A. Global cancer statistics 2018: GLOBOCAN estimates of incidence and mortality worldwide for 36 cancers in 185 countries. CA Cancer J Clin. 2018;68(6):394–424. doi:10.1002/ijc.31937
2. Chavan S, Bray F, Lortet-Tieulent J, Goodman M, Jemal A. International variations in bladder cancer incidence and mortality. Eur Urol. 2014;66(1):59–73. doi:10.3390/genes8110339
3. Zhu N, Hou J, Wu Y, et al. Integrated analysis of a competing endogenous RNA network reveals key lncRNAs as potential prognostic biomarkers for human bladder cancer. Medicine (Baltimore). 2018;97(35):e11887. doi:10.1097/MD.0000000000011887
4. Clark PE, Agarwal N, Biagioli MC, et al. Bladder cancer. J Natl Compr Canc Netw. 2013;11(4):446–475. doi:10.6004/jnccn.2013.0059
5. Kiyoshima K, Akitake M, Shiota M, et al. Prognostic significance of preoperative urine cytology in low-grade non-muscle-invasive bladder cancer. Anticancer Res. 2016;36(2):799–802.
6. He L, Vasiliou K, Nebert DW. Analysis and update of the human solute carrier (SLC) gene superfamily. Hum Genomics. 2009;3(2):195–206. doi:10.1186/1479-7364-3-2-195
7. Stankovic T, Byrd PJ, Cooper PR, et al. Construction of a transcription map around the gene for ataxia telangiectasia: identification of at least four novel genes. Genomics. 1997;40(2):267–276. doi:10.1006/geno.1996.4595
8. Nishimura M, Suzuki S, Satoh T, Naito S. Tissue-specific mRNA expression profiles of human solute carrier 35 transporters. Drug Metab Pharmacokinet. 2009;24(1):91–99. doi:10.2133/dmpk.24.91
9. Winter GE, Radic B, Mayor-Ruiz C, et al. The solute carrier SLC35F2 enables YM155-mediated DNA damage toxicity. Nat Chem Biol. 2014;10(9):768–773. doi:10.1038/nchembio.1590
10. Bangsow T, Baumann E, Bangsow C, et al. The epithelial membrane protein 1 is a novel tight junction protein of the blood-brain barrier. J Cereb Blood Flow Metab. 2008;28(6):1249–1260. doi:10.1038/jcbfm.2008.19
11. Nyquist MD, Corella A, Burns J, et al. Exploiting AR-regulated drug transport to induce sensitivity to the survivin inhibitor YM155. Mol Cancer Res. 2017;15(5):521–531. doi:10.1158/1541-7786.MCR-16-0315-T
12. Go YH, Lim C, Jeong HC, et al. Structure-activity relationship analysis of YM155 for inducing selective cell death of human pluripotent stem cells. Front Chem. 2019;7:298. doi:10.3389/fchem.2019.00298
13. Liu JY, Dai YB, Li X, et al. Solute carrier family 12 member 5 promotes tumor invasion/metastasis of bladder urothelial carcinoma by enhancing NF-kappaB/MMP-7 signaling pathway. Cell Death Dis. 2017;8(3):e2691. doi:10.1038/cddis.2017.118
14. Bu L, Jiang G, Yang F, Liu J, Wang J. Highly expressed SLC35F2 in non-small cell lung cancer is associated with pathological staging. Mol Med Rep. 2011;4(6):1289–1293. doi:10.3892/mmr.2011.572
15. He J, Jin Y, Zhou M, et al. Solute carrier family 35 member F2 is indispensable for papillary thyroid carcinoma progression through activation of transforming growth factor-beta type I receptor/apoptosis signal-regulating kinase 1/mitogen-activated protein kinase signaling axis. Cancer Sci. 2018;109(3):642–655. doi:10.1111/cas.13478
16. Li X, Li J, Jiang G, et al. Influence on the behavior of lung cancer H1299 cells by silencing SLC35F2 expression. Cancer Cell Int. 2013;13(1):73. doi:10.1186/1475-2867-13-73
17. Sanchez I, Dynlacht BD. New insights into cyclins, CDKs, and cell cycle control. Semin Cell Dev Biol. 2005;16(3):311–321. doi:10.3892/ijmm.2016.2504
18. Chen X, Wang P, Wang S, Li J, Ou T, Zeng X. CIZ1 knockdown suppresses the proliferation of bladder cancer cells by inducing apoptosis. Gene. 2019;719:143946. doi:10.1016/j.gene.2019.143946
19. Cui S, Tang J, Wang S, Li L. Kaempferol protects lipopolysaccharide-induced inflammatory injury in human aortic endothelial cells (HAECs) by regulation of miR-203. Biomed Pharmacother. 2019;115:108888. doi:10.1016/j.biopha.2019.108888
20. Leake I. Colorectal cancer. Understanding the routes of metastasis in colorectal cancer. Nat Rev Gastroenterol Hepatol. 2014;11(5):270. doi:10.1098/rsob.170169
21. Meng L, Liu S, Ding P, Chang S, Sang M. Circular RNA ciRS-7 inhibits autophagy of ESCC cells by functioning as miR-1299 sponge to target EGFR signaling. J Cell Biochem. 2019. doi:10.1002/jcb.29339
22. Du J, Yu Y, Zhan J, Zhang H. Targeted therapies against growth factor signaling in breast cancer. Adv Exp Med Biol. 2017;1026:125–146. doi:10.1007/978-981-10-6020-5_6
23. Xu CS, Shao HY, Liu SS, Qin B, Sun XF, Tian L. Possible regulation of genes associated with intracellular signaling cascade in rat liver regeneration. Scand J Gastroenterol. 2009;44(4):
24. Qian K, Wang G, Cao R, et al. Capsaicin suppresses cell proliferation, induces cell cycle arrest and ROS production in bladder cancer cells through FOXO3a-mediated pathways. Molecules. 2016;21:10. doi:10.3390/molecules21101406
25. Yan J, Yang R. [Dopamine receptor D1 promotes the proliferation, invasion and migration of gliomas by inhibiting cAMP signaling pathway]. Xi Bao Yu Fen Zi Mian Yi Xue Za Zhi. 2018;34(12):1116–1121.
26. Zhou S, Liang Y, Zhang X, et al. SHARPIN promotes melanoma progression via Rap1 signaling pathway. J Invest Dermatol. 2019. doi:10.1016/j.jid.2019.07.696
27. Huang L, Cai C, Dang W, Lu JH, Hu GF, Gu J. Propyl isothiocyanate induces apoptosis in gastric cancer cells by oxidative stress via glutathione depletion. Oncol Lett. 2019;18(5):5490–5498. doi:10.3892/ol.2019.10875
28. Gao H, Yu G, Zhang X, Yu S, Sun Y, Li Y. BZW2 gene knockdown induces cell growth inhibition, G1 arrest and apoptosis in muscle-invasive bladder cancers: A microarray pathway analysis. J Cell Mol Med. 2019;23(6):3905–3915. doi:10.1111/jcmm.14266
29. Chen J, Song B, Kong G. MicroRNA663b downregulation inhibits proliferation and induces apoptosis in bladder cancer cells by targeting TUSC2. Mol Med Rep. 2019;19(5):3896–3902. doi:10.3892/mmr.2019.10023
30. Wang Z, Zhou Q, Li A, Huang W, Cai Z, Chen W. Extracellular matrix protein 1 (ECM1) is associated with carcinogenesis potential of human bladder cancer. Onco Targets Ther. 2019;12:1423–1432. doi:10.2147/OTT.S191321
31. Sun H, Liu K, Huang J, et al. FAM111B, a direct target of p53, promotes the malignant process of lung adenocarcinoma. Onco Targets Ther. 2019;12:2829–2842. doi:10.2147/OTT.S190934
32. Shang L, Wei M. Inhibition of SMYD2 sensitized cisplatin to resistant cells in NSCLC through activating p53 pathway. Front Oncol. 2019;9:306. doi:10.3389/fonc.2019.00306
33. Li J, Cheng Y, Qu W, et al. Fisetin, a dietary flavonoid, induces cell cycle arrest and apoptosis through activation of p53 and inhibition of NF-kappa B pathways in bladder cancer cells. Basic Clin Pharmacol Toxicol. 2011;108(2):84–93. doi:10.1111/j.1742-7843.2010.00613.x
34. Dong YX, Pang ZG, Zhang JC, Hu JQ, Wang LY. Long non-coding RNA GClnc1 promotes progression of colorectal cancer by inhibiting p53 signaling pathway. Eur Rev Med Pharmacol Sci. 2019;23(13):5705–5713. doi:10.26355/eurrev_201907_18308
35. Zhang S-D, Yu L, Wang P, et al. Inotodiol inhibits cells migration and invasion and induces apoptosis via p53-dependent pathway in HeLa cells. Phytomedicine. 2019;60:152957. doi:10.1016/j.phymed.2019.152957
 © 2019 The Author(s). This work is published and licensed by Dove Medical Press Limited. The full terms of this license are available at https://www.dovepress.com/terms.php and incorporate the Creative Commons Attribution - Non Commercial (unported, v3.0) License.
By accessing the work you hereby accept the Terms. Non-commercial uses of the work are permitted without any further permission from Dove Medical Press Limited, provided the work is properly attributed. For permission for commercial use of this work, please see paragraphs 4.2 and 5 of our Terms.
© 2019 The Author(s). This work is published and licensed by Dove Medical Press Limited. The full terms of this license are available at https://www.dovepress.com/terms.php and incorporate the Creative Commons Attribution - Non Commercial (unported, v3.0) License.
By accessing the work you hereby accept the Terms. Non-commercial uses of the work are permitted without any further permission from Dove Medical Press Limited, provided the work is properly attributed. For permission for commercial use of this work, please see paragraphs 4.2 and 5 of our Terms.