")
Back to Journals » Cancer Management and Research » Volume 11
Knockdown of nucleophosmin 1 suppresses proliferation of triple-negative breast cancer cells through activating CDH1/Skp2/p27kip1 pathway
Authors Zeng D , Xiao YS , Zhu JL, Peng CY, Liang WQ, Lin HY
Received 17 October 2018
Accepted for publication 21 November 2018
Published 21 December 2018 Volume 2019:11 Pages 143—156
DOI https://doi.org/10.2147/CMAR.S191176
Checked for plagiarism Yes
Review by Single anonymous peer review
Peer reviewer comments 2
Editor who approved publication: Dr Ahmet Emre Eşkazan
De Zeng,1,* Yingsheng Xiao,2,* Jianling Zhu,3 Chunyan Peng,4 Weiquan Liang,5 Haoyu Lin5
1Department of Medical Oncology, Cancer Hospital of Shantou University Medical College, Shantou 515031, China; 2Department of Thyroid Surgery, Shantou Central Hospital, Shantou 515000, China; 3Department of Pathology, Cancer Hospital of Shantou University Medical College, Shantou 515031, China; 4Department of Clinical Laboratory, Taihe Hospital of Hubei University of Medicine, Hubei 442008, China; 5Department of Thyroid and Breast Surgery, The First Affiliated Hospital of Shantou University Medical College, Shantou, Guangdong 515000, China
*These authors contributed equally to this work
Background: NPM1 is a multifunctional phosphoprotein that commutes between the cytoplasm and nucleus in cell cycle process, which appears to be actively involved in tumorigenesis. Herein, we sought to investigate the possible role and prognostic value of NPM1 in triple-negative breast cancer (TNBC).
Methods: An array of public databases, including bc-GenExMiner v4.0, GOBO, GEPIA, UALCAN, ONCOMINE database and Kaplan-Meier plotter, were used to investigate the expression feature and potential function of NPM1 in TNBC. Immunohistochemistry, immunofluorescence, proliferation and colony formation, flow cytometry and western-blotting assays were used to analyze and verify the function and relevant mechanism of NPM1 in TNBC tissues and cells.
Results: According to analysis from bc-GenExMiner, the expression level of NPM1 was significantly higher in basal-like subtypes than luminal-A, HER-2 or normal-like subtypes of breast cancer (P<0.0001). GOBO database analysis indicated that the expression of NPM1 in basal-A or basal-B was significantly higher than luminal-like breast cancer cells. Immunohistochemistry assay in 52 TNBC tissue samples showed that positive expression of Ki-67 was 93.5% in the high-NPM1-expression group and 66.7% in the low-NPM1-expression group, respectively (P=0.032). Proliferation and colony formation assays demonstrated that inhibition of NPM1 suppressed cell growth by approximately 2-fold and reduced the number of colonies by 3-4-fold in MDA-MB-231 and BT549 cells. Moreover, inhibition of NPM1 in MDA-MB-231 and BT549 cells increased the percentage of cells at G0/G1 phase and decreased the percentage of cells at both S and G2/M phase, as compared with control counterparts. Western-blotting results showed that down-regulation of NPM1 could elevate CDH1 and p27kip1 expression, while decrease Skp2 expression both in MDA-MB-231 and BT549 cells. In addition, high mRNA expression of NPM1 correlated with shorter RFS (HR=1.64, P=0.00013) and OS (HR=2.45, P=0.00034) in patients with TNBC.
Conclusions: NPM1 is significantly high expressed basal-like/triple-negative breast cancer and is correlated with shorter RFS and OS in this subset of patients. Knockdown of NPM1 impairs the proliferative capacity of TNBC cells via activation of the CDH1/Skp2/ p27kip1 pathway. Targeting NPM1 is a potential therapeutic strategy against TNBC.
Keywords: nucleophosmin 1, proliferation, mechanism, prognosis, triple-negative breast cancer
Introduction
Triple-negative breast cancer (TNBC), approximately accounting for 15–20% of all breast cancers, is defined by the lack of overexpression of estrogen receptor (ER) and progesterone receptor (PR), as well as the lack of overexpression or amplification of human EGF receptor 2 (HER-2).1 TNBC usually presents with more aggressive biological behavior with high propensity for early recurrence and visceral organ metastasis.2 At present, specific targeted treatment for TNBC remains unavailable and patients with this disease tend to have a poor survival outcome, particularly in advanced or metastatic settings.3,4
Nucleophosmin (NPM) is a multifunctional nucleolar phosphoprotein shuttling between the cytoplasm and nucleus during the cellular proliferation cycle.5 The functions of NPM are diverse, which has been recognized to be critically involved in mRNA processing, ribosome biogenesis, chromatin remodeling, DNA repair, regulation of apoptosis, and embryogenesis.6–8 There are existing at least two isoforms of NPM, including NPM1/B23 and NPM1.2, with the key difference of presenting either with or without 35 amino acids in the C-terminal, respectively.9 Emerging studies have progressively suggested that NPM1 was implicated in tumorigenesis depending on its expression level and genetic modifications. More recently, NPM1 was reported to be overexpressed in a variety of solid tumors including gastric, colorectal, liver, and cervical cancers.10–13
However, the exact physiological function of NPM1 in the pathogenesis and development of tumor remains controversial, as it has been reckoned to act as an oncogenic promoter and a tumor suppressor.14 For instance, study by Liu et al suggested that NPM1 promoted migration, invasion, and proliferation of colon cancer cells.11 Another study by Zhou et al indicated that higher level of NPM1/B23 predicted poorer survival in human gastric cancer.15 On the contrary, Mariana et al reported that the downregulation of NPM1 played an essential role in gastric carcinogenesis. This study also demonstrated that NPM1 protein levels were reduced in tumors from patients with distant metastasis compared to those without distant metastasis.16 More recently, an extensive tumor array analysis by Karhemo et al also supported that NPM1 exerted a tumor suppressive function in breast cancer.17
Up to now, the role of NPM1 and related signaling pathway in TNBC is not well characterized. Our preliminary analysis from a series of public databases demonstrated that the expression level of NPM1 was significantly higher in TNBC tissues and cells than other molecular subtype counterparts. In light of this, we further investigated the possible role and prognostic value of NPM1 in TNBC, with the ultimate goal of providing novel insights into the molecular underpinning of TNBC.
Materials and methods
Cell lines and cell culture
Five breast cancer cell lines, including MDA-MB-231, BT-549, MCF-7, T47D, and SKBR3 cells, were purchased from the American Type Culture Collection (ATCC) (Manassas, VA, USA). All the cells were cultured in DMEM containing 10% FBS (Thermo Fisher Scientific, Waltham, MA, USA) and were cultivated at a temperature of 37°C in an incubator with 5% CO2.
siRNAs and transfection
The siRNAs were purchased from Suzhou GenePharma Company (Suzhou, China). The siRNAs are shown in Table S1. The day prior to transfection, 1×10⁶ MDA-MB-231 or BT-549 cells were inoculated into each well of a six-well culture plate. The next day, 75 pmol of siRNA was combined with 3.75 µL of Lipofectamine 3000 (Thermo Fisher Scientific) by strictly following the manufacturer’s instructions.
Real-time PCR (RT-PCR) assay
The total RNA was extracted by the TRIzol reagent (Thermo Fisher Scientific) and then was reverse-transcribed into cDNA through utilizing the PrimeScript™ RT Reagent Kit (Takara Bio Inc., Dalian, China). All the primer sequences are listed and shown in Table S2. The mRNA levels of NPM1 were analyzed using the RT-PCR assays (SYBR Premix Ex Taq™; Takara Bio Inc.) according to the manufacturer’s instructions.
Western blotting assay
Cells were lysed in RIPA buffer (Cell Signaling Technology, Inc., Danvers, MA, USA) containing protease inhibitors. Extracted protein sample was measured by using the bicinchoninic acid Protein Assay Kit and was stored at −80°C until ready for use. The 30 µg of protein sample was separated by 8% SDS-PAGE and transferred onto a polyvinylidene difluoride membrane membrane (EMD Millipore, Billerica, MA, USA). After transferring, the polyvinylidene difluoride membrane membrane was blocked in 5% nonfat milk, with subsequent incubation in buffer with primary antibodies at 4°C overnight. The antibodies are shown in Table S3. The next day, the membrane was incubated with secondary antibodies and subjected to electrochemiluminescence detection (Applygen, Beijing, China).
Cell proliferative assay
The cells were incubated in a 96-well plate, and each well contained 1×10³ cells. Then, 10 μL of cell counting kit-8 (CCK-8) (Beyotime Biotechnology, Shanghai, China) reagent was added in each well at 0, 2, 3, 4, 5, 6, and 7 days after inoculation and cultured in a 5% CO2 and 37°C incubator for 2 h. Absorbance was measured at 450 nm using a microplate reader (BioTek Instruments, Inc., Winooski, VT, USA)
Colony formation experiment
Approximately 200 cells were cultured in each well of the six-well plates and incubated in DMEM with 10% FBS. After culturing for 14 days, cells were fixed with methanol for 30 min and stained with diluted crystal violet. Colonies exceeding 50 cells were counted. Each experiment was repeated three times.
Cell cycle analysis
The cells were synchronized by serum-free culture, and the medium was removed. Then, the cells were trypsinized, washed with PBS, and treated with 75% ethanol overnight. The next day, the cells were stained with 500 μL of propidium iodide (PI) for 30 min in the dark. Finally, the BD flow cytometer was used to measure DNA content and the data were analyzed using the FlowJo 7.6 software.
Immunofluorescence
Cells were cultured in six-well plates and treated with formaldehyde and Triton X. Then, the cells were incubated with primary antibodies (NPM1, 1:100) at 4°C overnight. The next day, the cells were incubated with secondary antibody for 1 h at the dark. Finally, the cells were stained with DAPI and observed under an immunofluorescence microscope.
Immunohistochemistry (IHC)
The 52 cases of TNBC tissue were collected from the Cancer Hospital of Shantou University Medical College. Tissue sections were deparaffinized, hydrated, and treated with EDTA (pH =8.0) and 3% H2O2. Subsequently, the sections were incubated with primary antibodies (NPM1, 1:100, and P27, 1:100) overnight at 4°C. Then, the sections were incubated with secondary antibodies at 37°C for 30 min and were visualized with DAB. NPM1 and P27 are mainly located in the nucleus. The total scores of NPM1 were calculated by staining intensity multiplied by positive cells’ scores. Positive cells’ scores were as follows: 0 point, ≤5%; 1 point, 5–24%; 2 points, 25–49%; 3 points, 50–74%; and 4 points, >75%. Intensity of staining was as follows: weak, 1 point; medium, 2 points; and strong, 3 points. The total score is divided into the following levels: –, 0 points; +, 1–4 points; ++, 5–8 points; +++, ≥9 points. “–” and “+” are considered low expressions, while “++” and “+++” are considered to be high expressions. p27 is highly expressed when the positive tumor cells exceed 50% of the tumor cells otherwise is low expression.
Clinical databases
The mRNA levels of NPM1 in different Scarff Bloom and Richardson (SBR) grade and distinct molecular subtypes of breast cancer cell lines were determined through analysis in GOBO database (http://co.bmc.lu.se/gobo/gsa.pl). The mRNA levels of NPM1 in different molecular subtypes of breast cancer were analyzed by bcGenExMiner v4.0. The mRNA expression of NPM1 in an array of tumor types was analyzed by GEPIA database (http://gepia.cancer-pku.cn/detail.php?gene=&clicktag=stageplot). The expression of NPM1 in normal and primary tumor tissue was analyzed by UALCAN database (http://ualcan.path.uab.edu/cgibin/TCGAExCorrel.pl?genenam=NPM1&cancer=BRCA). The ONCOMINE datasets (www.oncomine.org) were used to analyze the expression of NPM1 in basal-like and luminal-like breast tumors. Students’ t-test was used, and two times of fold change with the P-value of >0.01 was defined as clinically significant, as we described earlier.18 The association between the expression of NPM1 and survival, including recurrence-free survival (RFS) and overall survival (OS), was assessed through analysis in the Kaplan–Meier plotter (www.kmplot.com).19
Statistical analysis
Statistical analysis was carried out using the SPSS Version 23.0. Data from three independent experiments were presented as the mean ± SD. Statistical analysis was performed using Student’s t-test for means with normal distribution, and the clinicopathological characteristics were analyzed using Pearson’s Chi-squared test. Difference between multiple groups was analyzed by one-way ANOVA. A P-value of <0.05 was considered as statistically significant.
Results
NPM1 was significantly highly expressed in TNBC and associated with active proliferation
The GEPIA database analysis of NPM1 expression in breast cancer tissue was higher than normal tissue (Figure 1A). Moreover, NPM1 expression was markedly elevated in breast cancer vs normal samples (Figure 1B), which implied that NPM1 might play a particular role in the development of breast cancer. In bc-GenExMiner v4.0, the expression of NPM1 was significantly higher in basal-like subtype than luminal-A, HER-2, and normal-like subtypes of breast cancer (Figure 2A). Similarly, higher mRNA levels of NPM1 were found in basal-like tumors as compared to nonbasal-like tumors (Figure 2B). Moreover, similar result was found in the ONCOMINE database (Figure 1C). These results indicated that NPM1 might be an important regulator in basal-like breast tumors. We next performed the IHC assay (Figure 2C) to assess the correlation between NPM1 expression and clinicopathological parameters of 52 TNBC samples (Table 1). The positive expression of Ki-67 was 93.5% in the high-NPM1 expression group and 66.7% in the low-NPM1 expression group, respectively (P=0.032). However, the level of NPM1 expression was not associated with age, tumor size, or lymph node status between these two groups. It was, therefore, postulated that the high NPM1 level was correlated with active proliferation in breast cancer.
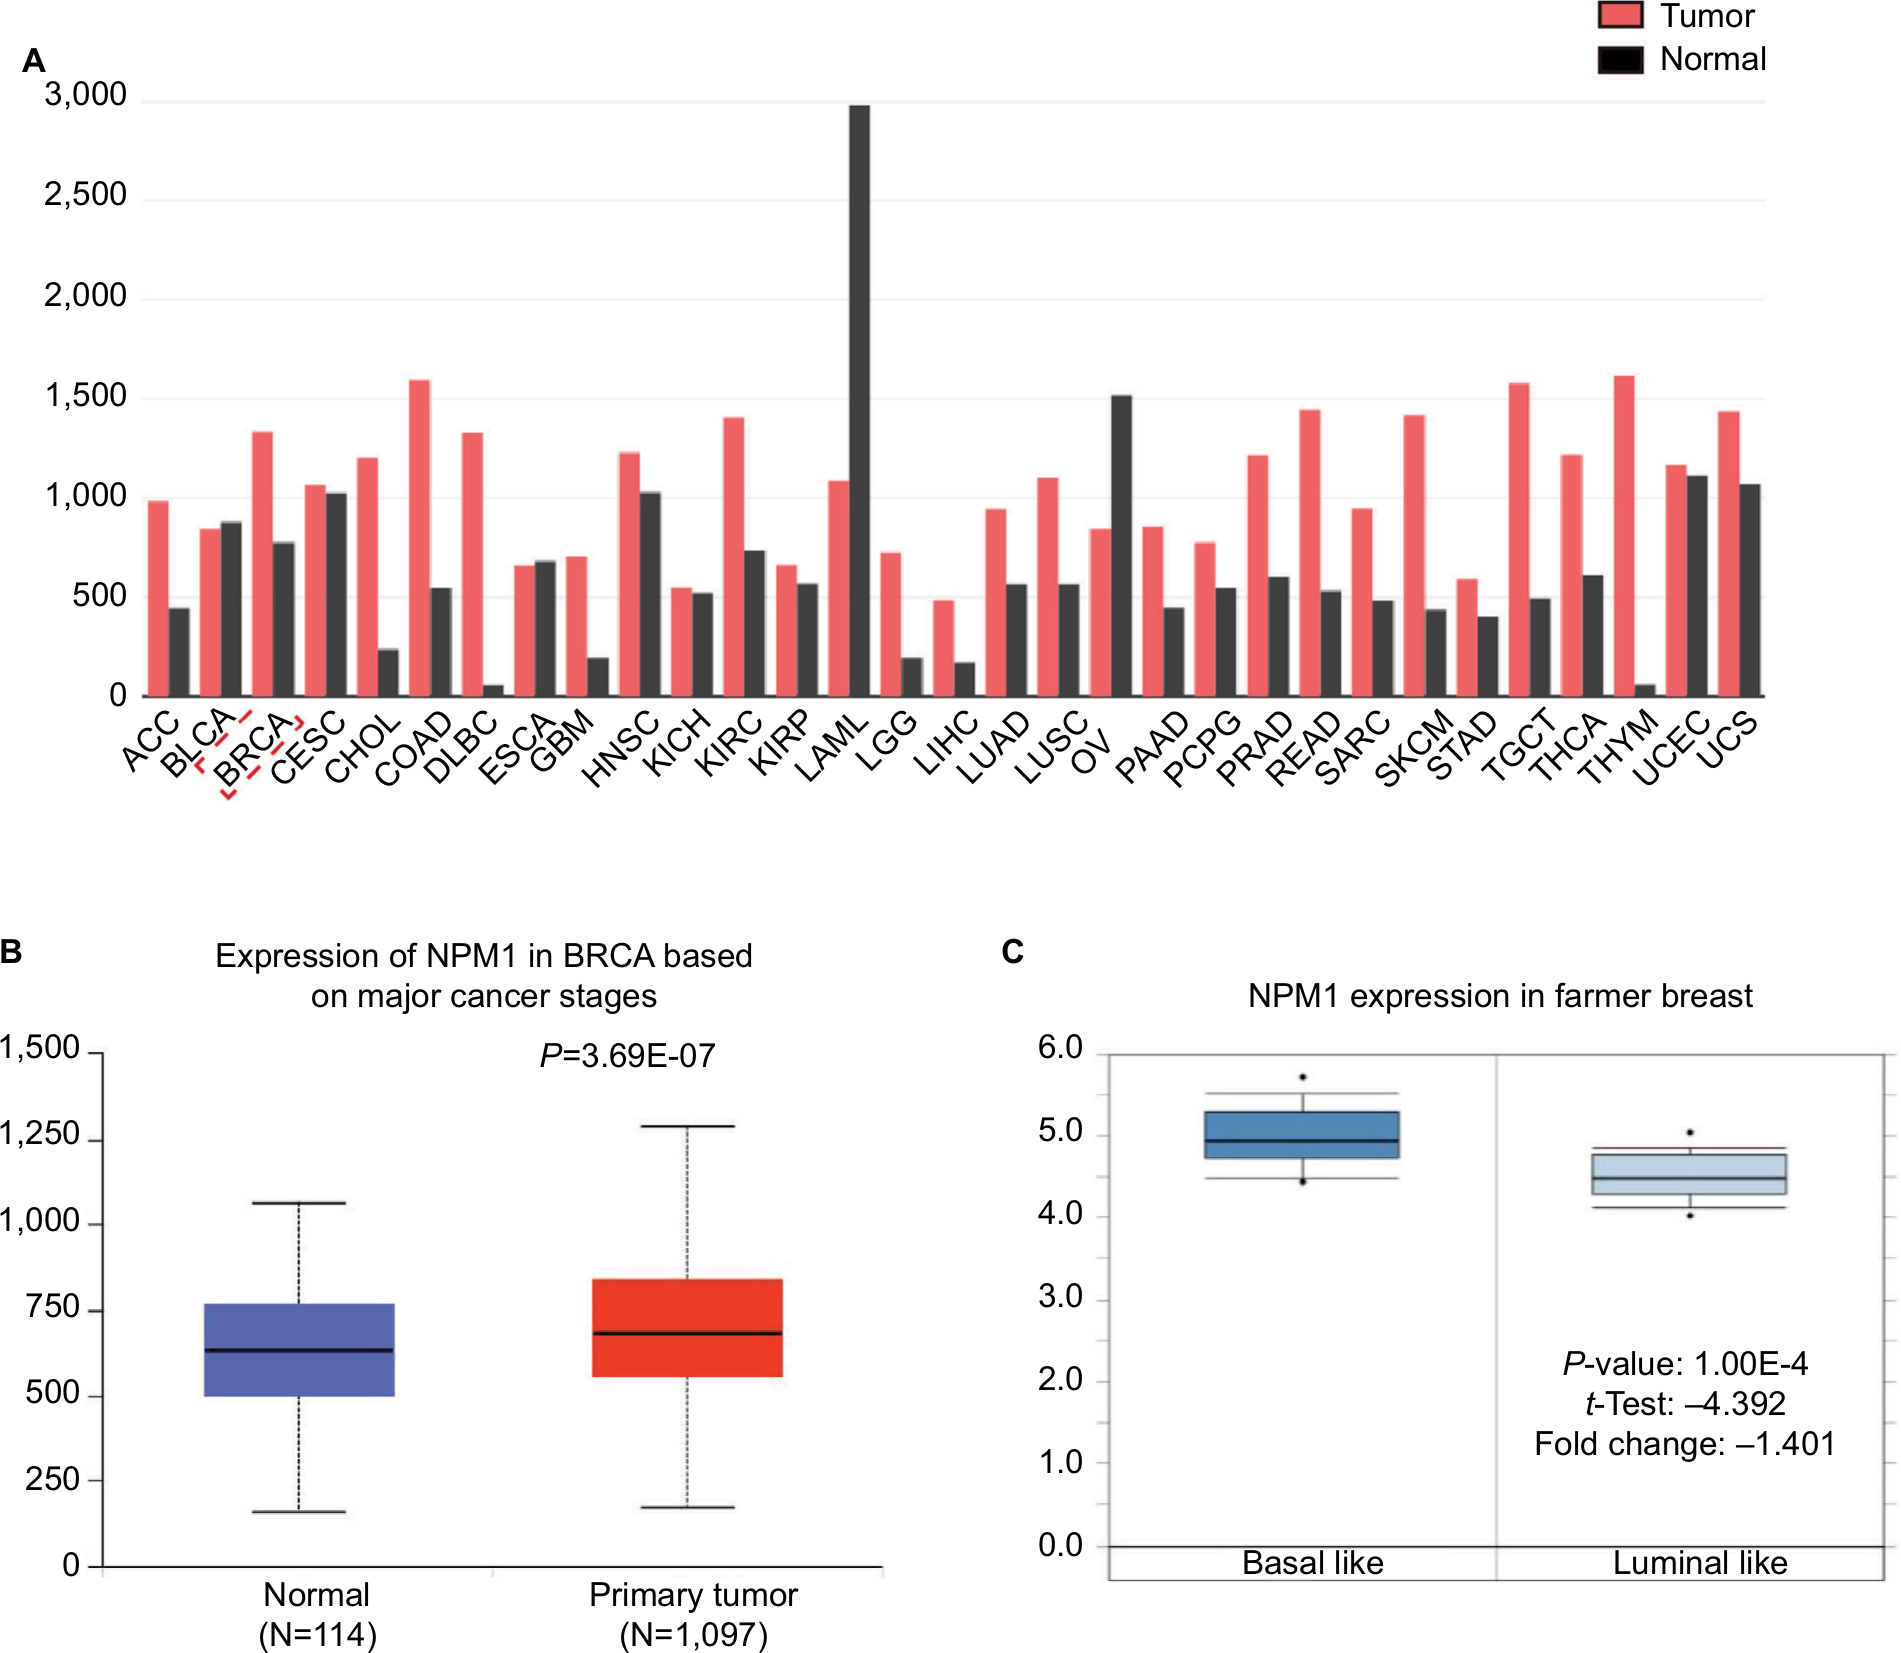 | Figure 1 Expression profiles of NPM1 in breast cancer tissue samples from an array of databases. Notes: (A) The mRNA expression of NPM1 in different tumor types. (B) The expression of NPM1 in normal and primary tumor tissues. (C) Box plots derived from gene expression data in ONCOMINE comparing the expression of NPM1 in basal-like and luminal-like tumors. Abbreviations: ACC, adrenocortical carcinoma; BLCA, bladder urothelial carcinoma; BRCA, breast invasive carcinoma; CESC, cervical squamous cell carcinoma and endocervical adenocarcinoma; CHOL, cholangiocarcinoma; COAD, colon adenocarcinoma; DLBC, lymphoid neoplasm diffuse large B-cell lymphoma; ESCA, esophageal carcinoma; GBM, glioblastoma multiforme; HNSC, head and neck squamous cell carcinoma; KICH, kidney chromophob; KIRC, kidney renal clear cell carcinoma; LAML, acute myeloid leukemia; LGG, lower grade glioma; LIHC, liver hepatocellular carcinoma; LUAD, lung adenocarcinoma; LUSC, lung squamous cell carcinoma; MESO, mesothelioma; OV, ovarian serous cystadenocarcinoma; PAAD, pancreatic adenocarcinoma; PCPG, pheochromocytoma and paraganglioma; PRAD, prostate adenocarcinoma; READ, rectum adenocarcinoma; SARC, sarcoma; SKCM, skin cutaneous melanoma; STAD, stomach adenocarcinoma; TGCT, testicular germ cell tumors; THCA, thyroid carcinoma; THYM, thymoma; UCEC, uterine corpus endometrial carcinoma; UCS, uterine carcinosarcoma. |
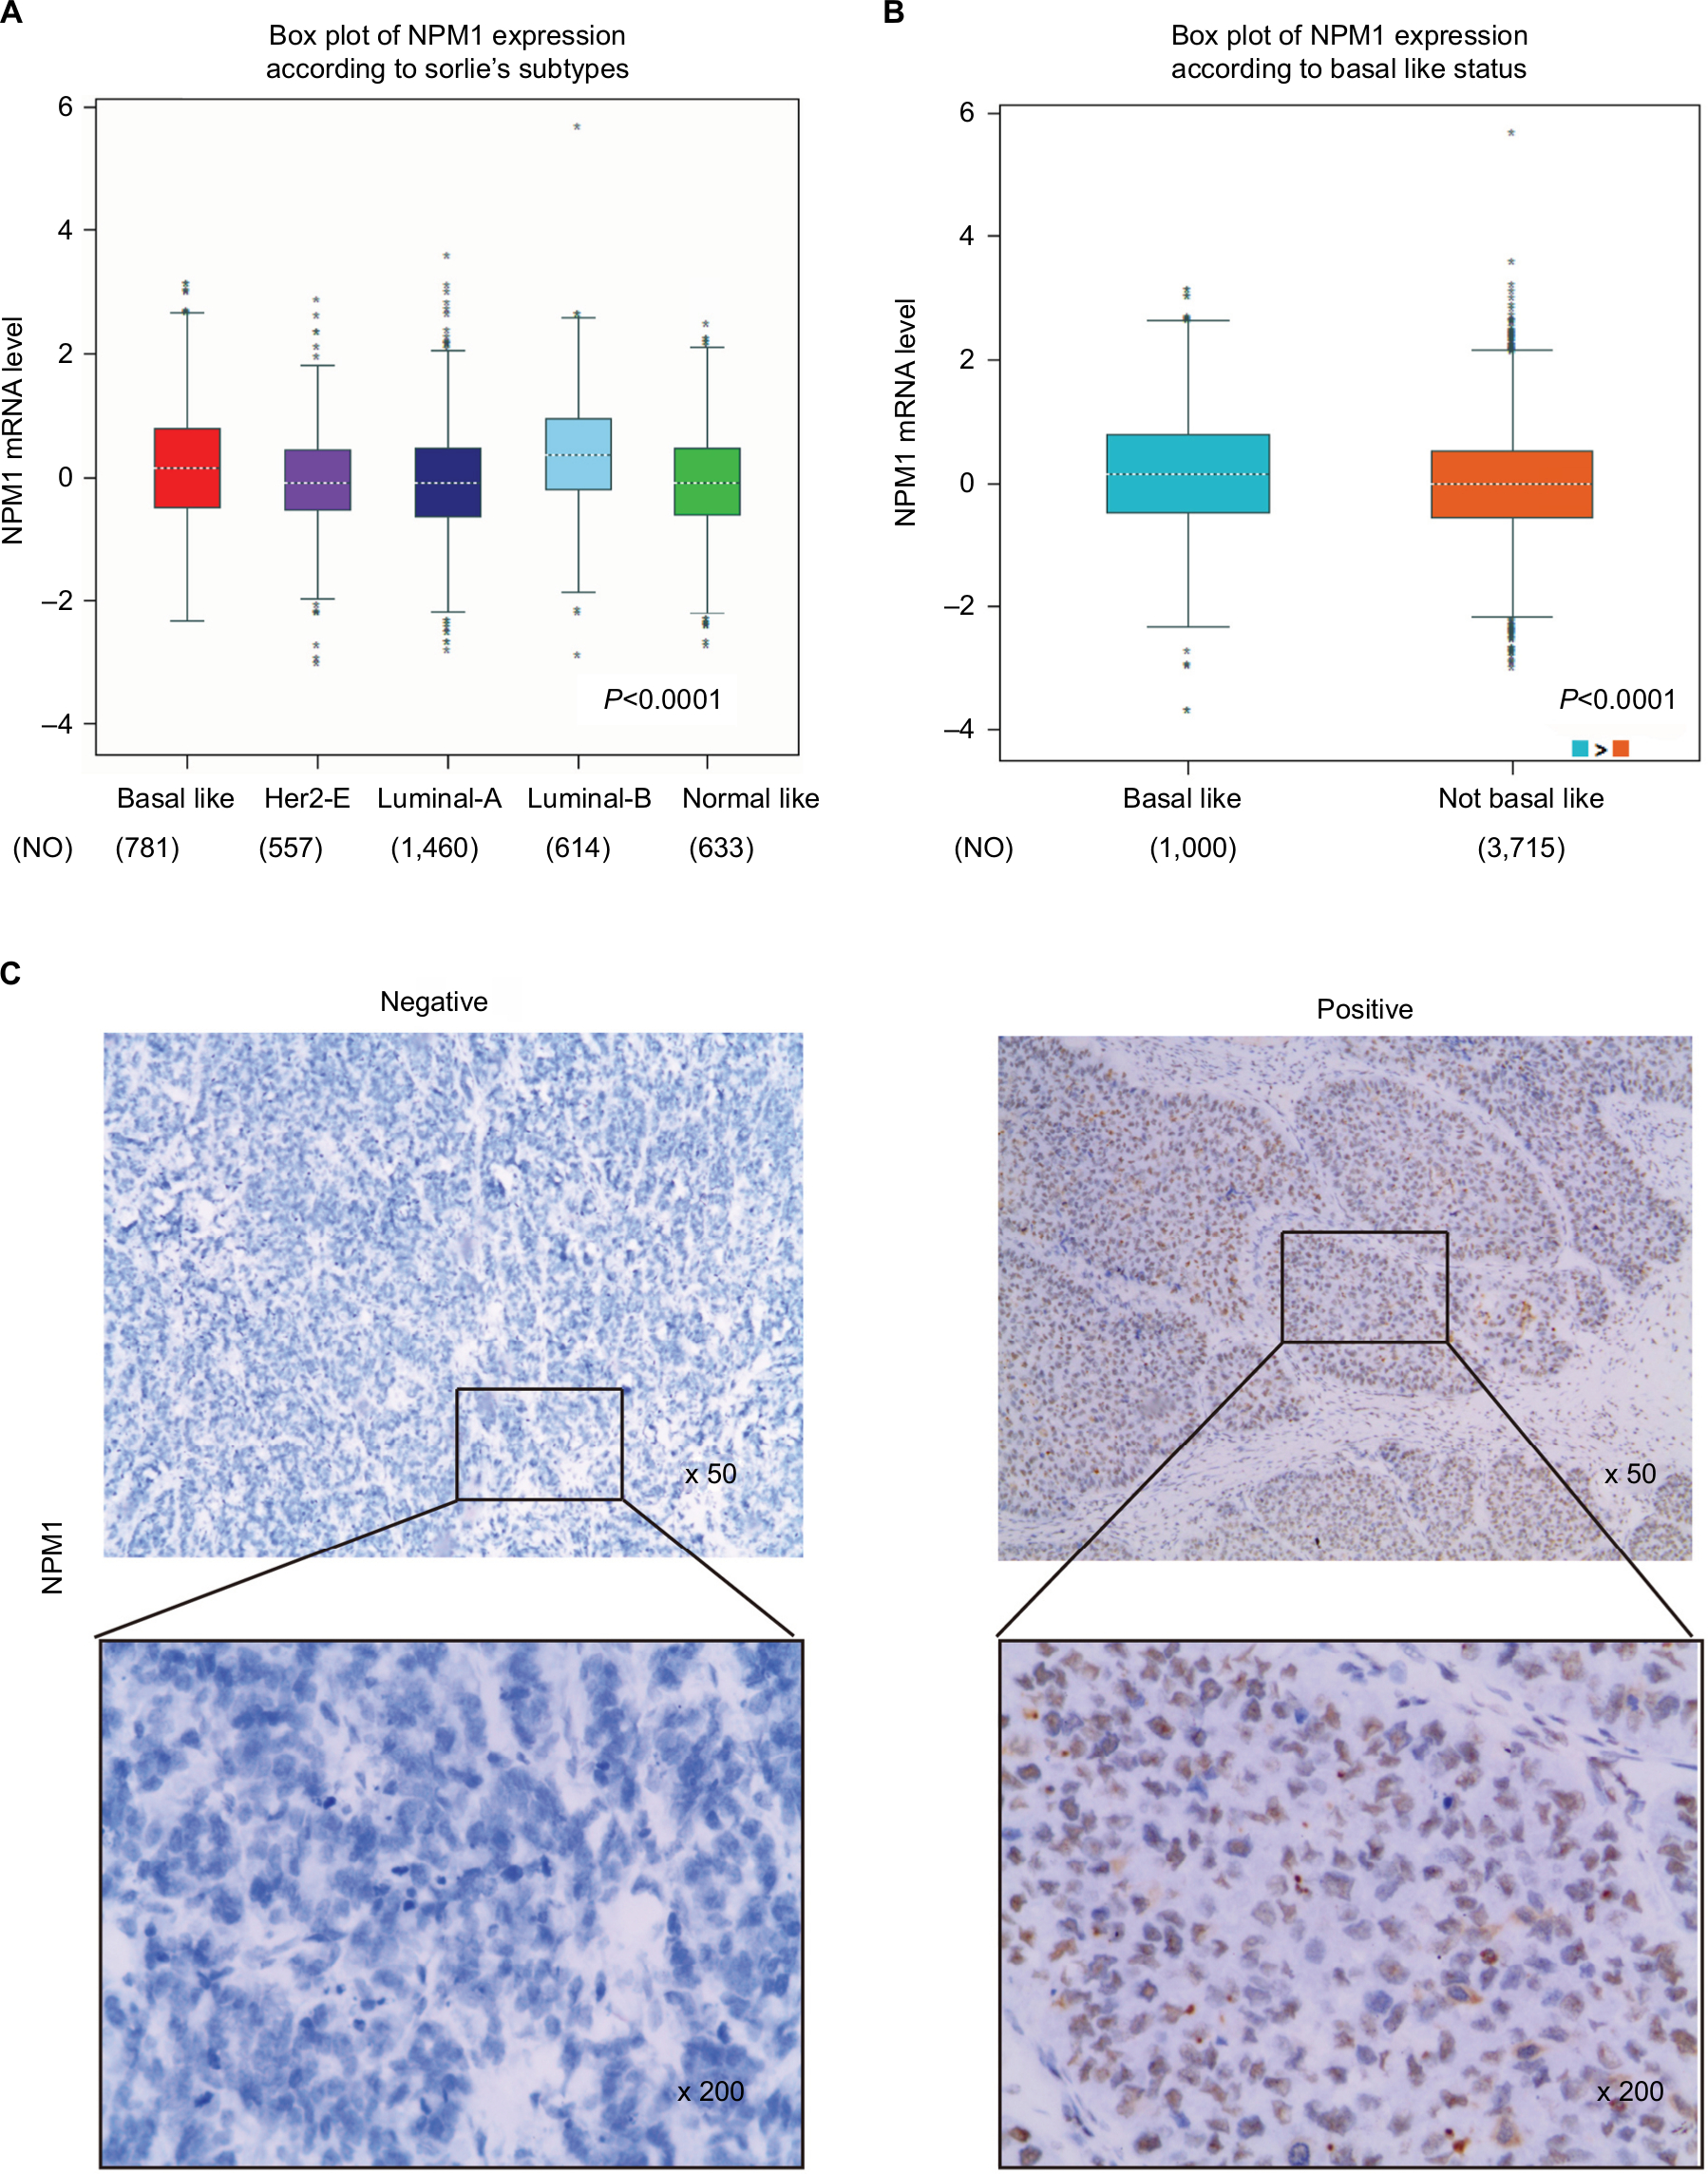 | Figure 2 NPM1 was significantly highly expressed in triple-negative breast cancer and associated with active proliferation. Notes: (A) The expression of NPM1 in ER-positive and ER-negative tumors. (B) The expression of NPM1 in several subtypes of breast cancer patients. (C) Immunohistochemical analysis of NPM1 in triple-negative breast cancer patients. Abbreviations: ER, estrogen receptor; NO, number of patients. |
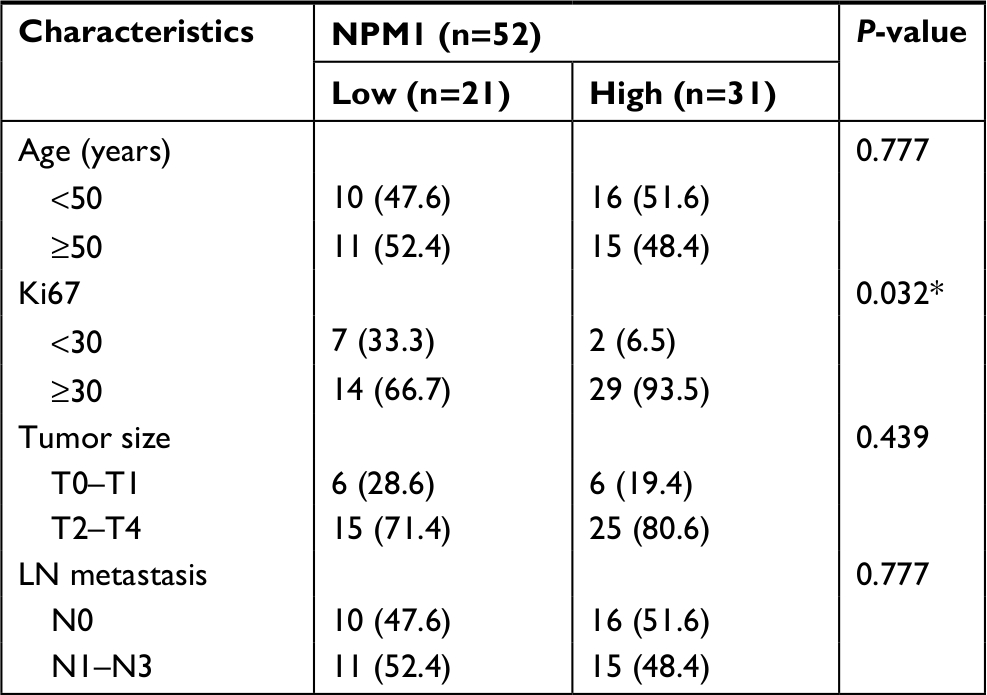 | Table 1 Clinicopathological characteristics of the breast cancer patients according to NPM1 expression Note: *P<0.05. |
NPM1 was highly expressed in TNBC cell lines
We analyzed in GOBO database that the expression of NPM1 in basal-A or basal-B was significantly higher than that of luminal-like breast cancer cells, and TNBC cells showed higher expression levels of NPM1 than hormone receptor (HR)-sensitive or HER-2-positive breast cancer cells (Figure 3A). We next examined the expression of NPM1 in cell lines by RT-PCR and immunoblotting. The mRNA and protein expressions of NPM1 were higher in TNBC cells, such as MDA-MB-231, and BT-549, and in luminal-type breast cancer cells, such as MCF-7 and T47D, the protein expression of NPM1 levels is relatively low (Figure 3B and C), and gray scale detection and statistical analysis of Western blot bands are shown in Figure S1A. We also investigated the expression and localization of NPM1 by immunofluorescence. The protein levels of NPM1 were upregulated in MDA-MB-231 cells compared with MCF-7 cells, and it was localized mainly in the nucleolus in both cells (Figure 3D). These results suggested that the expression level of NPM1 in TNBC cells was also higher than that in non-TNBC cells.
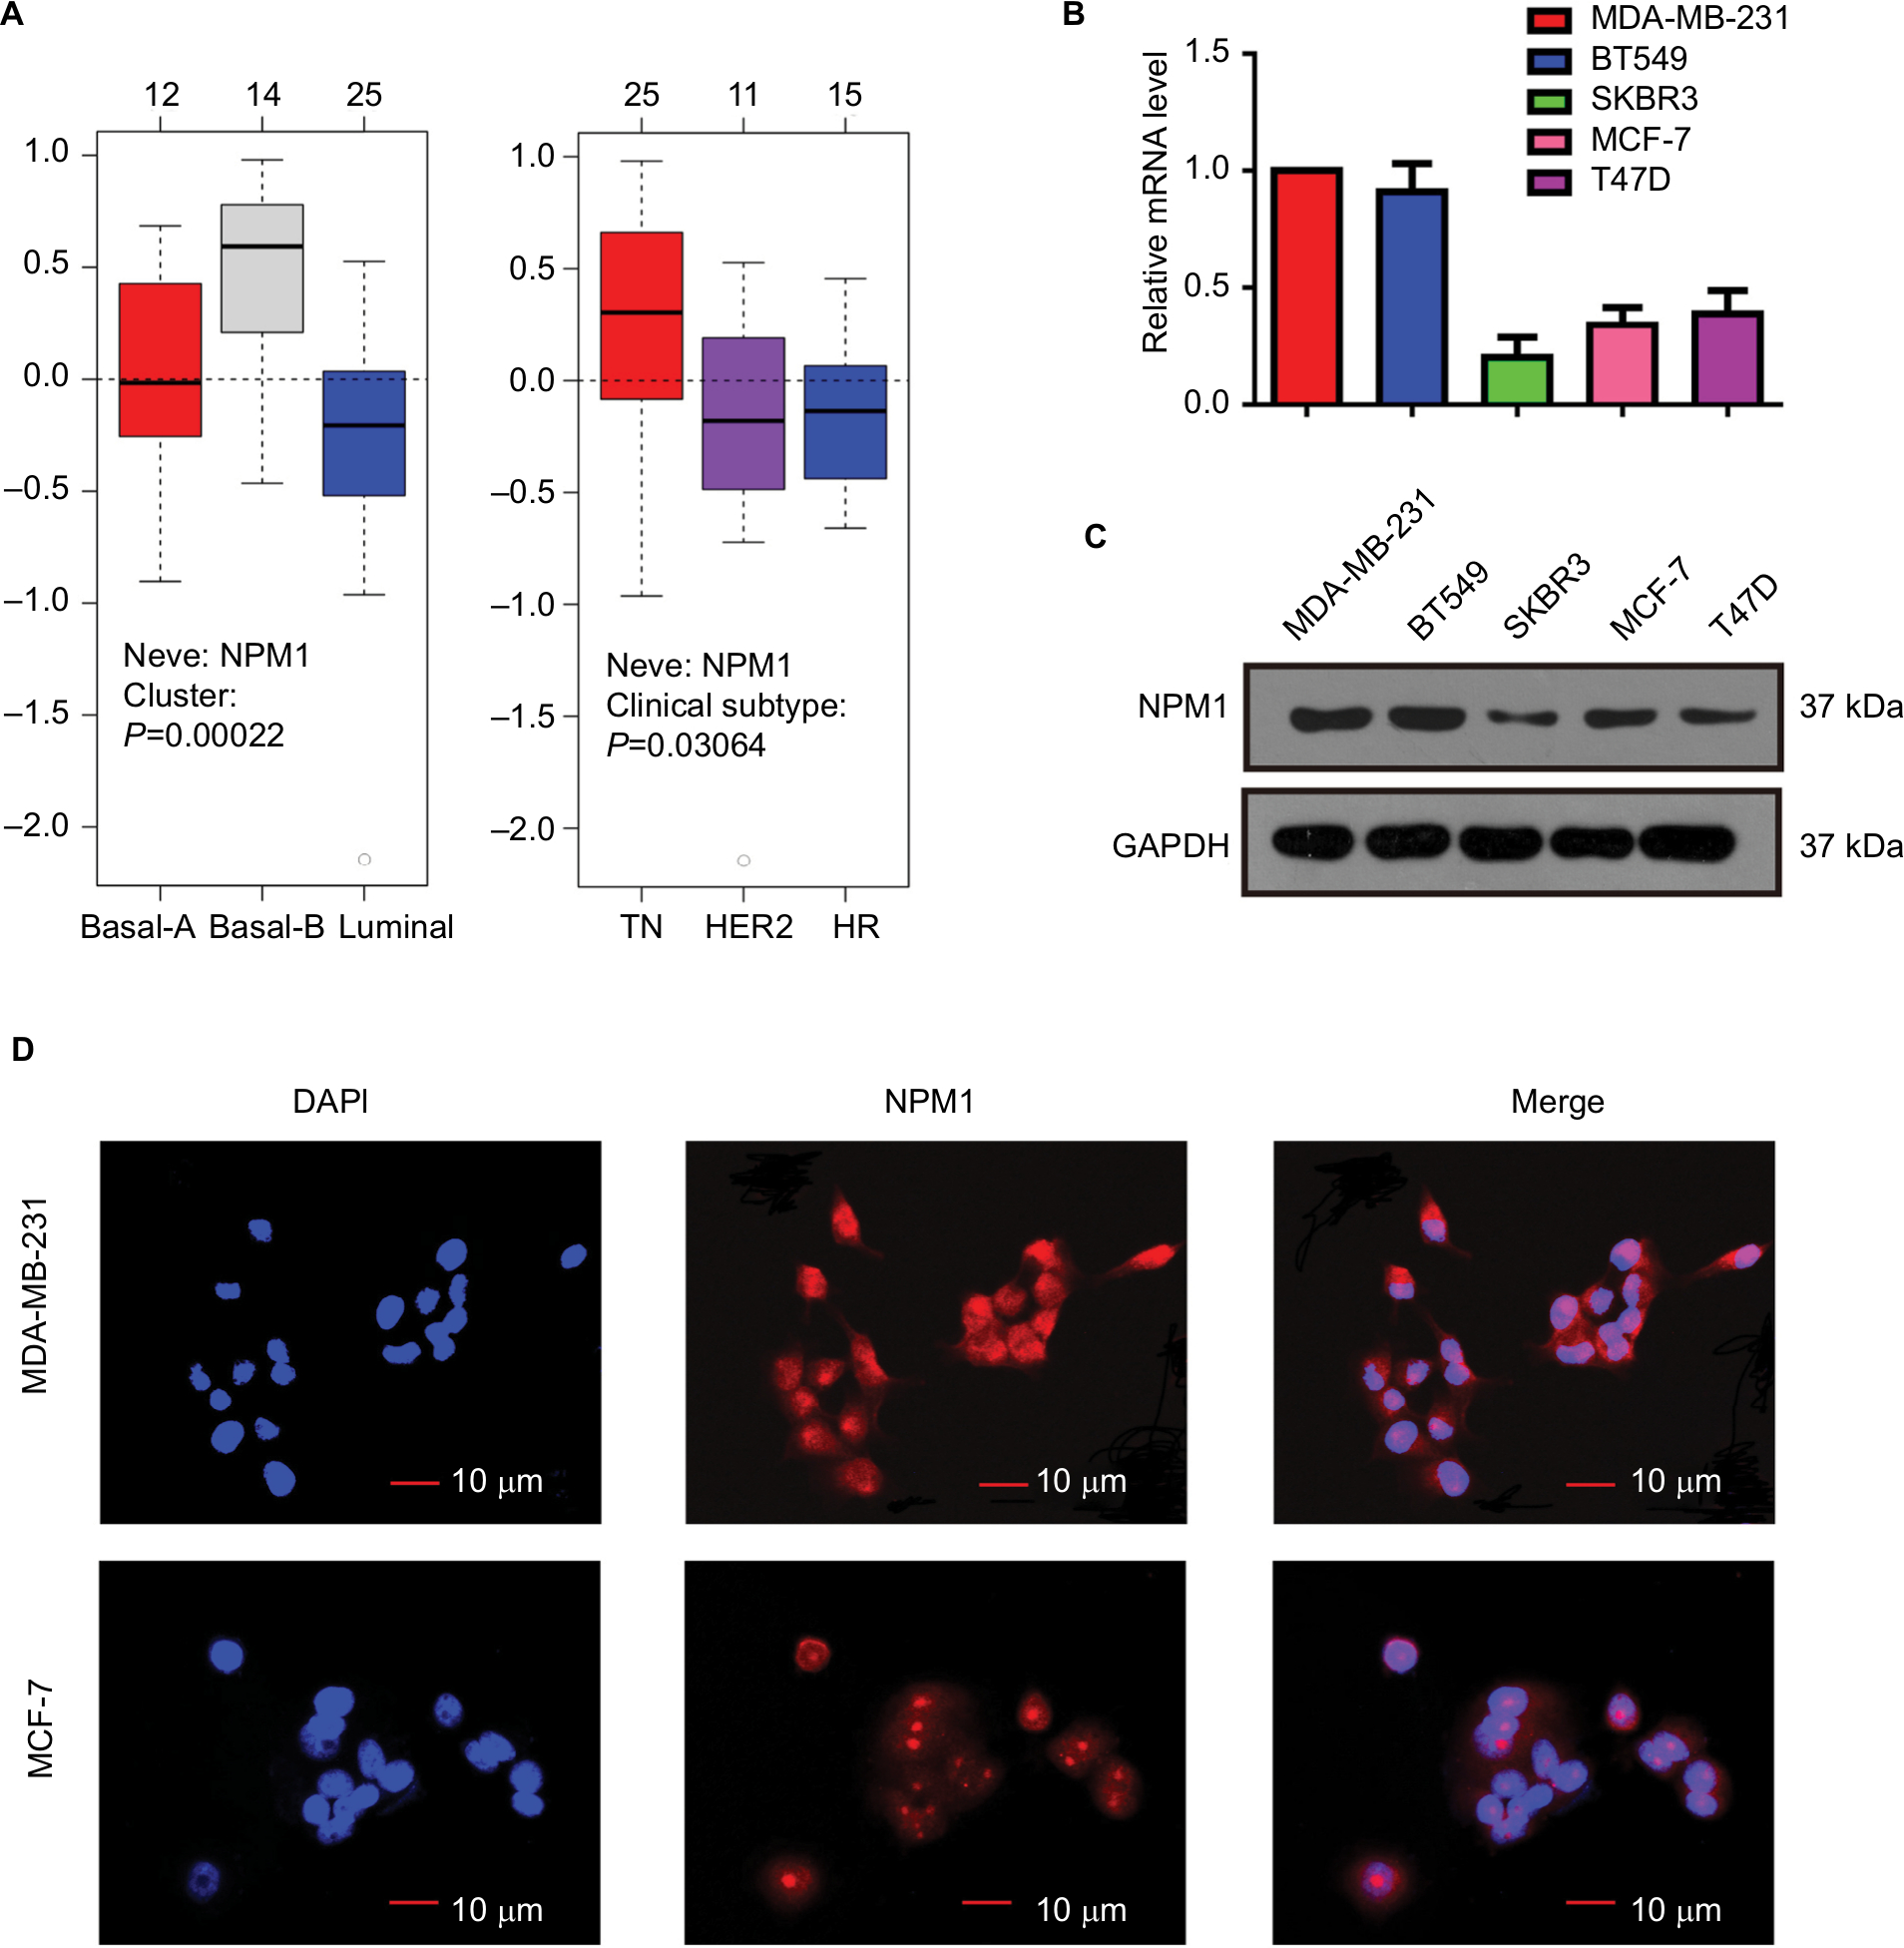 | Figure 3 Expression of NPM1 was distinct in different breast cancer cell lines. (A) NPM1 expression in different molecular subtypes of breast cancer cells using GOBO analysis. (B–C) NPM1 expression levels in various human breast cancer cell lines were tested via RT-PCR (B) and Western blotting (C). (D) Immunofluorescence of MDA-MB-231 and MCF-7 cells stained with anti-NPM1 (red signal). Abbreviations: HR, hormone receptor; TN, triple negative. |
NPM1 knockdown impaired proliferation and colony formation in MDA-MB-231 and BT549 cells
Since the above experiments have shown that NPM1 was correlated with TNBC proliferation, we verified whether NPM1 was associated with proliferative capacity in TNBC cell lines. We conducted the proliferation and colony formation assays. It was found that the inhibition of NPM1 suppressed cell growth by approximately twofold and decreased the number of colonies by three- to fourfold (Figure 4A and C) in MDA-MB-231. To exclude the possibility that these effects may be specific to MDA-MB-231 cells, the same experiment was performed in another TNBC cell line, BT549. As shown in Figure 4B and D, similar results were obtained in BT549 cells. These results implied that inhibition of NPM1 was able to suppress the proliferative capacity of TNBC cells.
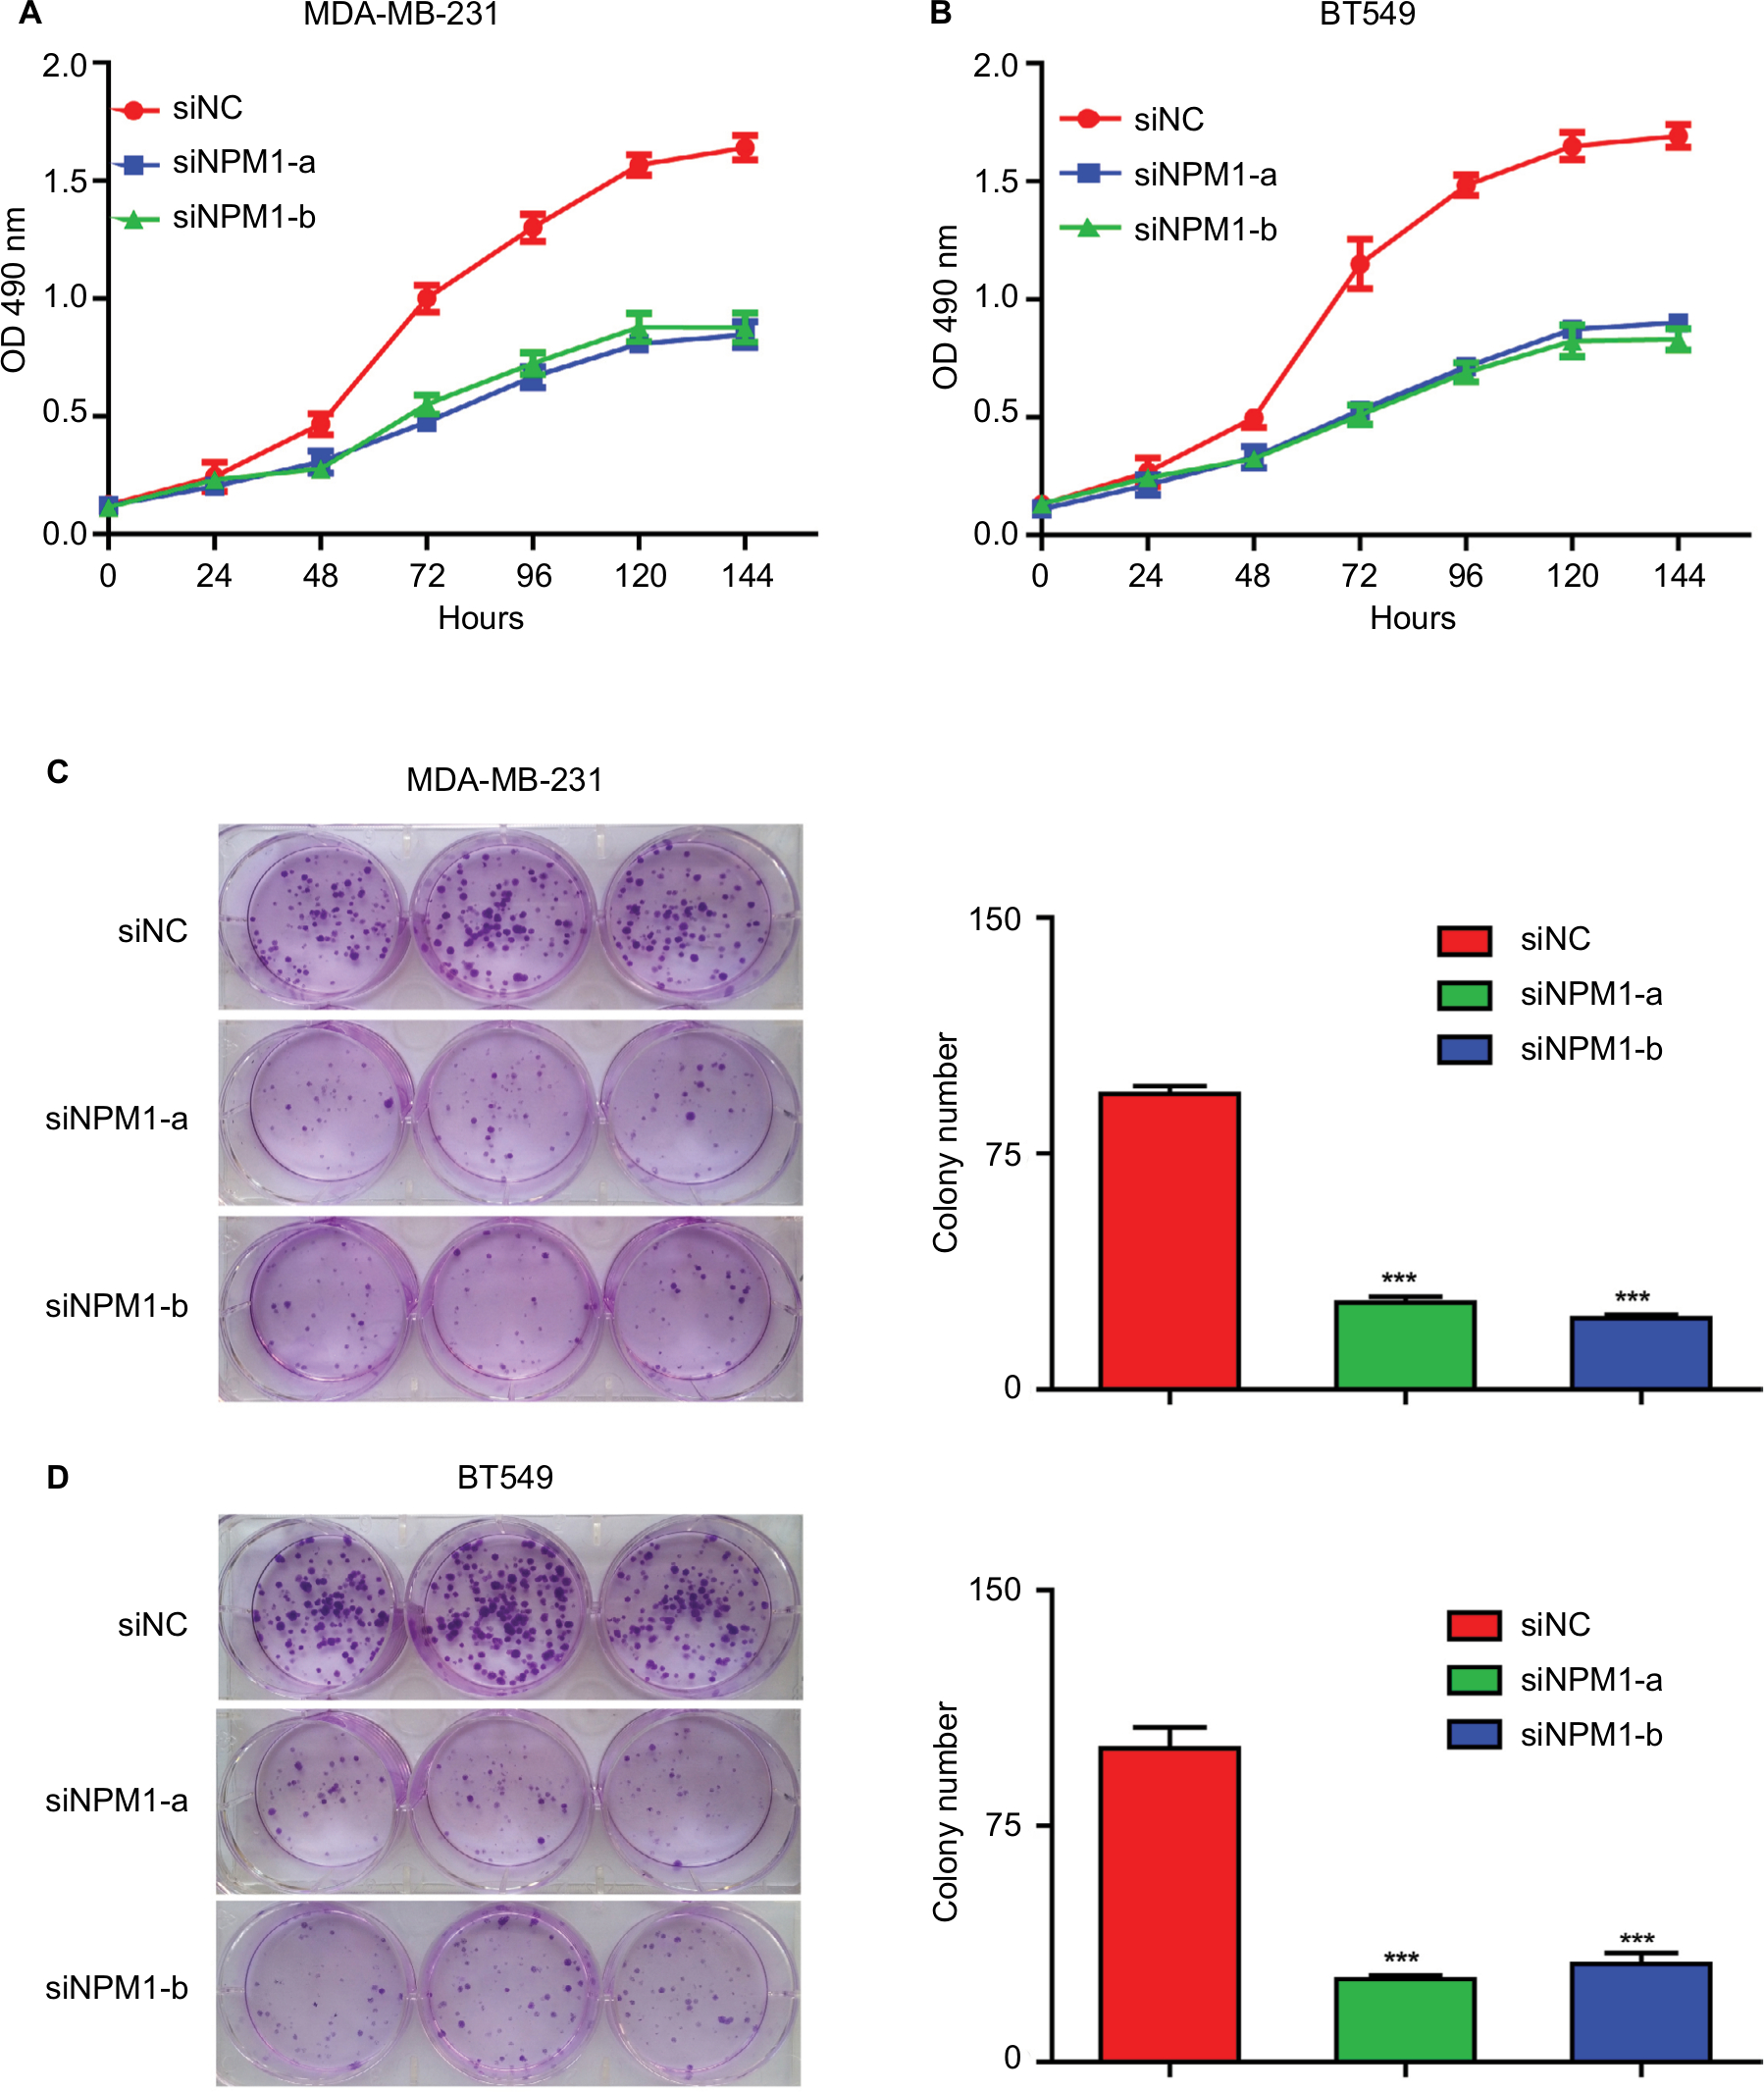 | Figure 4 Effects of NPM1 on the colony formation and cell proliferation of MDA-MB-231 and BT549 cells. Notes: (A and B) Inhibition of NPM1 inhibits cell growth in MDA-MB-231 and BT549 cells by the CCK-8 assay. (C and D) Inhibition of NPM1 decreased the number of colony formation by the colony-forming assay. Data are presented as the mean ± SEM of three experiments. ***P<0.001 as compared to control cells. Abbreviation: CCK-8, cell counting kit-8; SEM, standard error of the mean. |
Depletion of NPM1 arrested the cell cycle at the G0/G1 phase in MDA-MB-231 and BT549 cells
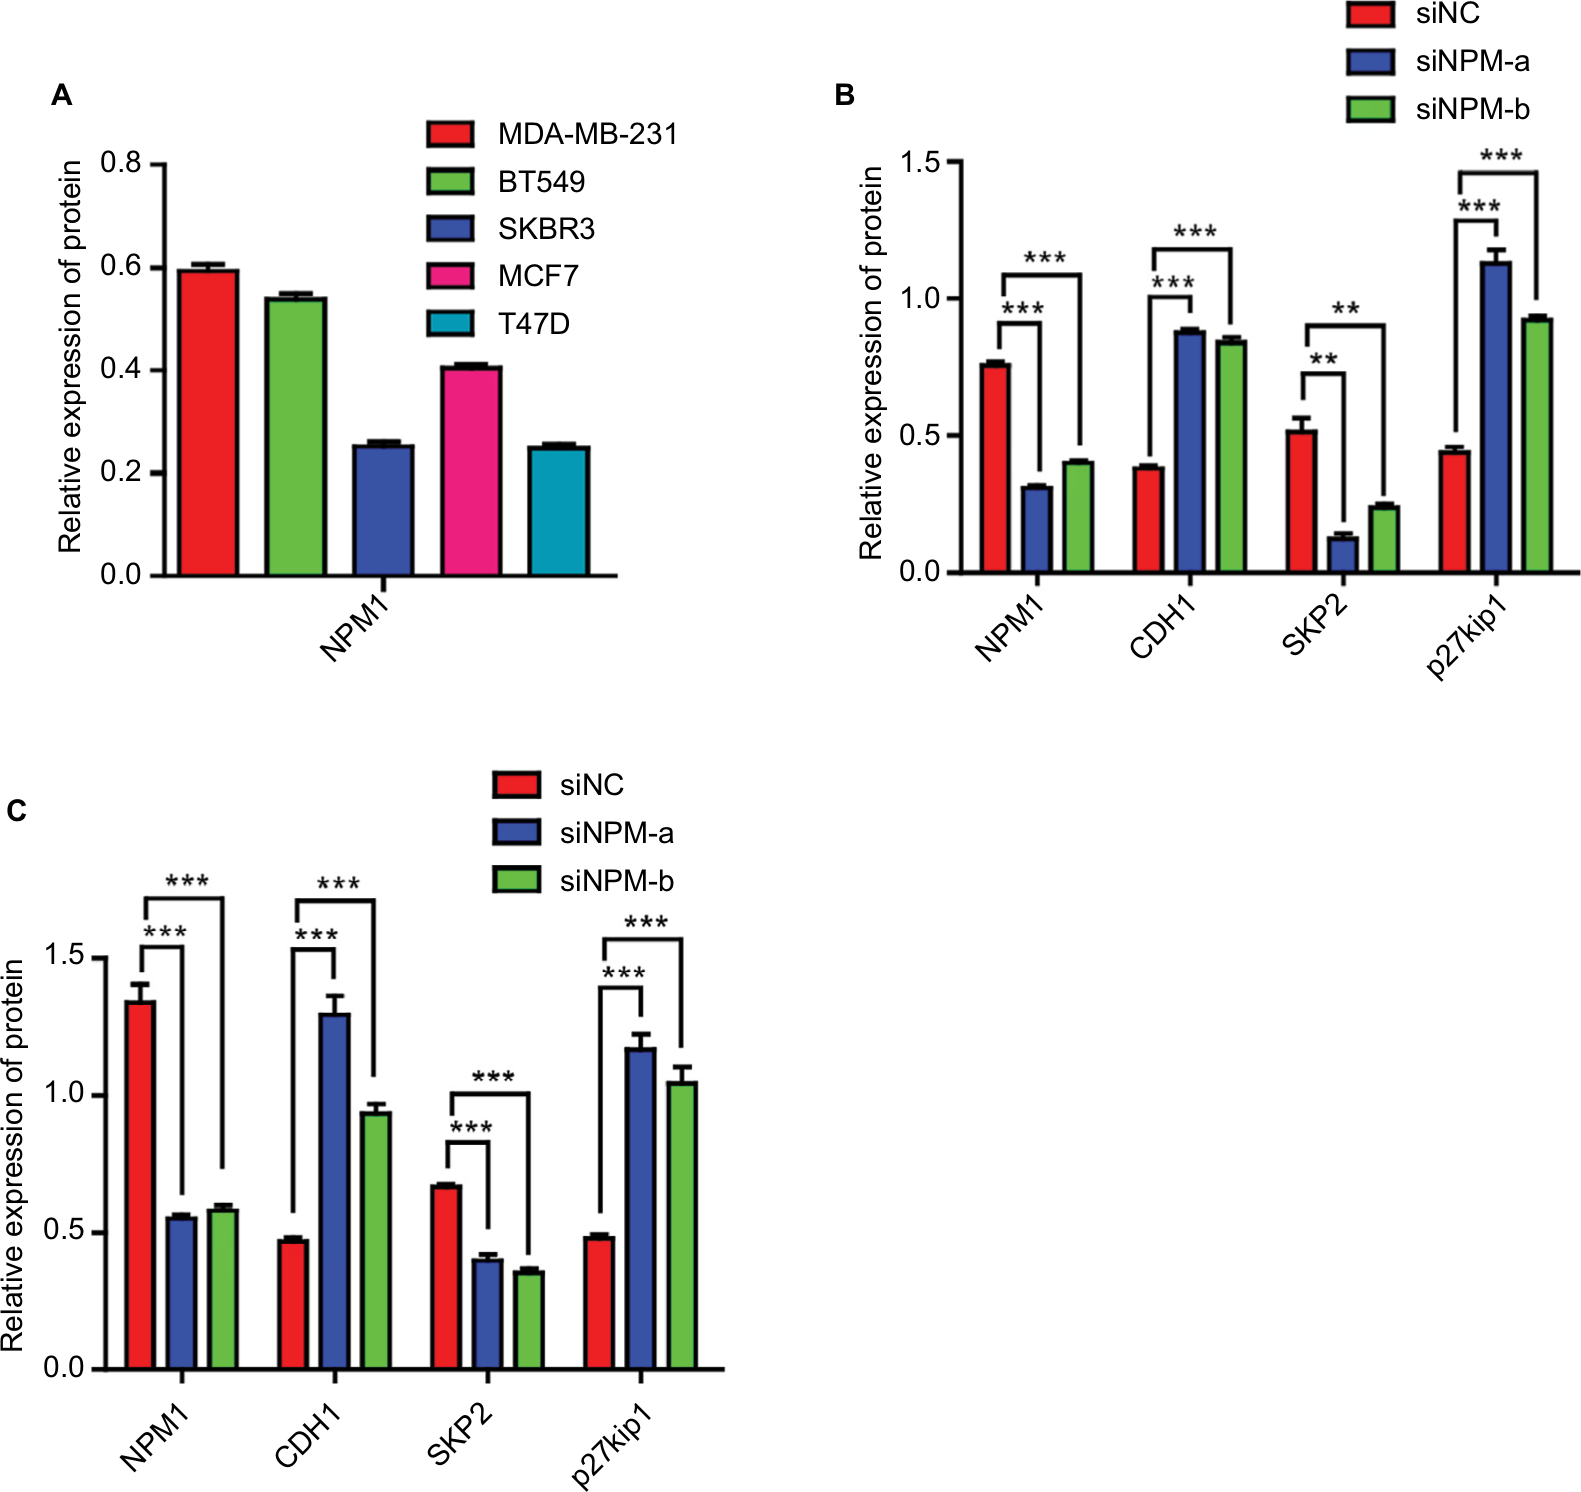
To investigate whether the effects of NPM1 on cells proliferation are related to the cell cycle regulation, we performed cell cycle assays. As shown in Figure 5A, inhibition of NPM1 in MDA-MB-231 cells increased the percentage of cells at G0/G1 phase (siNPM1-a: 54.03±1.166%; siNPM1-b: 60.43±1.282%) and decreased the percentage of cells at both S and G2/M phases as compared to control MDA-MB-231 cells (% G0/G1: 42.93±1.565%) (Figure 5A). Similarly, NPM1 knockdown in BT549 cells led to upregulated percentage of G0/G1 content (siNPM1-a: 56.79±1.293%; siNPM1-b: 61.52±0.808%) compared with control BT549 cells (% G0/G1: 49.08±1.184%) (Figure 5B). Considering that cell cycle progression was arrested at the G0/G1 phase due to the interference of NPM1, we examined several essential proteins associated with the G0/G1 phase, such as CDH1, Skp2, and p27kip1. Western blotting results showed that the inhibition of NPM1 (75.07±1.01 and 68.95±0.31% knockdown for NPM1 using siNPM1-a and siNPM1-b in MDA-MB-231 cells; 69.85±0.54 and 66.05±1.08% knockdown for NPM1 using siNPM1-a and siNPM1-b in BT-549 cells, Figure S1B and C) could upregulate the expression of CDH1 and p27kip1 and suppress the expression of Skp2 both in MDA-MB-231 and BT549 cells (Figure 5C and D). Next, we performed IHC to analyze the correction between NPM1 and p27kip1 in 52 TNBC tissue samples. The IHC result shows that the expression of NPM1 and p27kip1 had a negative correlation (P<0.005) (Figure 5E). These results suggested that depletion of NPM1 could arrest the cell cycle progression at the G0/G1 phase via CDH1/Skp2/p27kip1 pathways in TNBC cells.
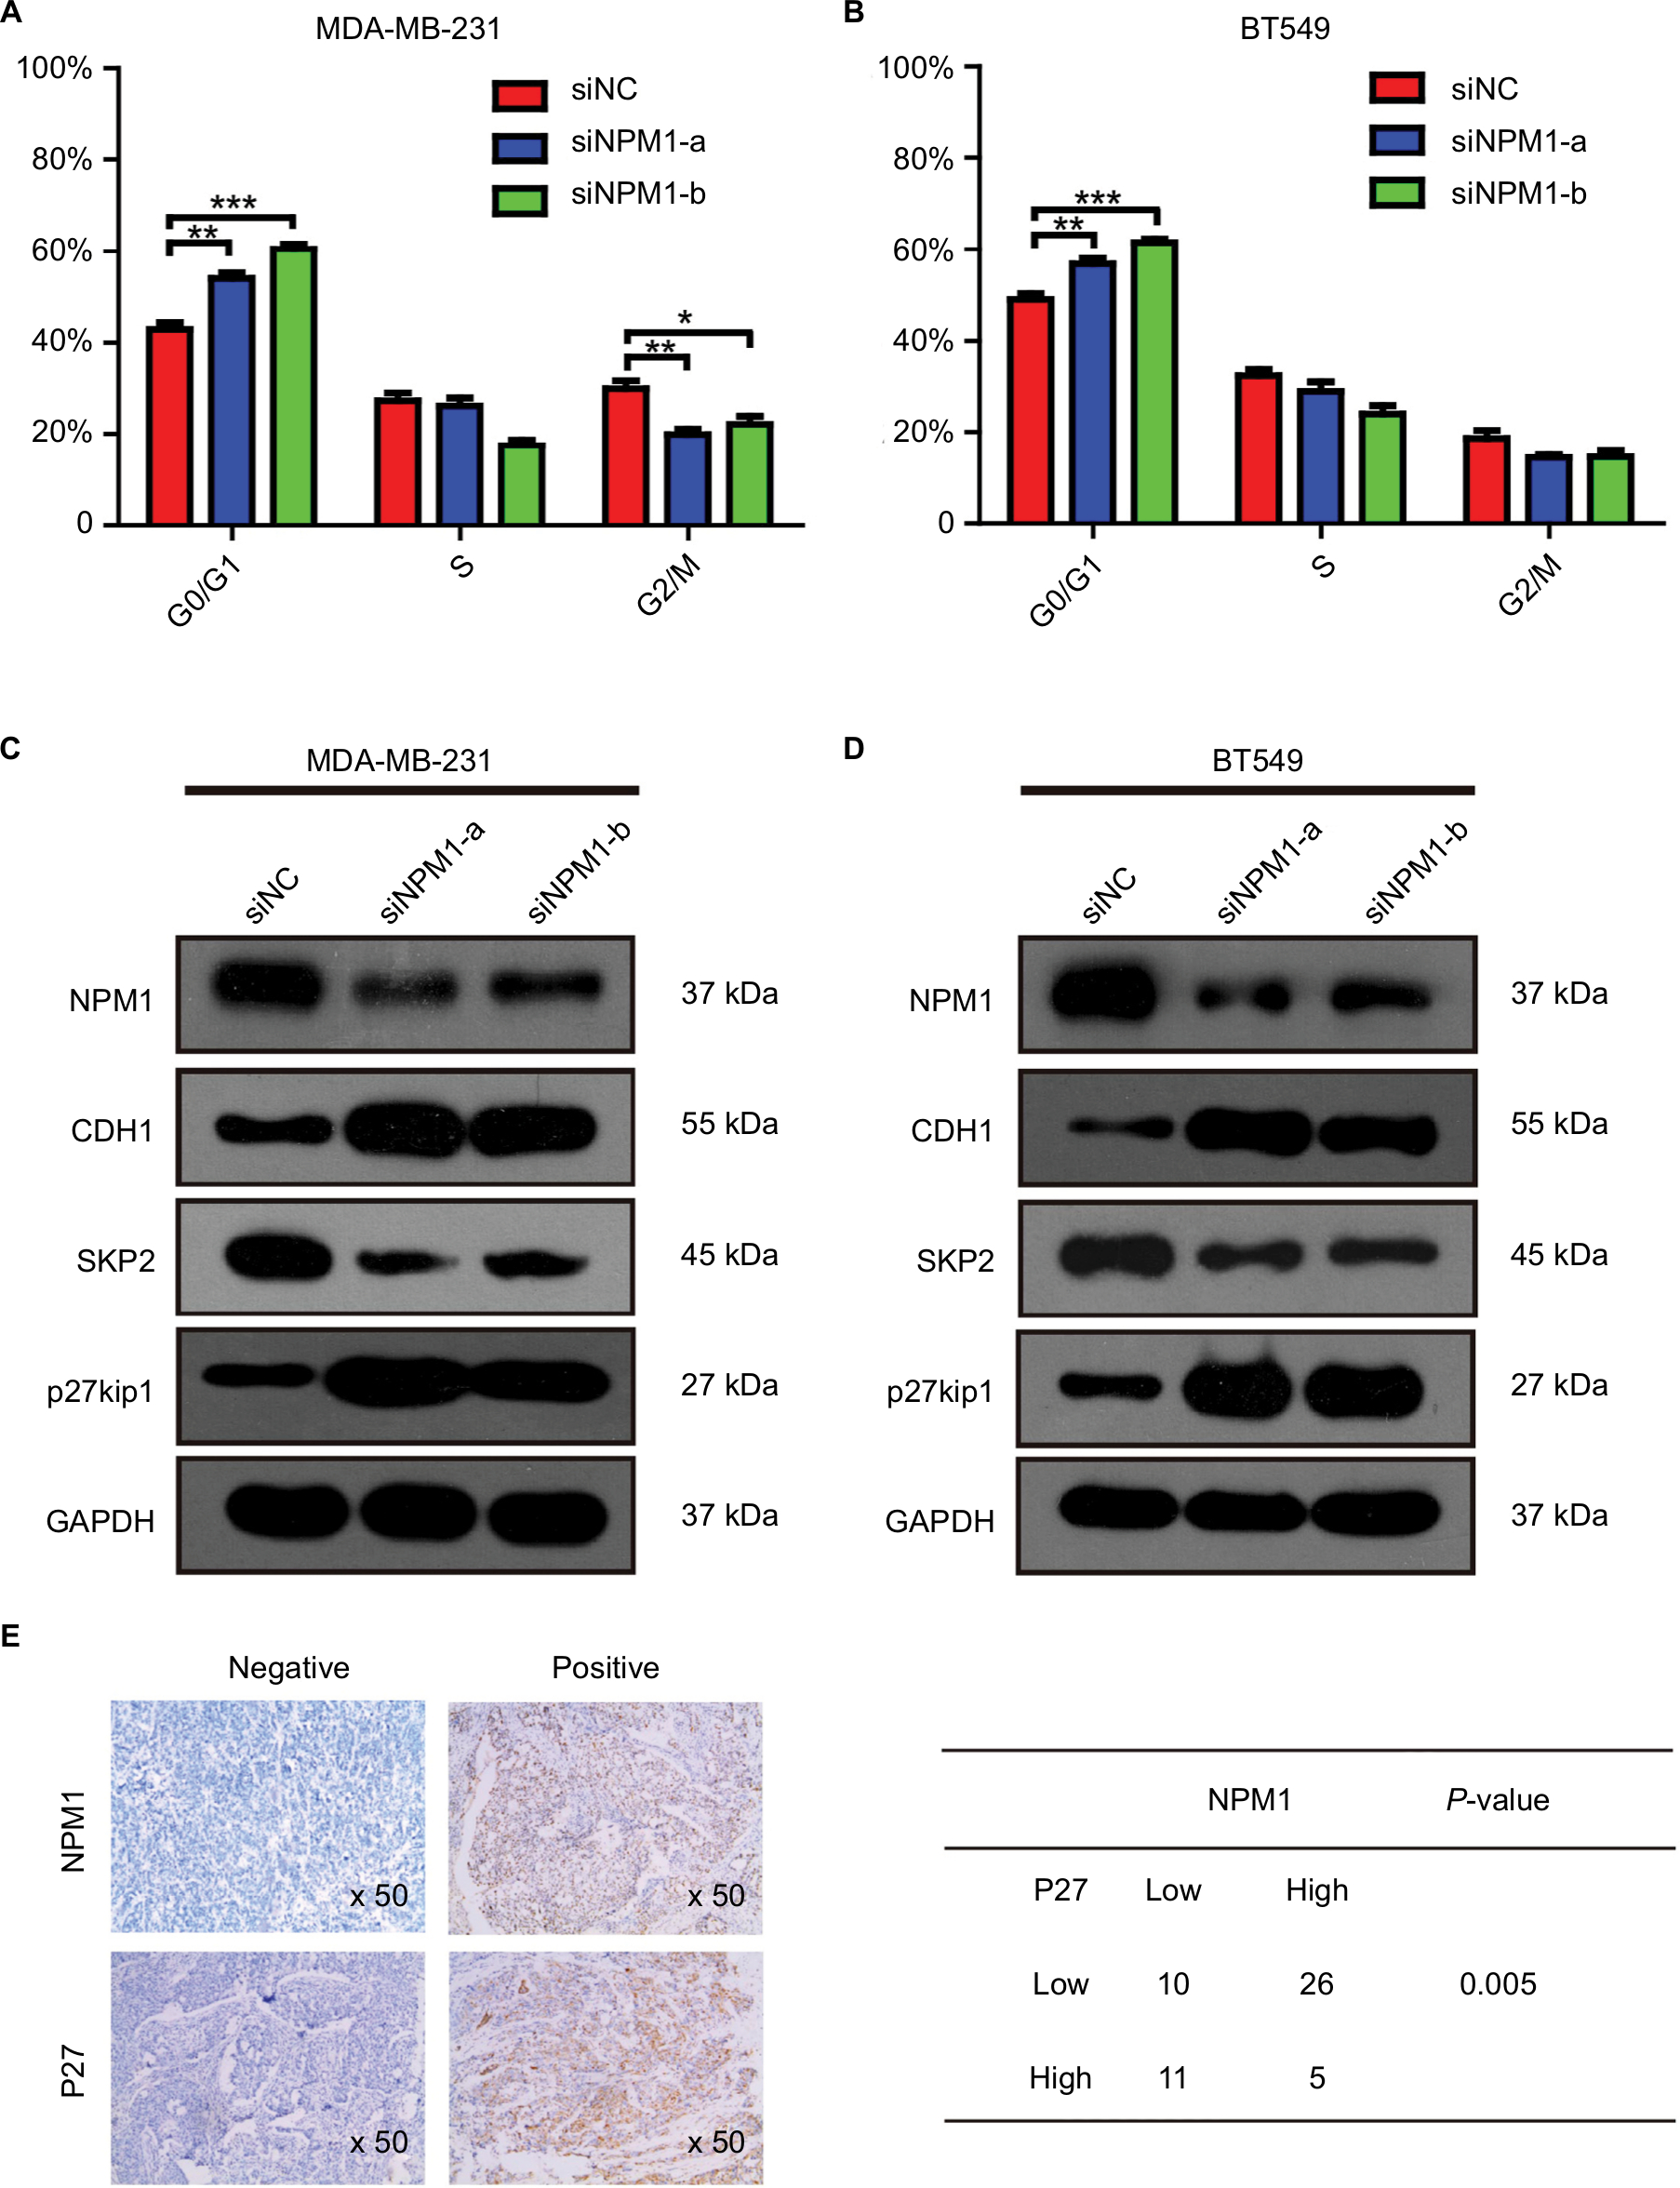 | Figure 5 Depletion of NPM1 causes cell cycle arrest at the G0/G1 phase in triple-negative breast cancer cells. Notes: (A and B) Effect of NPM1 inhibition on cell cycle in MDA-MB-231 and BT549 cells. (C and D) Protein levels of NPM1, CDH1, Skp2, and p27kip1 were detected by Western blot analysis in siNPM1-transfecetd MDA-MB-231, siNPM1-transfecetd BT549, and their control cells. (E) The IHC result shows the relationship between NPM1 and p27kip1. Data are presented as the mean ± SEM of three experiments. *P<0.05, **P<0.01, and ***P<0.001 as compared to control cells. Abbreviation: IHC, immunohistochemistry; SEM, standard error of the mean. |
Elevated NPM1 expression predicted shorter RFS and OS in BC patients, particularly in basal-like subtypes of BC patients
The above results demonstrated that NPM1 is associated with breast cancer proliferation at both cell lines and tissue samples. Next, we further examined whether NPM1 is associated with the pathological grade and survival in breast cancer. Utilizing with the public database, we found that the level of NPM1 was significantly higher in high-pathological grade breast cancer than in low-pathological grade breast cancer (P≤0.00001; Figure 6A). According to SBR grade status criterion, more advanced SBR grade was associated with higher mRNA level of NPM1 (P<0.0001; Figure 6B). We next examined the influence of NPM1 on the survival of breast cancer patients using Kaplan–Meier plotter. It was found that high NPM1 expression was significantly correlated with shorter RFS (HR =1.59, P<1E–16) (Figure 6C) and OS (HR =1.46, P=0.0015) (Figure 6E) in all breast cancer patients. Then, we selected patients with basal-like subtypes and it was found that the NPM1 mRNA high expression predicted shorter RFS (HR =1.64, P=0.00013; Figure 6D) and OS (HR =2.45, P=0.00034; Figure 6F) with greater significance. Thus, NPM1 appears to be an important indicator for predicting tumor grade and prognosis in breast cancer.
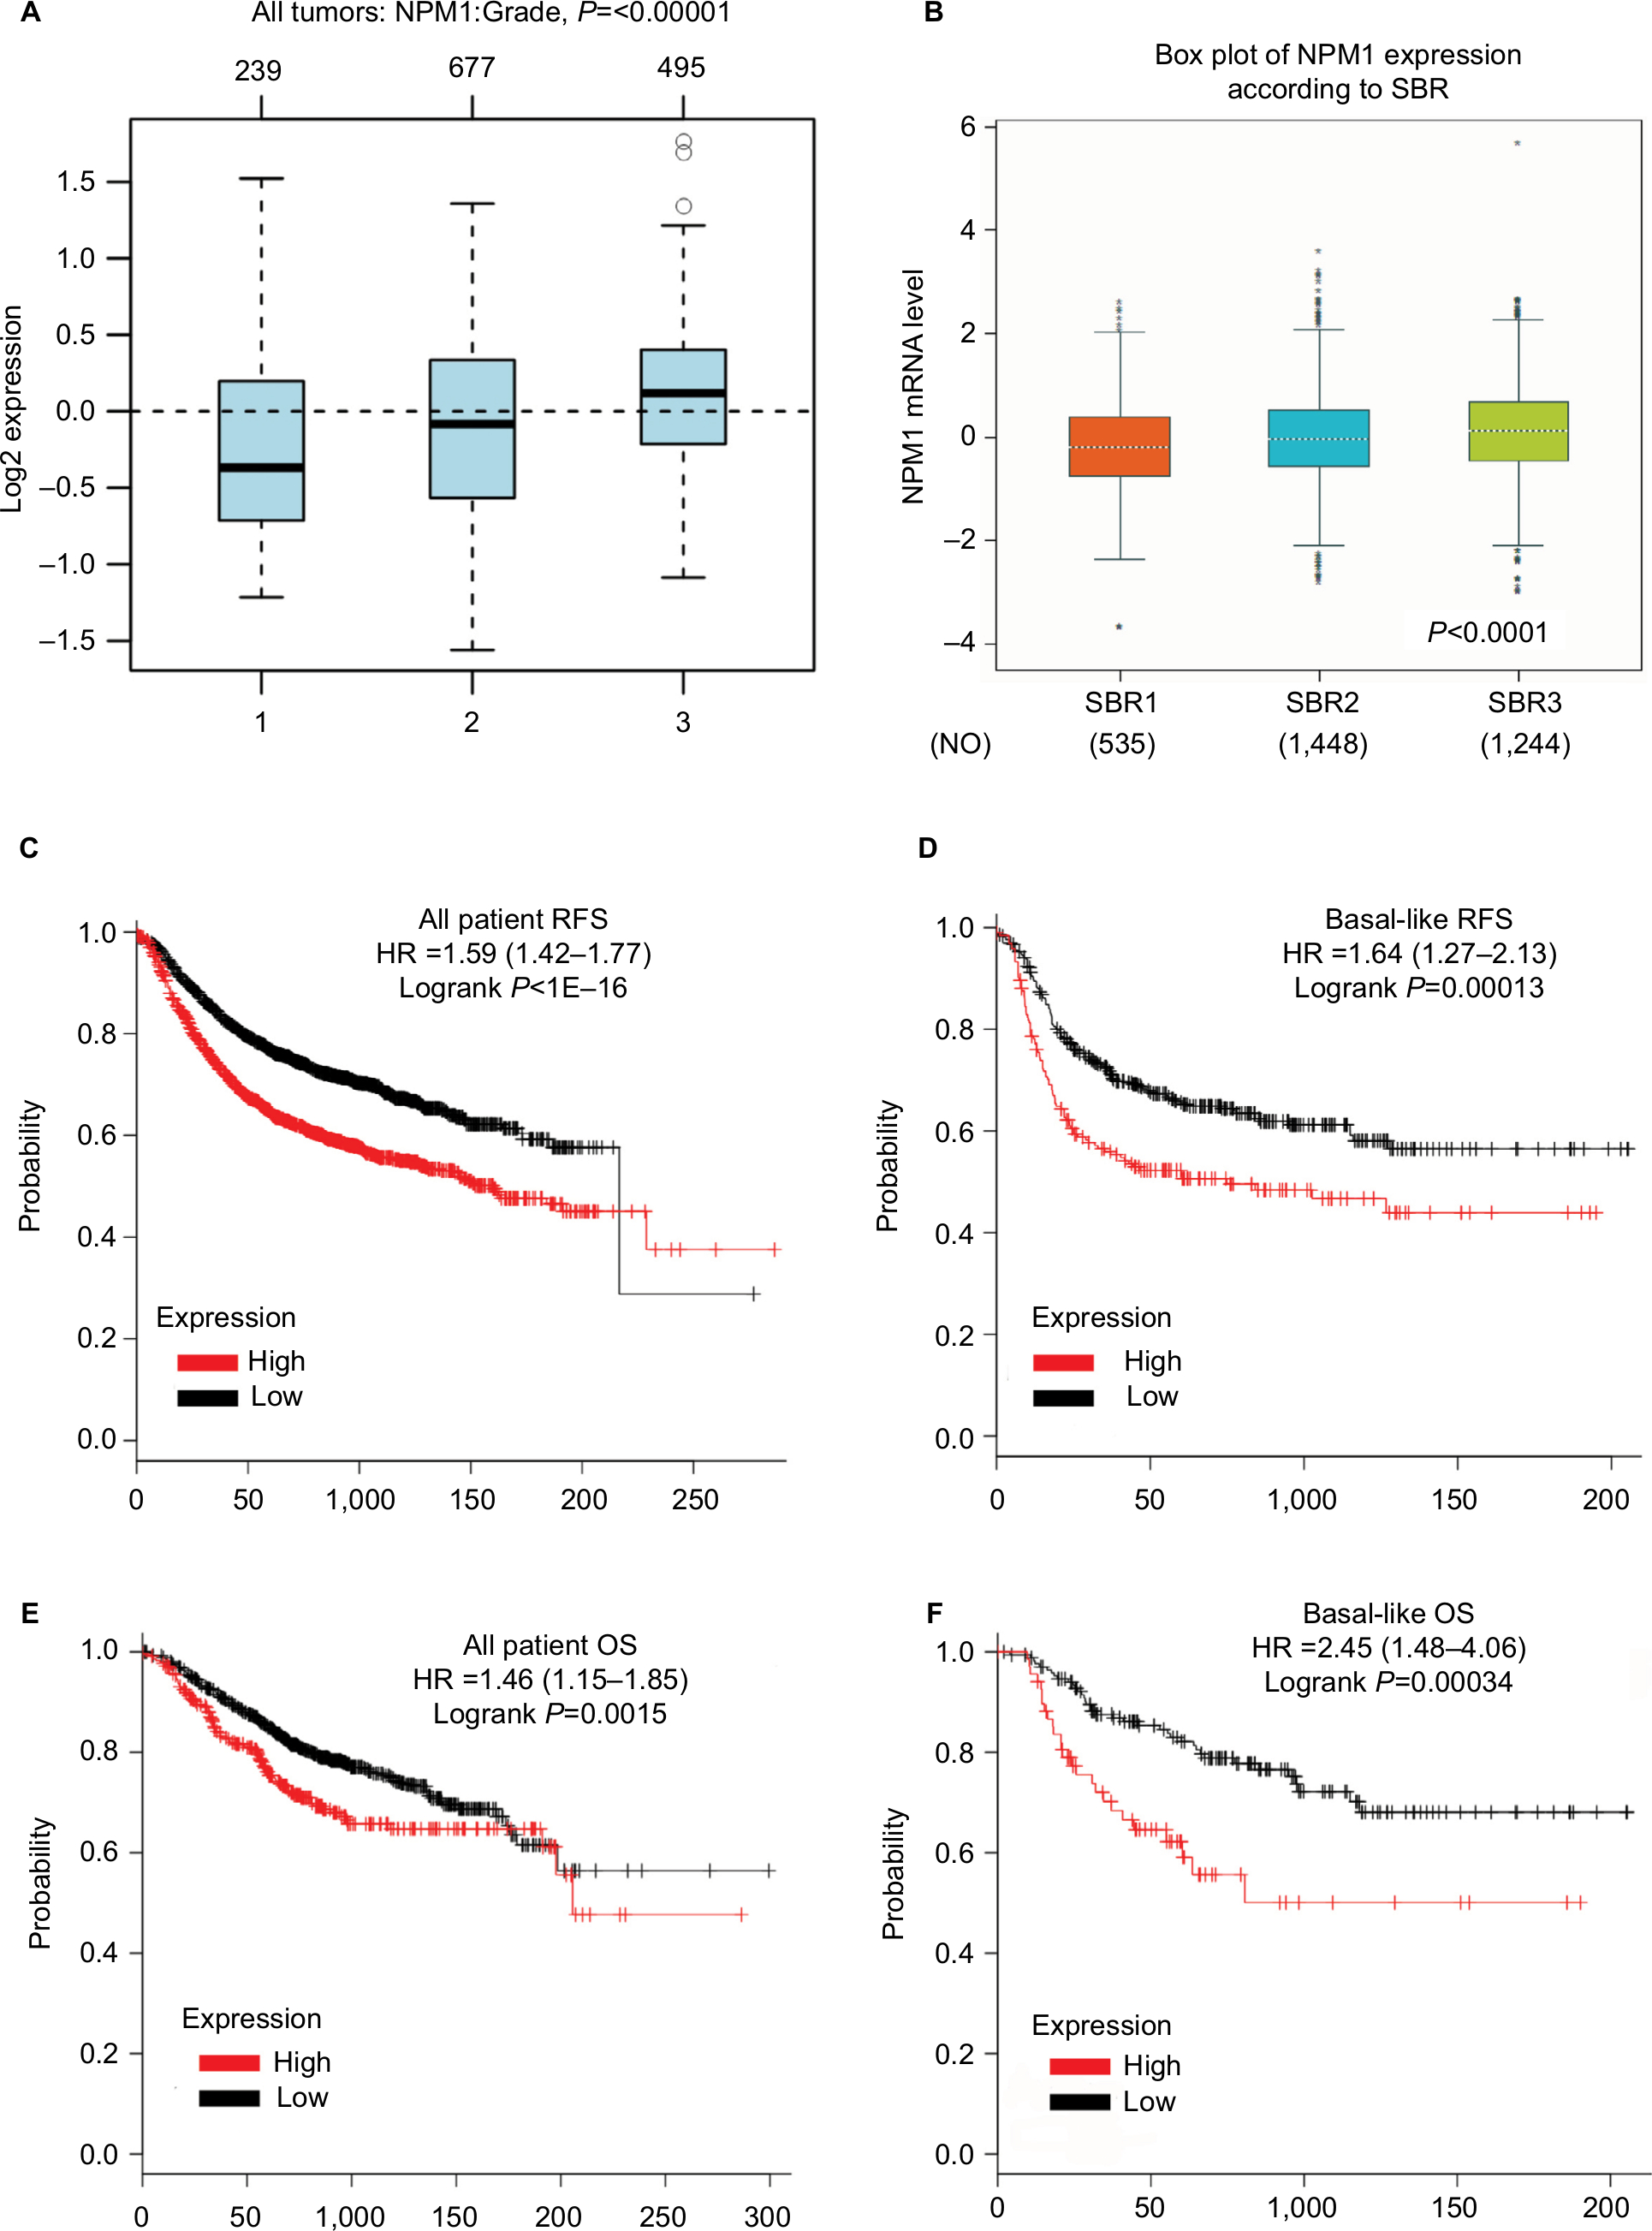 | Figure 6 The prognostic values of NPM1 in breast cancer patients. Notes: (A) NPM1 expression in breast cancer tissues of different histological grades. (B) NPM1 expression in breast cancer tissues of different SBR grade status. (C and E) High mRNA level of NPM1 was significantly associated with poorer OS and RFS in all BC patients. (D and F) Elevated NPM1 mRNA level was significantly associated with shorter RFS and OS in all BC patients in Basal-like subtype BC patients. Abbreviations: BC, breast cancer; HR, hormone receptor; OS, overall survival; RFS, recurrence-free survival; SBR, Scarff Bloom and Richardson. |
Discussion
The survival prospect in patients with TNBC remains poor as compared to non-TNBC, primarily attributed to the aggressive phenotype per se.20 The other reason is that, presently, no effective specific targeted therapy has been verified and is readily available, although intense investigation and clinical trials are being carried out, including treatment strategy toward BRCA-1/2 mutation, BCL-2, and PIK3CA, as well as immunotherapy.21–23 Efforts on identifying key driver genes that affect the critical functions of TNBC may shed light for developing novel targeted therapy against this deadly disease.
NPM1 is a nucleolar phosphoprotein implicated in a variety of biological and pathological processes.24 Alterations in NPM1 function by mutation, translocation, or loss-of-function may result in losing the regulatory potentials of NPM1 and contribute to oncogenesis.6 Preliminary analysis from an array of public databases demonstrated that NPM1 was significantly highly expressed in TNBC than in other molecular subtypes. Moreover, analysis from GOBO database indicated that NPM1 was significantly highly expressed in TNBC cell lines than in other molecular subtypes of breast cancer cell lines. Therefore, it is postulated that NPM1 could be inversely associated with the expression of ER, which had been proposed in a study on endometrial cancer cells, demonstrating that NPM1 negatively regulates ERα expression.25
Previous studies have shown that high expression of NPM1 promotes proliferation and antiapoptosis through interactions with p19ARF, p14, p21, and p53 in a series of tumor tissues.26–28 In the present study, correlation analysis between expression and clinicopathological parameters in TNBC samples demonstrated that NPM1 was significantly associated with the expression of Ki-67, which has been widely used as a proliferation marker for human tumor cells. Furthermore, it was found that high expression of NPM1 was positively correlated with high pathological grade, which was usually considered to be a more aggressive phenotype. Similar viewpoint was reported by He et al,29 who found that high expressions of NPM1 may be associated with poorly differentiated lung adenocarcinoma.
Notably, as shown in Figure 7, we found that knockdown of NPM1 could reduce the cell proliferation activity of both MDA-MB-231 and BT549 TNBC cells. Cytometry experiment further demonstrated that depletion of NPM1 arrested the cell cycle at the G0/G1 phase in TNBC cells. Mechanistically, downregulation of NMP1 resulted in the activation of CDH1/skp2/p27kip1 pathway, leading to cell cycle arrest or quiescent.30,31 The p27kip1 gene has been recognized to be a tumor suppressor gene that can directly inhibit the biological activity of cyclin–CDK complex, thereby preventing cell transition from G1 phase to S phase, and can also regulate cell cycle as a potential mediator of extracellular stimulation.32
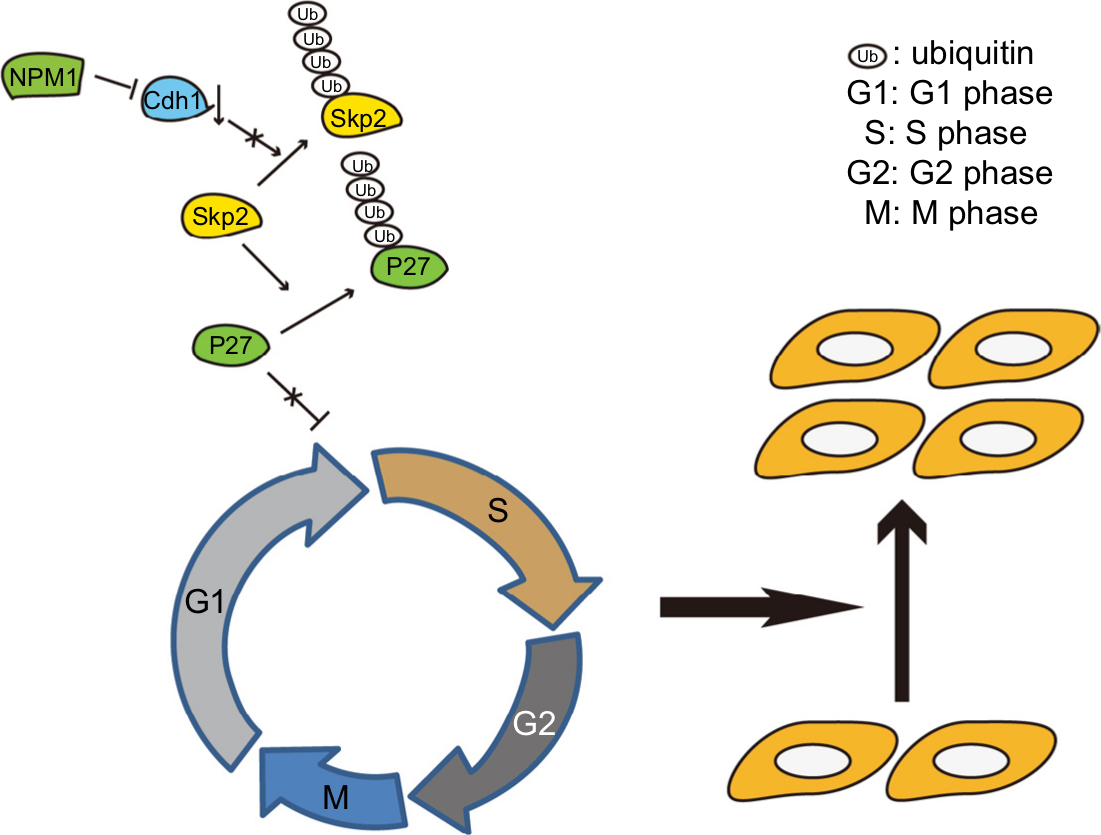 | Figure 7 The schematic representation of how NPM1 promotes proliferation in breast cancer. Notes: NPM1 upregulates CDH1 levels, which accelerate Skp2 degradation, thereby mediating the ubiquitination of p27kip1, and then induce the proliferation in breast cancer. |
In TNBC cells, NPM1 might accelerate the cell cycle by downregulating the activity of p27kip1, thus promoting the proliferation of breast cancer cells. While knocking down of NPM1 may increase the expression of p27kip1,and subsequently block the cell cycle progress and reduce the proliferation of breast cancer cells. Therefore, overexpression of NPM1 may be one of the important mechanisms affecting the growth of TNBC. The perspective was consistent with the study by Chen et al33 reporting that NPM1 influenced AKT activity and resistant cell apoptosis in breast cancer.
NPM1 has been reported to be associated with poor survival in patients with gastric cancer, colon cancer, and astrocytoma.15,34,35 Survival analysis from Kaplan–Meier plotter in our study also revealed that patients with high expression of NPM1 have a significantly shorter RFS and OS than patients with low expression of NPM1, particularly in patients with TNBC, suggesting that NPM1 may predict a poor survival for patients with TNBC.
Conclusion
NPM1 is significantly highly expressed in basal-like/TNBC. Knockdown of NPM1 impairs the proliferative capacity of TNBC cells through activation of the CDH1/Skp2/p27kip1 pathway. Moreover, elevated NPM1 expression predicted shorter RFS and OS in patients with TNBC. NPM1 might be a potential biomarker and therapeutic target for patients with TNBC.
Ethics
The study was reviewed and approved by the Ethics Committee of the Cancer Hospital of Shantou University Medical College. Patient consent was written informed consent, in compliance with the Declaration of Helsinki.
Acknowledgment
This work was partly supported by the Natural Science Foundation of Guangdong Province, China (no. 2018A030313562), National Natural Science Foundation of China (no. 81600358), and Youth Innovative Talent Project of Colleges and Universities in Guangdong Province, China (no. 2017KQNCX073).
Disclosure
The authors report no conflicts of interest in this work.
References
Hurvitz S, Mead M. Triple-negative breast cancer: advancements in characterization and treatment approach. Curr Opin Obstet Gynecol. 2016;28(1):59–69. | ||
Kumar P, Aggarwal R. An overview of triple-negative breast cancer. Arch Gynecol Obstet. 2016;293(2):247–269. | ||
Yao H, He G, Yan S, et al. Triple-negative breast cancer: is there a treatment on the horizon? Oncotarget. 2017;8(1):1913–1924. | ||
El Rassy E, Ibrahim N, Ghosn M. Triple negative breast cancer: are we scoring a home run? Future Oncol. 2018;14(9):793–796. | ||
Brady SN, Maggi LB, Winkeler CL, et al. Nucleophosmin protein expression level, but not threonine 198 phosphorylation, is essential in growth and proliferation. Oncogene. 2009;28(36):3209–3220. | ||
Box JK, Paquet N, Adams MN, et al. Nucleophosmin: from structure and function to disease development. BMC Mol Biol. 2016; 17(1):19. | ||
Hu L, Zhang X, Wang J, Wang S, Amin HM, Shi P. Involvement of oncogenic tyrosine kinase NPM-ALK in trifluoperazine-induced cell cycle arrest and apoptosis in ALK+ anaplastic large cell lymphoma. Hematology. 2018;23(5):284–290. | ||
Lin J, Kato M, Nagata K, Okuwaki M. Efficient DNA binding of NF-κB requires the chaperone-like function of NPM1. Nucleic Acids Res. 2017;45(7):3707–3723. | ||
di Matteo A, Franceschini M, Chiarella S, Rocchio S, Travaglini-Allocatelli C, Federici L. Molecules that target nucleophosmin for cancer treatment: an update. Oncotarget. 2016;7(28):44821–44840. | ||
Zhou F, Qiu W, Sun L, et al. Clinical significance of nucleophosmin/B23 and human epidermal growth factor receptor 2/neu expressions in gastric cancers. APMIS. 2013;121(7):582–591. | ||
Liu Y, Zhang F, Zhang XF, et al. Expression of nucleophosmin/NPM1 correlates with migration and invasiveness of colon cancer cells. J Biomed Sci. 2012;19:53. | ||
Xu DH, Liu F, Li X, et al. Regulatory role of nucleophosmin during the differentiation of human liver cancer cells. Int J Oncol. 2014;45(1):264–272. | ||
Kim JY, Cho YE, An YM, et al. GLTSCR2 is an upstream negative regulator of nucleophosmin in cervical cancer. J Cell Mol Med. 2015;19(6):1245–1252. | ||
Di Fiore PP. Playing both sides: nucleophosmin between tumor suppression and oncogenesis. J Cell Biol. 2008;182(1):7–9. | ||
Zhou F, Chen E, You D, Song Y, Sun Z, Yue L. Both high expression of nucleophosmin/B23 and CRM1 predicts poorer prognosis in human gastric cancer. APMIS. 2016;124(12):1046–1053. | ||
Leal MF, Mazzotti TK, Calcagno DQ, et al. Deregulated expression of Nucleophosmin 1 in gastric cancer and its clinicopathological implications. BMC Gastroenterol. 2014;14:9. | ||
Karhemo PR, Rivinoja A, Lundin J, et al. An extensive tumor array analysis supports tumor suppressive role for nucleophosmin in breast cancer. Am J Pathol. 2011;179(2):1004–1014. | ||
Lin HY, Zeng D, Liang YK, Wei XL, Chen CF. GATA3 and TRPS1 are distinct biomarkers and prognostic factors in breast cancer: database mining for GATA family members in malignancies. Oncotarget. 2017;8(21):34750–34761. | ||
Lánczky A, Nagy Á, Bottai G, et al. miRpower: a web-tool to validate survival-associated miRNAs utilizing expression data from 2178 breast cancer patients. Breast Cancer Res Treat. 2016;160(3):439–446. | ||
Pareja F, Reis-Filho JS. Triple-negative breast cancers - a panoply of cancer types. Nat Rev Clin Oncol. 2018;15(6):347–348. | ||
Lee A, Djamgoz MBA. Triple negative breast cancer: emerging therapeutic modalities and novel combination therapies. Cancer Treat Rev. 2018;62:110–122. | ||
Lebert JM, Lester R, Powell E, Seal M, McCarthy J. Advances in the systemic treatment of triple-negative breast cancer. Curr Oncol. 2018;25(Suppl 1):S142–S150. | ||
Chalakur-Ramireddy NKR, Pakala SB. Combined drug therapeutic strategies for the effective treatment of Triple Negative Breast Cancer. Biosci Rep. 2018;38(1):BSR20171357. | ||
Scott DD, Oeffinger M. Nucleolin and nucleophosmin: nucleolar proteins with multiple functions in DNA repair. Biochem Cell Biol. 2016;94(5):419–432. | ||
Lin CY, Chao A, Wang TH, et al. Nucleophosmin/B23 is a negative regulator of estrogen receptor α expression via AP2γ in endometrial cancer cells. Oncotarget. 2016;7(37):60038–60052. | ||
Ahn JY, Liu X, Cheng D, et al. Nucleophosmin/B23, a nuclear PI(3,4,5)P(3) receptor, mediates the antiapoptotic actions of NGF by inhibiting CAD. Mol Cell. 2005;18(4):435–445. | ||
Bolli N, de Marco MF, Martelli MP, et al. A dose-dependent tug of war involving the NPM1 leukaemic mutant, nucleophosmin, and ARF. Leukemia. 2009;23(3):501–509. | ||
Chan HJ, Weng JJ, Yung BY. Nucleophosmin/B23-binding peptide inhibits tumor growth and up-regulates transcriptional activity of p53. Biochem Biophys Res Commun. 2005;333(2):396–403. | ||
He J, Xiang Z, Xiao J, Xiao H, Liu L. The poor chemotherapeutic efficacy in lung adenocarcinoma overexpressing c-Src and nucleophosmin/B23(NPM1). Xi Bao Yu Fen Zi Mian Yi Xue Za Zhi. 2016;32(10):1378–1381. | ||
Liu Y, Perdreau SA, Chatterjee P, Wang L, Kuan SF, Duensing A. Imatinib mesylate induces quiescence in gastrointestinal stromal tumor cells through the CDH1-SKP2-p27Kip1 signaling axis. Cancer Res. 2008;68(21):9015–9023. | ||
Chen CF, Dou XW, Liang YK, et al. Notch3 overexpression causes arrest of cell cycle progression by inducing Cdh1 expression in human breast cancer cells. Cell Cycle. 2016;15(3):432–440. | ||
Belletti B, Baldassarre G. New light on p27(kip1) in breast cancer. Cell Cycle. 2012;11(19):3701–3702. | ||
Chen S, Meng T, Zheng X, et al. Contribution of nucleophosmin overexpression to multidrug resistance in breast carcinoma. J Drug Target. 2018;26(1):27–35. | ||
Yang YF, Zhang XY, Yang M, et al. Prognostic role of nucleophosmin in colorectal carcinomas. Asian Pac J Cancer Prev. 2014;15(5):2021–2026. | ||
Kuo YH, Chen YT, Tsai HP, Chai CY, Kwan AL. Nucleophosmin overexpression is associated with poor survival in astrocytoma. APMIS. 2015;123(6):515–522. |
Supplementary materials
 | Table S1 Primers used in real-time PCR |
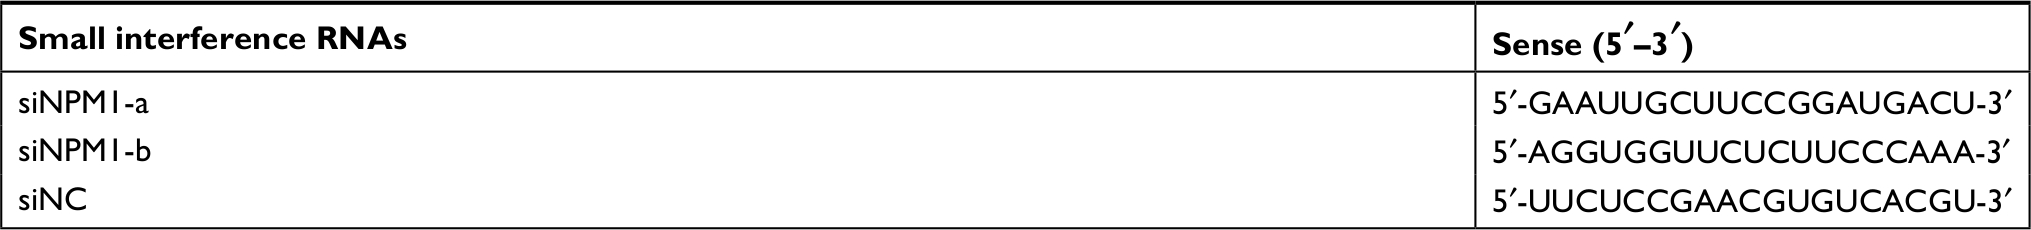 | Table S2 Oligonucleotide sequences for siRNA constructs |
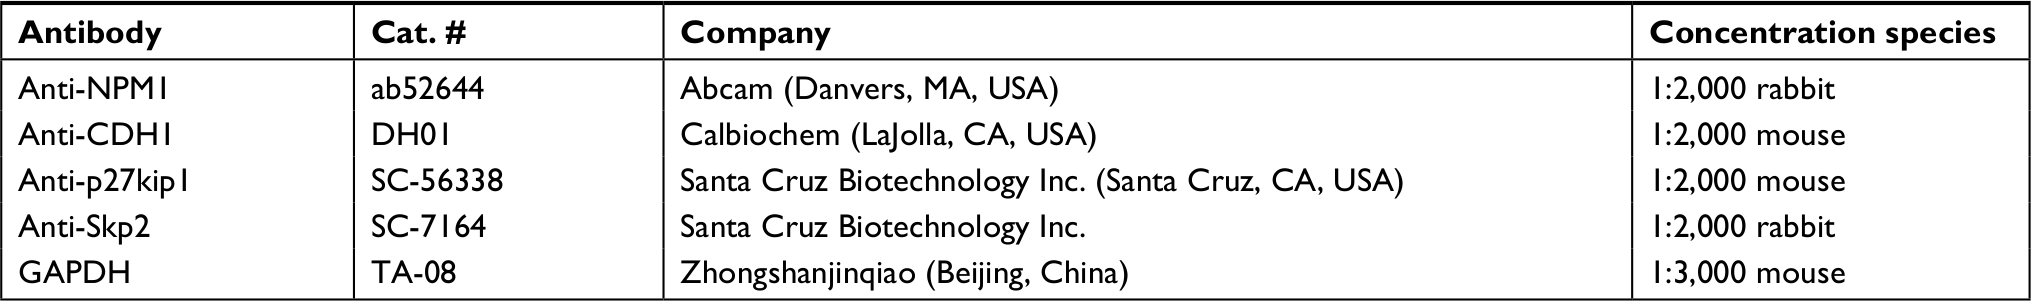 | Table S3 Antibodies used in this study |
 | Figure S1 Gray value measurement and statistical analysis of Western blot in Figures 2A and 4B and C. Notes: Data are presented as the mean ± SEM of three experiments. **P<0.01, and ***P<0.001 as compared with control cells. |
 © 2018 The Author(s). This work is published and licensed by Dove Medical Press Limited. The full terms of this license are available at https://www.dovepress.com/terms.php and incorporate the Creative Commons Attribution - Non Commercial (unported, v3.0) License.
By accessing the work you hereby accept the Terms. Non-commercial uses of the work are permitted without any further permission from Dove Medical Press Limited, provided the work is properly attributed. For permission for commercial use of this work, please see paragraphs 4.2 and 5 of our Terms.
© 2018 The Author(s). This work is published and licensed by Dove Medical Press Limited. The full terms of this license are available at https://www.dovepress.com/terms.php and incorporate the Creative Commons Attribution - Non Commercial (unported, v3.0) License.
By accessing the work you hereby accept the Terms. Non-commercial uses of the work are permitted without any further permission from Dove Medical Press Limited, provided the work is properly attributed. For permission for commercial use of this work, please see paragraphs 4.2 and 5 of our Terms.