")
Back to Journals » Cancer Management and Research » Volume 12
Knockdown of ATAD2 Inhibits Proliferation and Tumorigenicity Through the Rb-E2F1 Pathway and Serves as a Novel Prognostic Indicator in Gastric Cancer
Authors Zhou X, Ji H, Ye D , Li H, Liu F, Li H, Xu J , Li Y, Xiang F
Received 25 August 2019
Accepted for publication 24 December 2019
Published 15 January 2020 Volume 2020:12 Pages 337—351
DOI https://doi.org/10.2147/CMAR.S228629
Checked for plagiarism Yes
Review by Single anonymous peer review
Peer reviewer comments 2
Editor who approved publication: Dr Antonella D'Anneo
Xuan Zhou, 1,* Huihui Ji, 2,* Dongxue Ye, 2 Hong Li, 1 Fen Liu, 2 Haiyan Li, 2 Jin Xu, 1 Yujun Li, 1 Fenggang Xiang 1, 2
1Department of Pathology, The Affiliated Hospital of Qingdao University, Qingdao 266000, People’s Republic of China; 2Department of Pathology, School of Basic Medicine, Qingdao University, Qingdao 266071, People’s Republic of China
*These authors contributed equally to this work
Correspondence: Fenggang Xiang
Department of Pathology, The Affiliated Hospital of Qingdao University, 16 Jiangsu Road, Qingdao 266000, People’s Republic of China
Email [email protected]
Introduction: The aim of the present study was to examine the expression of ATAD2 in gastric cancer (GC) specimens and to evaluate its correlation with clinicopathologic features, including survival of GC patients. The potential roles of ATAD2 in the GC cell proliferation, apoptosis, and tumour growth were further explored.
Materials and Methods: Quantitative reverse transcription-polymerase chain reaction (qRT-PCR), Western blotting and immunohistochemistry (IHC) were applied to determine the mRNA and protein expression of ATAD2 in GC and corresponding adjacent non-tumourous specimens. The relationship between ATAD2 expression and clinicopathological features of GC patients was analysed. Kaplan-Meier analysis was performed to assess the prognostic value of ATAD2 expression levels. The proliferation, colony formation, apoptosis and tumorigenesis roles of ATAD2 were measured using in vitro and in vivo experiments.
Results: The expression of ATAD2 mRNA and protein was overexpressed in GC tissues compared with corresponding adjacent non-tumourous tissues. ATAD2 expression was significantly correlated with tumour size, tumour differentiation, and clinical tumour-node-metastasis (TNM) stage. Patients with high ATAD2 expression were likely to experience significantly shorter postoperative overall survival (OS) and disease-free survival (DFS). Multivariate Cox analysis suggested ATAD2 as an independent variable for OS and DFS. Knockdown of ATAD2 significantly suppressed cell proliferation, colony formation in vitro and tumorigenicity in vivo. Cell cycle and apoptotic assays showed that the anti-proliferative effect of pLV-ATAD2 shRNA was mediated by arresting cells in the G1 phase and inducing cell apoptosis. Silencing of ATAD2 reduced the expression of cyclinD1, ppRb, E2F1 and cyclinE and upregulated the expression of cleaved-PARP and cleaved-Caspase 3.
Conclusion: Our study indicated that ATAD2 plays an important role in the process of tumorigenesis and progression in GC, and it could serve as a novel prognostic biomarker and a therapeutic target for the treatment of GC patients.
Keywords: ATAD2, gastric cancer, proliferation, apoptosis, prognosis
Introduction
Gastric cancer (GC) is one of the most common malignant diseases and the second cause of cancer mortality worldwide.1,2 Despite the multiple advances in clinical and experimental cancer treatment, the survival rate of gastric cancer patients remains poor. Numerous studies have shown that the progression of GC might be a multi-step process, involving the interaction between oncogenes and tumour suppressor genes3,4; however, the precise molecular mechanisms underlying its tumorigenesis and progression remain largely unknown. Consequently, a better understanding of molecular mechanisms and signalling pathways is indispensable for identification of therapeutic targets for GC treatment.
ATPase family AAA domain-containing protein 2 (ATAD2) is a remarkably conserved protein that is expressed predominantly in germ cells and located primarily in the cell nucleus. It has been identified as a candidate driver gene located within the amplified 8q24 locus, and its protein structure contains 2 AAA domains and 1 bromodomain. The structure suggests that the functions of ATAD2 are related to genome regulation, such as by acting on chromatin structure and function.5 ATAD2 is systematically overexpressed in a wide variety of tumours, and this overexpression was correlated with poor prognosis, such as breast, ovarian, endometrial and lung cancer, hepatocellular carcinoma and large B-cell lymphoma.6–12 ATAD2 can function as a cofactor with some transcription factors such as c-Myc and E2F to regulate a specific set of genes that have oncogenic functions. Through c-MYC and E2F transcription factors, ATAD2 increases the expression of proliferation-related and anti-apoptotic genes in many different types of cancer.7,13,14 However, there have been no studies concerning the gene functions related to ATAD2 in GC.
In the present study, the mRNA and protein expression levels of ATAD2 were examined in GC tissue samples and we further analysed the clinical significance of ATAD2 in a cohort of GC patients. Furthermore, we investigated the potential role of ATAD2 in the GC cell proliferation, apoptosis, and tumour growth by exploring its function in vitro and in vivo, which may provide a novel therapeutic target for the treatment of GC patients.
Materials and Methods
Cell Lines and Cell Culture
GC cell lines SGC-7901 and MGC-803 were obtained from the American Type Culture Collection (ATCC; Manassas, VA, USA). The cell lines were maintained in Dulbecco’s modified Eagle’s medium (DMEM) medium supplemented with 10% heat-inactivated foetal bovine serum (FBS; Biological Industries, Israel). All cell lines were cultured in a humidified incubator at 37°C and 5% CO2.
Plasmid Construction and Cell Transfection
Lentivirus plasmid expressing ATAD2 shRNA vector (pLV-ATAD2 shRNA) and control vector (pLV-control) were obtained from Shanghai GenePharma Corporation (Shanghai, China). Briefly, chemically synthesized oligonucleotides encoding ATAD2 shRNA sequence were subcloned into the BamHI and EcoRI sites of a lentiviral expression vector PGLV3/H1/GFP+ puro (GenePharm Co., Ltd) and verified using DNA sequencing. Virus particles were harvested 48 hrs after co-transfection of the pLV-ATAD2 shRNA or pLV-control with lentivirus packing vector into HEK-293T cells. SGC-7901 and MGC-803 cells were transduced with lentivirus-containing medium. All transfection experiments were performed using Lipofectamine 2000 (Invitrogen, Camarillo, CA, USA) according to the manufacturer’s protocol. The transfection efficiency was monitored by fluorescence microscopy and cells transfected with pLV-ATAD2 shRNA or pLV-control were selected with puromycin (Sigma Aldrich, St Louis, MO, USA) at a concentration of 2 µg/mL for 1 week. The sequence of ATAD2 shRNA was 5ʹ-GGTTGTAGCTCCTCCAAAT-3ʹ, while the negative control was 5ʹ-GTTCTCC GAACGTGTCACGT-3ʹ.
Patients and Tissue Specimens
A total of 121 pairs of paraffin-embedded human gastric adenocarcinoma tissues and their corresponding adjacent non-tumourous specimens were collected between 2011 and 2012 from the Department of Pathology at the Affiliated Hospital of Qingdao University. Another 12 pairs of fresh GC tissues and their corresponding adjacent non-tumourous specimens were collected from patients at the time of surgical resection and stored at −80°C for qRT-PCR and Western blot analysis. None of the patients had received radiotherapy or chemotherapy before surgery. In addition, 78 chronic superficial gastritis, 43 chronic atrophic gastritis, 16 low-grade intraepithelial neoplasia and 13 high-grade intraepithelial neoplasia paraffin-embedded specimens were also collected from patients who received the treatment of endoscopic submucosal dissection (ESD). Tumour differentiation was assessed according to the World Health Organisation (WHO) classification criteria. All patients were staged using the seventh edition of the Union for International Cancer Control (UICC) Tumour-Node-Metastasis (TNM) staging system. The use of human tissues was approved by the Ethics Committee of the Affiliated Hospital of Qingdao University. All patients provided written informed consent and the study was conducted in accordance with the Declaration of Helsinki.
RNA Preparation and qRT-PCR
Total RNA was extracted from 12 pairs of GC and corresponding adjacent non-tumourous tissues using Trizol reagent (Dalian, Takara), and cDNA was synthesised by Prime ScriptTM (Dalian, Takara) according to the manufacturer’s protocol. SYBR green-based qRT-PCR was performed to measure the expression levels of ATAD2 on the Bio-Rad CFX96 real-time PCR system, β-actin was used as internal controls. The sequences of the PCR primers used for amplification were as follows: ATAD2 forward, GGAATCCCAAACCACTGGACA; ATAD2 reverse, GGTAGCGTCGTCGTAAAGCACA; β-actin forward, CGCAAAGACCTGTATGCCAA; β-actin reverse, CACACAGAGTACTTGCGCTC. The reactions were incubated in a 96-well plate at 95°C for 30 s, followed by 40 amplification cycles at 95°C for 5 s, annealing at 55°C for 30 s and elongation at 72°C for 30 s. The relative expression ratio of ATAD2 in each paired tumour and non-tumourous tissue was calculated using 2−∆∆Ct method,15 and the relative expression of ATAD2 in GC were normalized to the endogenous β-actin.
Western Blot
Total protein was extracted from 12 pairs of fresh GC and corresponding adjacent non-tumourous tissues using radioimmunoprecipitation assay (RIPA) lysis buffer, and the protein concentration was determined using BCA method. Forty micrograms of protein were loaded onto 10% sodium dodecyl sulphate polyacrylamide gel electrophoresis (SDS-PAGE) and transferred to polyvinylidene difluoride (PVDF) membranes. After blocking non-specific binding for 2 hrs with 5% non-fat milk, the membranes were incubated with primary antibody against ATAD2 (1:1000, rabbit anti-ATAD2, Abcam, UK), cyclinD1 (1:2000, rabbit anti-cyclinD1, Abcam, UK), ppRb (1:5000, rabbit anti-ppRb, Abcam, UK), pRb (1:5000, rabbit anti-Rb, Abcam, UK), E2F1 (1:2000, rabbit anti-E2F1, Abcam, UK), cyclinE (1:1000, rabbit anti-cyclinE, Abcam, UK), cyclinA (1:1000, rabbit anti-cyclinA, Abcam, UK), cleaved-PARP (1:2000, rabbit anti-cleaved PARP, Abcam, UK), PARP (1:2000, rabbit anti-PARP, Abcam, UK), cleaved-Caspase 3 (1:2000, rabbit anti-cleaved Caspase 3, Abcam, UK), Caspase 3 (1:1000, rabbit anti-Caspase 3, Abcam, UK) and GAPDH (1:4000, mouse anti-GAPDH, TransGene, Beijing) at 4°C overnight. After washing, the membranes were incubated with secondary antibody (Abcam, UK and SunGene BioTech, Tianjin) for 1 hr at room temperature. Signals were visualized with SuperSignal West Pico chemiluminescence kit (Thermo Fisher Scientific, USA). GAPDH served as a loading control.
Tissue Microarray (TMA) Construction
We constructed the TMA, containing 121 GC and corresponding adjacent non-tumourous tissues. Formalin-fixed, paraffin embedded tissue blocks and the corresponding H&E-stained slides were overlaid for TMA sampling. Two pathologists reviewed the corresponding histological haematoxylin and eosin (HE)-stained sections to identify and mark representative areas. Using a tissue arraying instrument (Minicore Excilone, Minicore, UK), each tissue core was punched (diameter of 1.5 mm) from the marked areas and re-embedded. Then, the paraffin-embedded GC sections were sliced into 4 μm slices and mounted onto glass slides.
Immunohistochemistry (IHC)
IHC for ATAD2 was performed using PV6000 method. The slides were dewaxed in xylene and a graded alcohol series, treated with 3% hydrogen peroxide for 10 min to block endogenous peroxidase activity, then treated with high-pressure hot antigen repair (1 mmol/L EDTA, pH8.0), before washing in phosphate-buffered saline (PBS; 0.01 mol/L; pH7.4), cooled naturally. Subsequently, they were incubated overnight at 4°C with the rabbit monoclonal antibody against ATAD2 (1:100 dilution, Abcam, UK). After rinsing, the slides were treated with a secondary antibody for 30 min at 37°C, followed by a 3 mins incubation in 3, 3-diaminobenzidine tetrahydrochloride (DAB) solution for protein detection. Immunostaining-positive normal testicular tissue was used as positive controls.
IHC Evaluation
Semi-quantitative immunohistochemical detection was used to determine the ATAD2 protein levels. Nucleus immunoreactivity for the ATAD2 protein was scored by evaluating the sum of positive tumour cells and the staining intensity over the total number of tumour cells. In brief, the percent of positive cells was scored as “0” (<5%), “1” (5–25%), “2” (26–50%), “3” (51–75%) and “4” (76–100%). Intensity was scored as “0” (no staining), “1” (weakly stained), “2” (moderately stained) and “3” (strongly stained). Both scores were decided under double-blind conditions by three independent professionals. The final immunoreactive scores were determined by multiplying the intensity scores with the extent of positivity scores of stained cells.16 Zero to 4 points was considered low expression, and 5–12 points was considered high expression.
3-(4,5-Dimethylthiazol-2-yl)-2,5-Diphenyltetrazolium Bromide (MTT) and Colony Formation Assays
Transfected cells were plated into 96-well plates with a density of 4000 cells/well and incubated for 1–5 days. At each time point, cells were treated with 100 µL MTT reagent (0.5 mg/mL, Sigma) for another 4 hrs at 37°C, followed by removal of the supernatants, and the formazan crystals were solubilized in dimethyl sulfoxide (DMSO) (150 µL/well). The absorbance at 490 nm was measured for each sample using a multi-label plate reader (PerkinElmer, Waltham, MA, USA). For the colony formation assay, 500 cells were seeded into 6-well plates and incubated at 37°C in complete medium for 2 weeks. Colonies were fixed with methanol, stained with 0.1% crystal violet and counted.
Cell Cycle Assay and Apoptosis Assay
Transfected cells were collected, washed with ice-cold phosphate-buffered saline (PBS) and fixed in 70% ethanol at 4°C overnight. The fixed cells were centrifuged at 1000 rpm for 3 min and washed with ice-cold PBS twice. After washing twice, 50 µg/mL RNase A (Beyotime, Shanghai, China) and 50 µg/mL of propidium iodide (Sigma-Aldrich, Saint-Quentin Fallavier, France) were added to the fixed cells and incubated for 30 min at 37°C in the dark. The cell cycle distributions were analysed using a FACSCalibur flow cytometer (Beckman Coulter, Brea, CA, USA). In total, 10,000 nuclei were examined in the flow cytometer. For apoptosis assay, cells were collected by centrifugation 48 hrs post-transfection, washed twice with ice-cold PBS and then treated with Annexin V-FITC and propidium iodide using the Annexin V-FITC Apoptosis Detection Kit (YESEN, Shanghai) for 15 min at room temperature in the dark. The percentage of apoptotic cells was analysed using a FACSCalibur flow cytometer.
Animals and Tumor Xenograft Experiments
Athymic nude mice (BALB/c-nu, 3–4 weeks) were purchased from Shanghai GeneChem Corporation. Each nude mouse was subcutaneously injected under the right flank with 4×10⁶ SGC-7901 cells expressing control vector or ATAD2 shRNA. Tumor growth was examined every 3 days for 6 weeks. Tumour volume (V) was monitored by measuring the length (L) and width (W) of the tumours and calculated with the following equation: V = (L × W2) × 0.5. Six weeks post-injection, mice were sacrificed and tumours from both groups were excised and weighed. License to carry out live animal experiments was approved by the Ethics Committee of the Affiliated Hospital of Qingdao University. Animal operation was carried out according to the protocols approved by the Committee on the Use of Live Animals in Teaching and Research (CULATR).
Statistical Analysis
All statistical analyses were performed by using the SPSS 23.0 software. The differences of ATAD2 expression in different groups using paired t-test, Wilcoxon test and Kruskal–Wallis rank sum test. The chi-squared (χ2) test was performed to analyse the correlation between ATAD2 expression and clinicopathological parameters. The Kaplan–Meier method (the Log-rank test) was used for survival curve. Survival data were evaluated by using univariate and multivariate Cox regression analyses. All experiments were repeated at least 3 times. Differences were considered statistically significant for P-values <0.05.
Results
The Expression of ATAD2 in GC Tissues by qRT-PCR and Western Blot
To investigate the expression of ATAD2 in GC, qRT-PCR was used to detect ATAD2 expression in 12 pairs of fresh GC and their corresponding adjacent non-tumourous tissues. qRT-PCR results showed that the expression of ATAD2 mRNA was markedly upregulated in 100% (12/12) of GC tissues compared with the paired non-tumourous tissues (Figure 1A). Consistently, Western blot analyses also demonstrated that the protein levels of ATAD2 in GC tissues were dramatically increased in 100% (12/12) of cases compared with the paired non-tumorous tissues (Figure 1C). The differential expression of ATAD2 between tumour and non-tumourous tissues was statistically significant (Figure 1B and D).
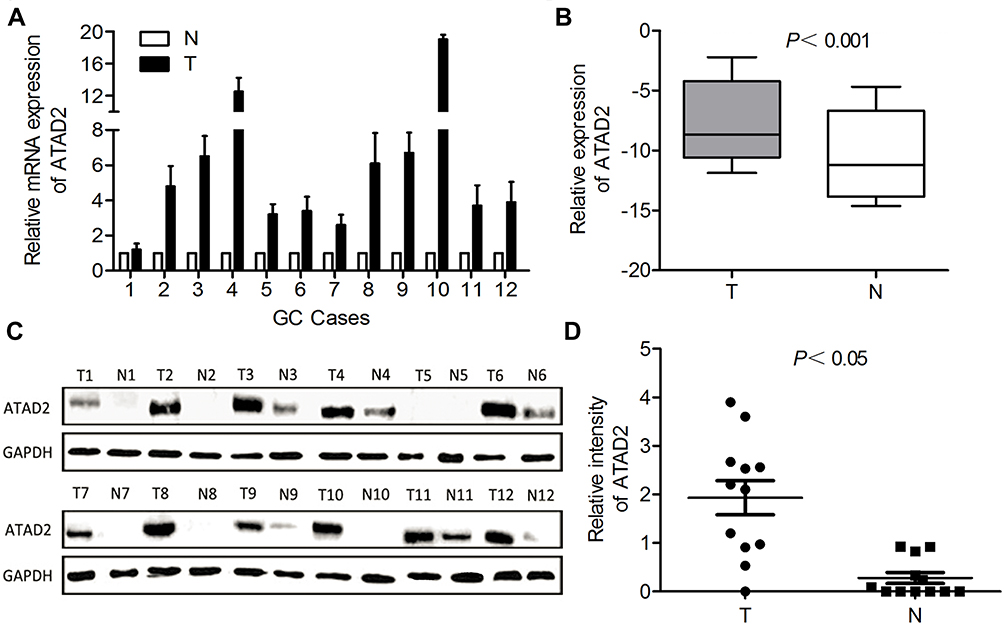 |
Figure 1 The mRNA and protein expression of ATAD2 in GC by qRT-PCR and Western blot. (A) Upregulated expression of ATAD2 mRNA was detected by qRT-PCR in 12 out of 12 GC cases. (T, tumour tissue; N, the corresponding adjacent non-tumourous tissues). (B) The ATAD2 mRNA level was significantly increased in GC as determined by the Wilcoxon matched paired test. (C) Upregulated expression of ATAD2 protein was shown by Western blot in 12 out of 12 GC tissues. GAPDH was used as a loading control. (D) Intensity of ATAD2 normalised to GAPDH was indicated Wilcoxon matched paired test. |
The Relationship Between ATAD2 Expression and Clinicopathological Features of GC Patients
To further determine the expression pattern of ATAD2 in GC, 121 pairs of paraffin-embedded GC and non-tumourous tissues were collected to construct TMA. Results revealed that ATAD2 expression was present in the nucleus of cancer cells by IHC. A positive expression of ATAD2 was detected in 83.5% (101/121) of GC tissues; however, the ATAD2 expression was almost not detectable in non-tumourous gastric tissues (Figure 2A–D). The expression of ATAD2 in GC was significantly higher than that in corresponding adjacent non-tumourous tissues (P<0.01). (Table 1)
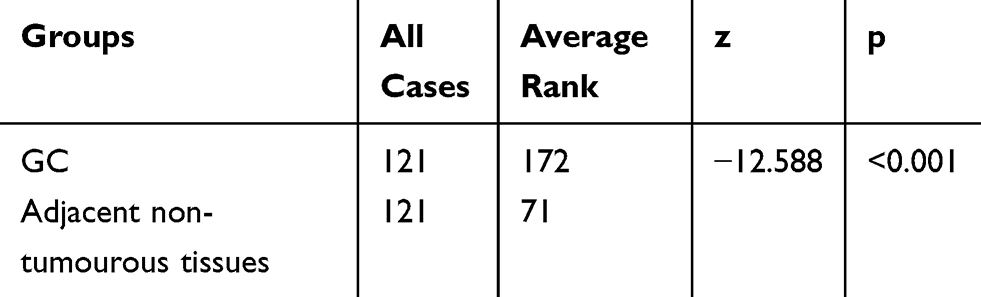 |
Table 1 The Expression of ATAD2 in GC and Corresponding Adjacent Non-Tumourous Tissues |
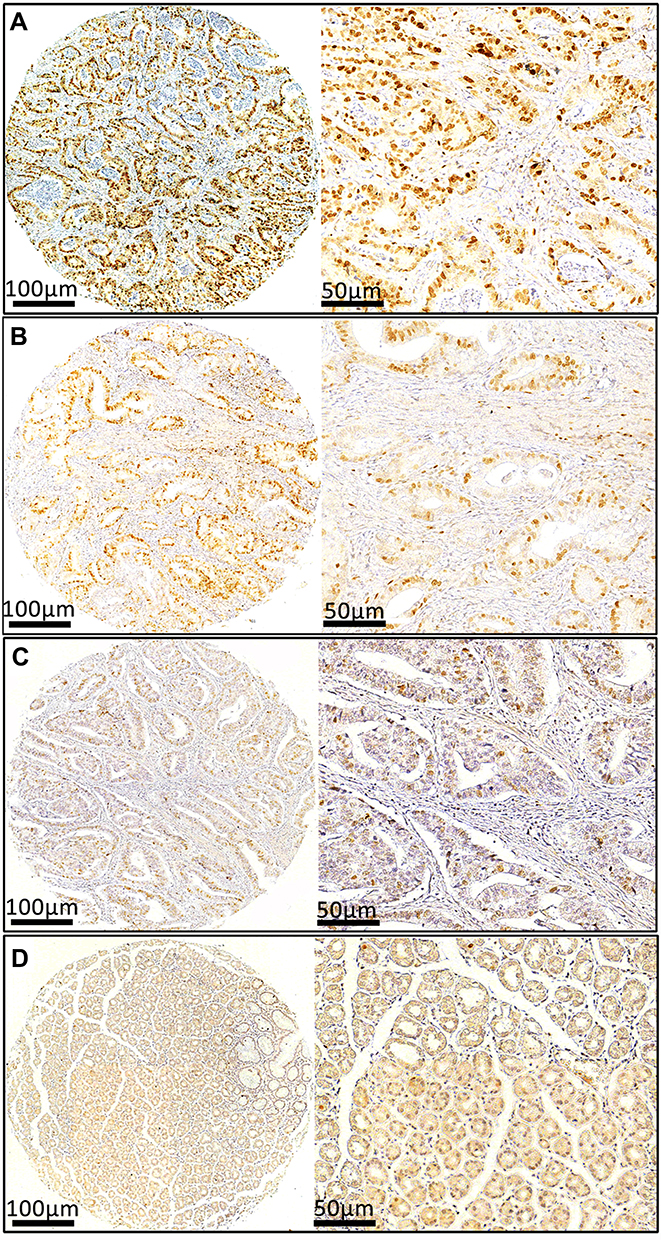 |
Figure 2 The expression of ATAD2 in GC by immunohistochemistry. The micrographs demonstrate strong (A), moderate (B), weak (C) ATAD2 staining in tumour tissues and negative (D) staining in non-tumourous gastric tissues. Left panel: magnification ×100; right panel: magnification ×200. |
The relationship between ATAD2 expression and clinicopathological features of GC patients was further analysed. These cases were first divided into two subgroups: “low ATAD2 expression” and “high ATAD2 expression” as defined in the IHC section of Materials and Methods. Significant correlations were found between ATAD2 expression and 3 parameters, including tumour size (P=0.004), tumour differentiation (P=0.019) and clinical TNM stage (P=0.042). Our results suggested that GC patients with high ATAD2 expression had a higher tendency to exhibit large-size tumours, poor tumour differentiation, and advanced TNM stage. There were no statistical connections between ATAD2 expression and the other clinicopathological parameters, such as the age, gender, tumour infiltration, lymph node status, and metastasis status (P>0.05) (Table 2).
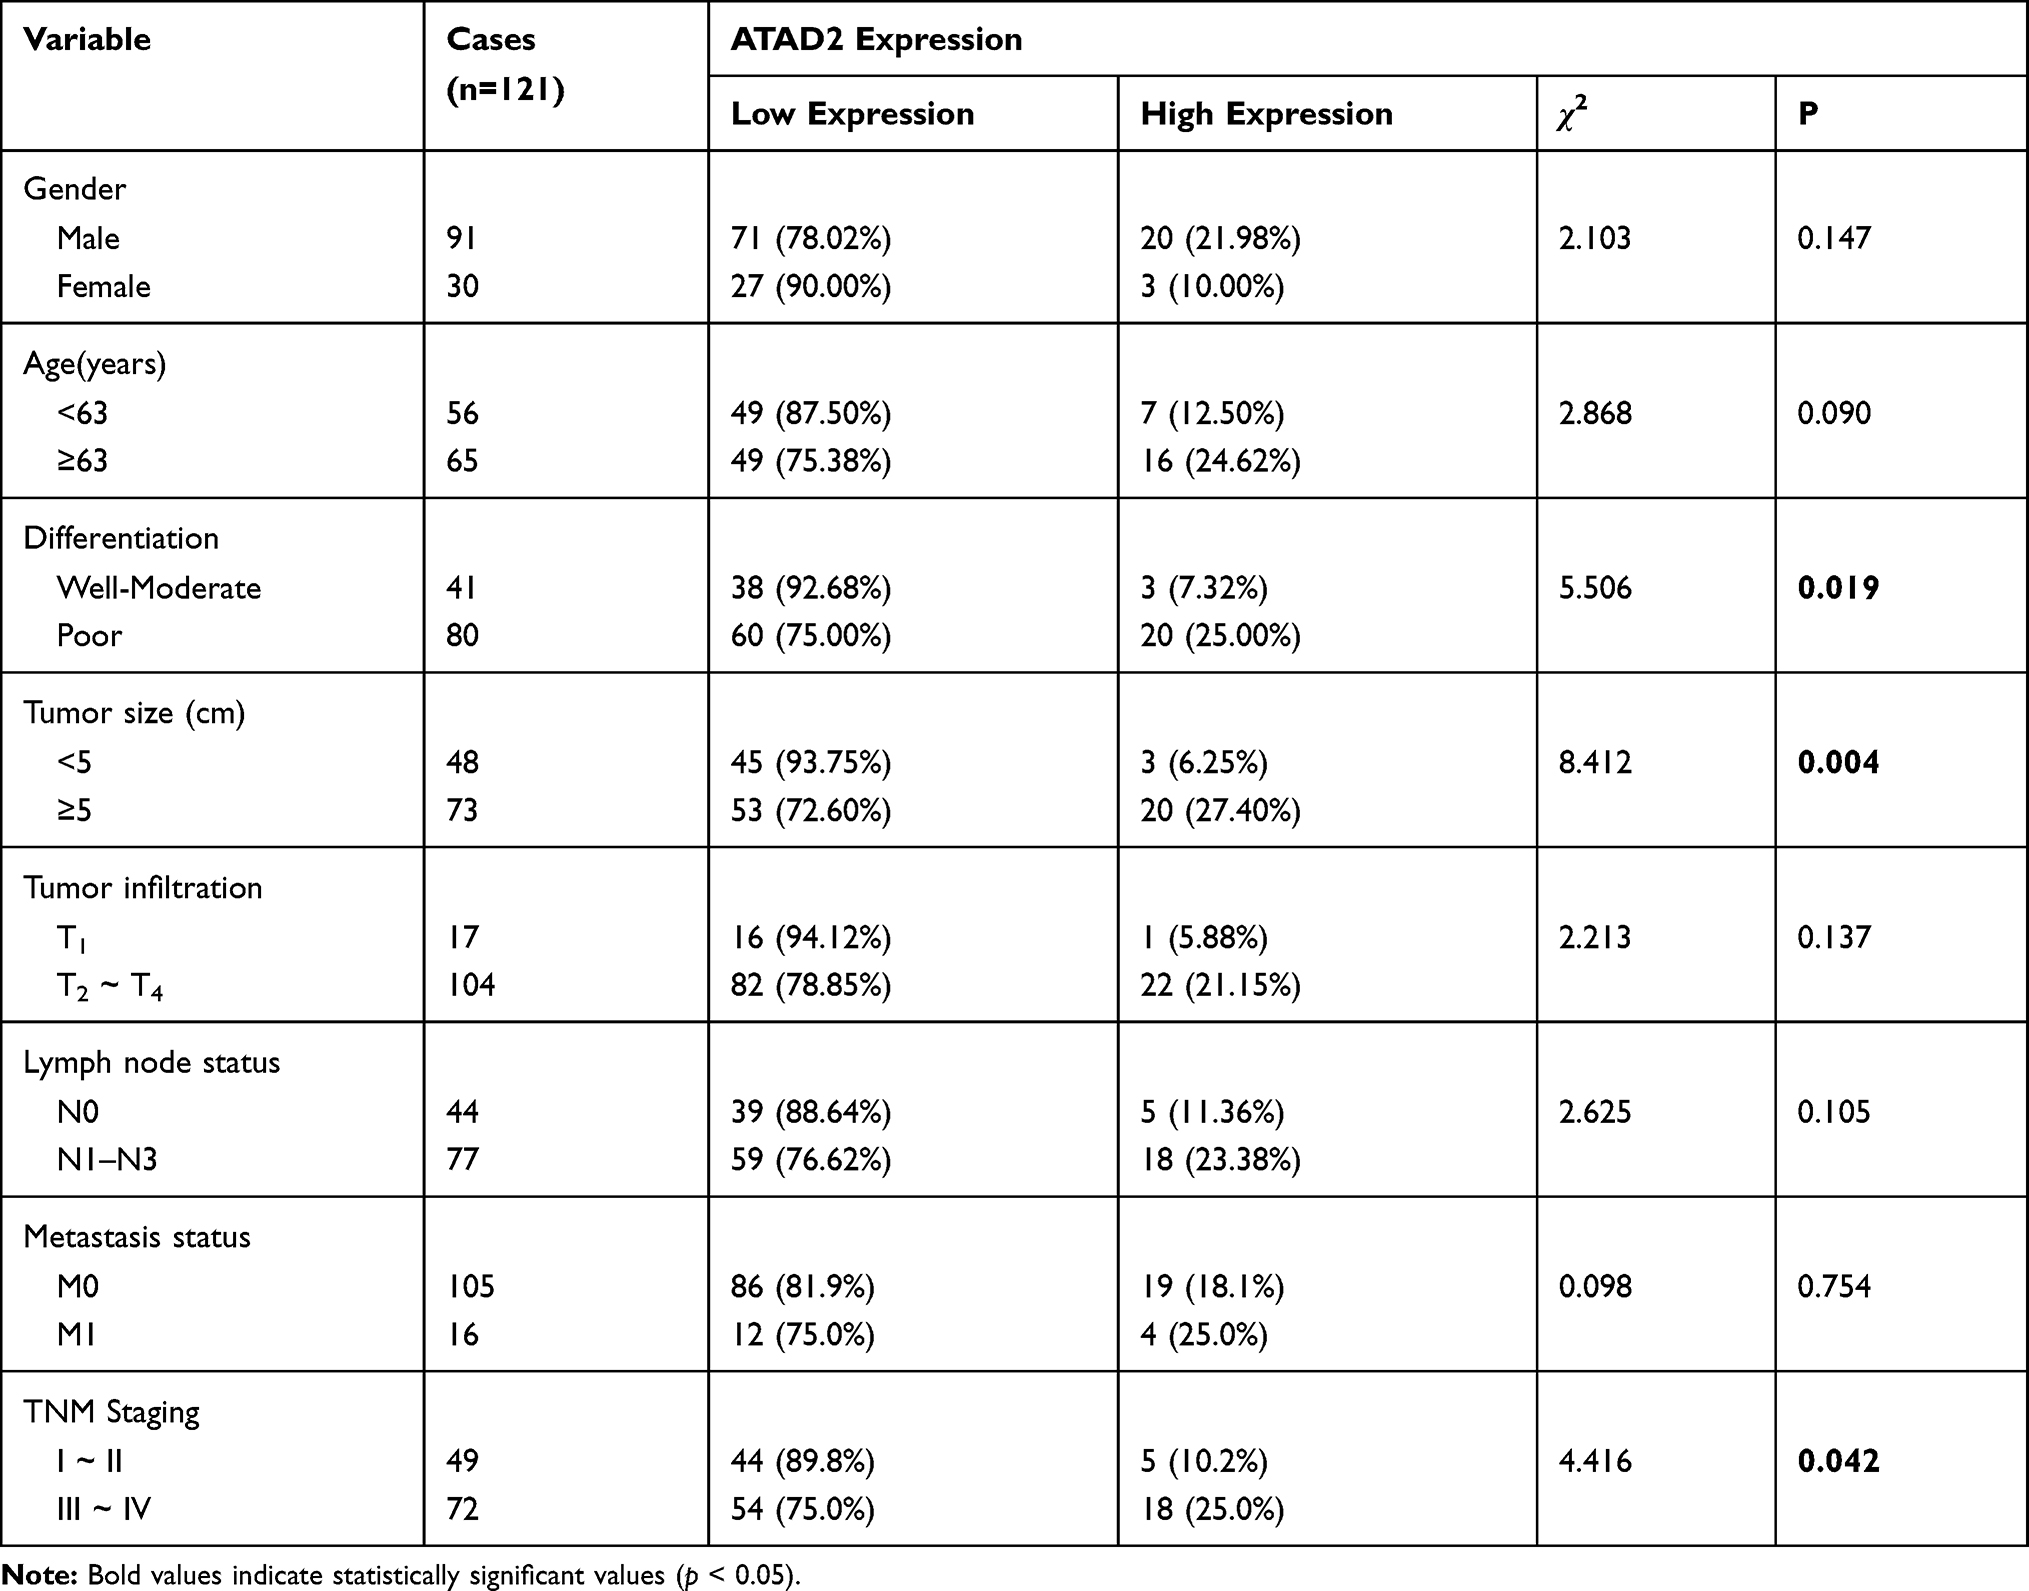 |
Table 2 Correlation Between ATAD2 Expression and Clinicopathologic Parameters in GC Patients |
Association of ATAD2 Expression and GC Patient Survival
The association between ATAD2 expression in GC and the post-operative survival of 100 patients who had follow-up data were assessed with Kaplan-Meier survival analysis. Statistically, the 5-year overall survival (OS) and disease-free survival (DFS) rate of the high ATAD2 expression group were 42.9% and 33.3%, respectively, whereas they were 74.7% and 65.8%, respectively, in the low ATAD2 expression group. Kaplan-Meier survival analysis suggests that patients with high ATAD2 expression were likely to experience significantly shorter postoperative OS (P=0.003) (Figure 3A) and DFS (P= 0.002) (Figure 3B).
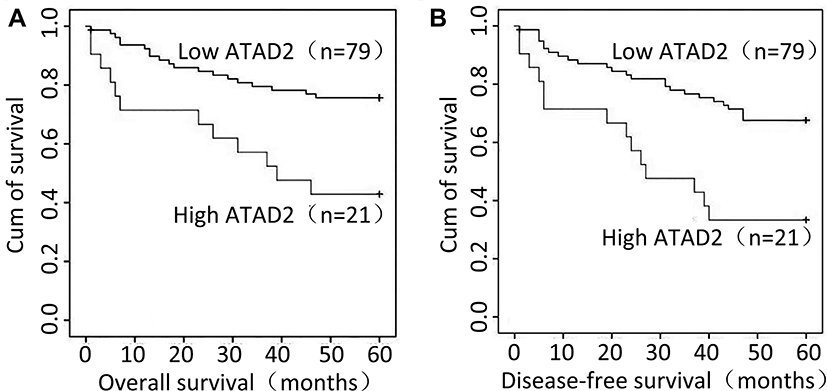 |
Figure 3 Relationship between ATAD2 expression and GC prognosis. ATAD2 protein level showed a prognostic role in overall survival (A) and disease-free survival (B) as indicated by Kaplan-Meier analysis. |
Univariate and Multivariate Analyses of Prognostic Variables in GC Patients
Next, we performed univariate Cox regression analysis to evaluate the expression of ATAD2 and other clinicopathologic parameters on prognosis of GC patients. The results indicated that ATAD2 (P=0.003), as well as differentiation (P=0.020), TNM stage (P<0.001), tumour size (P=0.015), lymph node metastasis (P=0.001) and metastasis status (P=0.017) were associated with OS time of GC patients (Table 3). ATAD2 (P=0.002), differentiation (P=0.020), invasion depth (P=0.029), TNM stage (P<0.001), tumour size (P=0.004), lymph node metastasis (P<0.001) and metastasis status (P=0.008) were associated with DFS time of GC patients (Table 4). Furthermore, ATAD2 expression and those clinicopathologic variables which were significant in univariate Cox regression analysis were further evaluated in multivariate Cox regression analysis. Results revealed that ATAD2 expression was an independent factor for OS (P=0.028) (Table 3) and DFS (P=0.016) (Table 4) of GC patients.
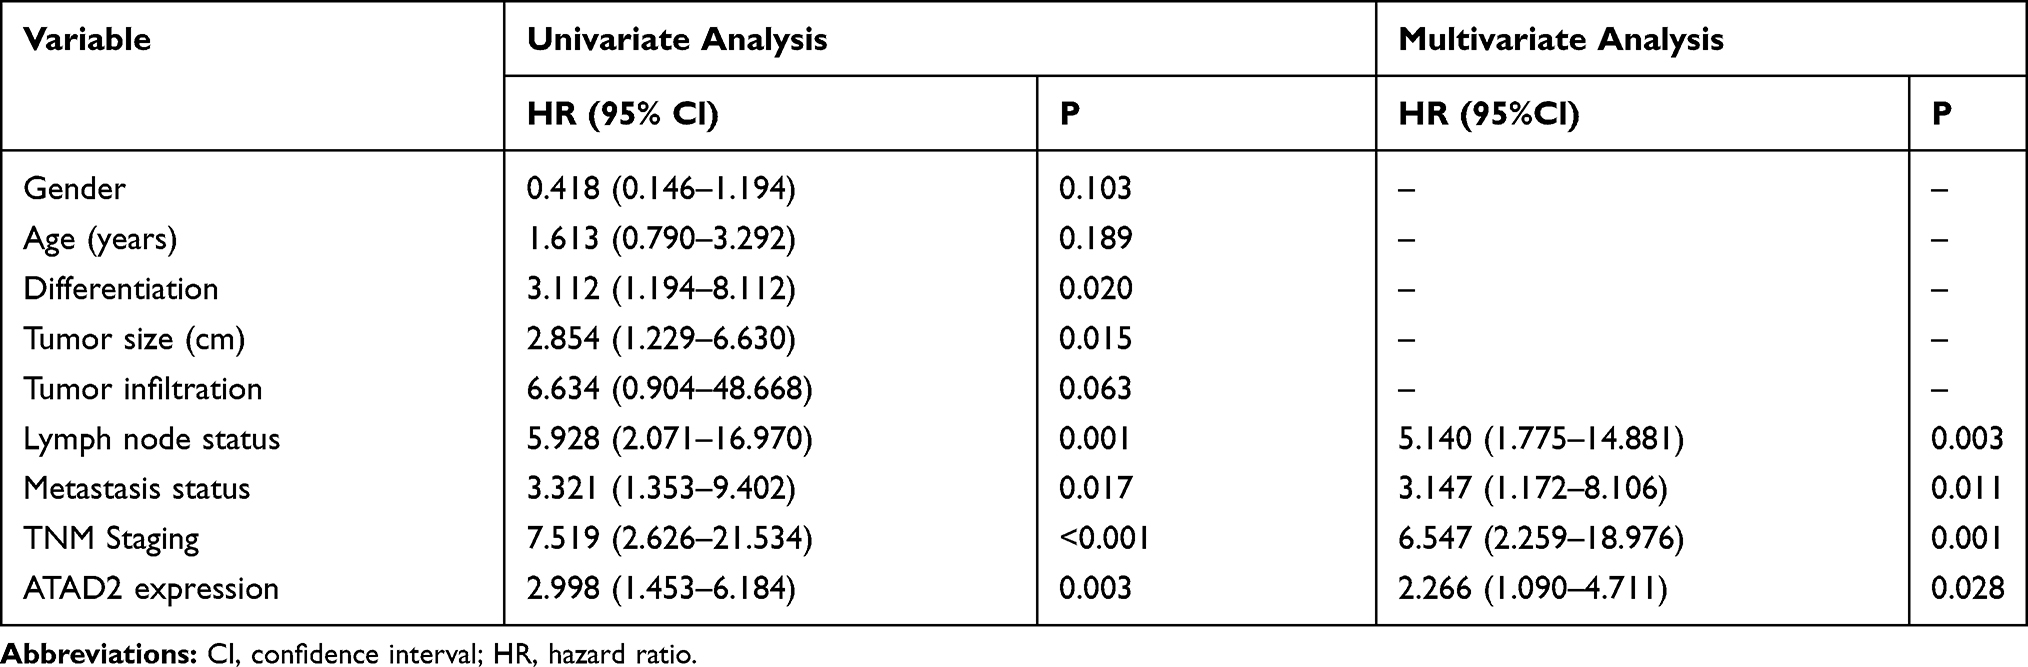 |
Table 3 Univariate and Multivariate Analysis of Overall Survival Rates in GC Patients |
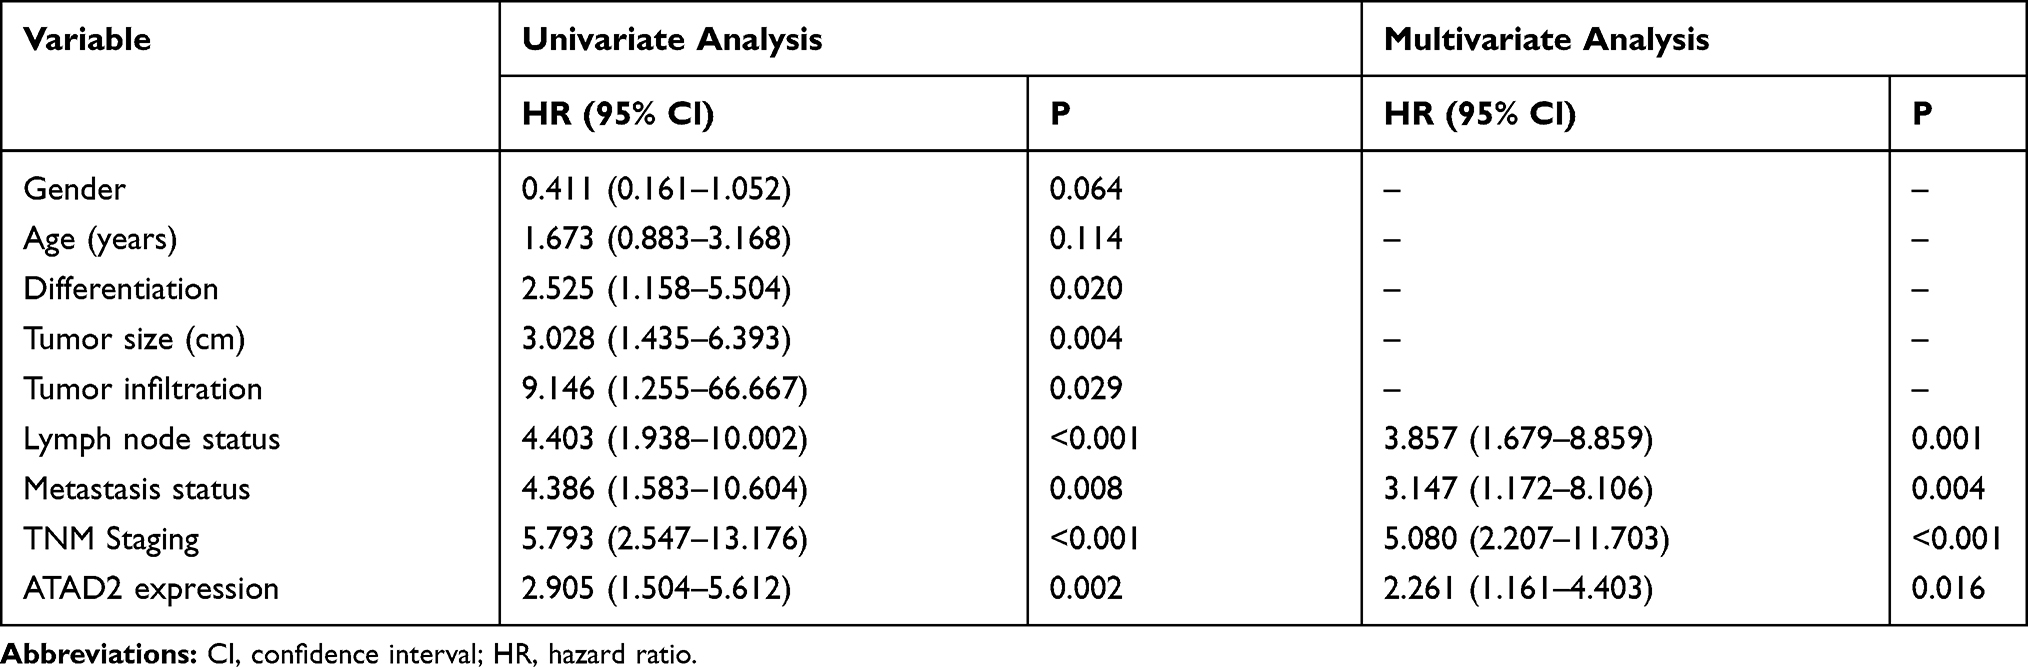 |
Table 4 Univariate and Multivariate Analysis of Disease-Free Survival Rates in GC Patients |
The Expression of ATAD2 in Different Gastric Lesions
To evaluate the expression of ATAD2 in different gastric lesions, we further detected the ATAD2 expression in 78 chronic superficial gastritis, 43 chronic atrophic gastritis, 16 low-grade intraepithelial neoplasia, 13 high-grade intraepithelial neoplasia paraffin-embedded specimens. We found that ATAD2 was not expressed in non-tumourous gastric tissues and low expressed in low-grade intraepithelial neoplasia, but highly expressed both in high-grade intraepithelial neoplasia and GC specimens (Figure 4A–J). ATAD2 expression in GC and high-grade intraepithelial neoplasia was higher than that in low-grade intraepithelial neoplasia (P<0.05). Its expression in low-grade intraepithelial neoplasia was higher than that in chronic atrophic gastritis and chronic superficial gastritis specimens (P<0.01), but there was no significant difference of ATAD2 expression between GC and high-grade intraepithelial neoplasia specimens (P>0.05) (Table 5).
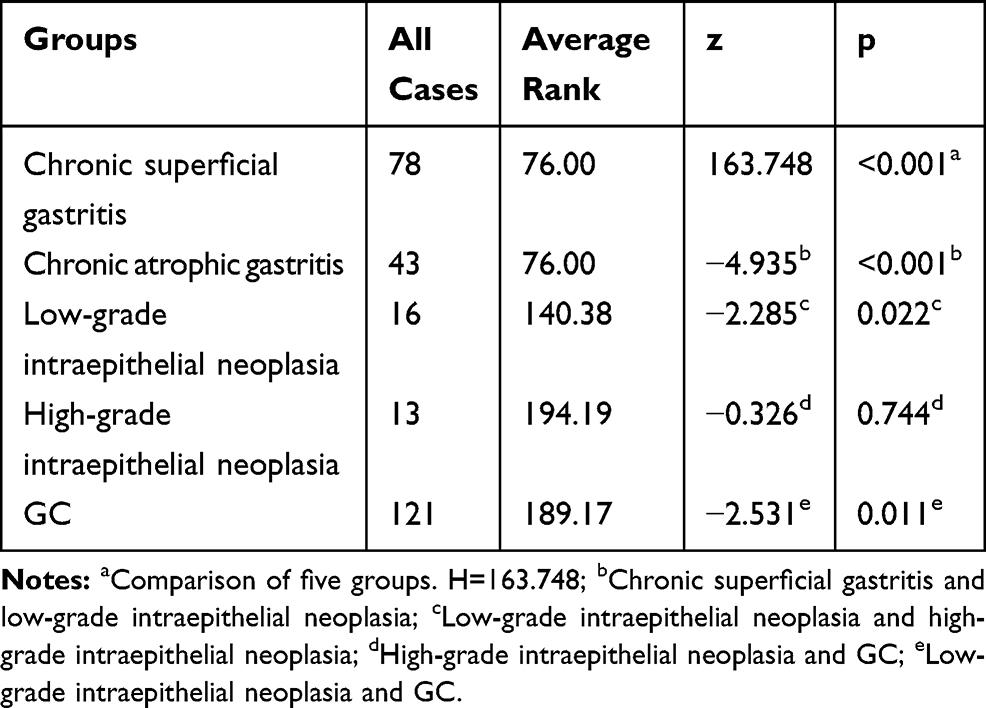 |
Table 5 The Expression of ATAD2 in Different Gastric Lesions |
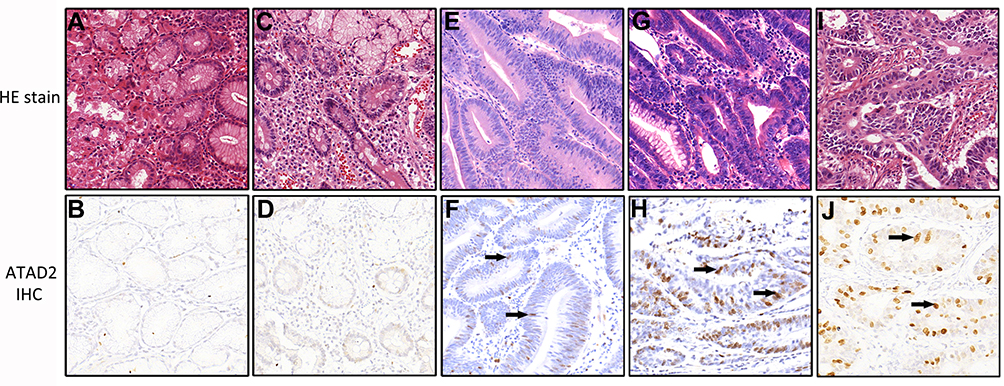 |
Figure 4 The expression of ATAD2 in different gastric lesions by immunohistochemistry (magnification ×200, PV6000 method). (A, B) Chronic superficial gastritis; (C, D) Chronic atrophic gastritis; (E, F) Low-grade intraepithelial neoplasia; (G, H) High-grade intraepithelial neoplasia; (I, J) Adenocarcinoma. The positive cells were marked clearly with black arrows. |
Knockdown of ATAD2 Expression Inhibits the Proliferation and Colony Formation of GC Cells in vitro
To investigate the involvement of ATAD2 in the proliferation and colony formation of GC cells in vitro, ATAD2 was knocked down in SGC-7901 and MGC-803 cells using specific shRNA. Knockdown of ATAD2 markedly reduced the expression of ATAD2 in SGC-7901 and MGC-803 cells (Figure 5A). By MTT assays, the cell viability was significantly reduced in both SGC-7901 and MGC-803 cells transfected with pLV-ATAD2 shRNA compared to the cells transfected with pLV-control (P<0.05) (Figure 5B). Furthermore, we also observed that knockdown of ATAD2 resulted in a significant inhibition of colony formation in both SGC-7901 and MGC-803 cells. The number of colonies formed in matrix gel was much lower in cells transfected with pLV-ATAD2 shRNA than that in the control groups (P<0.05) (Figure 5C and D). These results indicated that knockdown of ATAD2 suppresses the proliferation and colony formation of GC cells.
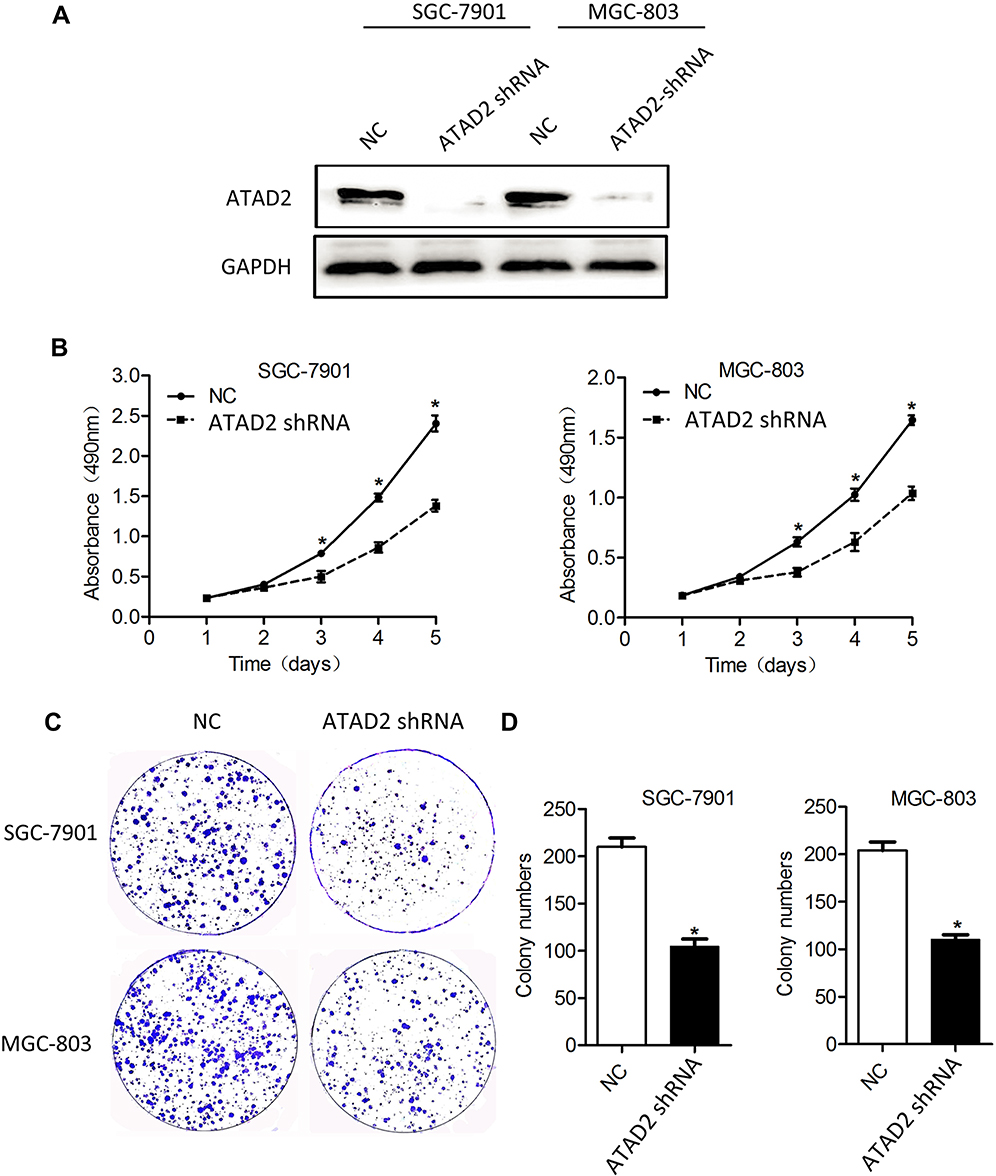 |
Figure 5 Knockdown of ATAD2 expression inhibits the proliferation and colony formation of GC cells. (A) The endogenous ATAD2 expression levels were detected by Western blot in SGC-7901 and MGC-803 cells transfected with pLV-ATAD2 shRNA or pLV-control for 48 hrs. (B) MTT cell viability assays were performed on days 1 to 5 after the transfection of SGC-7901 and MGC-803 cells with either pLV-ATAD2 shRNA or pLV-control. The data represents the mean ± SD of 3 independent experiments. (*P<0.05 compared with control). (C, D) The colony formation assays were performed in SGC-7901 and MGC-803 cells transfected with pLV-ATAD2 shRNA or pLV-control and incubated for 14 days. The data represents the mean ± SD of 3 independent experiments; (*P<0.05 compared with the control). |
Knockdown of ATAD2 Inhibits G1/S Phase Transition of GC Cells in vitro
Using flow cytometric assay, the mechanism underlying growth inhibition by knockdown of ATAD2 was investigated. We examined the cell cycle of SGC-7901 and MGC-803 cells. As shown in Figure 6, the percentage of cells in the G0/G1 phase was increased in SGC-7901 and MGC-803 cells transfected with pLV-ATAD2 shRNA when compared to the control groups. However, the percentage of cells in the S phase was significantly decreased in SGC-7901 and MGC-803 cells transfected with pLV-ATAD2 shRNA (P<0.05). There were no significant changes in the percentage of cells in the G2/M phase when cells were transfected with pLV-ATAD2 shRNA or pLV-control (P>0.05). These results indicate that knockdown of ATAD2 inhibited G1/S phase transition of the cell cycle, consistent with the finding that knockdown of ATAD2 suppresses the proliferation of GC cells.
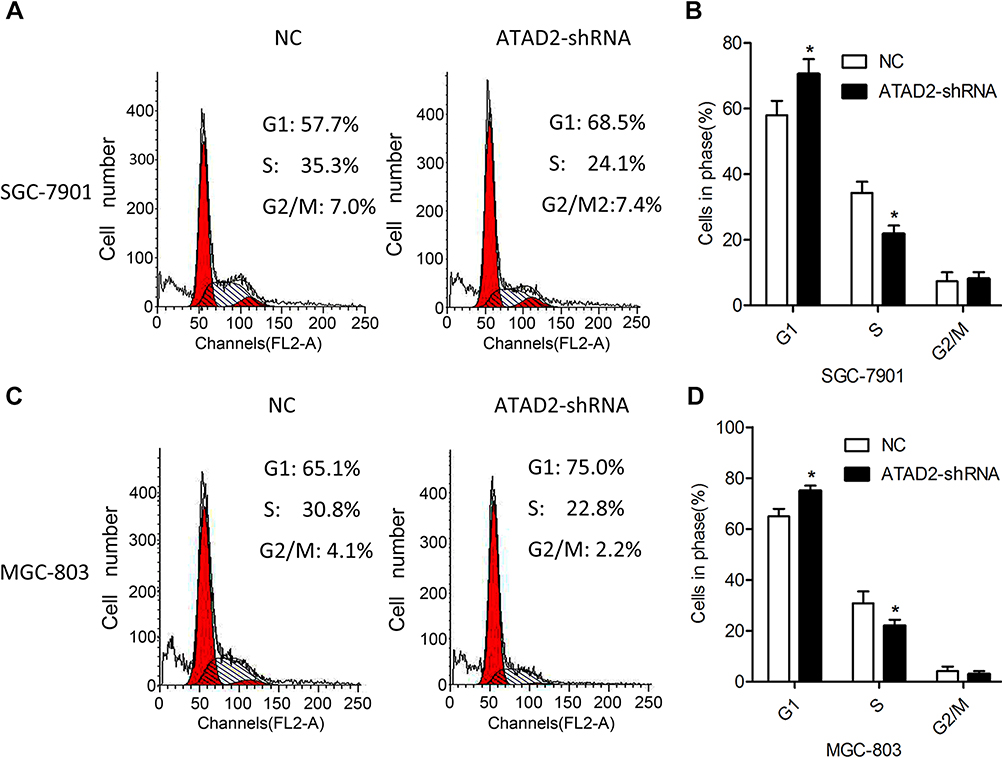 |
Figure 6 Knockdown of ATAD2 inhibits G1/S phase transition of GC cells. (A, B) Cell cycle profiles were analysed by flow cytometer after SGC-7901 cells were transfected with pLV-GRP78 shRNA or pLV-control for 48 hrs. (C, D) Cell cycle profiles were analysed by flow cytometer after MGC-803 cells were transfected with pLV-GRP78 shRNA or pLV-control for 48 hrs. Data were from three independent experiments and expressed as means ± SD; (*P<0.05 compared with control). |
Knockdown of ATAD2 Induces Apoptosis of GC Cells in vitro
The potential role of ATAD2 in apoptosis was further examined by the Annexin-V/PI method in GC cells. Annexin V binds to those cells that express phosphatidylserine on the outer layer of the cell membrane, which is a characteristic feature of cells entering the process of apoptosis. Apoptosis of GC cells after inhibition of ATAD2 was assessed by Flow cytometry. We observed significant differences of Annexin-V-positive apoptotic cells in SGC-7901 and MGC-803 cells transfected with pLV-ATAD2 shRNA in comparison to cells transfected with pLV-control (Figure 7A–D). These results suggest that inhibition of ATAD2 can induce apoptosis in SGC-7901 and MGC-803 cells.
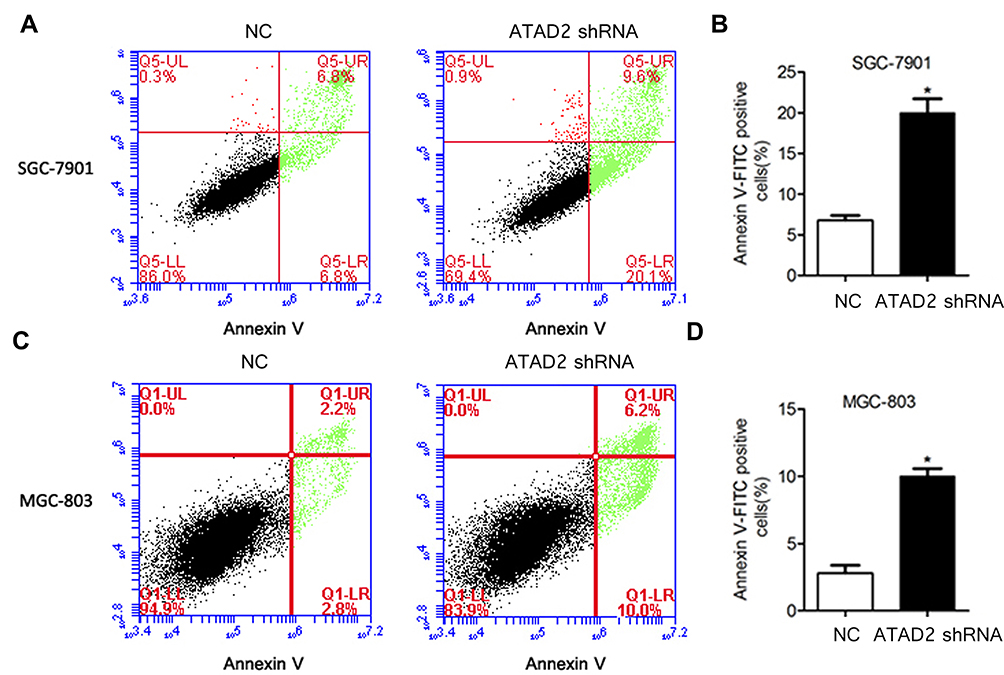 |
Figure 7 Knockdown of ATAD2 induces apoptosis of GC cells. (A, B) Knockdown of ATAD2 significantly induced apoptosis after SGC-7901 cells were transfected with pLV-GRP78 shRNA or pLV-control for 48 hrs. (C, D) Knockdown of ATAD2 significantly induces apoptosis after MGC-803 cells were transfected with pLV-GRP78 shRNA or pLV-control for 48 hrs. Data were from three independent experiments and expressed as means ± SD; (*P<0.05 compared with control). |
Knockdown of ATAD2 Altered the Expression of Key Cell-Cycle Regulatory and Apoptosis-Related Proteins
Because our results suggested that ATAD2 has a role in the transition from G1 to S phase in GC cells, we used Western blot to analyse the expression of key regulators in cell cycle after knockdown of ATAD2. As shown in Figure 8A, knockdown of ATAD2 in SGC-7901 and MGC-803 cells reduced the expression of cyclinD1, ppRb, E2F1, and cyclinE. However, no changes were noted in pRb and cyclinA levels. Western blot analysis also indicated that the apoptotic markers cleaved-PARP and cleaved-Caspase 3 were dramatically increased in SGC-7901 and MGC-803 cells transfected with pLV-ATAD2 shRNA (Figure 8B). These results further supported that knockdown of ATAD2 inhibited G1/S phase transition of the cell cycle and induce apoptosis in SGC-7901 and MGC-803 cells.
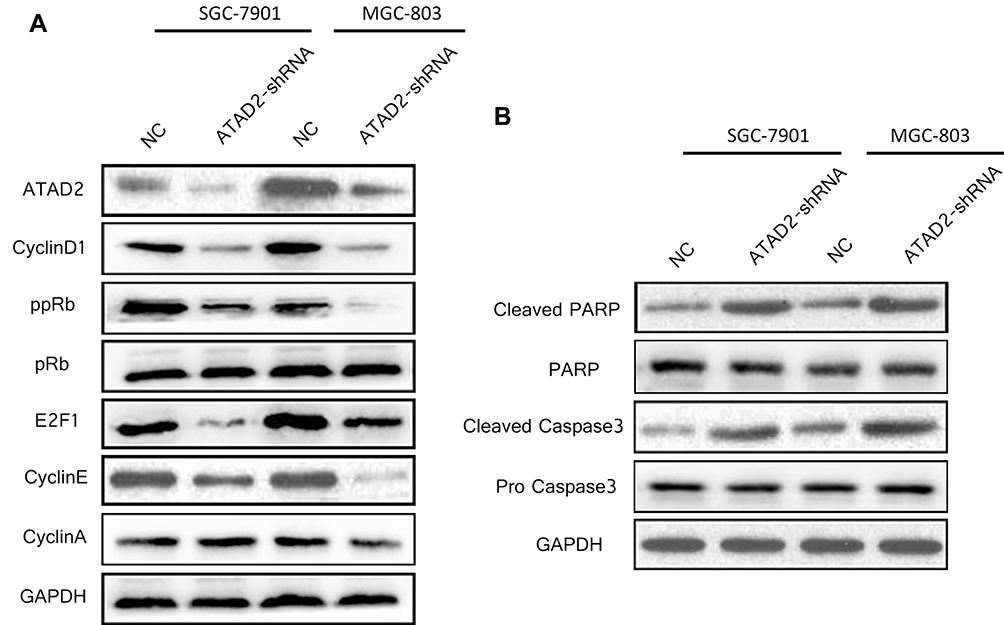 |
Figure 8 Knockdown of ATAD2 altered the expression of key cell-cycle regulatory and apoptosis-related proteins. (A) Western blot analysis of key cell-cycle regulatory proteins cyclin D1, phosphorylated Rb (ppRb), total Rb proteins (pRb), E2F1, cyclin E and cyclin A in SGC-7901 and MGC-803 cells transfected with either pLV-ATAD2 shRNA or pLV-control. (B) Western blot analysis of the apoptosis-related proteins cleaved-PARP, PARP, cleaved-Caspase 3, Caspase 3 in SGC-7901 and MGC-803 cells transfected with either pLV-ATAD2 shRNA or pLV-control. GAPDH was used as a loading control. |
Knockdown of ATAD2 Suppresses Tumour Growth in vivo
As inhibition of ATAD2 suppresses the proliferation of GC cells in vitro, we hypothesized that inhibition of ATAD2 may have a similar effect in vivo. To evaluate this, athymic BALB/c mice were inoculated with SGC-7901 cells stably transfected with pLV-ATAD2 shRNA or pLV-control and monitored tumour growth by measuring tumour volume every 3 days for 6 weeks. As shown in Figure 9A–D, we found that tumours grew at a slower rate with smaller sizes in mice injected cells transfected with pLV-ATAD2 shRNA than in those transfected with pLV-control and xenograft tumours obtained from the pLV-ATAD2 shRNA infected mice were of lower weight than those observed in pLV-control group. Consistently, the downregulation of Ki67 was observed in the tumours generated from the cells transfected with pLV-ATAD2 shRNA according to the results of IHC analysis (Figure 9E and F). These results reveal that inhibition of ATAD2 may suppress tumour growth in vivo.
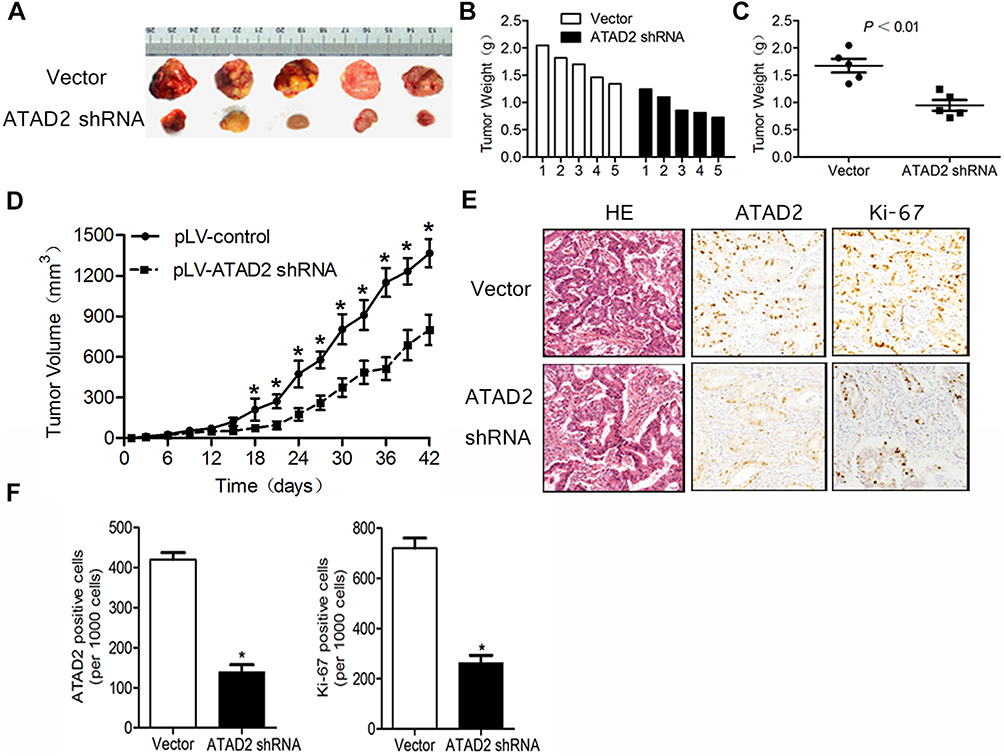 |
Figure 9 Knockdown of ATAD2 suppresses tumour growth in vivo. (A) Tumour formation in nude mice 6 weeks after injection with SGC-7901 cells transfected with pLV-ATAD2 shRNA or pLV-control. (B, C) Weights of the generated tumours by SGC-7901 cells transfected with pLV-ATAD2 shRNA or pLV-control 6 weeks after the initial injection. Data was shown as means ± SD. (D) Growth curves of generated tumors by SGC-7901 cells transfected with pLV-ATAD2 shRNA or pLV-control. Volumes of the tumours were measured every 3 days for 6 weeks. (E, F) IHC analysis of 6 pLV-ATAD2 shRNA- and 6 pLV-control-generated tumours 6 weeks after injection. Representative fields are shown (×200). For each generated tumour, five fields were randomly selected according to semi-quantitative scales. ATAD2- and Ki67-positive cells per 1000 cells were counted by three independent experienced pathologists. The bar graph shows average expression levels of ATAD2 and Ki67 of pLV-ATAD2 shRNA- and pLV-control-generated tumours. Data were shown as means ± SD; (*P<0.05 compared with control). |
Discussion
Cancer cells frequently express genes that are specifically or preferentially expressed in male germ cells under normal conditions.17 ATAD2 is one such gene, and it can regulate various tumor-related signal transduction pathways and participate in tumorigenesis and progression of multiple tumours.6,7,9,15 Abnormal expression of ATAD2 in GC has been reported;18 however, its possible roles in the carcinogenesis of GC have not been investigated to date.
ATAD2 has been reported to be overexpressed in multiple solid tumours in human cancers and involved in the process of tumorigenesis.6–12 In accordance with these findings, we demonstrated that both mRNA and protein levels of ATAD2 were increased in GC tissues. In addition, immunohistochemical analysis also showed that ATAD2 was not expressed in non-tumourous gastric tissues, but its expression in GC and high-grade intraepithelial neoplasia was higher than that in low-grade intraepithelial neoplasia, and in low-grade intraepithelial neoplasia was higher than that in chronic atrophic gastritis and chronic superficial gastritis specimens. Specifically, correlation of ATAD2 expression with clinicopathological parameters showed that high ATAD2 expression correlated significantly with tumour size, tumour differentiation, and clinical TNM stage. Furthermore, high ATAD2 expression was an independent predictor of poor OS and DFS in GC patients. These results suggest that ATAD2 plays an important role in the process of tumorigenesis and progression of GC; and ATAD2 may be a promising novel prognostic biomarker for GC patients.
The anti-proliferation effect of ATAD2 inhibition in SGC-7901 and MGC-803 cells was also observed in our in vitro experiments. Furthermore, we found that knockdown of ATAD2 could also suppress tumour growth in vivo. To further understand the mechanisms underlying this anti-proliferative effect, we analysed the cell cycle and apoptosis of GC cells after inhibition of ATAD2. Our results showed that silencing of ATAD2 induced G1/S phase cell cycle arrest and apoptosis in SGC-7901 and MGC-803 cells, in accordance with a recent report that ATAD2 knockdown-mediated growth suppression was due to the activation of apoptotic signals.19 Our data suggest that the anti-proliferative effect of silencing of ATAD2 in SGC-7901 and MGC-803 cells is not only associated with G1/S phase cell cycle arrest but also correlates with apoptosis.
ATAD2 can function as a cofactor with other transcription factors, such as E2F,7 and it can also improve the transcription activity of c-Myc13,14 to regulate specific sets of genes that have oncogenic functions. Through c-Myc and E2F transcription factors, ATAD2 increases the expression of proliferation-related and anti-apoptotic genes in many different types of cancer.20,21 Our results showed that silencing of ATAD2 reduced the expression of key cell cycle regulatory proteins cyclinD1, ppRb, E2F1, and cyclinE. pRb is a target of CDK4/CDK6 and is phosphorylated once cyclin D1 binds to CDK4/CDK6. ppRb is then released from E2F, which in turn acts as a transcription factor that targets several genes engaged in cell cycle progression and cell proliferation. Given that cyclinD1, cyclinE, and c-Myc are well-characterised targets of transcriptional regulation by E2F1,22 our results indicated that ATAD2 positively regulates cyclinD1 and cyclinE expression, accounting for G1/S arrest through the Rb-E2F1 pathway. Our results also showed that ATAD2 depletion induced cell apoptosis in vitro, which was associated with marked upregulation of the apoptotic markers cleaved-PARP and Caspase 3. Some studies have provided further mechanistic insights by revealing apoptosis induced by ATAD2 in cancers. A recent study reported that suppression of ATAD2 inhibits hepatocellular carcinoma progression through activation of p53- and p38-mediated apoptotic signalling.19 Therefore, novel molecular mechanisms underlying ATAD2 knockdown-mediated suppression of cell growth in GC will be further investigated in our future studies.
Conclusion
Taken together, our study demonstrated that ATAD2 plays an important role in the process of tumorigenesis and progression of GC, and it represents a promising novel independent prognostic biomarker for GC patients; silencing of ATAD2 in SGC-7901 and MGC-803 cells inhibits cells proliferation by inducing G1 cell cycle arrest and apoptosis. It has been suggested that ATAD2 may be a novel therapeutic target for the treatment of GC patients.
Acknowledgments
This work was supported by grants from the National Natural Science Foundation of China (81502388) and “Clinical Medicine﹢X” project of the Medical College of Qingdao University (2017Q14).
Author Contributions
FGX carried out and coordinated the study; XZ, HHJ, DXY, and HL performed the experiments; HYL and JX checked the statistical results; YJL and FL collected the FFPE samples of GC patients; and XZ wrote the paper. All authors contributed to data analysis, drafting or revising the article, gave final approval of the version to be published, and agreed to be accountable for all aspects of the work.
Disclosure
The authors declare no conflict of interests for this article.
References
1. Rugge M, Fassan M, Graham DY. Epidemiology of Gastric Cancer. Springer International Publishing; 2015:23–34.
2. Kosaka T, Endo M, Toya Y, et al. Long‐term outcomes of endoscopic submucosal dissection for early gastric cancer: A single‐center retrospective study. Dig Endosc. 2014;26:183–191. doi:10.1111/den.2014.26.issue-2
3. Fukagawa T, Katai H, Mizusawa J, et al. A prospective multi-institutional validity study to evaluate the accuracy of clinical diagnosis of pathological stage III gastric cancer. Gastric Cancer. 2018;21:68–73. doi:10.1007/s10120-017-0701-1
4. Smyth EC, Verheij M, Allum W, Cunningham D, Cervantes A, Arnold D. Gastric cancer: ESMO clinical practice guidelines for diagnosis, treatment and follow-up. Ann Oncol. 2016;27:v38–v49. doi:10.1093/annonc/mdw350
5. Cattaneo M, Morozumi Y, Perazza D, et al. Lessons from yeast on emerging roles of the ATAD2 protein family in gene regulation and genome organization. Mol Cells. 2014;37:851–856. doi:10.14348/molcells.2014.0258
6. Boussouar F, Jamshidikia M, Morozumi Y, Rousseaux S, Khochbin S. Malignant genome reprogramming by ATAD2. Biochim et Biophys Acta. 2013;1829:1010–1014. doi:10.1016/j.bbagrm.2013.06.003
7. Hsia EY, Kalashnikova EV, Revenko AS, Zou JX, Borowsky AD, Chen HW. Deregulated E2F and the AAA+ coregulator ANCCA drive proto-oncogene ACTR/AIB1 overexpression in breast cancer. Mol Cancer Res. 2010;8:183–193. doi:10.1158/1541-7786.MCR-09-0095
8. Wan WN, Zhang YX, Wang XM, et al. ATAD2 is highly expressed in ovarian carcinomas and indicates poor prognosis. Asian Pac J Cancer Prev. 2014;15:2777–2783. doi:10.7314/APJCP.2014.15.6.2777
9. Raeder MB, Birkeland E, Trovik J, et al. Integrated genomic analysis of the 8q24 amplification in endometrial cancers identifies ATAD2 as essential to MYC-dependent cancers. PLoS One. 2013;8:e54873. doi:10.1371/journal.pone.0054873
10. Zhang Y, Sun Y, Li Y, et al. ANCCA protein expression is a novel independent poor prognostic marker in surgically resected lung adenocarcinoma. Ann Surg Oncol. 2013;20:S577–S582. doi:10.1245/s10434-013-3027-1
11. Wu G, Liu H, He H, et al. miR-372 down-regulates the oncogene ATAD2 to influence hepatocellular carcinoma proliferation and metastasis. BMC Cancer. 2014;14:107. doi:10.1186/1471-2407-14-107
12. Alizadeh AA, Eisen MB, Davis RE, et al. Distinct types of diffuse large B-cell lymphoma identified by gene expression profiling. Nature. 2000;403:503–511. doi:10.1038/35000501
13. Wu G, Lu X, Wang Y, et al. Epigenetic high regulation of ATAD2 regulates the Hh pathway in human hepatocellular carcinoma. Int J Oncol. 2014;45:351–361. doi:10.3892/ijo.2014.2416
14. Ciro M, Prosperini E, Quarto M, et al. ATAD2 is a novel cofactor for MYC, overexpressed and amplified in aggressive tumors. Cancer Res. 2009;69:8491–8498. doi:10.1158/0008-5472.CAN-09-2131
15. Schmittgen TD, Livak KJ. Analyzing real-time PCR data by the comparative CT method. Nat Protoc. 2008;3:1101–1108. doi:10.1038/nprot.2008.73
16. Luo Y, Ye GY, Qin SL, Yu MH, Mu YF, Zhong M. ATAD2 overexpression identifies colorectal cancer patients with poor prognosis and drives proliferation of cancer cells. Gastroenterol Res Pract. 2015;2015:1–8.
17. Rousseaux S, Khochbin S. New hypotheses for large-scale epigenome alterations in somatic cancer cells: a role for male germ-cell-specific regulators. Epigenomics. 2009;1:153–161. doi:10.2217/epi.09.1
18. Zhang M, Zhang C, Du W, Yang X, Chen Z. ATAD2 is overexpressed in gastric cancer and serves as an independent poor prognostic biomarker. Clin Transl Oncol. 2016;18:776–781. doi:10.1007/s12094-015-1430-8
19. Lu WJ, Chua MS, So SK. Suppression of ATAD2 inhibits hepatocellular carcinoma progression through activation of p53- and p38-mediated apoptotic signaling. Oncotarget. 2015;6:41722–41735. doi:10.18632/oncotarget.6152
20. Hsia EYC, Zou JX, Chen HW. The roles and action mechanisms of p160/SRC coactivators and the ANCCA coregulator in cancer. Prog Mol Biol Transl Sci. 2009;87:261–298.
21. Caron C, Lestrat C, Marsal S, et al. Functional characterization of ATAD2 as a new cancer/testis factor and a predictor of poor prognosis in breast and lung cancers. Oncogene. 2010;29:5171–5181. doi:10.1038/onc.2010.259
22. Trimarchi JM, Lees JA. Sibling rivalry in the E2F family. Nat Rev Mol Cell Biol. 2002;3:11–20. doi:10.1038/nrm714
 © 2020 The Author(s). This work is published and licensed by Dove Medical Press Limited. The full terms of this license are available at https://www.dovepress.com/terms.php and incorporate the Creative Commons Attribution - Non Commercial (unported, v3.0) License.
By accessing the work you hereby accept the Terms. Non-commercial uses of the work are permitted without any further permission from Dove Medical Press Limited, provided the work is properly attributed. For permission for commercial use of this work, please see paragraphs 4.2 and 5 of our Terms.
© 2020 The Author(s). This work is published and licensed by Dove Medical Press Limited. The full terms of this license are available at https://www.dovepress.com/terms.php and incorporate the Creative Commons Attribution - Non Commercial (unported, v3.0) License.
By accessing the work you hereby accept the Terms. Non-commercial uses of the work are permitted without any further permission from Dove Medical Press Limited, provided the work is properly attributed. For permission for commercial use of this work, please see paragraphs 4.2 and 5 of our Terms.