")
Back to Journals » OncoTargets and Therapy » Volume 14
Key Role of MCUR1 in Malignant Progression of Breast Cancer
Authors Gao P , Peng T , Lin S, Zhi W, Cao C , Wu P, Xi L, Wu P , Yang Q, Ding W
Received 22 February 2021
Accepted for publication 7 June 2021
Published 13 July 2021 Volume 2021:14 Pages 4163—4175
DOI https://doi.org/10.2147/OTT.S306854
Checked for plagiarism Yes
Review by Single anonymous peer review
Peer reviewer comments 2
Editor who approved publication: Dr Leo Jen-Liang Su
Peipei Gao,1 Ting Peng,1 Shitong Lin,1 Wenhua Zhi,1 Canhui Cao,1 Ping Wu,1 Ling Xi,1,2 Peng Wu,1,2 Qin Yang,3 Wencheng Ding1,2
1Cancer Biology Research Center (Key Laboratory of the Ministry of Education), Department of Obstetrics and Gynecology, Tongji Hospital, Tongji Medical College, Huazhong University of Science and Technology, Wuhan, Hubei, People’s Republic of China; 2Department of Obstetrics and Gynecology, Tongji Hospital, Tongji Medical College, Huazhong University of Science and Technology, Wuhan, Hubei, People’s Republic of China; 3Institute of Pathology, Tongji Hospital, Tongji Medical College, Huazhong University of Science and Technology, Wuhan, Hubei, People’s Republic of China
Correspondence: Wencheng Ding
Department of Obstetrics and Gynecology, Tongji Hospital, Tongji Medical College, Huazhong University of Science and Technology, Wuhan, Hubei, People’s Republic of China
Email [email protected]
Qin Yang
Institute of Pathology, Tongji Hospital, Tongji Medical College, Huazhong University of Science and Technology, Wuhan, Hubei, People’s Republic of China
Email [email protected]
Background: Mitochondrial calcium uniporter regulator 1 (MCUR1, also known as CCDC90A) is a protein-coding gene that plays a key role in mitochondrial calcium uptake. However, knowledge about its clinical significance in breast cancer is still limited.
Methods: The expression profile of MCUR1 in various cancers was analyzed via the ONCOMINE and Tumor Immune Estimation Resource databases. The correlation between MCUR1 expression and the clinical features of breast cancer was investigated using UALCAN and MEXPRESS. Immunohistochemical analysis was applied to verify the expression of MCUR1 in breast cancer. The prognostic significance of MCUR1 in breast cancer was evaluated using Kaplan–Meier plotter and the PrognoScan database. Gene Set Enrichment Analysis (GSEA) was performed to explore the possible biological functions of MCUR1. In addition, the function of MCUR1 was examined by gene silencing in vitro. Western blotting was applied to detect the expression of proteins.
Results: MCUR1 was overexpressed in breast cancer and significantly related to the clinical characteristics of breast cancer. Results from the public databases and IHC analysis indicated that MCUR1 expression was the highest in triple-negative breast cancer (TNBC). The high expression of MCUR1 was associated with poor overall survival, distant metastasis-free survival, and recurrence-free survival. GSEA showed that the hypoxia pathway, cellular reactive oxygen species (ROS) pathway, epithelial–mesenchymal transition pathway, and notch signaling pathway were differentially enriched in the high MCUR1 expression phenotype. In vitro experiments showed that MCUR1 knockdown in TNBC cell lines led to a decrease in cellular ROS and weakened cell migration and invasion abilities. Moreover, Western blotting showed that MCUR1 knockdown inhibited the epithelial–mesenchymal transition of TNBC cells via the ROS/Nrf2/Notch pathways.
Conclusion: Our study suggests that MCUR1 plays a pivotal role in the malignant progression of breast cancer.
Keywords: MCUR1, breast cancer, reactive oxygen species, epithelial-mesenchymal transition
Introduction
Breast cancer seriously threatens female health and quality of life. According to the International Agency for Research on Cancer, female breast cancer is the most commonly occurring cancer worldwide, with approximately 2.3 million newly diagnosed cases in 2020, accounting for 11.7% of all new cancer cases globally.1 Although the overall five-year survival rate for breast cancer patients exceeds 80%, metastasis to distant organs is still the main cause of breast cancer-related death.2 Triple-negative breast cancer (TNBC) is an aggressive subtype that constitutes 12–18% of breast cancer patients.3,4 TNBC patients lack the estrogen receptor (ER), progesterone receptor (PR) and human epidermal growth factor receptor 2 (HER2), and therefore are ineligible for hormone or anti-HER2 therapy. Thus, due to its high mortality rate, novel therapeutic strategies are urgently needed.5
As a widely distributed and crucial second messenger, calcium is an important regulator of cell metastasis.6,7 Mitochondrial calcium regulates various processes from bioenergetics to cell death.8–10 Studies have shown that mitochondrial calcium homeostasis is unbalanced in malignant tumors, including in breast cancer.8,11 The mitochondrial calcium uniporter complex is considered a potential target for cancer treatment.12,13 Mitochondrial calcium uniporter regulator 1 (MCUR1, also known as CCDC90A) is an essential component of mitochondrial calcium uptake and regulator of cellular metabolism.14,15 Furthermore, in hepatocellular carcinoma, MCUR1 facilitates cell survival and epithelial-mesenchymal transition via the mitochondrial calcium dependent reactive oxygen species (ROS)/Nrf2/Notch pathway.16,17 To date, however, evidence is limited regarding the clinical significance of MCUR1 in breast cancer.
In the present study, we found that MCUR1 was dysregulated in various cancers. We comprehensively analyzed the expression of MCUR1 in breast cancer through public datasets and immunohistochemical staining, and explored the role of MCUR1 in the malignant progression of cancer through in vitro cell experiments.
Methods
Datasets
The expression of MCUR1 in various cancers were analyzed via the ONCOMINE database (https://www.ONCOMINE.org/resource/login.html)18 and Tumor Immune Estimation Resource (TIMER) (https://cistrome.shinyapps.io/timer/).19 The relationships between the expression of MCUR1 and clinical features of breast invasive carcinoma were explored via UALCAN (http://ualcan.path.uab.edu/)20 and MEXPRESS (https://mexpress.be/).21,22 The prognostic significance of MCUR1 expression in breast cancer was analyzed by the Kaplan-Meier Plotter (http://kmplot.com/analysis/)23 and PrognoScan (http://www.prognoscan.org/).24 The correlation analyses of gene expression were performed on the Gene Expression Profiling Interactive Analysis (GEPIA) (http://gepia.cancer-pku.cn/).25
Immunohistochemical (IHC) Staining
Tissue chip, obtained from Shanghai Outdo Biotech Company (Shanghai, China), including breast cancer tissues (n=139) and peritumor tissues (n=90) with signed informed consents, was used to evaluate the expression of MCUR1. The latest follow-up date was July 2013 and the follow-up duration ranging from 9 to 12.5 years. All tissues were assessed by H&E staining to select suitable regions for further examination. Intensity score of immunohistochemical staining was assigned as strong (+++ or 3), moderate (++ or 2), weak (+ or 1), or absent (- or 0). The frequency of positive cells is defined as < 5% (0), 5–25% (1), 26–50% (2), 51–75% (3), or >75% (4). IHC scores were presented as mean with standard deviation (SD). Statistical analysis was performed by unpaired t-test. For subgroup analysis according to protein expression, scores of 0‐7 were considered low expression and scores of 8‐12 were considered high expression.
Cell Culture and Reagents
Human breast cancer cell lines MDA-MB-231 and HCC-1937 were cultured in 5% CO2 incubator at 37°C. MDA-MB-231 cells provided by Sun Yat-sen University were cultured in DMEM medium with 10% Fetal Bovine Serum (FBS). HCC-1937 from the Shanghai Cell Bank of the Chinese Academy of Sciences were cultured in RPIM-1640 medium with 10% Fetal Bovine Serum.
Knockdown of MCUR1 Gene
Cells were seeded in six-well plates, siRNA transfection was performed when the cell density reaches about 60%. After transfection for 72h, the real-time fluorescent quantitative PCR and Western blotting analysis were performed to verify the transfection efficiency. All siRNAs were synthesized from RiboBio (Guangzhou, China) and the sequences were provided in Supplementary Table 1. Primers and antibodies used in this study were listed in Supplementary Table 2 and Supplementary Table 3 separately.
Detection of Reactive Oxygen Species (ROS)
Cellular ROS were detected by the fluorescence probe DCFH-DA (Beyotime, China). After 72 hours of transfection, cells were incubated with DCFH-DA (10 uM) for 20 minutes. Then, the samples were analyzed by flow cytometry (Beckman). FlowJo_V10 software was used for data analysis and t-test was used for statistical analysis.
Gene Set Enrichment Analysis (GSEA)
In order to further study the molecular biological pathways involved in MCUR1, enrichment analysis was performed by GSEA v4.1.0 software (https://www.gsea-msigdb.org/gsea/downloads.jsp). The gene expression data from TCGA breast cancer was used and H: hallmark gene sets from the Molecular Signatures Database (MSigDB) were used as the reference gene sets.26 TCGA samples were sorted by the expression of MCUR1, and were divided into the high expression phenotype and the low expression phenotype. Gene sets that were clustered at the top or bottom significantly were considered to contribute to the phenotype. Normalized Enrichment Score (NES) > 1.0, Nominal p-value < 0.05, and FDR q-value < 0.25 were considered to be significantly.
Analysis for Cell Invasion and Metastasis
Forty-eight hours after transfection, a wound was scratched using a 200μL pipette tip in each well. Cells were washed with phosphate buffer saline for several times and then incubated in 2% FBS medium. Wound closure was monitored at 0 and 24h on Olympus Inverted Microscope. The distance of cell migration at 0 and 24 h after scratching was evaluated. Forty-eight hours after transfection, cell migration and invasion abilities were assessed through transwell assay. Cells were prepared as a single cell suspension. For cell invasion assays, transwell chambers were coated with Matrigel. The upper chamber was seeded with 3×10⁴ cells suspended in 500μL of serum-free medium, while the lower chamber was filled with 25% FBS medium. After 24h incubation, the transwell chamber was immersed in 4% paraformaldehyde for 10 min and stained with 0.1% crystal violet for 10 min. Then, cells in the upper chamber were carefully removed with a cotton swab. The invasive cells attaching to the lower surface of the membrane were counted under microscopy.
Nuclear and Cytoplasmic Protein Extraction
Nuclear and cytoplasmic proteins were extracted according to the instruction manual from the Nuclear and Cytoplasmic Protein Extraction Kit (Beyotime, China). Then, cytoplasmic and nuclear proteins of each sample were analyzed by Western blotting with antibodies against the indicated proteins. Hsp60 was used as internal reference of cytoplasmic protein, and Lamin B1 was used as an internal reference of nuclear protein.
Statistical Analyses
Kaplan-Meier curves were based on the Log rank test. All experiments were repeated at least three times. The data was presented as mean with standard deviation (SD) and multiple t tests were used for statistical analysis. P-value < 0.05 was considered to be significant.
Results
Expression Profile of MCUR1 in Various Cancers
We first found that MCUR1 was dysregulated in a variety of tumors. As shown in Figure 1A, we set the following thresholds in the ONCOMINE database: p-value of 0.05, fold change of 1.5, and gene rank of all. Dysregulated MCUR1 expression was found in various types of cancer, including breast cancer, cervical cancer, lymphoma, and ovarian cancer. In addition, the expression of MCUR1 was analyzed in samples from TCGA using TIMER2. Results showed that MCUR1 was overexpressed in invasive breast carcinoma and lung carcinoma, and lowly expressed in kidney carcinoma (Figure 1B). As breast cancer is the most common cancer worldwide, we analyzed the expression of MCUR1 in breast cancer through the ONCOMINE database (see Table 1). Interestingly, compared with normal breast tissue samples, MCUR1 was highly expressed in breast cancer samples and lowly expressed in breast cancer stroma.
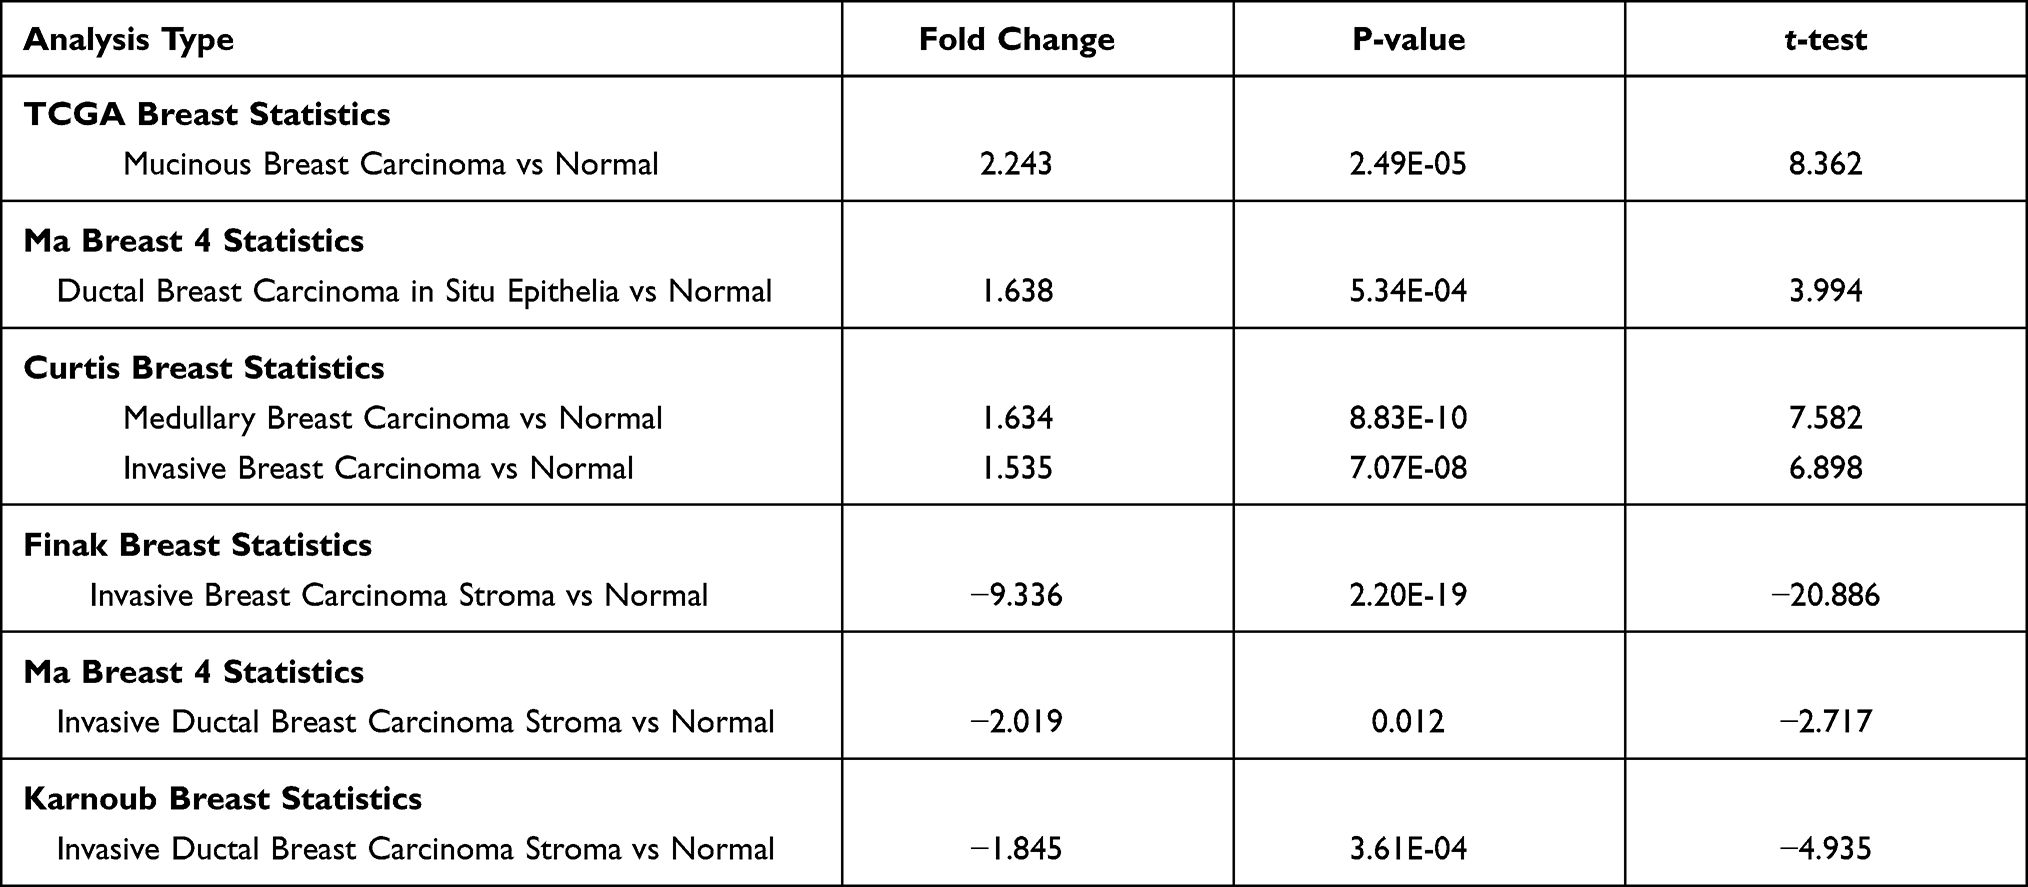 |
Table 1 MCUR1 Expression in Breast Cancer (ONCOMINE) |
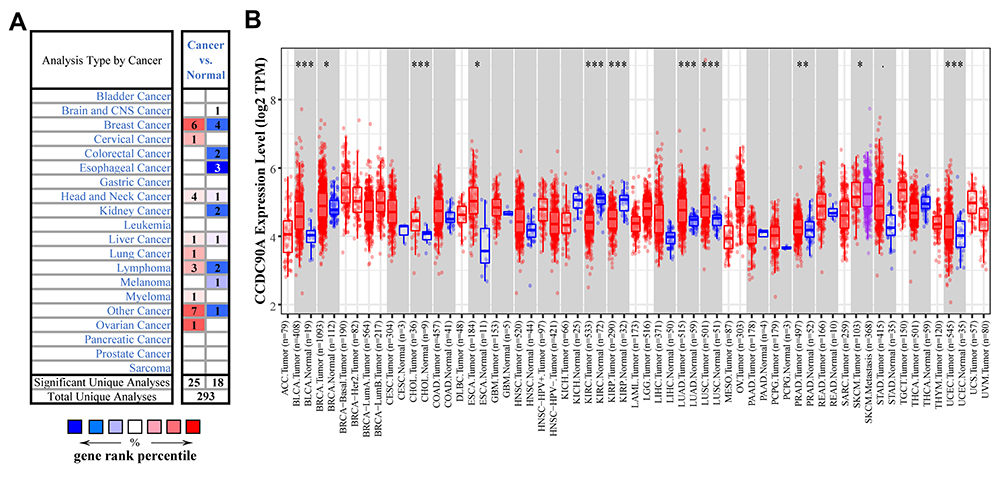 |
Figure 1 The expression profile of MCUR1 in various cancer. (A) The expression of MCUR1 in cancers based on data from the ONCOMINE. The thresholds were set as follows: p-value of 0.05, fold change of 1.5, and gene rank of all. (B) The expression of MCUR1 in TCGA samples through TIMER2. (Statistical significance: *p<0.05, **p<0.01, ***p<0.001). |
The Expression of MCUR1 in Breast Cancer
We next investigated the relationship between MCUR1 expression and the clinical characteristics of breast cancer based on TCGA samples using UALCAN and MEXPRESS. As shown in Figure 2A, MCUR1 was obviously overexpressed in breast cancer (p < 0.001). We further explored MCUR1 expression based on cancer stage, and found that MCUR1 was more highly expressed in the advanced clinical stage (Figure 2B). After we analyzed the expression of MCUR1 based on molecular subtypes, MCUR1 showed significantly higher expression in TNBC samples compared to other subtypes (Figure 2C). Many studies have identified the important role of TP53 mutation in various cancers.27–29 In our study, a strong relationship between MCUR1 overexpression and TP53 mutation was also found (Figure 2D). When performed visual analysis in MEXPRESS based on 1268 samples of invasive breast carcinoma (Figure 2E), MCUR1 expression was found to be significantly associated with estrogen receptor status (p = 4.432e-21), progesterone receptor status (p = 2.288e-22), and histological type (p = 1.806e-25). In addition, MCUR1 expression was related to metastatic site at diagnosis (p = 0.005), sample type (p = 0.021), and subtype of invasive breast carcinoma (p = 8.034e-21).
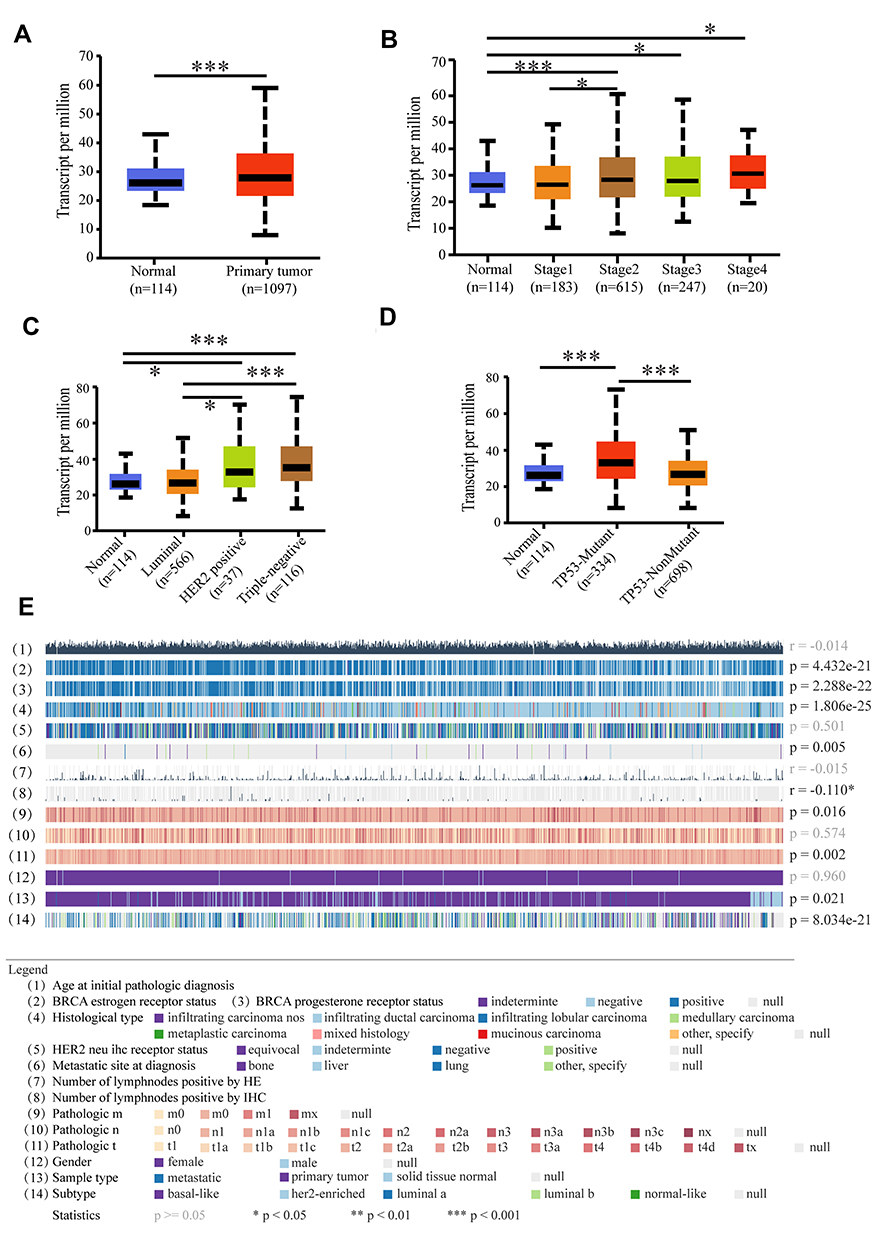 |
Figure 2 Comprehensive analysis of MCUR1 based on public databases. (A) MCUR1 was over expressed in breast cancer. (B) The expression of MCUR1 in breast cancer based on individual cancer stages. (C) The expression of MCUR1 in breast cancer based on breast cancer subclasses. (D) The expression of MCUR1 in breast cancer based on TP53 mutation status. (E) The relationship between MCUR1 expression and clinical characteristics of breast cancer based on TCGA samples via MEXPRESS. Statistical significance (correlation coefficient (r) and p-value) were shown on the right. (*p<0.05, ***p<0.001). |
We also explored the relationship between MCUR1 expression and methylation level of the MCUR1 promoter in breast cancer via MEXPRESS and UALCAN. As shown in Supplementary Figure 1, the promoter methylation level of MCUR1 was low in breast cancer (Supplementary Figure 1a) and lowest in luminal breast cancer (Supplementary Figure 1b). When evaluating the relationship between MCUR1 methylation and TP53 mutation, the methylation level of MCUR1 was lower in TP53 non-mutation patients (Supplementary Figure 1c). In addition, MCUR1 expression was positively correlated with MCUR1 copy number, and negatively correlated with MCUR1 promoter methylation (Supplementary Figure 1d). We identified five CpG islands of MCUR1 (ie, cg05768403, cg00214855, cg18831738, cg20860086, and cg04558386) that were negatively associated with MCUR1 gene expression in invasive breast carcinoma.
IHC Analysis of MCUR1 Expression in Breast Cancer
We evaluated the expression of MCUR1 in breast cancer (n = 139) and peritumor tissues (n = 90) through IHC staining, resulting in a total of 129 tumor and 68 peritumor samples for subsequent analysis after removal of ineligible samples. The clinical characteristics of patients with breast cancer included in IHC analysis were shown in Table 2. The age range of the overall samples was 29–83 years old (mean ± SD: 54.1 ± 13.5). Figure 3A showed the representative IHC images of MCUR1 expression. The IHC scores of MCUR1 were significantly higher in tumor tissues than in peritumor tissues (Figure 3B, p < 0.001), consistent with the results of our analysis from public databases. Moreover, in the high MCUR1 expression group, TNBC subtype (Figure 3C) and stage III (Figure 3D) accounted for the largest proportion. Thus, both the public database and IHC results showed that MCUR1 was highly expressed in breast cancer and was related to molecular type and clinical stage.
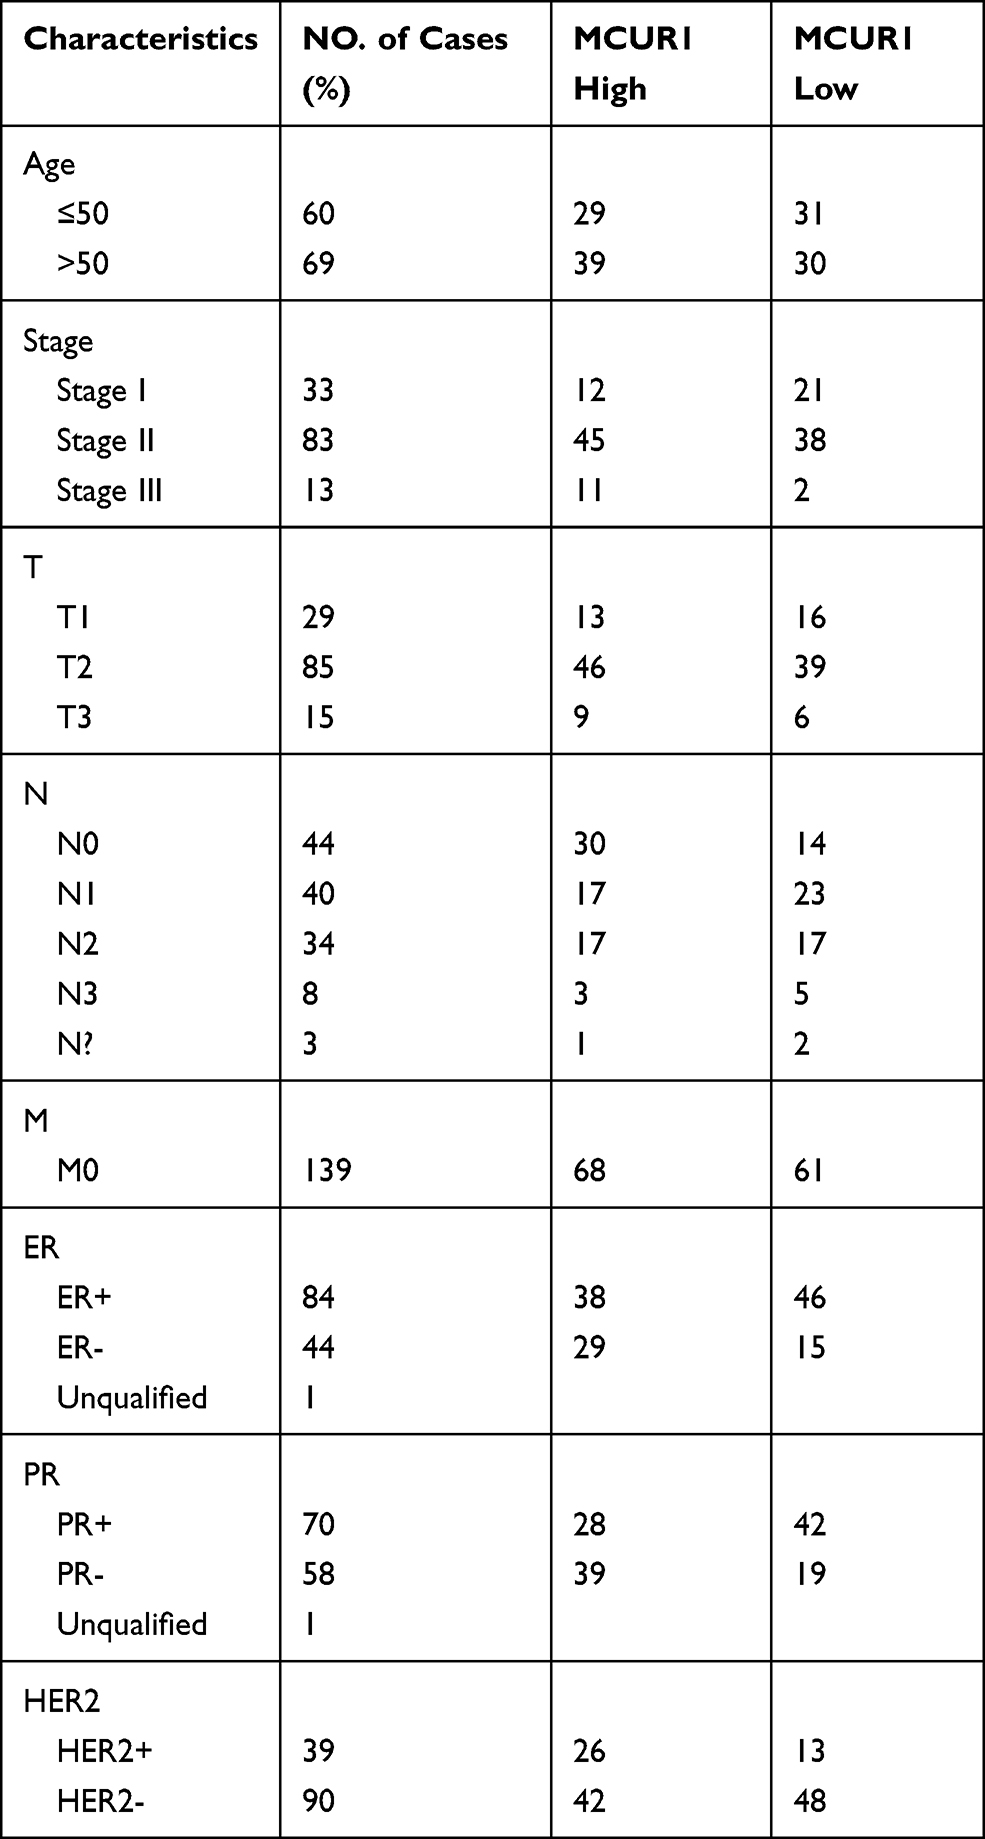 |
Table 2 Characteristics of Patients with Breast Cancer Included in Immunohistochemical Analysis |
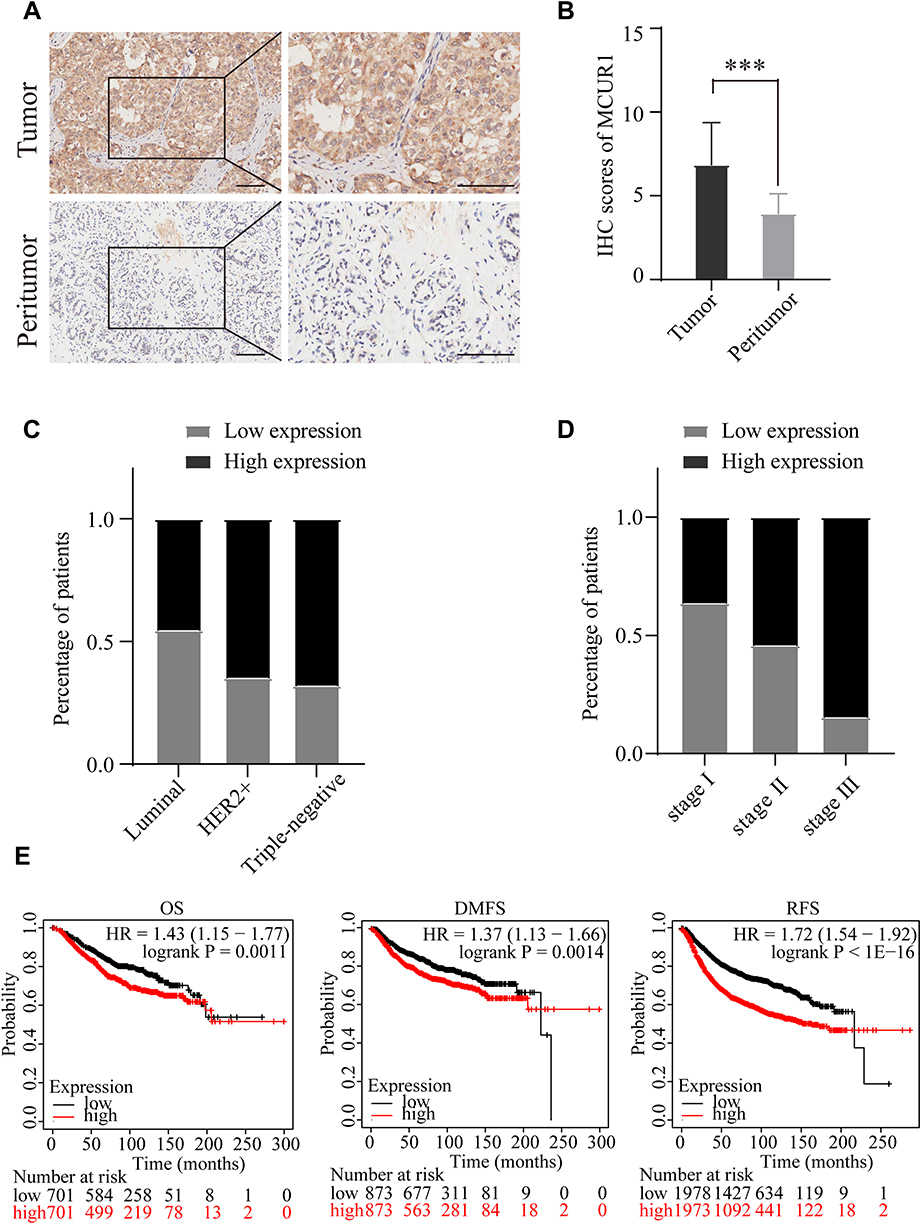 |
Figure 3 MCUR1 was over expressed in breast cancer and predicted poor prognosis. (A) Representative immunohistochemical staining images of MCUR1 in tissues (Scale bars:100um). (B) IHC scores of MCUR1 in tumor and peritumor tissues of breast cancer. IHC scores were presented as mean with SD. The TNBC molecular subtype (C) and stage III (D) account for the largest proportion among the high expression group. (E) The OS, DMFS and RFS were compared between the MCUR1-high and MCUR1-low expression groups in breast cancer. (***p<0.001). |
MCUR1 Overexpression Predicted Poor Survival in Breast Cancer
To assess the prognostic value of MCUR1 in breast cancer, we analyzed the prognosis of patients based on MCUR1 expression using the PrognoScan database and Kaplan-Meier plotter. Evidences showed that MCUR1 overexpression significantly affected the prognosis of multiple cancers, including breast cancer, lung adenocarcinoma and skin cancer (Supplementary Table 4). We further analyzed the prognostic potential of MCUR1 in breast cancer via Kaplan-Meier plotter. As expected, high MCUR1 expression was significantly correlated with poor overall survival (OS) (hazard ratio (HR) = 1.43, log-rank p = 0.0011), poor distant metastasis-free survival (DMFS) (HR = 1.37, log-rank p = 0.0014), and poor recurrence-free survival (RFS) (HR = 1.72, log-rank p < 1E-16) in breast cancer patients (Figure 3E).
Cellular ROS Decreased After MCUR1 Knockdown in Breast Cancer Cell Lines
To explore the significance of MCUR1 in breast cancer progression, we knocked down MCUR1 in the MDA-MB-231 and HCC-1937 TNBC cell lines by transient transfection of small interfering RNA (siRNA). Real-time fluorescent quantitative polymerase chain reaction (PCR) and Western blotting analysis were performed to identify knockdown efficiency. As shown in Figure 4A–B, the third one (ie, siMCUR1-3) had the best knockdown effect. Therefore, siMCUR1-3 was selected for subsequent study. We found that the level of cellular ROS significantly decreased after MCUR1 knockdown (Figure 4C). To validate this result, GSEA was performed using gene expression data from TCGA breast cancer. We found that the hypoxia and ROS pathways were differentially enriched in the high MCUR1 expression phenotype (Figure 4D). These results indicate that MCUR1 may be closely related to oxidative stress.
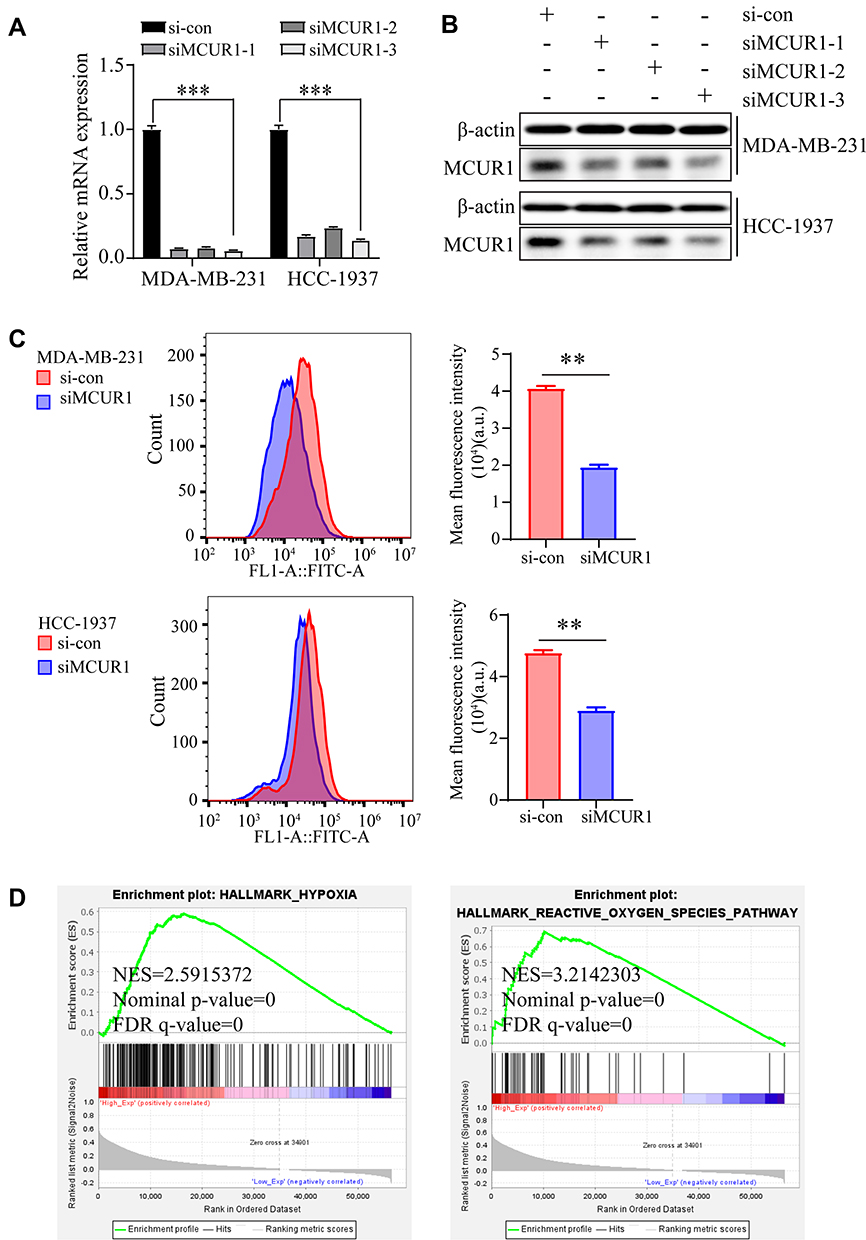 |
Figure 4 Suppression of MCUR1 promoted ROS decrease. The relative mRNA expression (A) and protein level (B) of MCUR1 after transient transfection by siRNAs. (C) The cellular ROS in MDA-MB-231 and HCC-1937 after MCUR1 knockdown. (D) Gene Set Enrichment Analysis were performed based on TCGA breast cancer samples. (** p< 0.01, ***p<0.001). |
Suppression of MCUR1 Inhibited Epithelial-Mesenchymal Transition via the ROS/Nrf2/Notch Pathway
Emerging evidences suggest that the production of cellular ROS is essential for maintaining the metastatic phenotype of tumors.30,31 Thus, we studied changes in the invasion and metastasis phenotypes of breast cancer cell lines after ROS decreased. As shown in Figure 5A–C, cell migration and invasion capabilities significantly decreased after knockdown of MCUR1. Moreover, GSEA revealed that the epithelial-mesenchymal transition and Notch signaling pathways were enriched in the MCUR1 high expression phenotype (Figure 6A). In order to verify the phenomena and analysis results, the expression of related proteins was analyzed by Western blotting. As shown in Figure 6B, GSS, GLRX, and GPX8 which related to ROS were downregulated after MCUR1 knockdown. Epithelial markers (ZO-1 and E-cadherin) increased and mesenchymal markers (N-cadherin and Snail) decreased following MCUR1 knockdown (Figure 6C). In addition, Nrf2 and Notch1 were found to be positively correlated in breast cancer via GEPIA (Figure 6D). The protein levels of Nrf2 decreased in the nucleus and increased in the cytoplasm after MCUR1 knockdown. Meanwhile, Notch1 expression also decreased (Figure 6E).
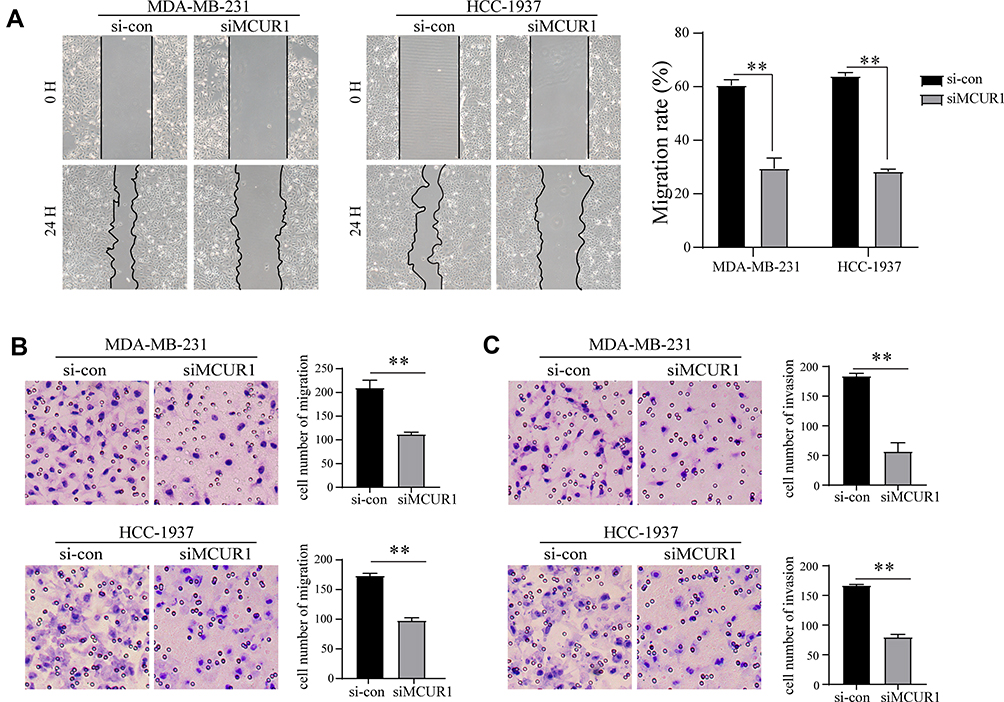 |
Figure 5 MCUR1 knockdown inhibited epithelial-mesenchymal transition of TNBC. (A) Wound healing assays for migration rate. Transwell assay for migration (B) and invasion (C) ability in transient transfected TNBC cells. (** p< 0.01). |
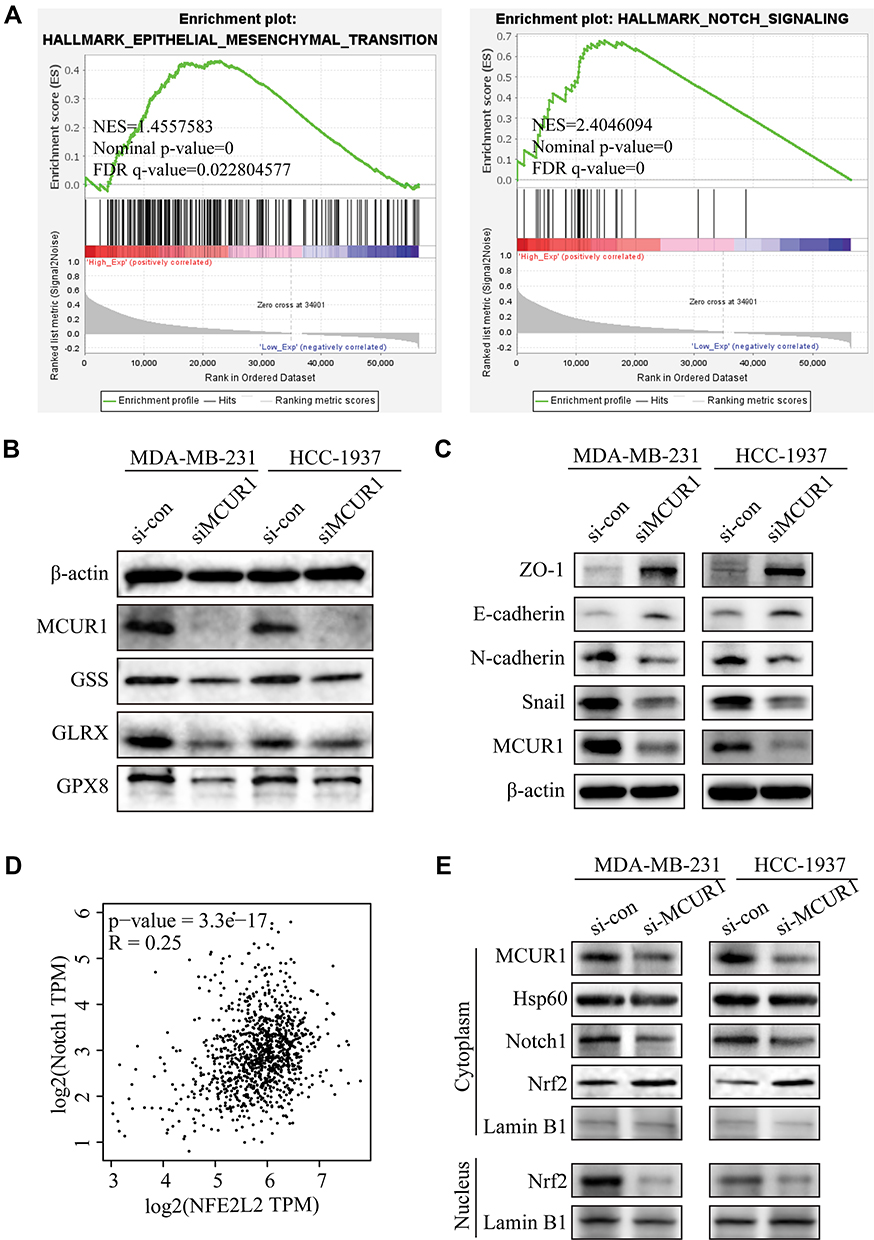 |
Figure 6 Suppression of MCUR1 inhibited EMT via the ROS/Nrf2/Notch pathway. (A) GSEA results based on TCGA breast cancer samples. (B) Expression levels of the ROS-associated proteins after MCUR1 knockdown. (C) Expression levels of the EMT-associated proteins after MCUR1 knockdown. (D) The relationship between Nrf2 (NFE2L2) and Notch1 in breast cancer via GEPIA. (E) Western blotting analysis of the Nrf2/Notch pathway. |
Discussion
MCUR1 is an important component of the mitochondrial calcium uniporter complex, which plays a key role in the mitochondrial calcium uptake and cell physiology.14,32 Previous studies have shown that MCUR1 occupies a pivotal role in hepatocellular carcinoma, and is closely related to the survival and metastasis of hepatocellular carcinoma through the mitochondrial calcium dependent ROS pathway.16,17 In this study, we found that MCUR1 was overexpressed in breast cancer, with the highest expression detected in TNBC. Importantly, overexpression of MCUR1 predicted poor survival in breast cancer patients. This finding is significant and worthy of further study. TNBC is an aggressive breast cancer subtype with limited treatment options and poor prognosis.33 Therefore, we explored the function of MCUR1 knockdown in TNBC cell lines by siRNA transfection. Our study revealed that ROS decreased after MCUR1 silencing, and GSEA indicated that MCUR1 may be related to ROS. These results suggest that MCUR1 may play a crucial role in the malignant progression of breast cancer through oxidative stress.
Studies have shown that ROS levels are increased in cancer cells compared to healthy cells, which may be the cause of the genomic instability that leads to tumor formation.31 Moreover, a relative excess of ROS, known as oxidative stress, has been proved to be linked to tumor metastasis.30,34,35 Cell invasion and metastasis abilities were weakened after knocking down MCUR1 in the TNBC cell lines in this study. These findings are consistent with previous research, which states that mitochondrial calcium uniporter is related to breast cancer cell migration.6 Upon further exploration of the signaling pathway mechanism involved in MCUR1, we found that the Nrf2/Notch signaling pathway changed after MCUR1 knockdown.
Nrf2 is a major effector of ROS and regulates the expression of its target genes, including Notch1.36–39 According to previous reports, Nrf2 and the Notch signaling pathway are closely related to the epithelial-mesenchymal transition of cancer cells.31,38 Upon oxidative stress, Nrf2 disassociates from Keap-1 and translocates to the nucleus.32,33 In the present study, we revealed that MCUR1 knockdown significantly decreased the nuclear translocation of Nrf2, which, in turn, inhibited epithelial-mesenchymal transition in the TNBC cell lines. Therefore, our results suggest that MCUR1 may modulate epithelial-mesenchymal transition via the ROS/Nrf2/Notch pathway in breast cancer.
In summary, our study confirmed that MCUR1 is highly expressed and correlated with molecular subtype in breast cancer. These findings shed light on the important role of MCUR1 in breast cancer and provide novel evidence supporting MCUR1 as a promising therapeutic target for the treatment of TNBC. There are many factors that affect the malignant progression of breast cancer. In the future, we can carry out further research on the relationship between MCUR1 and genes involved in the malignant progression of breast cancer.
Ethics Statement
The MDA-MB-231 cells used in this study were provided by Prof. Qiang Liu (Breast Tumor Center, Sun Yat-sen Memorial Hospital, Sun Yat-sen University), who’s purchased from American Type Culture Collection (ATCC). Usage the cell line in this study was approved by the Ethics Committee of Tongji hospital, Tongji Medical College, Huazhong University of Science and Technology. The tissue chip used in this research was purchased from Shanghai Outdo Biotech Company (Shanghai, China). The samples in the tissue chip come from National Human Genetic Resources Sharing Service Platform (ID: 2005DKA21300). Preparation and sales of the chips was approved by the Ethics Committee of Shanghai Outdo Biotech Company (NO. YB M-05-02). At the same time, usage the chip in this study was approved by the ethics committee of Tongji hospital, Tongji Medical College, Huazhong University of Science and Technology.
Acknowledgments
We sincerely thank Dr. Tao Xu (Department of Thyroid and Breast Surgery, Tongji Hospital, Tongji Medical College, Huazhong University of Science and Technology) for providing the MDA-MB-231 cell line, which was permitted by the primary owner Prof. Qiang Liu (Breast Tumor Center, Sun Yat-sen Memorial Hospital, Sun Yat-sen University).
Author Contributions
All authors made a significant contribution to the work reported, whether that is in the conception, study design, execution, acquisition of data, analysis and interpretation, or in all these areas; took part in drafting, revising or critically reviewing the article; gave final approval of the version to be published; have agreed on the journal to which the article has been submitted; and agree to be accountable for all aspects of the work.
Funding
This work was supported by the National Natural Science Foundation of China (82072895 to Peng Wu).
Disclosure
The authors have no conflicts of interest to declare.
References
1. Ferlay JEM, Lam F, Colombet M, et al. Global cancer observatory: cancer today. IARC. 2020.
2. Barzaman K, Karami J, Zarei Z, et al. Breast cancer: biology, biomarkers, and treatments. Int Immunopharmacol. 2020;84:106535. doi:10.1016/j.intimp.2020.106535
3. Foulkes WD, Smith IE, Reis-Filho JS. Triple-negative breast cancer. N Engl J Med. 2010;363(20):1938–1948. doi:10.1056/NEJMra1001389
4. Grayson M. Breast cancer. Nature. 2012;485(7400):S49. doi:10.1038/485S49a
5. Waks AG, Winer EP. Breast cancer treatment: a Review. JAMA. 2019;321(3):288–300. doi:10.1001/jama.2018.19323
6. Prevarskaya N, Skryma R, Shuba Y. Calcium in tumour metastasis: new roles for known actors. Nat Rev Cancer. 2011;11(8):609–618. doi:10.1038/nrc3105
7. Tang S, Wang X, Shen Q, et al. Mitochondrial Ca2+ uniporter is critical for store-operated Ca2+ entry-dependent breast cancer cell migration. Biochem Biophys Res Commun. 2015.
8. Pan X, Liu J, Nguyen T, et al. The physiological role of mitochondrial calcium revealed by mice lacking the mitochondrial calcium uniporter. Nat Cell Biol. 2013;15(12):1464–1472. doi:10.1038/ncb2868
9. Wallace DC, Fan W, Fau - Procaccio V. Mitochondrial energetics and therapeutics. Annu Rev Pathol. 2010;5(1):297–348. doi:10.1146/annurev.pathol.4.110807.092314
10. Giorgi C, Romagnoli A, Pinton P, Rizzuto R. Ca2+ signaling, mitochondria and cell death. Curr Mol Med. 2008;8(2):119–130. doi:10.2174/156652408783769571
11. Murgia M, Giorgi C, Pinton P, Rizzuto R. Controlling metabolism and cell death: at the heart of mitochondrial calcium signalling. J Mol Cell Cardiol. 2009;46(6):781–788. doi:10.1016/j.yjmcc.2009.03.003
12. Cui C, Yang J, Fu L, Wang M, Wang X. Progress in understanding mitochondrial calcium uniporter complex-mediated calcium signalling: a potential target for cancer treatment. Br J Pharmacol. 2019;176(9):1190–1205. doi:10.1111/bph.14632
13. Cui C, Merritt R, Fu L, Pan Z. Targeting calcium signaling in cancer therapy. Acta Pharm Sin B. 2017;7(1):3–17. doi:10.1016/j.apsb.2016.11.001
14. Mallilankaraman K, Cardenas C, Doonan PJ, et al. MCUR1 is an essential component of mitochondrial Ca2+ uptake that regulates cellular metabolism. Nat Cell Biol. 2012;14(12):1336–1343. doi:10.1038/ncb2622
15. Vais H, Tanis JE, Muller M, et al. MCUR1, CCDC90A, is a regulator of the mitochondrial calcium uniporter. Cell Metab. 2015;22(4):533–535. doi:10.1016/j.cmet.2015.09.015
16. Ren T, Wang J, Zhang H, et al. MCUR1-mediated mitochondrial calcium signaling facilitates cell survival of hepatocellular carcinoma via reactive oxygen species-dependent P53 degradation. Antioxid Redox Signal. 2018;28(12):1120–1136. doi:10.1089/ars.2017.6990
17. Jin M, Wang J, Ji X, et al. MCUR1 facilitates epithelial-mesenchymal transition and metastasis via the mitochondrial calcium dependent ROS/Nrf2/Notch pathway in hepatocellular carcinoma. J Exp Clin Cancer Res. 2019;38(1):136. doi:10.1186/s13046-019-1135-x
18. Rhodes DR, Kalyana-Sundaram S, Mahavisno V, et al. Oncomine 3.0: genes, pathways, and networks in a collection of 18,000 cancer gene expression profiles. Neoplasia. 2007;9(2):166–180. doi:10.1593/neo.07112
19. Li T, Fan J, Wang B, et al. TIMER: a web server for comprehensive analysis of tumor-infiltrating immune cells. Cancer Res. 2017;77(21):e108–e110. doi:10.1158/0008-5472.CAN-17-0307
20. Chandrashekar DS, Bashel B, Balasubramanya SAH, et al. UALCAN: a portal for facilitating tumor subgroup gene expression and survival analyses. Neoplasia. 2017;19(8):649–658. doi:10.1016/j.neo.2017.05.002
21. Koch A, De Meyer T, Jeschke J, Van Criekinge W. MEXPRESS: visualizing expression, DNA methylation and clinical TCGA data. BMC Genomics. 2015;16(1):636. doi:10.1186/s12864-015-1847-z
22. Koch A, Jeschke J, Van Criekinge W, Van Engeland M, De Meyer T. MEXPRESS update 2019. Nucleic Acids Res. 2019;47(W1):W561–W565. doi:10.1093/nar/gkz445
23. Gyorffy B, Lanczky A, Eklund AC, et al. An online survival analysis tool to rapidly assess the effect of 22,277 genes on breast cancer prognosis using microarray data of 1809 patients. Breast Cancer Res Treat. 2010;123(3):725–731. doi:10.1007/s10549-009-0674-9
24. Mizuno H, Kitada K, Nakai K, Sarai A. PrognoScan: a new database for meta-analysis of the prognostic value of genes. BMC Med Genomics. 2009;2(1):18. doi:10.1186/1755-8794-2-18
25. Tang Z, Li C, Kang B, et al. GEPIA: a web server for cancer and normal gene expression profiling and interactive analyses. Nucleic Acids Res. 2017;45(W1):W98–W102. doi:10.1093/nar/gkx247
26. Subramanian A, Tamayo P, Mootha VK, et al. Gene set enrichment analysis: a knowledge-based approach for interpreting genome-wide expression profiles. Proc Natl Acad Sci U S A. 2005;102(43):15545–15550. doi:10.1073/pnas.0506580102
27. Muller PA, Vousden KH. Mutant p53 in cancer: new functions and therapeutic opportunities. Cancer Cell. 2014;25(3):304–317. doi:10.1016/j.ccr.2014.01.021
28. Lim LY, Vidnovic N, Ellisen LW, Leong CO. Mutant p53 mediates survival of breast cancer cells. Br J Cancer. 2009;101(9):1606–1612. doi:10.1038/sj.bjc.6605335
29. Kawamata H, Omotehara F, Nakashiro K, et al. Oncogenic mutation of the p53 gene derived from head and neck cancer prevents cells from undergoing apoptosis after DNA damage. Int J Oncol. 2007;30(5):1089–1097.
30. Peiris-Pages M, Martinez-Outschoorn UE, Sotgia F, Lisanti MP. Metastasis and oxidative stress: are antioxidants a metabolic driver of progression? Cell Metab. 2015;22(6):956–958. doi:10.1016/j.cmet.2015.11.008
31. Thomson GJ, Hernon C, Austriaco N, et al. Metabolism-induced oxidative stress and DNA damage selectively trigger genome instability in polyploid fungal cells. EMBO J. 2019;38(19):e101597. doi:10.15252/embj.2019101597
32. Tomar D, Dong Z, Shanmughapriya S, et al. MCUR1 is a scaffold factor for the MCU complex function and promotes mitochondrial bioenergetics. Cell Rep. 2016;15(8):1673–1685. doi:10.1016/j.celrep.2016.04.050
33. Bianchini G, Balko JM, Mayer IA, Sanders ME, Gianni L. Triple-negative breast cancer: challenges and opportunities of a heterogeneous disease. Nat Rev Clin Oncol. 2016;13(11):674–690. doi:10.1038/nrclinonc.2016.66
34. Piskounova E, Agathocleous M, Murphy MM, et al. Oxidative stress inhibits distant metastasis by human melanoma cells. Nature. 2015;527(7577):186–191. doi:10.1038/nature15726
35. Hayes JD, Dinkova-Kostova AT, Tew KD. Oxidative stress in cancer. Cancer Cell. 2020;38(2):167–197.
36. Rojo De La Vega M, Chapman E, Zhang DD. NRF2 and the hallmarks of cancer. Cancer Cell. 2018;34(1):21–43.
37. Zhang HS, Zhang ZG, Du GY, et al. Nrf2 promotes breast cancer cell migration via up-regulation of G6PD/HIF-1alpha/Notch1 axis. J Cell Mol Med. 2019;23(5):3451–3463. doi:10.1111/jcmm.14241
38. Denicola GM, Karreth FA, Humpton TJ, et al. Oncogene-induced Nrf2 transcription promotes ROS detoxification and tumorigenesis. Nature. 2011;475(7354):106–109. doi:10.1038/nature10189
39. Ganan-Gomez I, Wei Y, Yang H, Boyano-Adanez MC, Garcia-Manero G. Oncogenic functions of the transcription factor Nrf2. Free Radic Biol Med. 2013;65:750–764. doi:10.1016/j.freeradbiomed.2013.06.041
 © 2021 The Author(s). This work is published and licensed by Dove Medical Press Limited. The full terms of this license are available at https://www.dovepress.com/terms.php and incorporate the Creative Commons Attribution - Non Commercial (unported, v3.0) License.
By accessing the work you hereby accept the Terms. Non-commercial uses of the work are permitted without any further permission from Dove Medical Press Limited, provided the work is properly attributed. For permission for commercial use of this work, please see paragraphs 4.2 and 5 of our Terms.
© 2021 The Author(s). This work is published and licensed by Dove Medical Press Limited. The full terms of this license are available at https://www.dovepress.com/terms.php and incorporate the Creative Commons Attribution - Non Commercial (unported, v3.0) License.
By accessing the work you hereby accept the Terms. Non-commercial uses of the work are permitted without any further permission from Dove Medical Press Limited, provided the work is properly attributed. For permission for commercial use of this work, please see paragraphs 4.2 and 5 of our Terms.