")
Back to Journals » Cancer Management and Research » Volume 13
Key Candidate Genes – VSIG2 of Colon Cancer Identified by Weighted Gene Co-Expression Network Analysis
Authors Cui Z , Li Y, He S, Wen F, Xu X, Lu L, Wu S
Received 27 April 2021
Accepted for publication 5 July 2021
Published 15 July 2021 Volume 2021:13 Pages 5739—5750
DOI https://doi.org/10.2147/CMAR.S316584
Checked for plagiarism Yes
Review by Single anonymous peer review
Peer reviewer comments 3
Editor who approved publication: Dr Sanjeev K. Srivastava
Zhongze Cui,* Yangyang Li,* Shuang He, Feifei Wen, Xiaoyang Xu, Lizhen Lu, Shuhua Wu
Department of Pathology, Binzhou Medical University Hospital, Binzhou, Shandong Province, People’s Republic of China
*These authors contributed equally to this work
Correspondence: Shuhua Wu Email [email protected]
Background: Colon adenocarcinoma (COAD) is one of the most common malignancies. To identify candidate genes that may be involved in colon adenocarcinoma development and progression, weighted gene co-expression network analysis (WGCNA) was used to construct gene co-expression networks to explore associations between gene sets and clinical features and to identify candidate biomarkers. Moreover, we intend to make a preliminary exploration on it.
Methods: Gene expression profiles and clinical information were collected from The Cancer Genome Atlas COAD database for analysis. The gene expression profiles of GSE106582 and GSE110224 were screened from the Gene Expression Omnibus database for verification. WGCNA analysis, functional pathway enrichment analysis, and prognosis analysis were performed on three databases. Target genes were selected from the key genes for experimental verification and research.
Results: Key genes obtained by WGCNA analysis were mainly enriched in key functions and pathways such as drug metabolism, steroid hormones, and retinol metabolism. A total of four prognostic genes were screened out: SELENBP1, NAT2, VSIG2, and CES2. VSIG2 was selected as the target gene for experimental verification, and its encoded protein was found to be mainly expressed in immune cells. Its expression was positively correlated with immune infiltration.
Conclusions: VSIG2 was shown to be associated with immune invasion and antigen presentation in COAD, suggesting it plays an important role in COAD development and progression. It could be used as a potential biomarker or therapeutic target for COAD.
Keywords: prognosis, WGCNA, immune-related gene, molecular biomarkers, The Cancer Genome Atlas, Gene Expression Omnibus
Introduction
Colon adenocarcinoma (COAD) is the most important histological type of colorectal cancer (CRC), ranking third (13.5%) and second (9.5%) among the worldwide incidence of malignancies in male and female patients, respectively, and is a serious hazard to human health.1 Numerous studies over the past two decades have identified genetic mutations that are associated with the prognosis of COAD and patient response to treatment; moreover, some targeted therapies have also been developed.2,3–5 However, the exact molecular mechanism of COAD progression remains unclear, which limits the ability to treat advanced disease. Therefore, a better understanding of gene expression during the occurrence and progression of COAD will help improve diagnosis and treatment.
mRNA Microarray technology is becoming increasingly accurate and has been widely used to explore changes in animal and plant gene expression.6–8 In recent years, high-quality microarray and high-throughput sequencing have aided the discovery of changes in gene expression during COAD development and progression,9–11 and even screened biomarkers for COAD diagnosis, therapy, and prognosis. Gene profiles can be obtained from public databases such as Gene Expression Omnibus (GEO) and the Cancer Genome Atlas (TCGA), and the use of integrated bioinformatics methods can overcome the limitations associated with different microarray platforms and small sample sizes.
As a commonly used gene module analysis technique, weighted gene co-expression network analysis (WGCNA) has been widely used in the identification and screening of molecular markers or drug targets for complex diseases.12 In this study, genetic changes in CRC were identified from two mRNA microarray datasets in the TCGA and GEO database, and differentially expressed genes (DEGs) between COAD and normal tissues were obtained. Using WGCNA, the most significant functional modules in the process of cancer development were obtained, and the differentially expressed genes in the modules were screened out as research objects. Gene Ontology (GO) and Kyoto Encyclopedia of Genes and Genomes (KEGG) were used for functional enrichment analysis. The target genes were obtained through survival analysis, then prognostic genes were screened and VSIG2 was selected as a target gene for experimental verification.
Materials and Methods
WGCNA Analysis of TCGA
Gene expression profile data with corresponding clinical data were searched for and downloaded from the TCGA database (https://portal.gdc.cancer.gov/). TCGA COAD dataset gene expression profiles contained 437 samples including 398 tumor tissues and 39 corresponding healthy mucosal tissues. COAD clinical datasets of 385 patients were also downloaded. Cystic, mucinous, and serous neoplasm\complex epithelial neoplasm\complex epithelial neoplasm COAD samples were excluded from analysis. The series matrix files from TCGA were annotated with an official gene symbol using the data table of the microarray platform to obtain gene expression matrix files. R software was used to identify differentially expressed genes (DEGs), with fold change >2 and adjusted P-value <0.05 considered to indicate a statistically significant difference.
The “WGCNA” R package was used to construct co-expression networks for all genes in TCGA COAD and healthy samples. First, RNASeq data were filtered to reduce outliers, then an appropriate soft threshold β weighting coefficient was selected to build gene networks in the connection between the scale-free network, and the phase relationship between genes was used to construct a hierarchical clustering tree. Next, the weighted correlation coefficient of the gene was used in classification according to expression pattern, with genes sharing similar patterns grouped into the same module; genes were then classified into different modules according to their expression pattern for the next analysis. Then, this weighted correlation coefficient was used to transform the correlation matrix into an adjacency matrix and further transform it into a topological overlap matrix (TOM).13,14
Finally, Pearson’s correlation coefficient and the P-value of the module eigengene, composed of each module gene and sample, were calculated by the WGCNA algorithm. The relationship between different modules and clinical traits was measured by Pearson’s correlation coefficient, and the module with the highest correlation coefficient was selected for subsequent analysis. In this study, the gene module most down-regulated in TCGA COAD samples compared with healthy samples was selected.
Pathway Analysis
DEGs of the target module were identified by constructing a Venn diagram (http://bioinformatics.psb.ugent.be/webtools/Venn/). KEGG and GO enrichment analyses were then performed. KEGG is a database resource for understanding advanced functions and biological systems from large-scale molecular data generated by high-throughput experimental techniques,15 while GO is a major bioinformatics tool for annotating genes and analyzing their biological processes (BPs), molecular functions (MFs), and cellular components (CCs).16 DEG functional analysis was performed using the clusterProfiler, org.Hs.eg.db, enrichplot, ggplot2 R package, with P<0.05 considered to indicate a statistically significant difference. The results based on the top 10 BPs, MFs, CCs, and KEGG were visualized.
Verification by the GEO Database
Gene expression profile data were searched for and downloaded from the publicly available NCBI GEO databases, including those from GSE106582 (https://www.ncbi.nlm.nih.gov/geo/query/acc.cgi?acc=GSE106582) and GSE110224 (https://www.ncbi.nlm.nih.gov/geo/query/acc.cgi?acc=GSE110224). GSE106582 was an expression profiling based on the GPL10558 platform (Affymetrix Human Gene Expression Array) and contained 194 samples, including 117 tissue mucosa samples and 77 tissue tumor samples. GSE110224 was an expression profiling based on the GPL570 platform and contained 34 samples, including 17 normal adjacent samples and 17 primary colorectal adenocarcinoma samples.
DEGs and WGCNA co-expression networks of the two GEO databases were analyzed in the same way. Similarly, construction of a Venn diagram was used to screen out DEGs in the most significantly down-regulated modules. DEG functions and pathways were then enriched and analyzed as described above.
Key Gene Screening
The intersection gene of the three databases was identified by constructing a Venn diagram. Overall survival analysis of seed genes in the most critical module was performed using Kaplan–Meier curves in R packages by TCGA clinical database which were compared statistically using the Log rank test. Then the expression of prognostic-related genes was mined by the TCGA dataset.
Immunocorrelation Analysis
Prognostic-related genes underwent correlation analysis with immune cells and immune markers using the TIMER database (https://cistrome.shinyapps.io/timer/), with correlations adjusted by tumor purity.
Immunohistochemical Analysis
Primary anti-VSIG2 antibodies were obtained from Affinity Biosciences (Victoria, Australia), anti-LC3 antibodies from Abcam (Cambridge, MA, USA), and the DAB chromogenic kit and enzyme-labeled goat anti-mouse/rabbit IgG polymer purchased from Beijing Zhongshan Jinqiao Biotechnology Co., Ltd. (Beijing, China).
Hematoxylin and eosin-stained sections of specimens from 30 patients with colon cancer were collected from the Department of Pathology, Affiliated Hospital of Binzhou Medical University, and diagnosed by two senior pathologists after a double-blind review. A total of 4–6 sections of tumor tissue and adjacent healthy tissue were available from each patient, and paraffin-embedded tissue with more lymphocyte infiltration was selected for continuous sections.
Using the EnVision staining technique, tissue sections were dewaxed and rehydrated, subjected to antigen retrieval under high pressure and heat, and 3% H2O2 was used to block endogenous peroxidase. According to the manufacturers’ instructions, anti-VSIG2 and anti-LC3 antibodies were diluted and incubated with tissue samples at 4°C overnight. Samples were then washed with phosphate-buffered saline (PBS) and incubated with the secondary antibody at 37°C for 30 min. The DAB chromogenic kit was used for color development according to the manufacturer’s instructions, hematoxylin redyeing, differentiation, dehydration, transparent, neutral rubber seal. As suggested by the antibody manufacturers, known positive tissue was used as the positive control, and PBS was used as the negative control in the absence of the primary antibody. Two researchers who were unaware of the clinicopathological statuses of the specimens scored each section independently.
The number of tumor cells (non-immune cells) showing positive LC3 expression and immune cells showing positive VSIG2 expression were used to determine the degree of immune infiltration. VSIG2 and LC3 were mainly expressed in the cell membrane or cytoplasm, and the presence of yellow-brown or brown-yellow particles was a positive sign. Ten independent fields were observed under 400× magnification, and the five with the highest density of immune cells were selected. The number of immune cells in each of the five fields was counted, and an average value was calculated. Samples whose count was higher than average were classified as the strong immunoinfiltration group, and those whose count was lower than average were classified as the weak immunoinfiltration group. Scoring was based on the intensity of staining and the proportion of positive cells. For staining intensity, a score of 0 was given for cells without staining, 1 for light yellow, 2 for yellow-brown, and 3 for brown. For the number of positive cells, a score of 0 was for ≤5%, 1 for 6%–25%, 2 for 26%–50%, 3 for 51%–75%, and 4 for >75%. The two scores were multiplied, and a final score ≥4 was considered positive, and ≥8 was considered strongly positive.
Statistical Analysis
R software (v.3.6.3) and SPSS 25.0 software were used for statistical analysis. Enumeration data were analyzed by the χ2 test, the independent samples t-test was used for comparisons between two groups, and one-way analysis of variance was used for comparisons between multiple groups. The correlation of protein expression was analyzed by the Spearman’s rank correlation coefficient, with P < 0.05 was considered statistically significant.
Results
TCGA Database Research Results
A gene set containing 3572 DEGs (TCGA_DIFF) was obtained from the TCGA database, among which 2229 genes were down-regulated and 1343 were up-regulated compared with healthy tissue (Figure 1A).
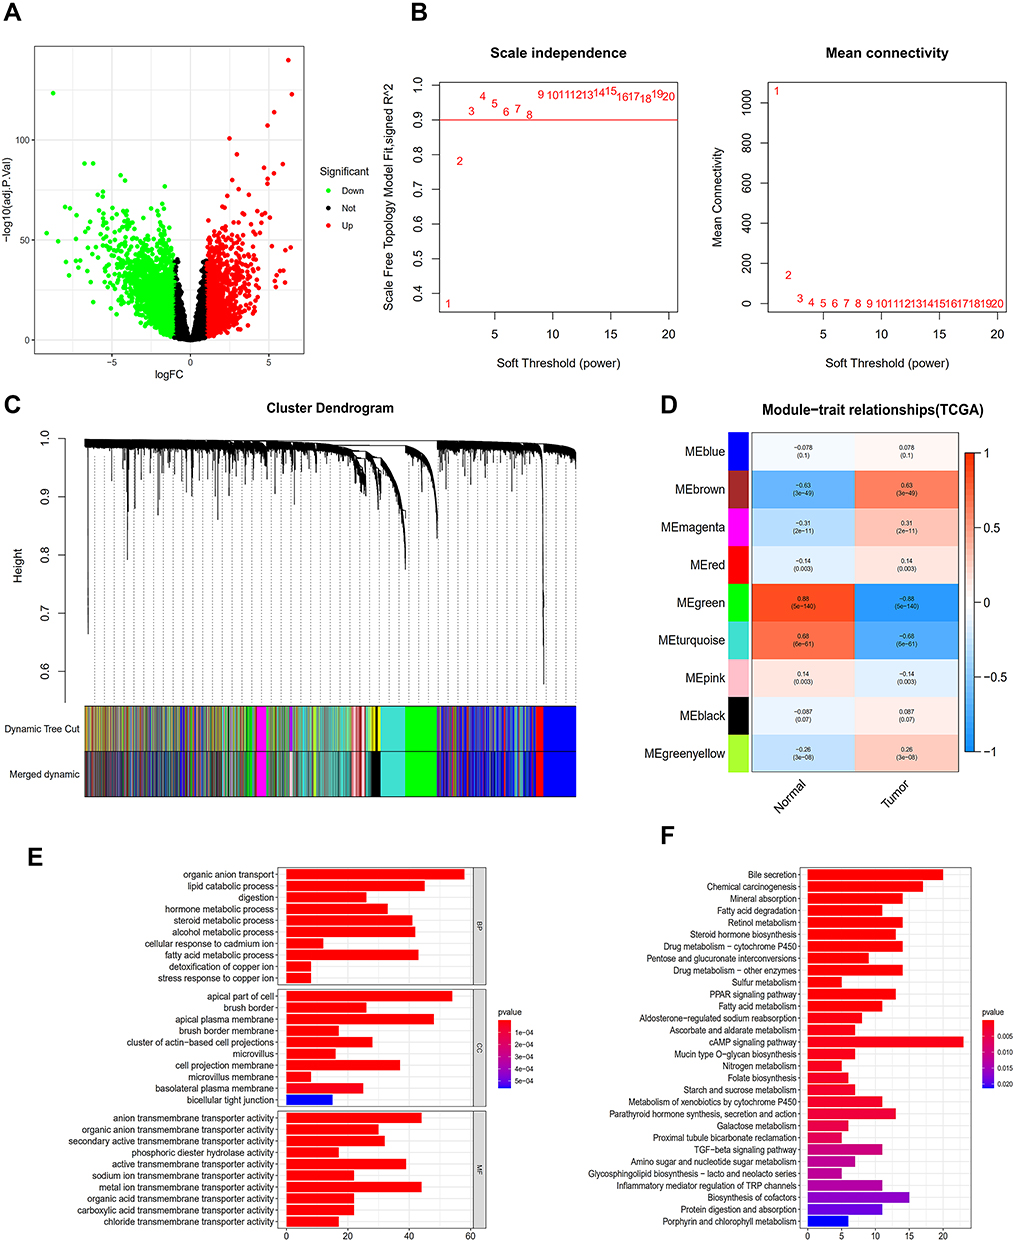 |
Figure 1 Analysis of TCGA database. (A) The database erases the volcanic map of the genes that differ from the normal sample. (B) Determination of soft threshold (β) for weighted gene co-expression network analysis. (C) Gene cluster dendrogram. (D) Heat map of correlation between clinical features and module features. (E) Go histogram of co-expression differential genes. (F) KEGG histogram of co-expression differential genes. |
All samples were included in the clusters of WGCNA analysis. The soft-power threshold β was determined by the function “sft$powerEstimate”; β = 3 was selected for further analysis (Figure 1B) and the shear height was set to 0.25. A total of nine gene modules in TCGA were detected based on the TOM matrix (Figure 1C). From the heatmap of modules and characters, it was found that the green module (1339 genes) had the highest degree of correlation with colon adenocarcinoma in TCGA (Figure 1D). The TCGA_green module was selected to screen seed genes.
DEGs of the most significantly down-regulated modules were obtained by constructing Venn diagrams (TCGA_DIFF and TCGA_GREEN). A total of 957 genes were screened (Figure 2A), and R packages was used for their functional enrichment analysis (Figure 1E and F).
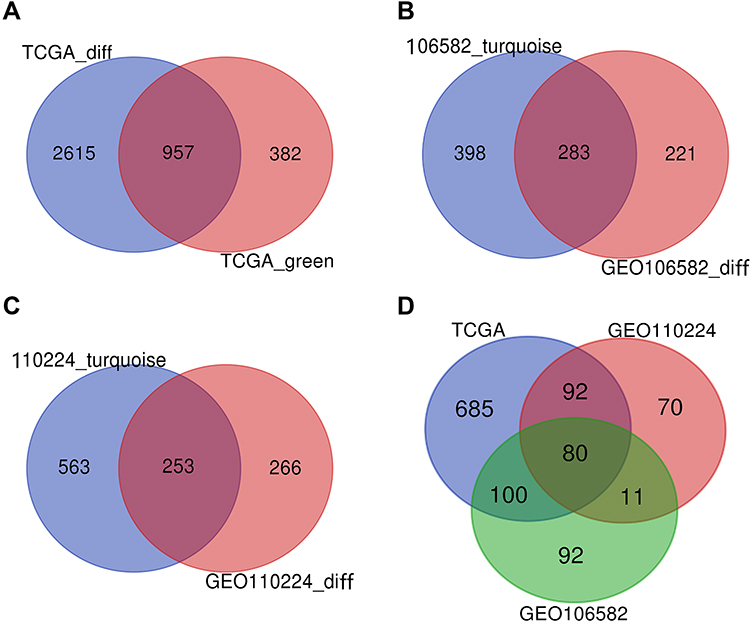 |
Figure 2 VENN. (A) DEGs of the most significant down-regulated module in the TCGA database. (B) DEGs of the most significant down-regulated module in the TCGA database. (C) DEGs of the most significant down-regulated module in the TCGA database. (D) DEGs were co-expressed in three databases. |
GEO Database Verification
Using the same method, we obtained two different gene sets, GSE106582_diff and GSE110224_diff. GSE106582_diff included 504 DEGs consisting of 328 down-regulated genes and 176 up-regulated genes, while GSE110224_diff included 519 DEGs consisting of 296 down-regulated genes and 223 up-regulated genes (Figure 3A and G).
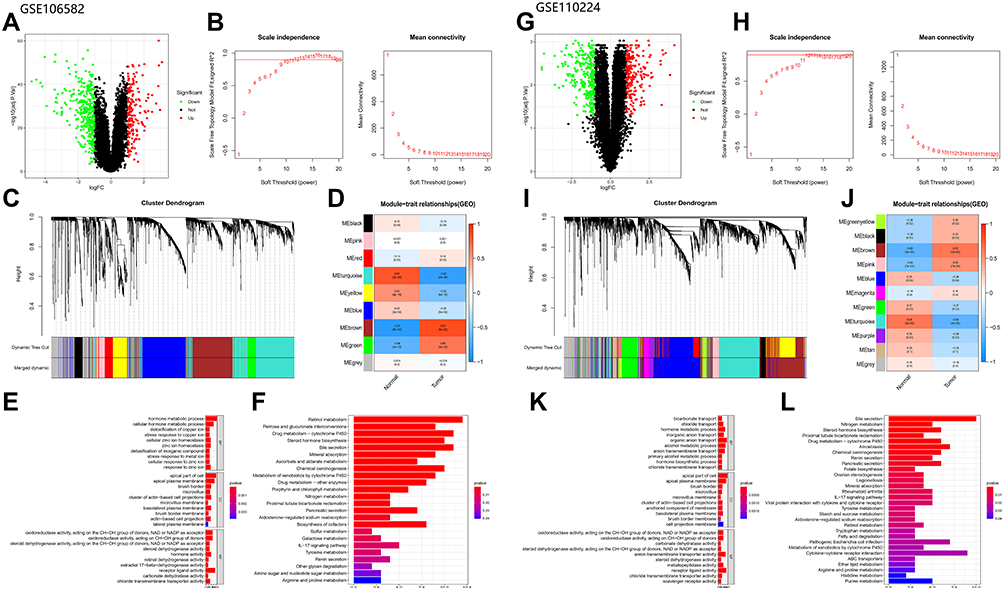 |
Figure 3 Analysis of GEO database: (A–F) Analysis of GSE106582 database (The figures type are the same as database TCGA). (G–L) Analysis of GSE110224 database (The figures type are the same as database TCGA). |
We performed WGCNA analysis of the two GEO datasets using the same method, β = 10 (GSE106582) and β = 12 (GSE110224), for both (Figure 3B and H). A total of nine modules were detected in GSE106582 and 11 modules in GSE110224 (Figure 3C and I). The turquoise module (681 genes) in GSE106582 (GSE106582_turquoise; Figure 3D) and the turquoise module (816 genes) in GSE110224 (GSE110224_turquoise; Figure 3J) were the most significantly down-regulated modules, so were used to screen hub genes.
DEGs in the most significantly down-regulated modules of GSE106582 and GSE110224_turquoise were obtained by constructing Venn diagrams (GSE106582_diff and GSE106582_turquoise, GSE110224_diff and GSE110224_turquoise). A total of 283 genes were screened for GSE106582 and 253 for GSE110224 (Figure 2B and C).
The functions enriched in the three databases were mutually confirmed with the channels, and included: “hormone metabolic process”, “apical part of cell”, “brush border”, “microvillus”, and “chloride transmembrane transporter activity”. Co-enriched pathways included: “steroid hormone biosynthesis”, “retinol metabolism”, “metabolism of xenobiotics induced by cytochrome P450”, “drug metabolism - cytochrome P450”, “bile secretion”, and “chemical carcinogenesis” (Figures 1E and F and 3E and F, K and L).
Screening for Key Genes
A total of 80 co-expressed DEGs from TCGA, GSE106582, and GSE110224 databases were identified and screened after constructing a Venn diagram (Figure 2D).
A total of 379 patients had complete gene expression and survival information data, which were used for overall survival (OS) analysis using the Kaplan–Meier survival plot with survival and survminer R packages. Four progression-related DEGs were identified as potentially prognostic (SELENBP1, NAT2, VSIG2, and CES2; Figure 4A–D). We then plotted scatter plots and paired plots of these DEGs for tumor and healthy samples based on gene expression data from the TCGA database (Figure 4E–L). Of these genes, VSIG2 was not enriched in the functions and pathways of the most important modules of WGCNA. Therefore, it was chosen for further analysis in this study to determine its role in colon cancer.
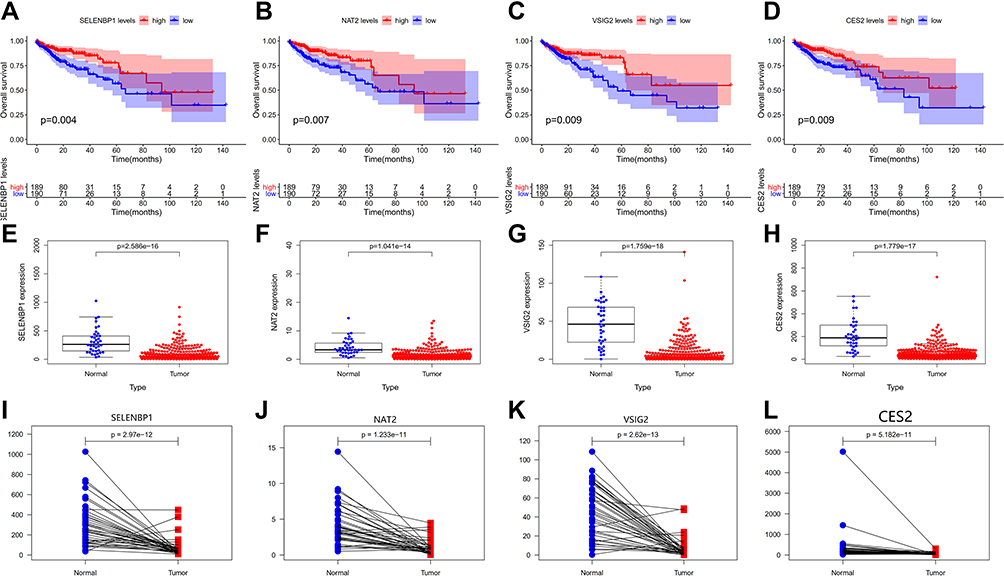 |
Figure 4 (A–D) The survival curves of continuous variables of key genes. (E–L) Scatter plots and paired plots of gene expression differences of key genes. |
Relationship Between VSIG2 and Immunity
Based on the TIMER database analysis of VSIG2 and immune cells, we found that VSIG2 expression was positively correlated with the number of B cells and negatively correlated with the number of macrophages and neutrophils (Figure 5A). Moreover, a significant positive correlation was observed between VSIG2 expression and nitric oxide synthase 2, as a marker of M1 macrophages, and a significant negative correlation was detected between VSIG2 expression and CD163, as a marker of M2 macrophages (P < 0.05; Figure 5B and C).
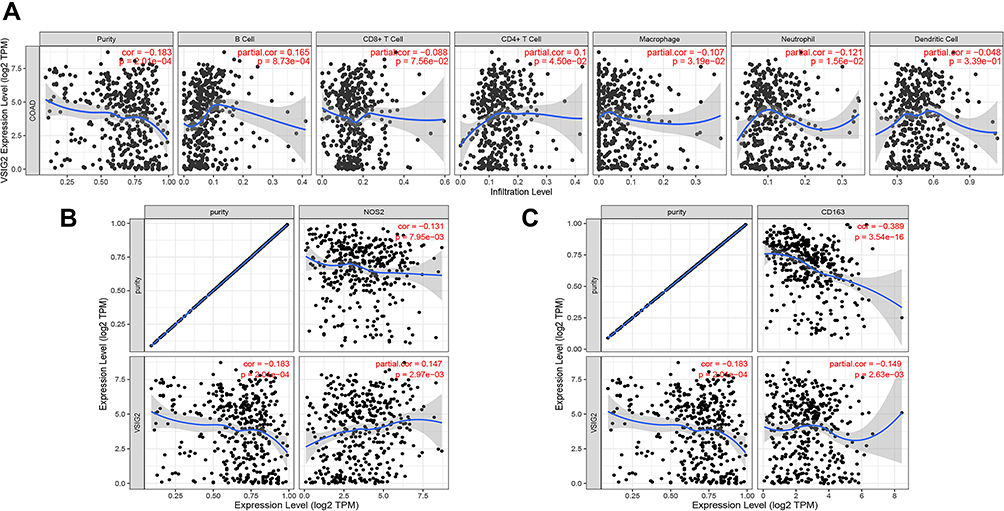 |
Figure 5 (A) Correlation between VSIG2 and immune cells. (B) Correlation of VSIG2 with tumor-associated M1 macrophage markers. (C) correlation of VSIG2 with tumor-associated M2 macrophage markers. |
Immunohistochemical Verification of VSIG2 and LC3 Expression
VSIG2 was mainly expressed in the cytoplasm and cell membrane of immune cells, especially plasma cells and macrophages, but at lower levels in T cells. The expression was significantly higher in immune cells of healthy tissues than in immune cells of cancerous tissues (Table 1). However, VSIG2 expression did not differ significantly between non-immune cells of healthy versus cancerous tissues (Figure 6A and B).
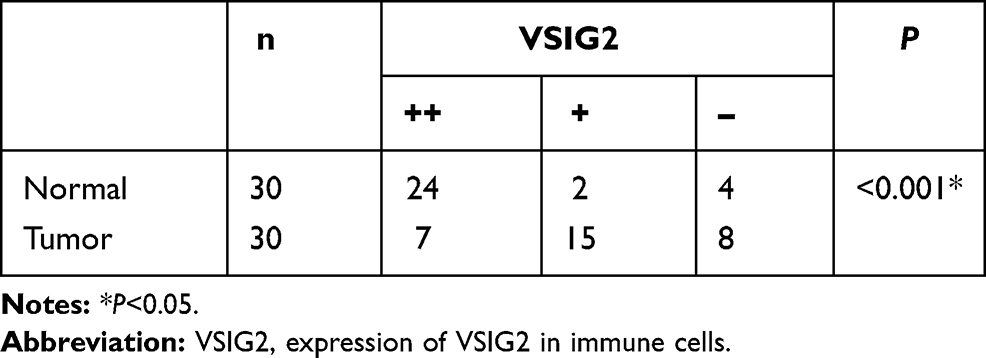 |
Table 1 Expression of VSIG2 in Immune Cells of Cancer and Normal Tissues |
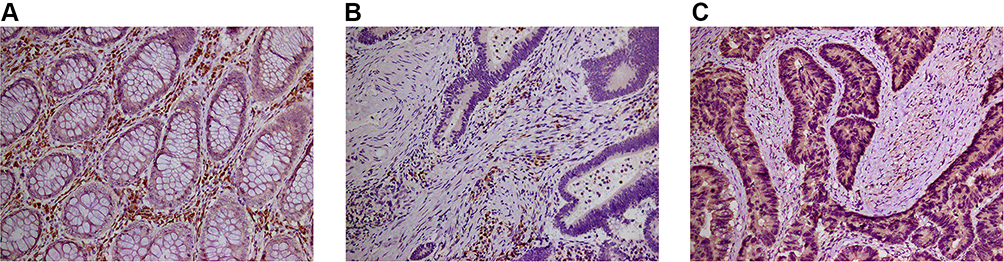 |
Figure 6 (A) The expression of VSIG2 in normal tissues. (B) The expression of VSIG2 in cancer tissues. (C) The expression of LC3 in cancer tissues. |
Assessment of the infiltration intensity by immunohistochemistry enabled the 30 patient samples to be divided into high VSIG2 expression and low VSIG2 expression groups. Immunoinfiltration was significantly stronger in the group with high VSIG2 expression than in those with low VSIG2 expression (Table 2).
 |
Table 2 Correlation Between the Expression of VSIG2 in Immune Cells of Cancer Tissue and the Intensity of Immune Invasion |
We previously found that LC3 expression was positively correlated with immune infiltration (unpublished observations). Here, the 30 samples were also divided into high and low expression groups according to the expression intensity of LC3 in cancer cells (Figure 6C). LC3 expression was significantly positively correlated with the amount of immune infiltration in colorectal cancer (Table 3). Additionally, the amount of immune infiltration was highest in samples showing both high VSIG2 and positive LC3 expression, and lowest in samples showing low VSIG2 expression and negative LC3 expression (Table 4).
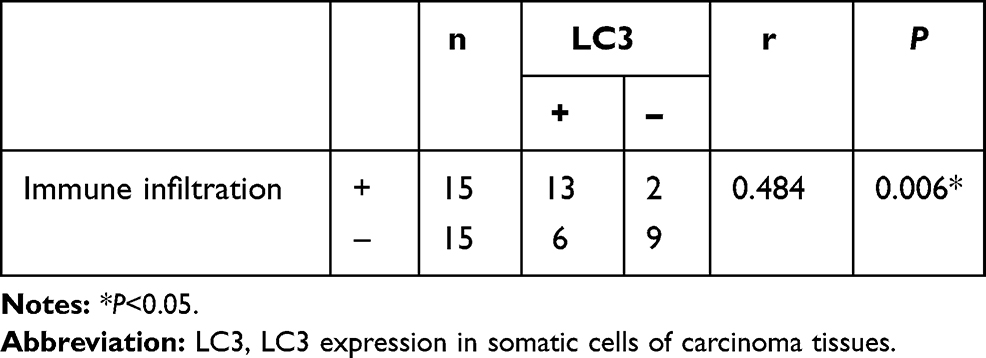 |
Table 3 Correlation Between Autophagy - Related Factor LC3 and the Intensity of Immune Invasion in Cancer Tissue |
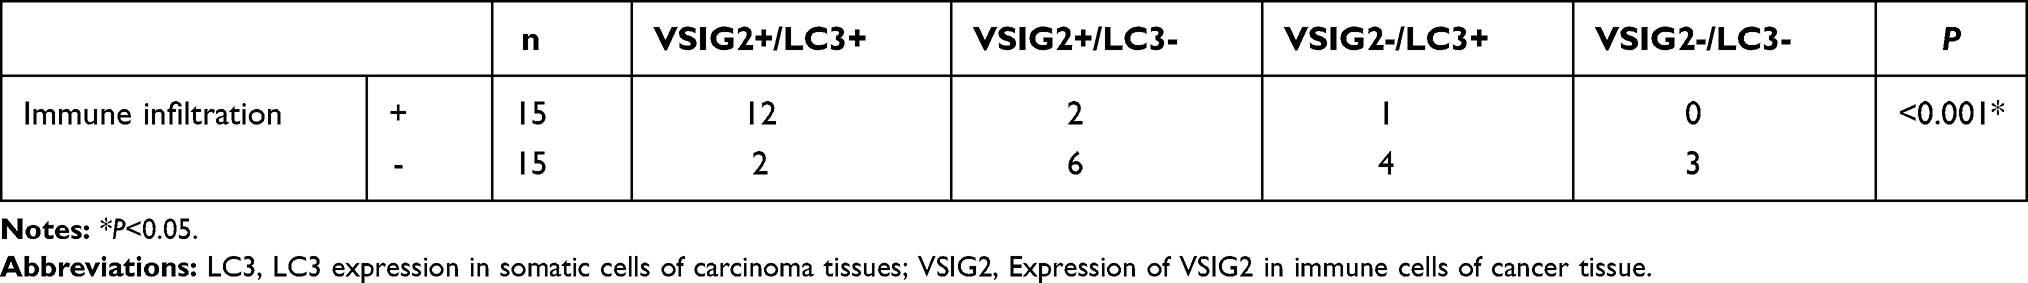 |
Table 4 Correlation Between the Expression of LC3 and VSIG2 and the Intensity of Immune Invasion |
Discussion
COAD is one of the most common malignancies. However, despite previous investigations into its etiology, the exact mechanism of development remains to be determined. Here, we performed WGCNA analysis on the TCGA COAD dataset and conducted GO and KEGG enrichment analyses of the co-expressed DEGs, which were verified by GSE106582 and GSE110224 in the GEO database. It is worth noting that the database selected in this study has been used in the study of COAD, but to our knowledge WGCNA analysis has never been conducted on it.
The three databases were enriched with many similar functions and pathways, including those involving steroid hormones, retinol metabolism, bile acid metabolism, drug metabolism, and sulfur metabolism. Colon cancer drug metabolism is a research hotspot, and the antimetabolite 5-fluorouracil (5-FU) is a recommended chemotherapy agent.17 5-FU drug resistance in colon cancer was previously shown to be conferred by a SphK2-induced increase in dihydropyrimidine dehydrogenase.18 Moreover, sulfur-metabolizing bacteria are associated with an increased risk of distal colon cancer.19
In this study, we intersected DEGs of the most significantly down-regulated module in the three databases. A total of 80 co-expressed genes were identified for survival analysis and of these, four progression-related genes were identified by survival analysis: SELENBP1, NAT2, VSIG2, and CES2. These four genes were chosen as our target genes. CES2 and NAT2 were enriched in drug metabolism-related pathways. Previous studies have shown that CES2 overexpression has prognostic value in COAD, while oxaliplatin resistance in COAD cells was found to be reversed by inhibiting the phosphoinositide 3 kinase signaling pathway after CES2 knockdown.20 Additionally, the conversion of capecitabine to 5-FU requires CES2.21
NAT2 is considered to be a prognostic factor for the survival of patients with COAD,22 and can alter the therapeutic index of anticancer drugs.23,24 SELENBP1 is enriched in the sulfur metabolism pathway, and its inhibition is a common late event in the rapid development of COAD.25–27
The expression of VSIG2 was lower in the three databases of COAD by bioinformatics analysis, and the prognosis of the low expression group was worse. We speculated that VSIG2 is a tumor suppressor gene of COAD and plays an important role in the occurrence and development of COAD. However, the function of VSIG2 in COAD is not clear. To clarify its role in colon cancer, we conducted a data query and immunohistochemistry in this study.
Its recommended name of V-set and immunoglobulin domain-containing protein (https://www.genecards.org/), and the fact that family members VSIG328 and VSIG429,30 are associated with immune function suggested that the role of VSIG2 may also be related to tumor immunity.
Through TIMER database analysis, we found that VSIG2 is closely associated with immune cells in COAD, showing positive correlations with B cells and negative correlations with neutrophils, and macrophages. Previous studies reported that the colon cancer tumor infiltration of CD20+ B lymphocytes was associated with good prognosis.31 Other investigations found that the ratio of neutrophils to lymphocytes is a clear predictor of colon cancer prognosis, and that tumor-associated neutrophils can promote tumor development.32
The study of macrophages in colon cancer tissue mainly refers to tumor-associated macrophages (TAMs), which have antitumor effects.33–35 To determine the relationship between VSIG2 and M1 and M2 TAMs, we analyzed their correlations using the TIMER database. VSIG2 positively correlated with M1 macrophage markers, and negatively correlated with M2 macrophage marker. Because VSIG2 negatively correlated with the total amount of tumor-associated macrophages, we speculated that when VSIG2 is missing in colon cancer, the increase of M2 type macrophages plays a leading role in the process of macrophage infiltration. So we speculate that the loss of VSIG2 expression in colon cancer is associated with an increase in M2 macrophages which promote tumor development. Thus, VSIG2 itself has an antitumor effect.
Although VSIG2 is differentially expressed in colon cancer compared with healthy tissue, and is closely related to immune cells, its protein expression pattern in colon cancer was unknown. Our immunohistochemical analysis revealed that VSIG2 was mainly expressed in normal tissues, but weakly expressed in cancer. It was mainly expressed in the cytoplasm and membrane of immune cells, but weakly expressed in non-immune cells. We speculated that the difference in the expression of VSIG2 between normal tissues and cancer tissues might be caused by its differential expression in immune cells.
Previous studies have shown that monocytes and macrophages play important roles in antigen presentation,36 while B cells and plasma cells are involved in the formation of the antitumor immune response, with B cells presenting homologous tumor antigens to T cells. The functional outcome of this interaction depends on the B cell phenotype. Additionally, the homogeneity and specificity of antibodies produced by plasma cells can drive different immune responses.37 Therefore, increases in mononuclear macrophages and plasma cells are thought to raise the number of infiltrating immune cells. Because VSIG2 was highly expressed in both types of immune cells of healthy tissue in the present study, we suspect that it functions to maintain normal immune surveillance and antigen-presenting cells. Moreover, the reduced VSIG2 expression in plasma cells and macrophages of tumor tissue implies a decrease in immune escape and immune cell infiltration during colon cancer.
Tumor immune escape refers to the phenomenon whereby tumor cells survive and proliferate in vivo by escaping from immune system recognition and attack through a variety of mechanisms. Studies have shown that it is promoted by CD4+ T cells and TAMs.38,39 Here, our observation that VSIG2 was negatively correlated with CD4+ T cells and TAMs indicates that the absence of VSIG2 in tumors leads to tumor immune escape. To investigate the relationship between VSIG2 and immune cell infiltration, we analyzed the correlation between VSIG2 expression and the number of immune cells in cancerous tissue. We found that when VSIG2 was highly expressed in immune cells, immune infiltration was stronger and multiple infiltrating immune cells were detected. This suggests that high VSIG2 expression confers a stronger antigen presentation ability, which attracts more immune cells.
We previously showed that colon cancer cell autophagy enhances immune infiltration following the increased production and exposure of tumor-associated antigens (unpublished observations), and that endogenous LC3 lysosome substitution is a sign of autophagy.40 This is similar to the deduced VSIG2 function in the present study, thus the correlation between VSIG2 and LC3 was studied in this experiment. We used LC3 immunohistochemical staining and showed that the immunoinfiltration was the highest when both LC3 and VSIG2 were positive, while the immunoinfiltration was the lowest when both of them were negative. We inferred from this that high LC3 expression is associated with enhanced autophagy, leading to the production of more tumor-related antigens. Additionally, we reasoned that high expression of VSIG2 can promote more immune cells to combine with the antigen produced by autophagy, resulting in stronger immune infiltration. Thus, the synergistic relationship between VSIG2 and LC3 supports the infiltration of immune cells.
Conclusions
In general, our bioinformatics assessment indicates that DEGs may play a key role in the occurrence, prognosis, growth and development of COAD. In this study, we screened 3572 (TCGA), 504 (gse106582) and 519 (gse110224) DEGs from three databases using WGCNA. The functions determined from enrichment analysis are closely related to steroid hormones, retinol metabolism, bile acid metabolism, drug metabolism and thiol metabolism. These processes can lead to the development of COAD. Through further screening, 80 DEGs and 4 prognosis-related genes (SELENBP1, NAT2, VSIG2 and CES2) were obtained. Among them, VSIG2 has rarely been studied in COAD. We provide evidence that VSIG2 may be an immune-related gene that plays a role in antigen presentation and immune invasion. It can therefore play a role in metabolism of colon adenocarcinoma by regulating immune response. Studying the expression and prognosis of these genes undoubtedly progresses the understanding of the role of these genes in the growth and development of COAD. The findings of this study will help to deepen the understanding of the molecular pathogenesis of COAD. In addition, prognosis-related genes may be potential biomarkers, which can be used to detect and target COAD for treatment. However, there are still many shortcomings in this study. The sample size of this study was small. These findings should be further verified in a large sample size retrospective study. Additionally, the findings presented have not been verified by in vitro mechanism of action experiments. In the next study, we aim further reveal the mechanism of VSIG2 in COAD from a molecular perspective.
Abbreviations
CRC, colon cancer; COAD, colon adenocarcinoma; WGCNA, weighted gene co-expression network analysis; TCGA, The Cancer Genome Atlas; GEO, Gene Expression Omnibus; GO, Gene Ontology; KEGG, Kyoto Encyclopedia of Genes and Genomes; BP, biological process; CC, cellular component; MF, molecular function; TIMER, Tumor IMmune Estimation Resource.
Data Sharing Statement
All data generated or analysed during this study are included in this published article.
Ethics Approval and Consent to Participate
The experiments were approved by the Ethics Committee of the Binzhou Medical University Hospital. Written informed consent was obtained from all patients. The experiments were carried out following the Declaration of Helsinki.No animal experiment is applicable.
Acknowledgments
We appreciate The Cancer Genome Atlas and Gene Expression Omnibus for the open data.
Author Contributions
All authors contributed to data analysis, drafting or revising the article, have agreed on the journal to which the article will be submitted, gave final approval of the version to be published, and agree to be accountable for all aspects of the work. Zhongze Cui and Yangyang Li contributed as co-first authors.
Funding
The study is financially supported by National Natural Science Foundation of China (NSFC) (No. 81772637).
Disclosure
All authors reported no conflicts of interest for this work.
References
1. Bray F, Ferlay J, Soerjomataram I, et al. Global cancer statistics 2018: GLOBOCAN estimates of incidence and mortality worldwide for 36 cancers in 185 countries. CA Cancer J Clin. 2018;68(6):394–424. doi:10.3322/caac.21492
2. Sanz-Garcia E, Argiles G, Elez E, et al. BRAF mutant colorectal cancer: prognosis, treatment, and new perspectives. Ann Oncol. 2017;28(11):2648–2657. doi:10.1093/annonc/mdx401
3. Corcoran RB, André T, Atreya CE, et al. Combined BRAF, EGFR, and MEK inhibi-tion in patients with BRAF(V600E)-mutant colorectal cancer. Cancer Discov. 2018;8:428–443. doi:10.1158/2159-8290.CD-17-1226
4. Hamzehzadeh L, Khadangi F, Ghayoor Karimiani E, et al. Common KRAS and NRAS gene mutations in sporadic colorectal cancer in Northeastern Iranian patients. Curr Probl Cancer. 2018;42(6):572–581. doi:10.1016/j.currproblcancer.2018.05.001
5. Reggiani Bonetti L, Barresi V, Bettelli S, et al. Analysis of KRAS, NRAS, PIK3CA, and BRAF mutational profile in poorly differentiated clusters of KRAS-mutated colon cancer. Hum Pathol. 2017;62:91–98. doi:10.1016/j.humpath.2016.12.011
6. Saito M, Momma T, Kono K. Targeted therapy according to next generation sequencing-based panel sequencing. Fukushima J Med Sci. 2018;64:9–14. doi:10.5387/fms.2018-02
7. Deshiere A, Berthet N, Lecouturier F, et al. Molecular characterization of equine infectious anemia viruses using targeted sequence enrichment and next generation sequencing. Virology. 2019;537:121–129. doi:10.1016/j.virol.2019.08.016
8. Meng H, Wang L, You H, et al. Circular RNA expression profile of liver tissues in an EtOH‑induced mouse model of alcoholic hepatitis. Eur J Pharmacol. 2019;862:172642. doi:10.1016/j.ejphar.2019.172642
9. Harada K, Okamoto W, Mimaki S, et al. Comparative sequence analysis of patient-matched primary colorectal cancer, metastatic, and recurrent metastatic tumors after adjuvant FOLFOX chemotherapy. BMC Cancer. 2019;19(1):255. doi:10.1186/s12885-019-5479-6
10. Hu Y, He C, Liu JP, et al. Analysis of key genes and signaling pathways involved in Helicobacter pylori-associated gastric cancer based on the cancer genome atlas database and RNA sequencing data. Helicobacter. 2018;23:e12530. doi:10.1111/hel.12530
11. Nakagawa H, Fujita M. Whole genome sequencing analysis for cancer genomics and precision medicine. Cancer Sci. 2018;109:513–522. doi:10.1111/cas.13505
12. Jia R, Zhao H, Jia M, et al. Identification of co-expression modules and potential biomarkers of breast cancer by WGCNA. Gene. 2020;750:144757. doi:10.1016/j.gene.2020.144757
13. Li A, Horvath S. Network neighborhood analysis with the multi-node topological overlap measure. Bioinformatics. 2007;23(2):222–231. doi:10.1093/bioinformatics/btl581
14. Yip AM, Horvath S. Gene network interconnectedness and the generalized topological overlap measure. BMC Bioinform. 2007;8:22. doi:10.1186/1471-2105-8-22
15. Kanehisa M, Furumichi M, Tanabe M, et al. KEGG: new perspectives on genomes, pathways, diseases and drugs. Nucleic Acids Res. 2017;45(D1):D353–D361. doi:10.1093/nar/gkw1092
16. Ashburner M, Ball CA, Blake JA, et al. Gene ontology: tool for the unification of biology. The gene ontology consortium. Nat Genet. 2000;25(1):25–29. doi:10.1038/75556
17. Xie P, Mo JL, Liu JH, et al. Pharmacogenomics of 5-fluorouracil in colorectal cancer: review and update. Cell Oncol. 2020;43(6):989–1001. doi:10.1007/s13402-020-00529-1
18. Zhang YH, Shi WN, Wu SH, et al. SphK2 confers 5-fluorouracil resistance to colorectal cancer via upregulating H3K56ac-mediated DPD expression. Oncogene. 2020;39(29):5214–5227. doi:10.1038/s41388-020-1352-y
19. Nguyen LH, Ma W, Wang DD, et al. Association between sulfur-metabolizing bacterial communities in stool and risk of distal colorectal cancer in men. Gastroenterology. 2020;158(5):1313–1325. doi:10.1053/j.gastro.2019.12.029
20. Zhang Y, Sun L, Sun Y, et al. Overexpressed CES2 has prognostic value in COAD and knockdown CES2 reverses L-OHP-resistance in COAD cells by inhibition of the PI3K signaling pathway. Exp Cell Res. 2020;389(1):111856. doi:10.1016/j.yexcr.2020.111856
21. Ribelles N, López-Siles J, Sánchez A, et al. A carboxylesterase 2 gene polymorphism as predictor of capecitabine on response and time to progression. Curr Drug Metab. 2008;9(4):336–343. doi:10.2174/138920008784220646
22. Osian G, Procopciuc L, Vlad L, et al. NAT2 polymorphisms and sporadic colorectal cancer survival. J Gastrointestin Liver Dis. 2010;19(4):361–368.
23. Rendo V, Kundu S, Rameika N, et al. Defining eligible patients for allele-selective chemotherapies targeting NAT2 in colorectal cancer. Sci Rep. 2020;10(1):22436. doi:10.1038/s41598-020-80288-z
24. Rendo V, Stoimenov I, Mateus A, et al. Exploiting loss of heterozygosity for allele-selective colorectal cancer chemotherapy. Nat Commun. 2020;11(1):1308. doi:10.1038/s41467-020-15111-4
25. Elhodaky M, Diamond AM. Selenium-binding protein 1 in human health and disease. Int J Mol Sci. 2018;19(11):3437. doi:10.3390/ijms19113437
26. Wang N, Chen Y, Yang X, et al. Selenium-binding protein 1 is associated with the degree of colorectal cancer differentiation and is regulated by histone modification. Oncol Rep. 2014;31(6):2506–2514. doi:10.3892/or.2014.3141
27. Kim H, Kang HJ, You KT, et al. Suppression of human selenium-binding protein 1 is a late event in colorectal carcinogenesis and is associated with poor survival. Proteomics. 2006;6(11):3466–3476. doi:10.1002/pmic.200500629
28. Wang J, Wu G, Manick B, et al. VSIG-3 as a ligand of VISTA inhibits human T-cell function. Immunology. 2019;156(1):74–85. doi:10.1111/imm.13001
29. Huang X, Feng Z, Jiang Y, et al. VSIG4 mediates transcriptional inhibition of Nlrp3 and Il-1β in macrophages. Sci Adv. 2019;5(1):eaau7426. doi:10.1126/sciadv.aau7426
30. Li J, Diao B, Guo S, et al. VSIG4 inhibits proinflammatory macrophage activation by reprogramming mitochondrial pyruvate metabolism. Nat Commun. 2017;8(1):1322. doi:10.1038/s41467-017-01327-4
31. Edin S, Kaprio T, Hagström J, et al. The prognostic importance of CD20+ B lymphocytes in colorectal cancer and the relation to other immune cell subsets. Sci Rep. 2019;9(1):19997. doi:10.1038/s41598-019-56441-8
32. Mizuno R, Kawada K, Itatani Y, et al. The role of tumor-associated neutrophils in colorectal cancer. Int J Mol Sci. 2019;20(3):529. doi:10.3390/ijms20030529
33. Locati M, Curtale G, Mantovani A. Diversity, mechanisms, and significance of macrophage plasticity. Annu Rev Pathol. 2020;15(1):123–147. doi:10.1146/annurev-pathmechdis-012418-012718
34. Isidro RA, Appleyard CB. Colonic macrophage polarization in homeostasis, inflammation, and cancer. Am J Physiol Gastrointest Liver Physiol. 2016;311(1):G59–G73. doi:10.1152/ajpgi.00123.2016
35. Najafi M, Hashemi Goradel N, Farhood B, et al. Macrophage polarity in cancer: a review. J Cell Biochem. 2019;120(3):2756–2765. doi:10.1002/jcb.27646
36. Jakubzick CV, Randolph GJ, Henson PM. Monocyte differentiation and antigen-presenting functions. Nat Rev Immunol. 2017;17(6):349–362. doi:10.1038/nri.2017.28
37. Sharonov GV, Serebrovskaya EO, Yuzhakova DV, et al. B cells, plasma cells and antibody repertoires in the tumour microenvironment. Nat Rev Immunol. 2020;20(5):294–307. doi:10.1038/s41577-019-0257-x
38. Wang Z, Geng Z, Shao W, et al. Cancer-derived sialylated IgG promotes tumor immune escape by binding to siglecs on effector T cells. Cell Mol Immunol. 2020;17(11):1148–1162. doi:10.1038/s41423-019-0327-9
39. Petty AJ, Yang Y. Tumor-associated macrophages: implications in cancer immunotherapy. Immunotherapy. 2017;9(3):289–302. doi:10.2217/imt-2016-0135
40. Tanida I, Minematsu-Ikeguchi N, Ueno T, et al. Lysosomal turnover, but not a cellular level, of endogenous LC3 is a marker for autophagy. Autophagy. 2005;1(2):84–91. doi:10.4161/auto.1.2.1697
 © 2021 The Author(s). This work is published and licensed by Dove Medical Press Limited. The full terms of this license are available at https://www.dovepress.com/terms.php and incorporate the Creative Commons Attribution - Non Commercial (unported, v3.0) License.
By accessing the work you hereby accept the Terms. Non-commercial uses of the work are permitted without any further permission from Dove Medical Press Limited, provided the work is properly attributed. For permission for commercial use of this work, please see paragraphs 4.2 and 5 of our Terms.
© 2021 The Author(s). This work is published and licensed by Dove Medical Press Limited. The full terms of this license are available at https://www.dovepress.com/terms.php and incorporate the Creative Commons Attribution - Non Commercial (unported, v3.0) License.
By accessing the work you hereby accept the Terms. Non-commercial uses of the work are permitted without any further permission from Dove Medical Press Limited, provided the work is properly attributed. For permission for commercial use of this work, please see paragraphs 4.2 and 5 of our Terms.