")
Back to Journals » Journal of Pain Research » Volume 11
Just how much does it cost? A cost study of chronic pain following cardiac surgery
Authors Guertin JR , Pagé MG , Tarride JÉ, Talbot D, Watt-Watson J, Choinière M
Received 24 May 2018
Accepted for publication 10 September 2018
Published 8 November 2018 Volume 2018:11 Pages 2741—2759
DOI https://doi.org/10.2147/JPR.S175090
Checked for plagiarism Yes
Review by Single anonymous peer review
Peer reviewer comments 3
Editor who approved publication: Dr Erica Wegrzyn
Jason Robert Guertin,1,2,* M Gabrielle Pagé,3,4,* Jean-Éric Tarride,5 Denis Talbot,1,2 Judy Watt-Watson,6 Manon Choinière3,4
1Department of Social and Preventive Medicine, Faculty of Medicine, Université Laval, Quebec City, QC, Canada; 2Centre de recherche du Centre hospitalier universitaire de Québec, Université Laval, Quebec City, QC, Canada; 3Centre de recherche du Centre hospitalier de l’Université de Montréal (CRCHUM), Montreal, QC, Canada; 4Department of Anesthesiology and Pain Medicine, Faculty of Medicine, Université de Montréal, Montreal, QC, Canada; 5Department of Health Research Methods, Evidence and Impact, McMaster University, Hamilton, ON, Canada; 6Bloomberg Faculty of Nursing, University of Toronto, Toronto, ON, Canada
*These authors contributed equally to this work
Objective: The study objective was to determine use of pain-related health care resources and associated direct and indirect costs over a two-year period in cardiac surgery patients who developed chronic post-surgical pain (CPSP).
Methods: This multicentric observational prospective study recruited patients prior to cardiac surgery; these patients completed research assistant-administered questionnaires on pain and psychological characteristics at 6, 12 and 24 months post-operatively. Patients reporting CPSP also completed a one-month pain care record (PCR) (self-report diary) at each follow-up. Data were analyzed using descriptive statistics, multivariable logistic regression models, and generalized linear models with log link and gamma family adjusting for sociodemographic and pain intensity.
Results: Out of 1,247 patients, 18%, 13%, and 9% reported experiencing CPSP at 6, 12, and 24 months, respectively. Between 16% and 28% of CPSP patients reported utilizing health care resources for their pain over the follow-up period. Among all CPSP patients, mean monthly pain-related costs were CAN$207 at 6 months and significantly decreased thereafter. More severe pain and greater levels of pain catastrophizing were the most consistent predictors of health care utilization and costs.
Discussion: Health care costs associated with early management of CPSP after cardiac surgery seem attributable to a minority of patients and decrease over time for most of them. Results are novel in that they document for the first time the economic burden of CPSP in this population of patients. Longer follow-up time that would capture severe cases of CPSP as well as examination of costs associated with other surgical populations are warranted.
Summary: Economic burden of chronic post-surgical pain may be substantial but few patients utilize resources. Health utilization and costs are associated with pain and psychological characteristics.
Keywords: CARD-PAIN, chronic post-surgical pain, health care utilization, costs, cardiac surgery
Introduction
Pain after surgery is one of the most common causes of chronic pain.3 Prevalence estimates of chronic post-surgical pain (CPSP) range from 10% to 70% up to one year after surgery, based on the type of surgical procedure studied and the definition of CPSP.25,41
The direct and indirect costs associated with chronic pain from any cause in the USA are estimated to range from US$560 to US$635 billion yearly, which is almost twice as much as for cardiovascular diseases or cancer.13 These cost estimates are proportionally similar to those of European countries such as Ireland (€5.34 billion per year)39 and Sweden (€32 billion per year).20 Direct health-related costs (health care expenditures such as hospitalizations, drugs, physicians’ fees10 are primarily fueled by hospitalization while indirect costs (associated with loss of life or livelihood such as absence from work, caregiver time)10 are fueled primarily by social benefits (disability allowance, unemployment benefits).39 In a Canadian study of patients waiting for multidisciplinary pain treatment, median 30-day pain-related direct and indirect costs were CAN$1,462 with time costs (defined in this study as all paid and unpaid time lost due to their pain valued in monetary terms) accounting for 84% of overall total costs.15
Some data exist on the costs of surgical procedures or acute post-operative pain management. For example, average costs per patient associated with inadequate pain management following ambulatory surgeries have been estimated at US$1,869 for emergency visits and at US$13,902 for inpatient visits.9 A thorough literature search did not provide any data on the economic burden (both direct and indirect) associated with CPSP exclusively. The rare studies that have estimated CPSP costs have typically used generic chronic pain economic data derived from general chronic pain population,21,22 used a mixed population of surgical and trauma patients,36 or relied on medico-administrative databases with no precise CPSP diagnoses and no accounts of indirect costs.53 For example, the institutional costs associated with CPSP at a major city university health network hospital have been estimated to range between CAN$2.5 million and CAN$4.1 million yearly.22 Yearly direct and indirect costs associated with neuropathic pain months to years following trauma/surgery averaged at US$11,846 and US$29,617, respectively.36
Some studies have examined predictors of health care costs among chronic pain patients but not specifically in those suffering from CPSP. While results are heterogeneous, persistent pain, pain interference, depressive symptoms, quality of life (QOL), previous health care costs and comorbidities have all been identified as significant predictors of high pain-related health care costs.2,11,24 In addition, theoretical models, such as the Behavioral Model of Health Services Use,1 can provide some useful guidance in the identification of predictors of health care costs.
The objectives of this study were 1) to determine pain-related direct and indirect costs over a two-year period among a cohort of patients who underwent cardiac surgery and experienced CPSP and 2) to identify predictors of health care use and costs. A cardiac surgical population was chosen given the high rates of CPSP typically associated with this type of major surgery.19
Methods
Participants
The CARD-PAIN study has been previously described.7 This observational longitudinal prospective study recruited participants from four Canadian-university affiliated cardiac surgery centers (ie, the Montreal Heart Institute, the Peter Munk Cardiac Center, the Institut universitaire de cardiologie et de pneumologie de Québec, and the Maritime Heart Center) between February 2005 and September 2009.7 To be eligible to participate in the study patients had to: be aged 18 years or older; undergo coronary aortic bypass graft surgery and/or valve replacement using a median sternotomy approach; be seen at the preadmission surgery clinic; and be fluent in spoken and written French and/or English. Patients were excluded if they had a prior thoracotomy or mastectomy or if they were cognitively or physically unable to provide informed consent and/or to complete questionnaires.
Procedures and measures
The research ethics board of all four participating centers approved the study. Consecutive patients were screened for eligibility prior to surgery during the preadmission visit between February 8, 2005 and September 1, 2009. All participants provided written informed consent. Details of study procedures can be found elsewhere7 and are briefly described below.
A costing evaluation was carried out on patients who reported CPSP. CPSP has been defined as pain at the surgery site present at least 3–6 months after surgery that was not present before surgery or a worsening of the pain post-operatively, that impacts on the patient’s life and that cannot be attributed to causes other than surgery.54
Follow-ups
Participants completed questionnaires administered by a research assistant 6, 12 and 24 months post-operatively to measure pain intensity (11-point Numeric Rating Scale (NRS23), QOL (SF-12v2 Health Survey (SF12v2),51,52 depression and anxiety (Hospital Anxiety and Depression Scale (HADS),29,42,56 pain catastrophizing (Pain Catastrophizing Scale (PCS),12,46 and disability (Pain Disability Index (PDI)).38
Pain Care Record (PCR)
The PCR was used to document patients’ utilization of health care resources specifically for their CPSP and associated costs (eg, drugs, physician visits). At 6, 12, and 24 months following surgery, patients who self-reported the presence of CPSP were mailed the PCR along with a pre-stamped envelope and asked to fill it on a daily basis over a period of one month. Patients were requested to report all medications and supplies they consumed due to CPSP and their costs (if applicable), appointments outside of their home for their CPSP (type of appointment, amount paid, method of travel, parking costs, distanced traveled), emergency room visits, hospitalizations, required household help, and time patients and/or their caregivers devoted to receiving and providing care for CPSP (total of hours, number of hours taken away from employment, type of care, etc.). Upon completion of the PCR, a research assistant contacted patients by phone to validate and ensure completeness of the information provided.
The PCR is an adapted version of the Ambulatory and Home Care Record©17 which assesses health care utilization for patients with both short-term and long-term care needs.16,18,28,45 The PCR has been used in an earlier study and was found to be a very useful instrument for measuring chronic pain costs.15
Costing
Physician and laboratory resource use was based on the PCR with unit prices determined using fee-for-service rate schedules from the Ontario Ministry of Health and Long Term Care.31 Hospitalization costs were derived from the data within the Ontario Case Costing Initiative for fiscal year 2010–2011.32 Drug costs were based on the cost reported by patients’ PCR. The cost of travel by car was calculated by multiplying the distance to and from the health care provider by the cost per kilometer (CAN$0.43/km) reported by the Canadian Automobile Association.5
Remaining costs included participants’ out-of-pocket expenses, insurance reimbursements and time costs. The cost of all remaining expenses (eg, over-the-counter medications, visits to health care professionals not covered, other travel costs, privately financed health care appointments, and household help) was determined using the self-reported dollar value on the PCR. A total out-of-pocket cost was calculated for each patient by summing the amounts reported and then subtracting any reimbursements received by the care recipient or the family from insurance plans. Reimbursements were then subsequently differentiated as being either publicly or privately financed.
Time costs, defined as all paid and unpaid time lost by the patients and/or their caregiver due to patients’ CPSP valued in monetary terms, were determined by assigning a monetary value to each unit of time using a human capital approach.40,49 This approach applies current average earnings to lost time. To value time lost by patients, we multiplied the 2016 average hourly wage rate for Non-Aboriginal Canadians by the number of hours they reported losing due to CPSP.43 Time costs incurred by caregivers were estimated by multiplying the average hourly rate by the number of hours lost by caregivers due to the patients’ CPSP. All costs were inflated using published Consumer Price Indexes and reported in 2016 Canadian dollars (CAN$).44
Data analysis
All analyses were conducted using SAS (version 9.4, SAS Institute Inc., Cary, NC). Differences between CPSP patients who did and did not complete the PCR at 6-, 12- and/or 24-month follow-ups in terms of sociodemographic and pain-related outcomes were examined using chi-square tests and t-tests. Patients’ resource utilization due to CPSP at each follow-up was examined as: 1) absolute and relative frequencies and 2) mean (standard deviation [SD]) costs incurred (monetary value) by patients and/or their caregivers due to CPSP. Results were also stratified according to patients’ reported pain intensity (ie, mild [1–3 on a 10-point NRS] vs moderate to severe [4–10 on a 10-point NRS]).14
The proportions of individuals utilizing resources as a function of their pain intensity were compared using chi-squared tests or Fisher’s exact test. The relationships between predictors of resource utilization and their total monetary value were examined with the use of three distinct models, one for each follow-up time point. A multivariable logistic regression model was used to assess the relationships between the use of resources and selected independent predictors. A generalized linear model with a log link and gamma family was used to examine the relationships between the monetary value of the utilized resources and independent predictors selected based on the existing literature on risk factors for the development of CPSP;4,25 they included: participants’ age, sex, tendency to catastrophize in the face of pain (PCS scores) and pain intensity at the follow-up time point. In addition, for regression models examining the use and monetary value of resources utilized at 12 and 24 months, resource use at the previous follow-up time point(s) was included using a categorical variable (ie, prior use; no prior use; or not applicable for individuals reporting no CPSP at the previous follow-up).
As a sensitivity analysis, multiple imputation of missing data utilizing chained equations was performed (more details regarding the imputation method and results are provided in Supplementary material).55
Results
A total of 1,247 patients participated in the CARD-PAIN study7 and 1,071 completed at least two time points.35 The CARD-PAIN sample was predominantly male (79%), with a mean age of 61.9 years (SD=10.2), and most participants underwent a coronary artery bypass grafting (CABG) procedure with or without a valve replacement (VR) (77%). A detailed description of these patients is available elsewhere.35 Only patients who reported suffering from CPSP at the 6-, 12- and/or 24-month follow-ups were included in the present study, and data collected at each time point were analyzed independently to maximize sample size. Briefly, 18%, 13% and 9% of patients reported suffering from CPSP at 6-, 12-, and 24-month follow-ups, respectively (Figure 1).
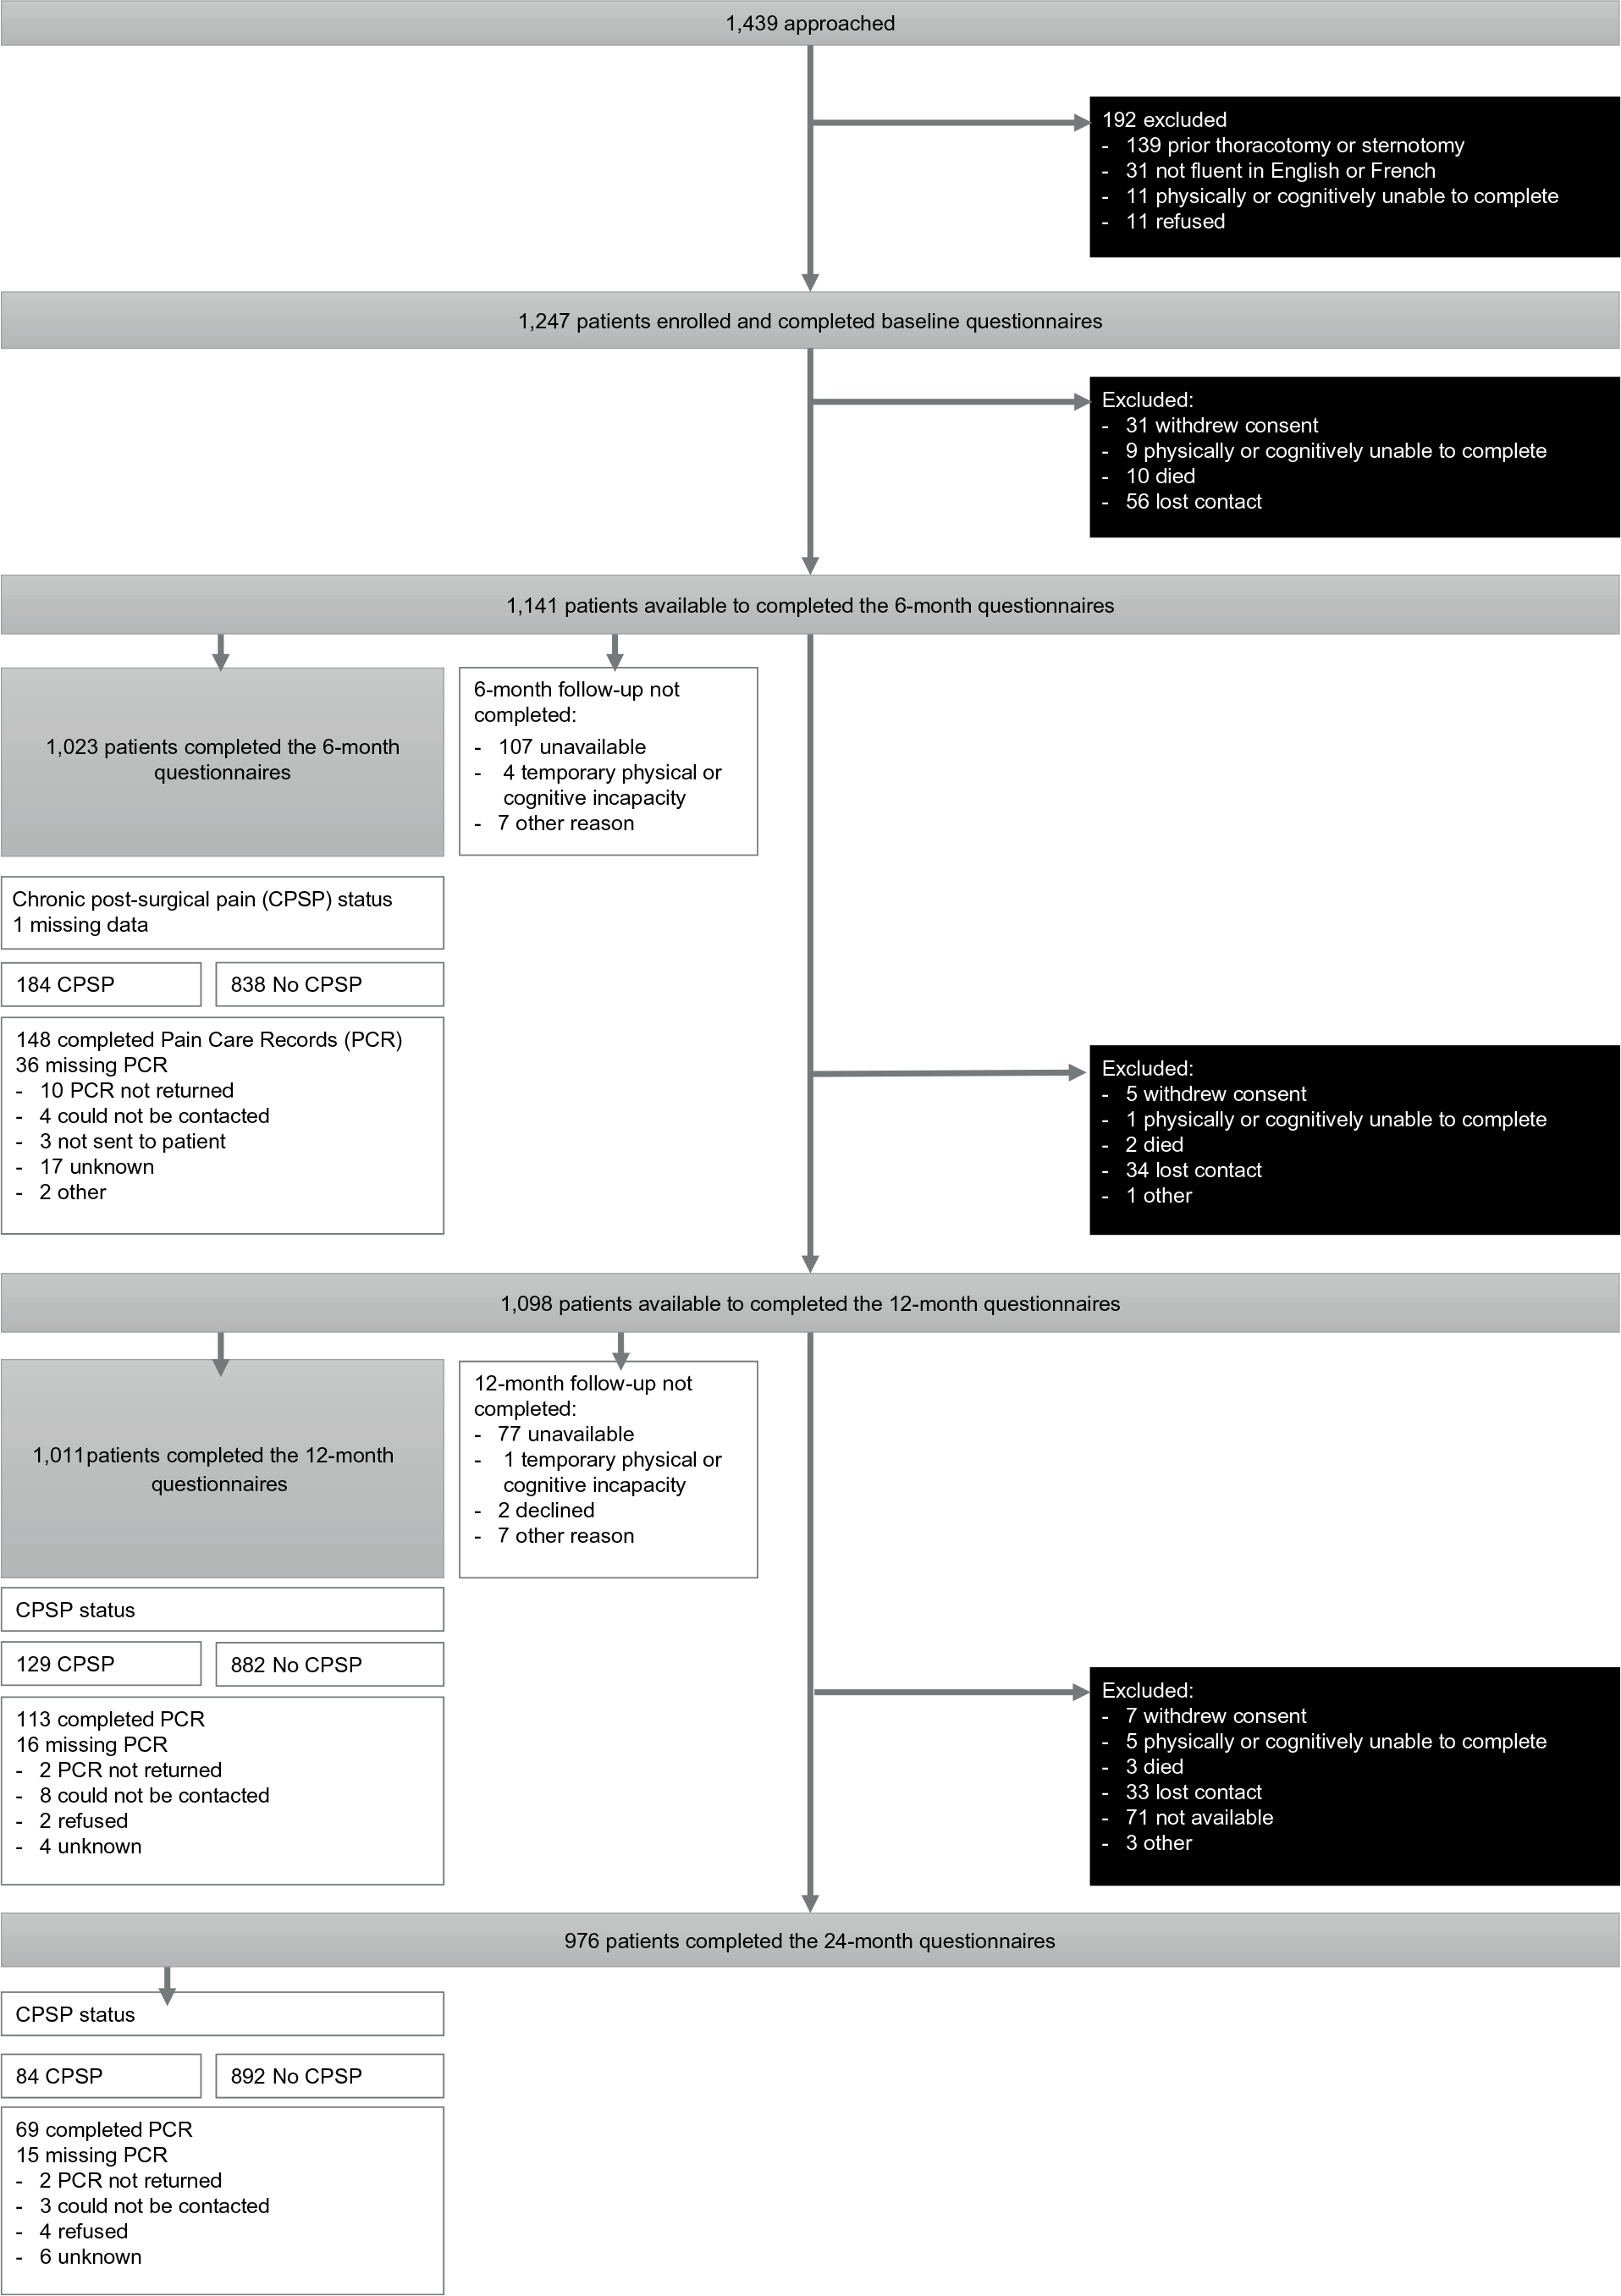 | Figure 1 Study flow diagram. |
Table 1 shows the sociodemographic and pain characteristics of each subset of patients. Results reveal that about two thirds of participants who reported CPSP were not actively employed at the time of follow-up and just over half reported suffering from moderate to severe CPSP at each of the three follow-ups (53%, 54% and 48% at the 6-, 12- and 24-month follow-ups, respectively). While 22% of the overall study sample were females, 30% of patients who reported having CPSP were female.
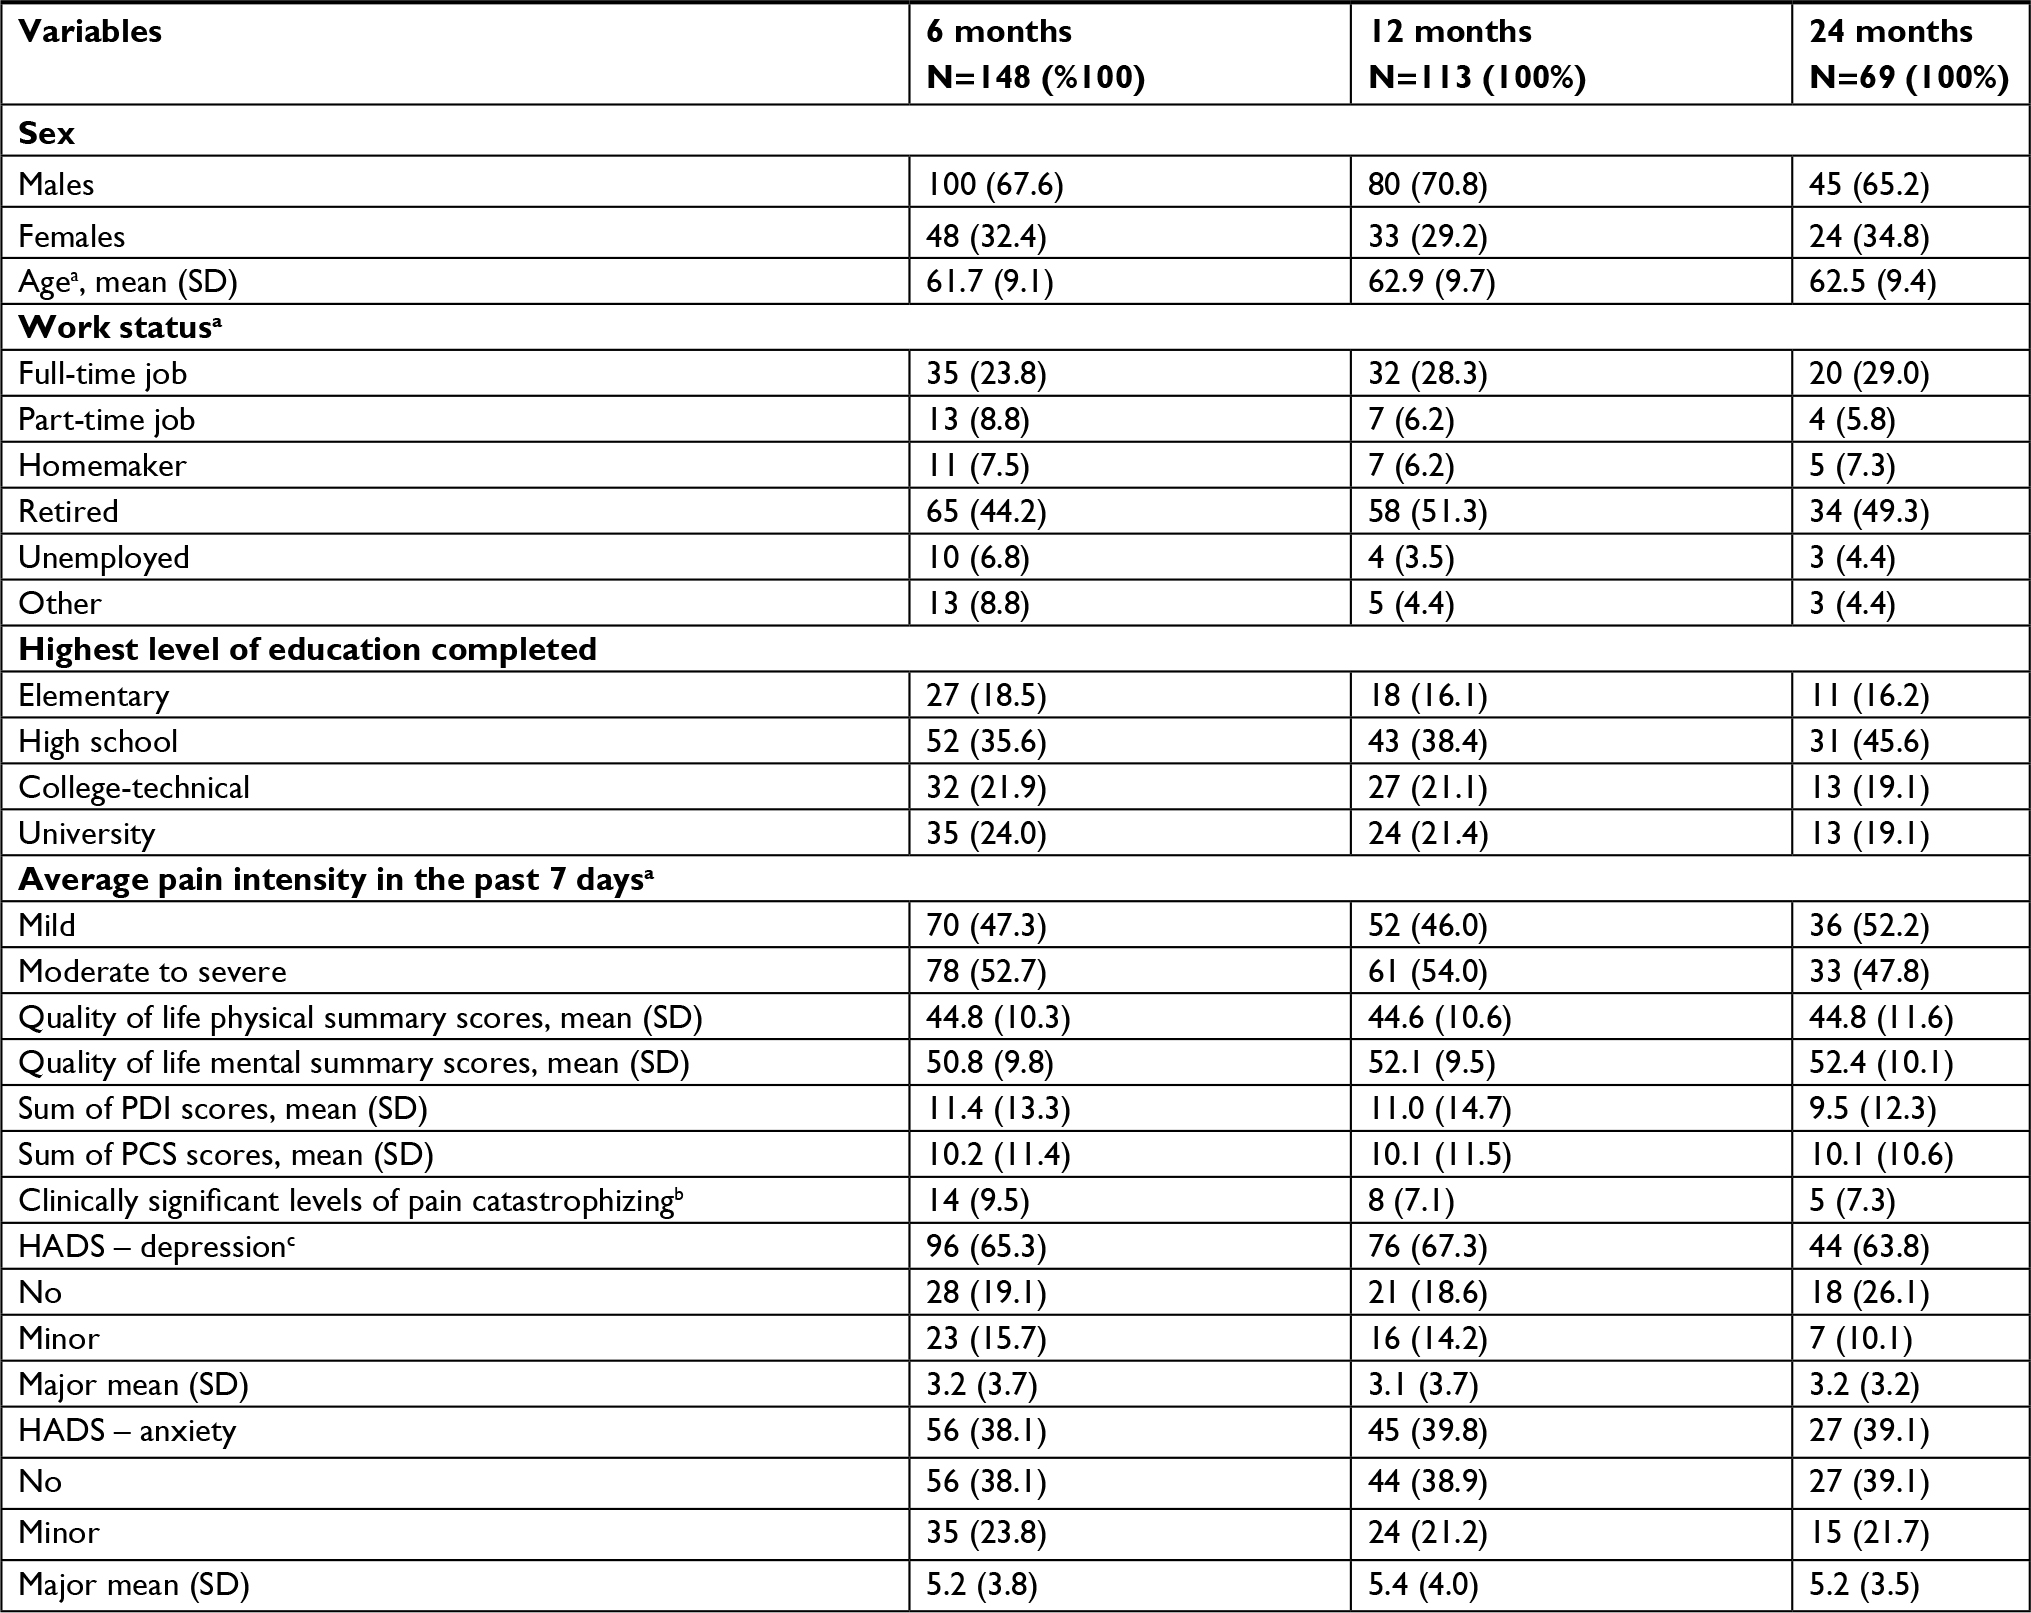 | Table 1 Characteristics of patients reporting chronic post-surgical pain who have completed the pain care record at the 6-, 12- and/or 24-month follow-up Notes: Individuals could report chronic post-surgical pain varied at any of the three follow-up times; results at any follow-up time were examined independently of each other. aValues are specific to the examined time point. bIdentifies individuals with a PCS score ≥30.46 cIndividuals with a HADS score ≤3 were identified as not suffering from depression or anxiety; individuals with a score between 4 and 7 were identified as suffering from minor levels of depression or anxiety; and individuals with a score ≥8 were identified as suffering from major levels of depression or anxiety.33,34 Abbreviations: HADS, Hospital Anxiety and Depression Scale; PCS, Pain Catastrophizing Scale; PDI, Pain Disability Index. |
Resource utilization and time lost due to CPSP
PCR response rate
Respectively, 80%, 88% and 82% of the patients who reported suffering from CPSP at 6-, 12- and/or 24-month follow-ups answered the PCR. Respondents and non-respondents did not show any significant differences in terms of socio-demographics, pain characteristics, and health-related QOL (all P>0.05) (data not shown).
Categories of resource utilization and time lost due to CPSP
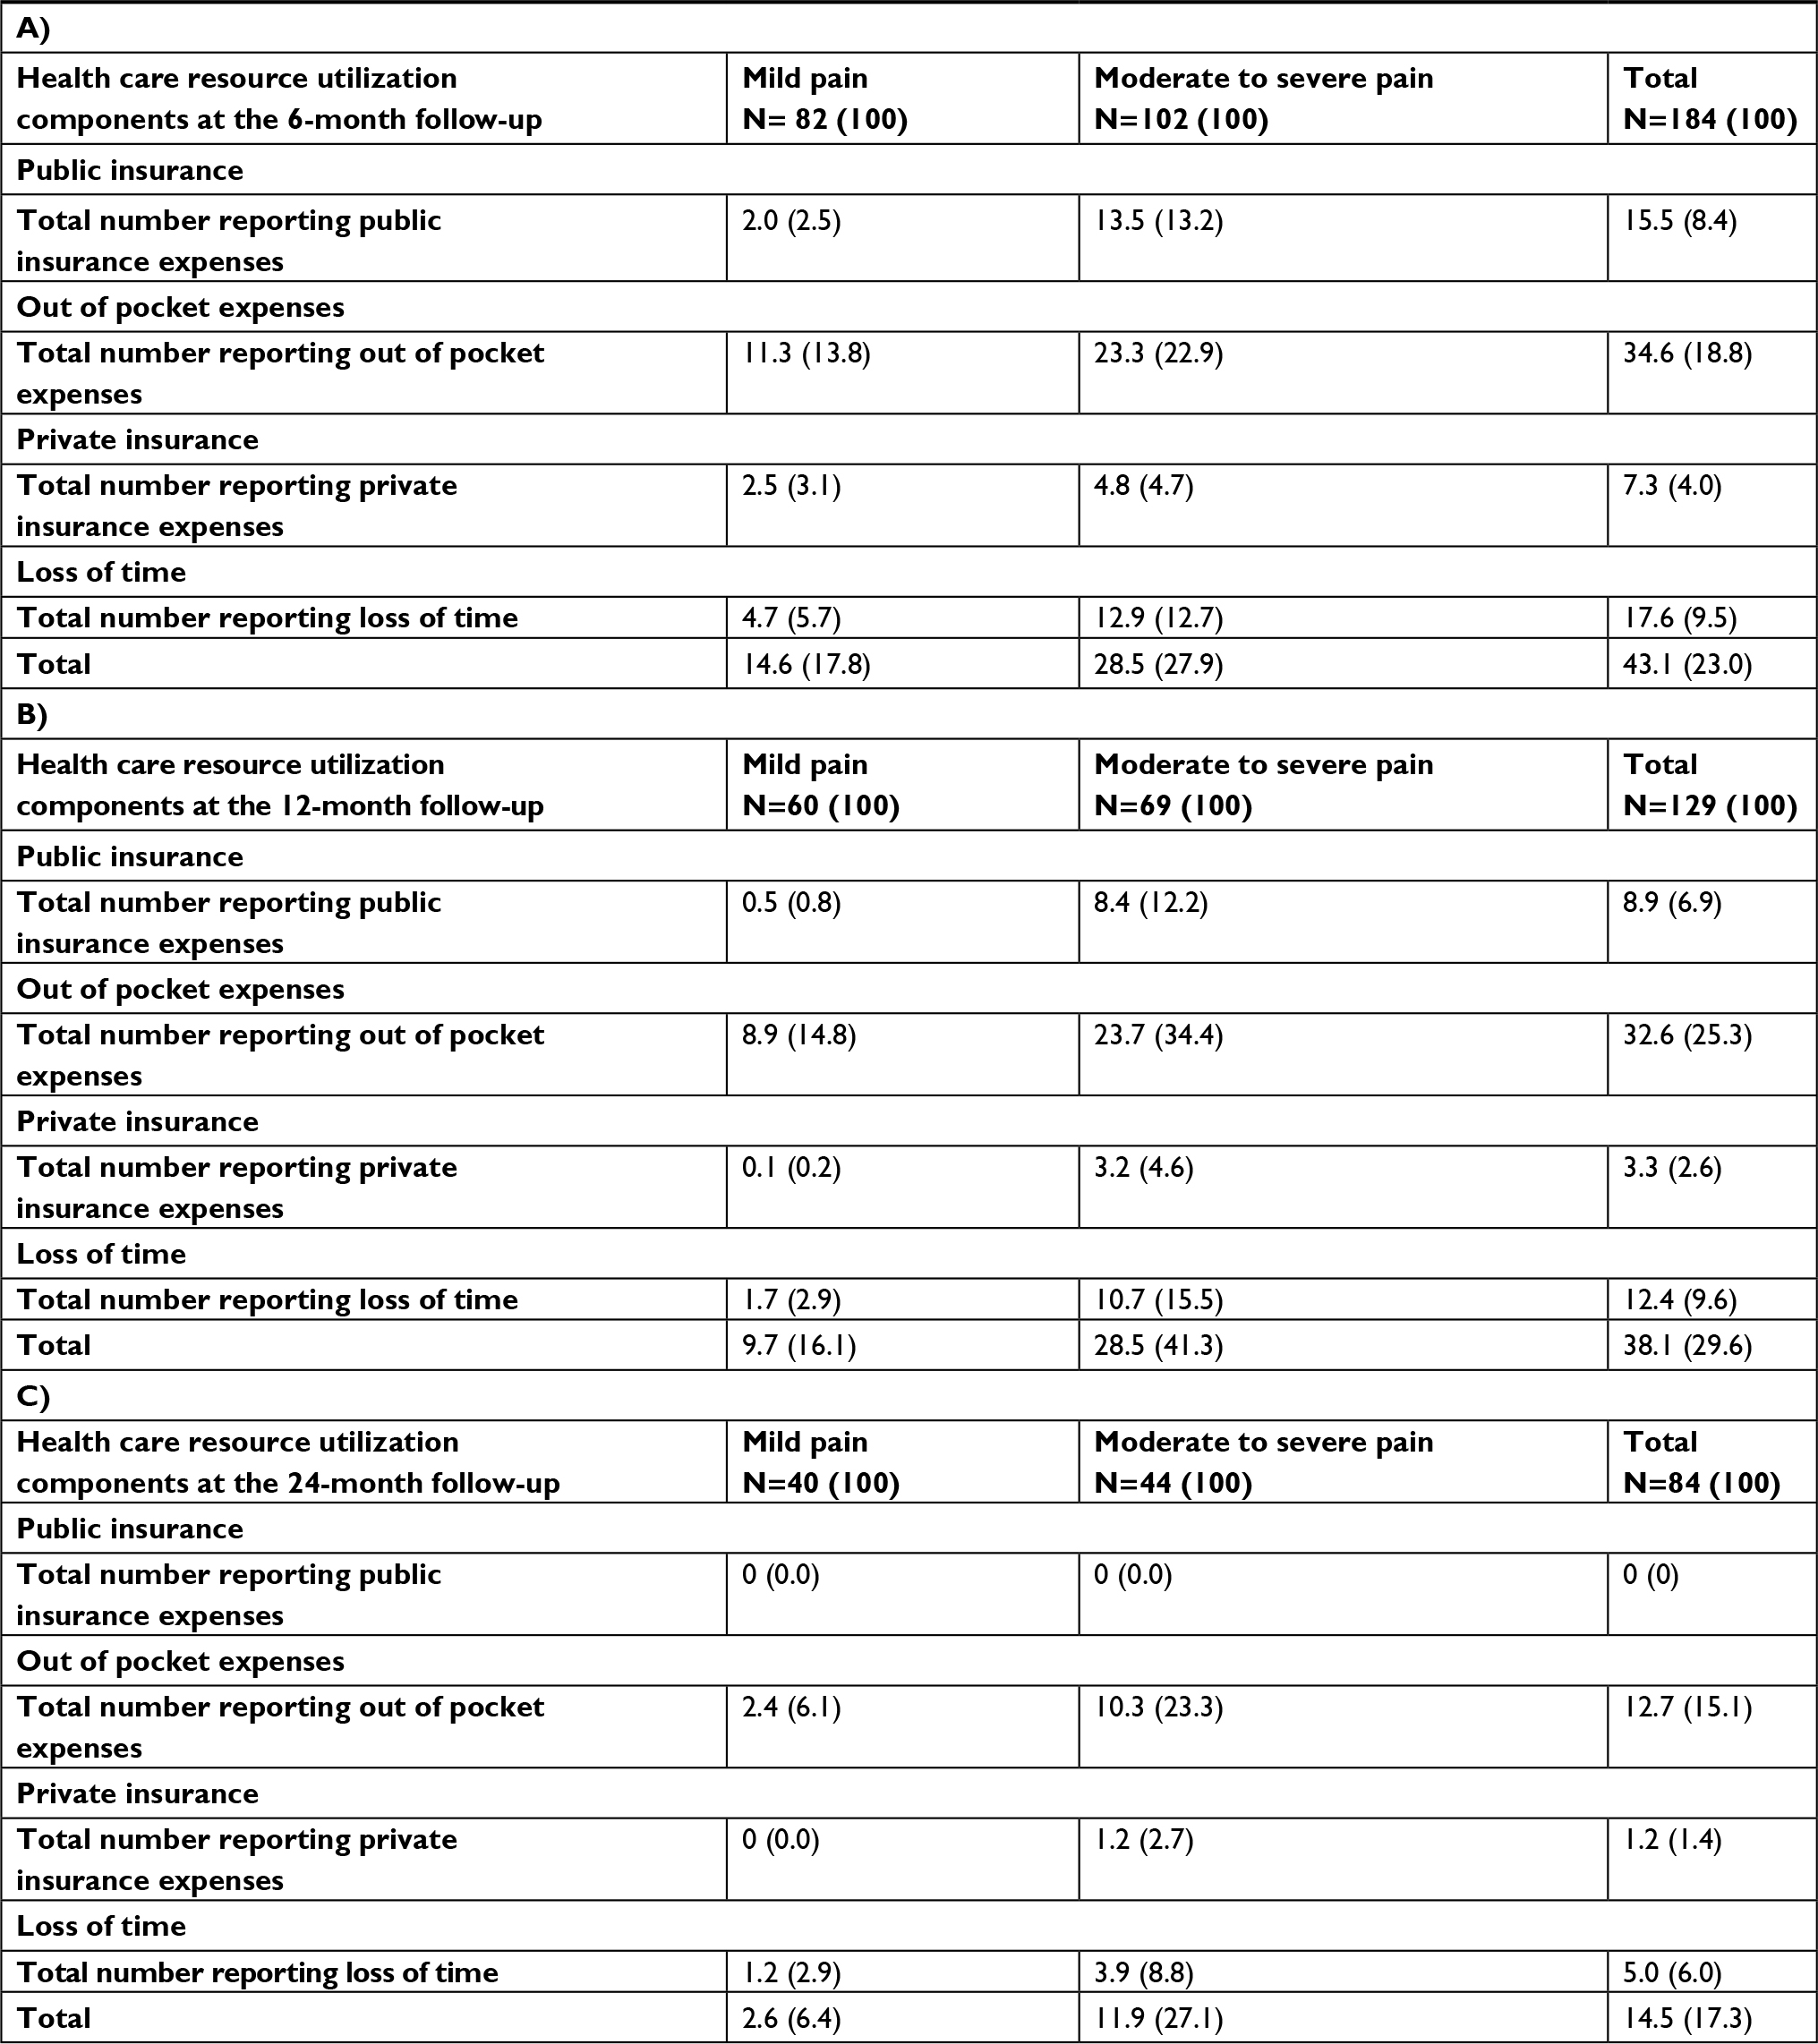
Table 2 provides the proportion of patients who reported health care resource utilization and loss of time due to their CPSP. Time lost included time lost from paid work and leisure for patients and time lost from leisure and due to household work for patients’ caregivers. A total of 21%, 28% and 16% of participants at the 6-, 12- and 24-month follow-ups, respectively, reported time losses due to their CPSP. At all three time-points, pain medication paid out-of-pocket was the most commonly reported resource (15%, 20% and 15% of the patients).
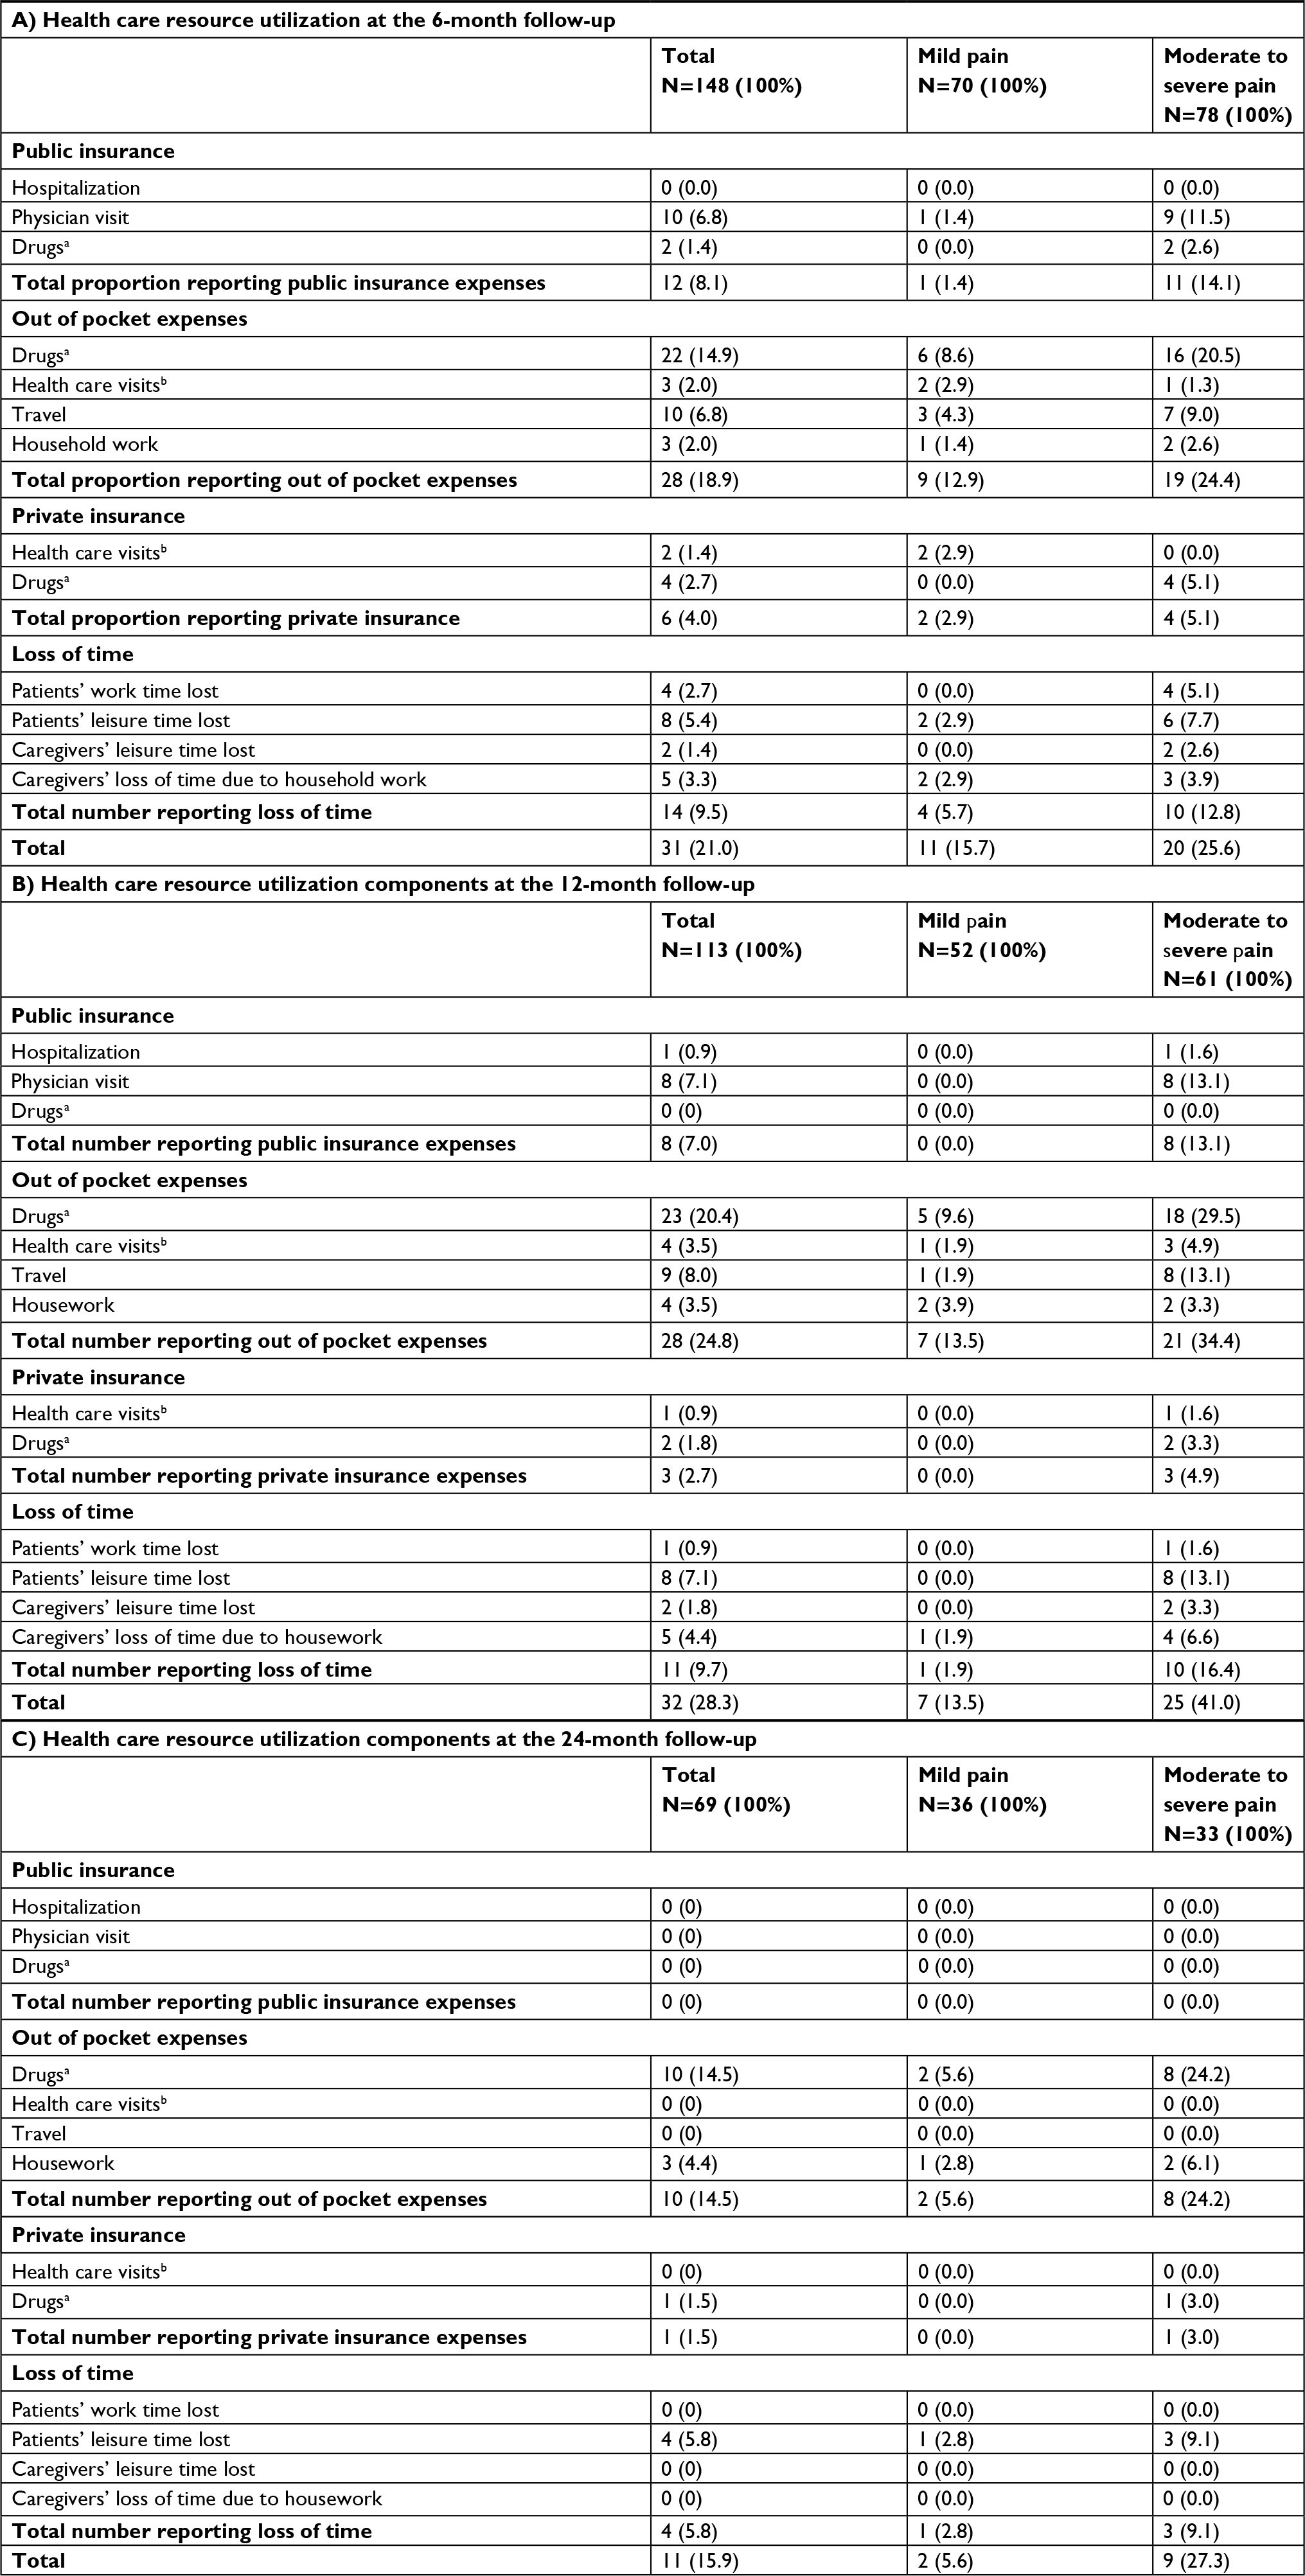 | Table 2 Proportion of individuals utilizing health care resources or reporting time lost due to chronic post-surgical pain at the (A) 6-, (B) 12- and (C) 24-month follow-up Notes: All results are presented as N (%). Resources identified within the table were utilized in the last 30 days and patients could report utilizing more than one type of resource. aDrugs utilized by patients could be covered by public and/or private insurance and/or could be paid for directly by the patient depending on insurance plan and coverage. bIncludes all non-physician health care professionals as well as physician practicing outside of the publicly insured health care system. |
When patients were stratified according to CPSP severity, no significant difference was found at 6-month follow-up in the proportion of those reporting health care resource utilization and time lost (mild pain: 16% vs moderate to severe pain: 26%, P=0.14; Table 2A). However, resource utilization and time lost were greater in patients suffering from moderate to severe pain than in patients with mild pain at both 12-month follow-up (41% vs 14%, P<0.01; Table 2B) and 24-month follow-up (27% vs 6%, P=0.02; Table 2C).
Direct and indirect care costs
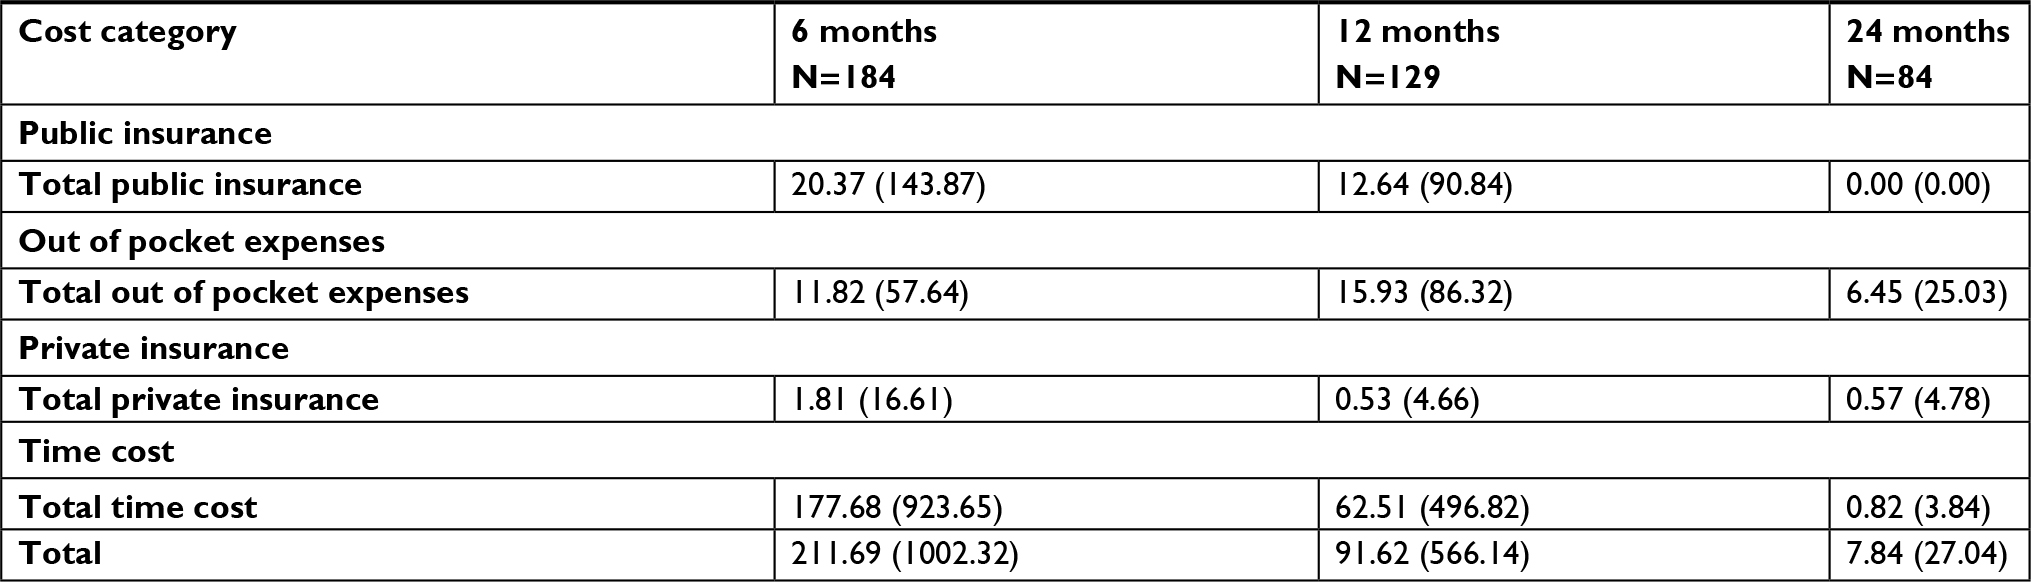
Table 3 shows the monthly mean monetary values of resource utilization and time lost in patients reporting CPSP at the 6-, 12- and 24-month follow-ups. Results indicate that these values dropped over time, from CAN$207.26 at 6-month to CAN$100.13 at 12-month and CAN$7.68 at 24-month follow-up. When focusing solely on patients who utilized resources, the economic burden of CPSP is substantially higher (monthly mean cost of CAN$989.52, CAN$353.60 and CAN$48.17 at the 6-, 12- and 24-month follow-ups, respectively). Breakdowns within cost components indicate that time costs were the most important ones at both 6- and 12-month follow-ups, accounting for 83% and 69% of the total costs, respectively. At 24-month follow-up however, out-of-pocket expenses accounted for 83% of total costs while time costs accounted for only 10%.
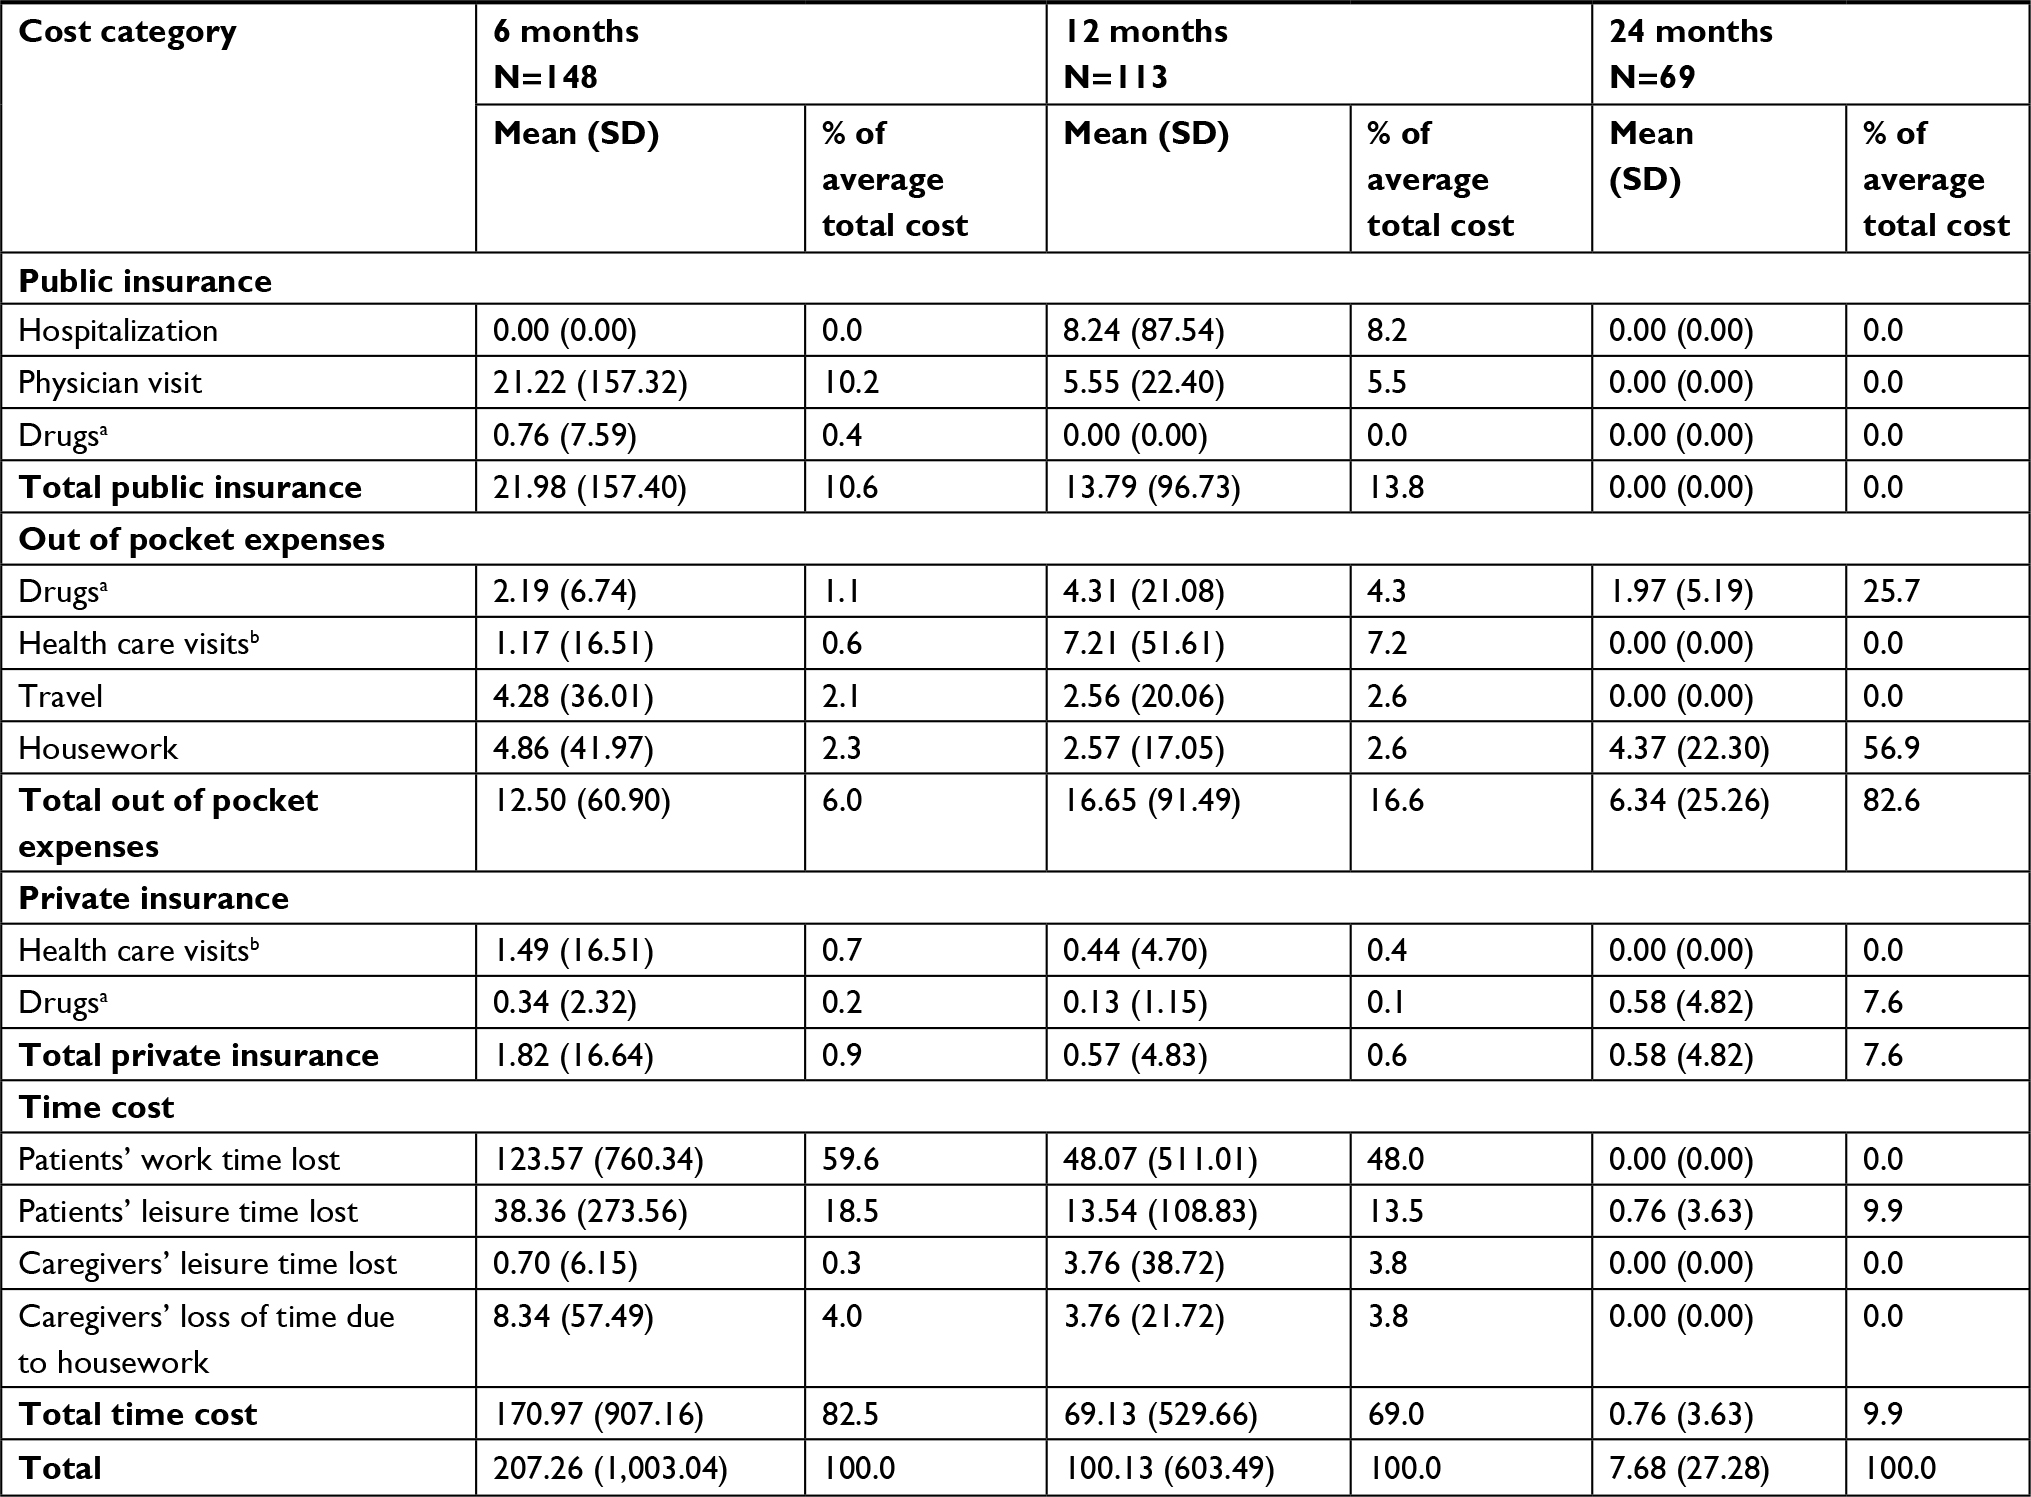 | Table 3 Monthly costs in patients suffering from chronic post-surgical pain at the 6-, 12- and/or 24-month follow-up Notes: All results are in Canadian dollars. aDrugs utilized by patients could be covered by public or private insurance or could be paid for directly by the patient depending on insurance plan and coverage. bIncludes all non-physician health care professionals as well as physician practicing outside of the publicly insured health care system. Costs were stratified based on patients’ insurance plans and coverage. |
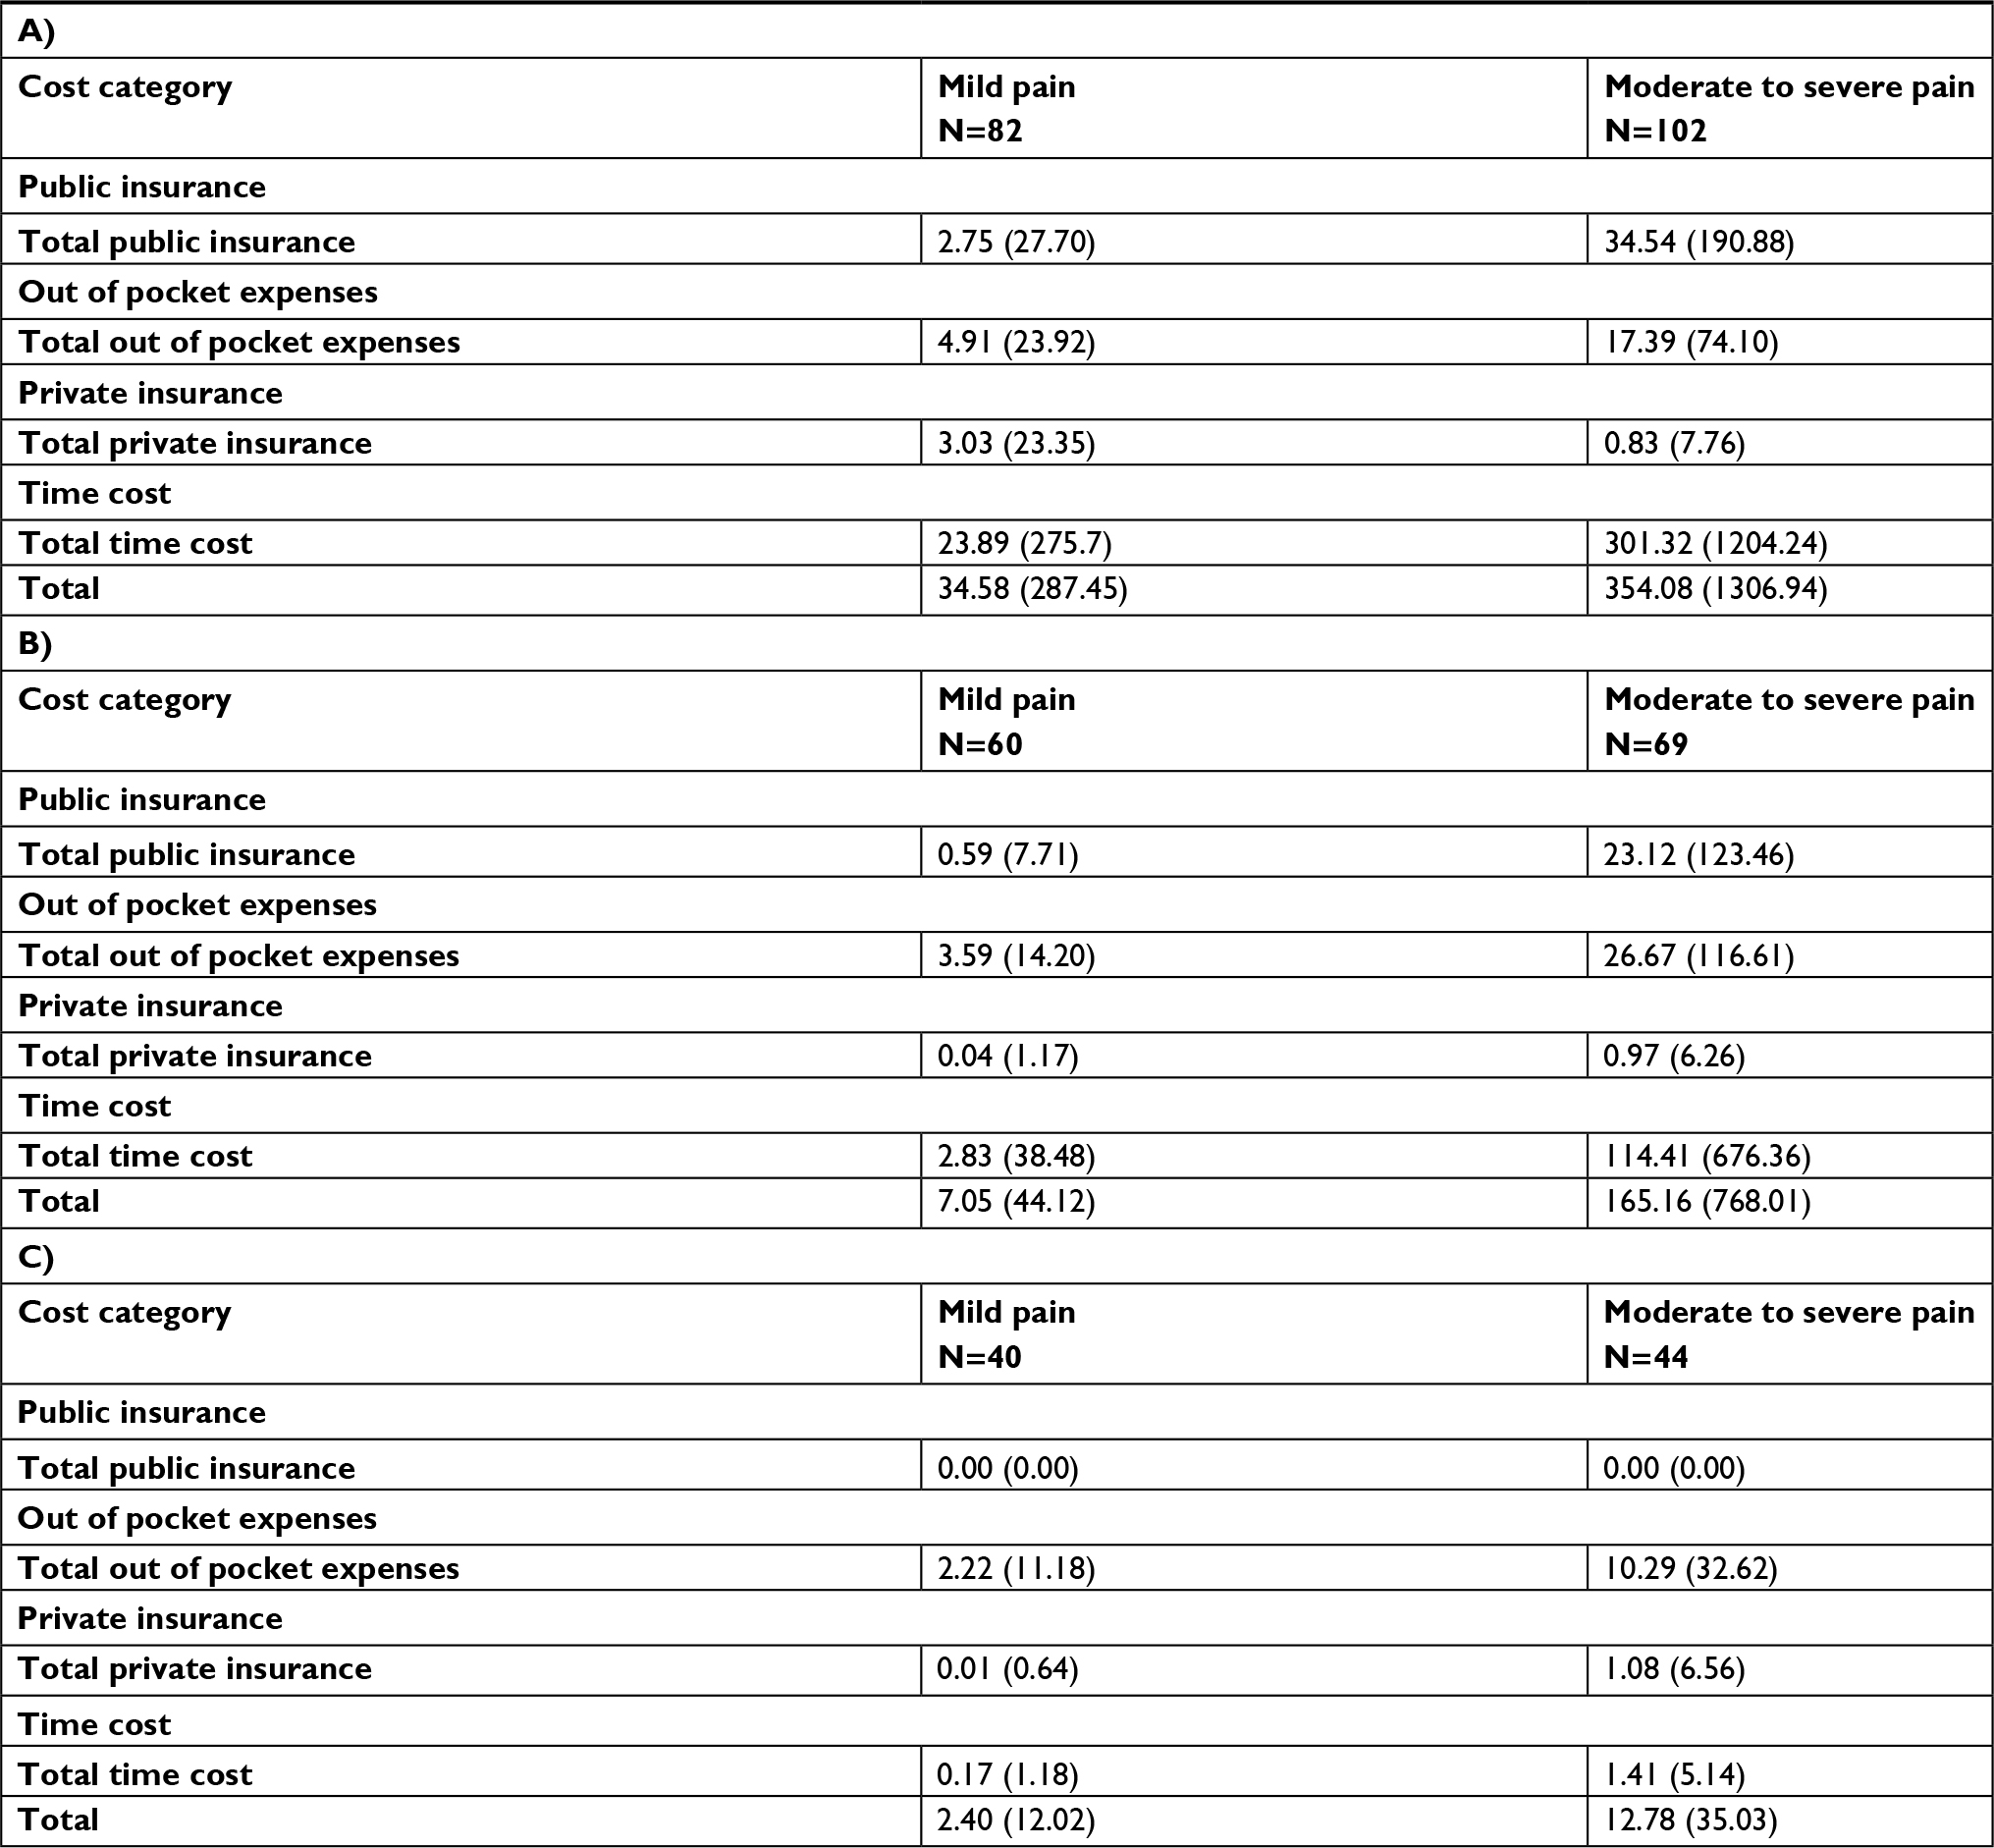
Costs at the 6-, 12- and 24-month follow-ups were also stratified according to patients’ pain intensity (Table S1). At all follow-up times, expenses reported by patients suffering from moderate to severe pain were greater than in patients with mild pain (at the 6-month follow-up, CAN$377 [CAN$1,362] vs CAN$18 [CAN$61], P<0.01; at the 12-month follow-up, CAN$183 [CAN$815] vs CAN$3 [CAN$12], P<0.01; at the 24-month follow-up, CAN$14 [CAN$37] vs CAN$2 [CAN$12], P< 0.01).
Predictors of resource utilization, time lost and costs
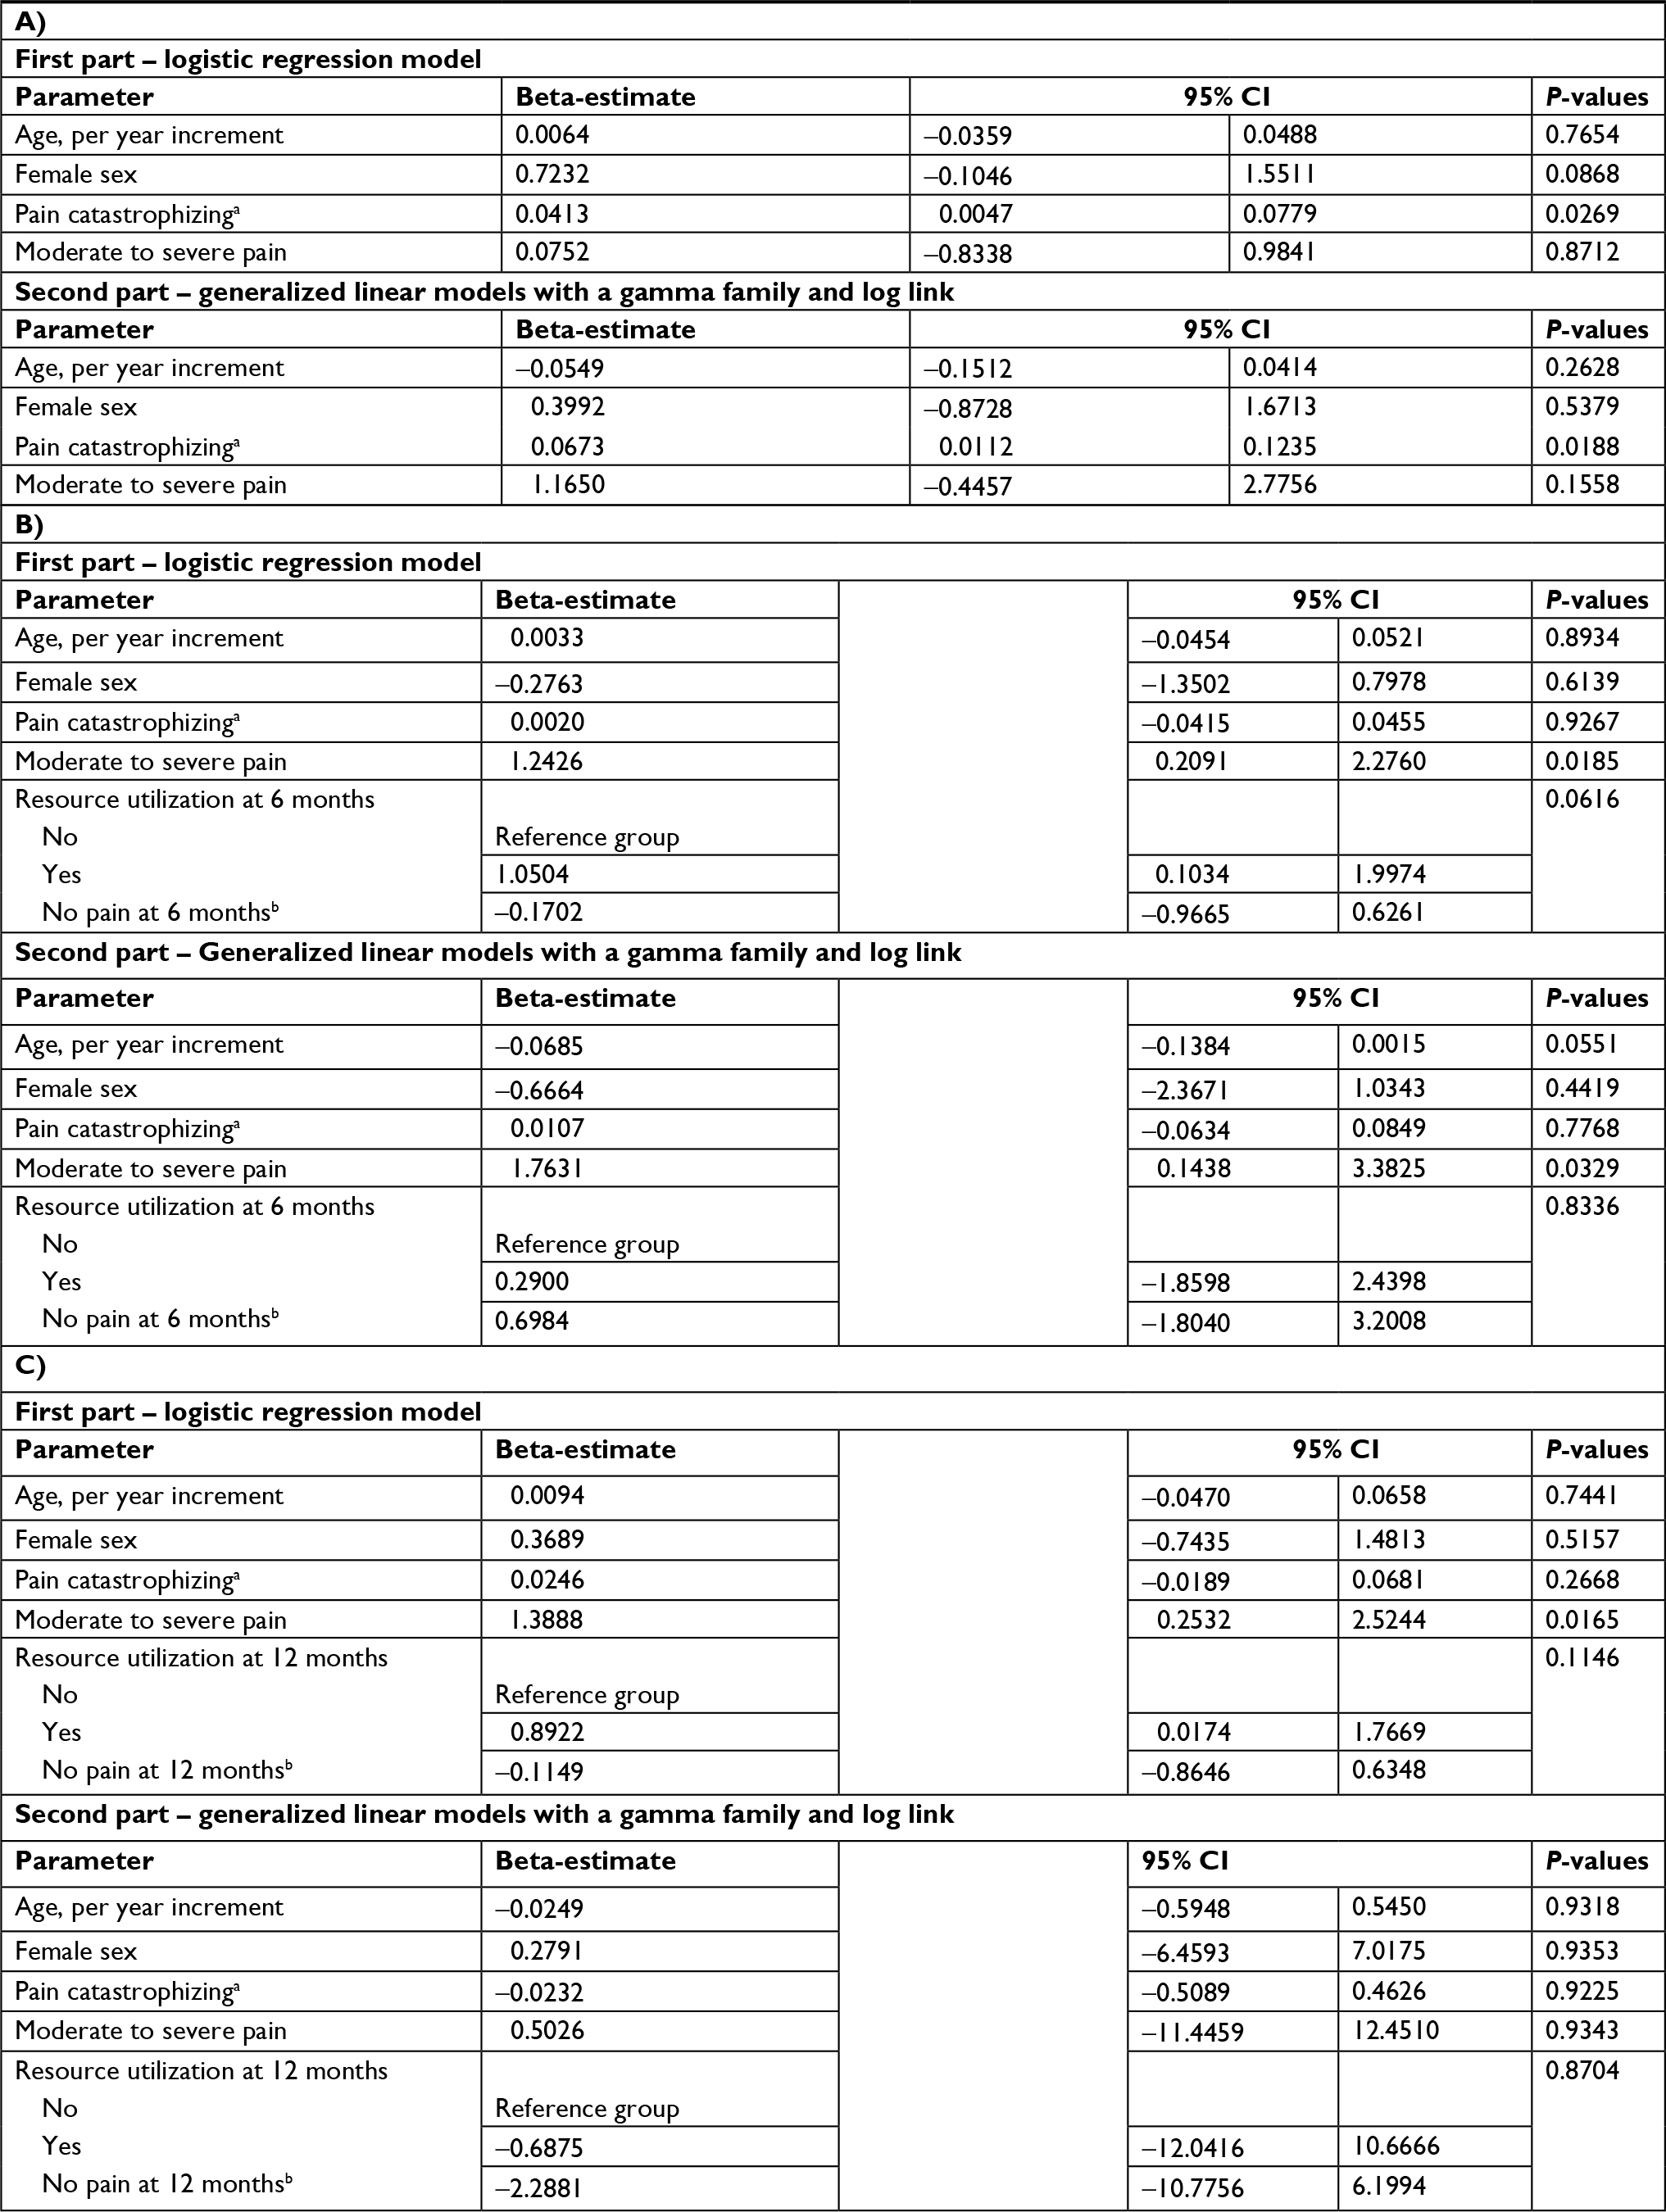
Results of the regression models indicated that the independent factors that predicted the use vs non-use of resources and reported time lost and those predicting care and time lost costs among users and non-users differed at each of follow-up time (Table 4). At the 6-month follow-up, women and patients with a greater tendency to catastrophize in the face of pain were more likely to have utilized resources/lost time for CPSP care. Significant predictors of higher costs included greater levels of pain catastrophizing and greater pain severity (Table 4A).
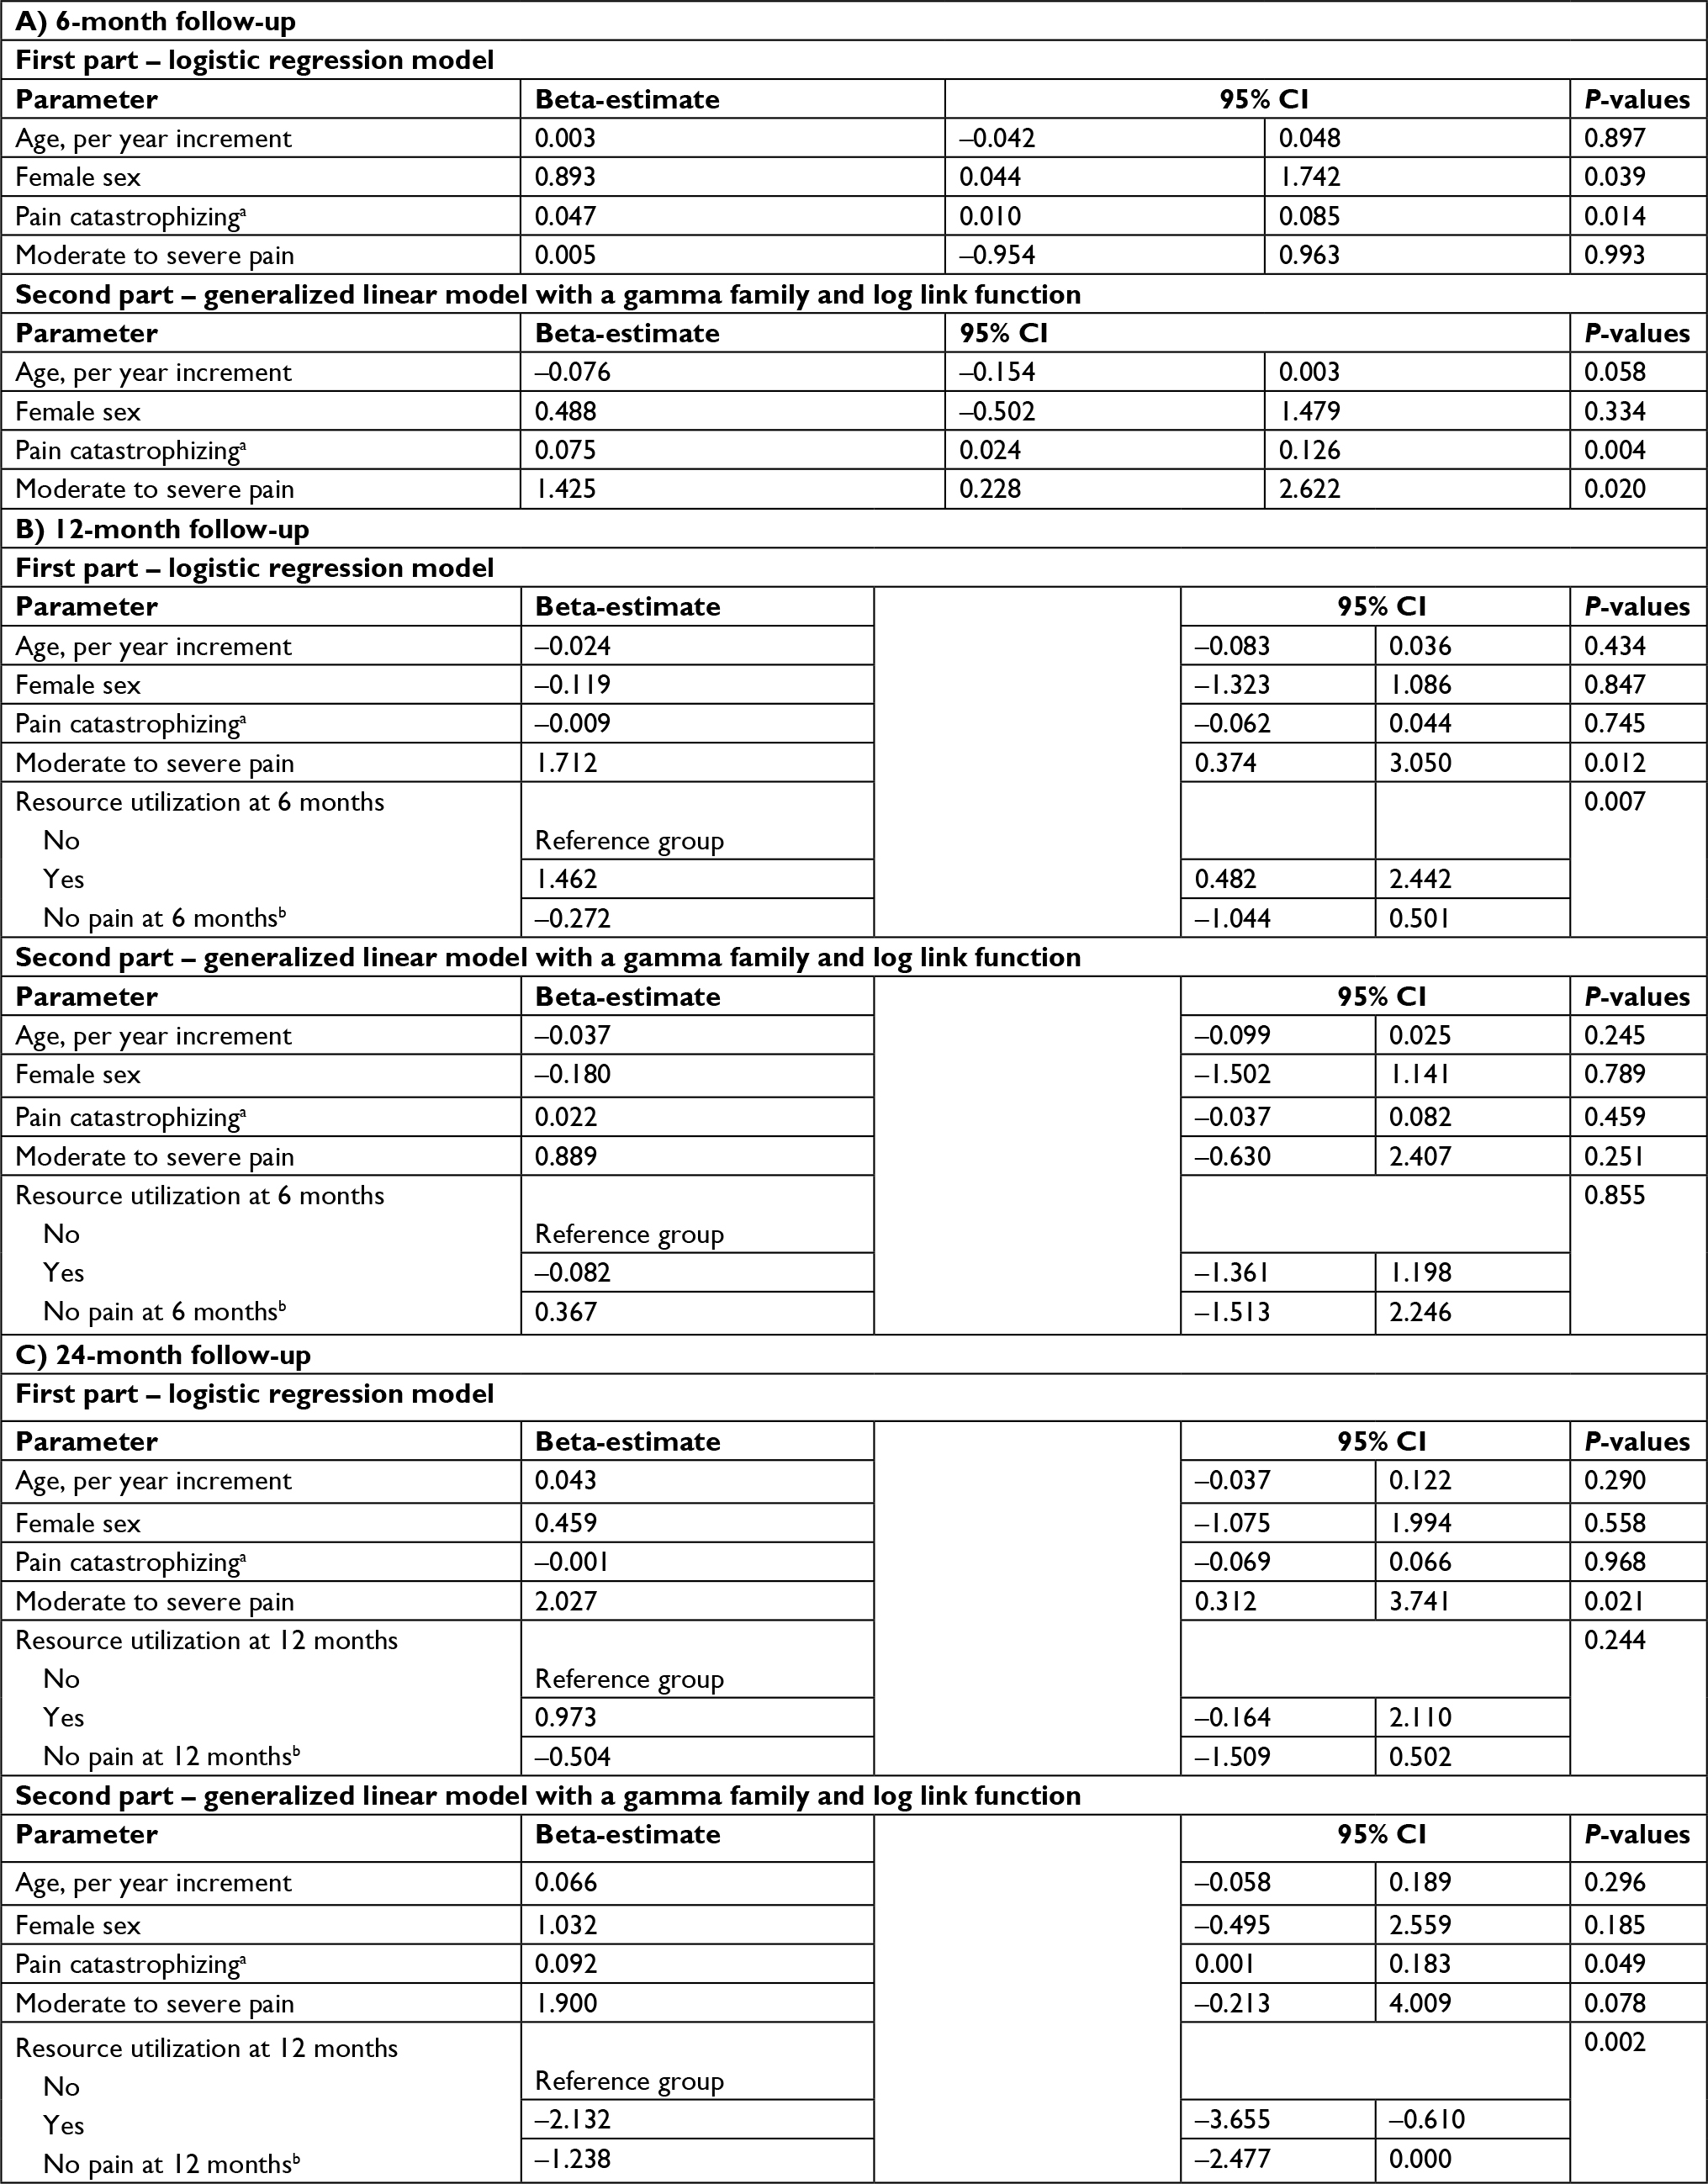 | Table 4 Predictors of resource use/time lost (logistic regression model results) and overall costs (generalized linear model with a gamma family and log link function results) Notes: aTable shows results for the two part models for the probability of utilizing resources and the monetary value of the utilized resource at the (A) 6, (B) 12 and (C) 24 month follow-up. Per point increment on the pain catastrophizing scale. bReflects individuals who did not report any pain at 12 months in whom no resource could therefore be utilized. |
At 12-month follow-up, patients reporting moderate to severe pain were more likely to utilize resources for their CPSP. Use of health care resources at 6 months was also a significant predictor of patients’ use at 12 months. However, none of the examined predictors of costs reached statistical significance (all P≥0.245; Table 4B).
At 24-month follow-up, greater pain intensity was the only statistically significant predictor of resource utilization (Table 4C). With regard to direct/indirect costs, they were higher in patients exhibiting greater levels of pain catastrophizing. Finally, presence of CPSP and use of health care resources at 12 months were both significant predictors of costs at 24 months.
Multiple imputation
Results of the multiple imputation were aligned with the non-imputed results and supported our conclusions (Tables S2–S5).
Discussion
Between 16% and 28% of patients with CPSP reported utilizing health care resources for their pain over the follow-up period. Among all CPSP patients, mean monthly pain-related direct and indirect costs were CAN$207 at 6 months and decreased thereafter. One important finding pertains to the low proportion of CPSP patients who reported costs. When focusing solely on patients who reported health-related costs/time losses, the financial burden of CPSP is substantially higher (monthly mean cost of CAN$990 at 6-month follow-up). While cost estimates appear low, it remains an important economic burden considering that 2.46 million surgeries are performed on average per year in Canada.47
Low overall health care use and time lost at all time points
The low proportion of CPSP patients who reported health-related costs/time losses could reflect demographic, etiologic or health status characteristics. First, patients in this cardiac surgery study were older (mean age =62 years old) compared to another study of economic burden of chronic pain (mean age = 49 years old).15 One may speculate that when patients get older, they tend to consider that pain is a “normal” part of aging30,48 and may be less likely than younger patients to access health care resources. In addition, patients in this study had a cardiac condition that led to the surgical procedure. It is possible that they may be more preoccupied by their cardiac condition (as may be their physician) than by their CPSP. The impact of the CPSP on patient QOL might also have influenced patterns of resource utilization. In this study, cardiac CPSP patients reported lower overall and physical health-related QOL compared to the general USA population52 but higher than that of other chronic pain populations.6,26 Mental health-related QOL in this study however appeared comparable to that of the general USA population.52 Better overall health-related QOL than most chronic pain populations could thus also explain, at least in part, lower care costs found in this study.
Low overall costs associated with CPSP
Overall costs reported in this study are lower than those reported in other chronic pain populations. As stated previously, average costs across all CPSP patients are very low (CAN$207), mainly because a large proportion of these patients are not utilizing resources or losing time due to their CPSP. This might be because their QOL is not significantly impacted by their CPSP experience. Study results showed that costs of CPSP over the first two years following surgery are also much lower than those of patients waiting for chronic pain multidisciplinary treatments obtained using the same data collection tool (PCR), with median monthly cost approximating CAN$1,462.15 Study results highlight that a subset of study patients account for the vast majority of reported costs. Those high health care utilizers might be the ones who will later on continue to be high health care utilizers and contribute to the high health care costs of chronic pain found in these other studies.13,15 In fact, a recent study of costs associated with treatment of neuropathic pain among post-trauma and post-surgery patients showed monthly direct and indirect costs totaling on average US$3,455 per patient.36 More than 90% of these patients were recruited from medical settings and were more than 2 years post-trauma or surgery. Although these US long-term costs may not directly reflect the long-term Canadian values, they highlight the potential long-term importance of our findings.
Utilization trends
Beyond the relatively low utilization of resources, a more important result regards its evolution over time; at 6 months, one in five patients (21%) reported utilizing resources/losing time due to their CPSP; this fraction increases to a high of over one in four (28%) at 12 months, and drops to a low of one in six (16%) at 24 months (Table 2). Such a relation may be explained by the fact that, at 6 months, patients still consider CPSP as “normal” and therefore do not address the issue. When pain lingers for a few additional months however, patients might become more pro-active in managing CPSP and attempt to resolve it. Finally, by two years post-surgery, many treatment options may have been exhausted; patients still suffering from CPSP may revert to a passive approach to their pain and refrain from further consultations or ineffective treatments. It is also possible that the decreased proportion of CPSP patients who report moderate to severe CPSP influence health care utilization over time. This is an important consideration in light of the association between pain intensity and health care utilization at 12 and 24 months.
Primary sources of reported costs
Types of resources utilized by patients suffering from CPSP also warrant further discussion. Indeed, we notice that drugs paid-out-of-pocket were the most commonly utilized resource at all three follow-ups. This makes sense given that pharmacological approaches to managing peri- and acute post-operative pain are the central elements to treatment.8 While drugs paid-out-of-pocket was the most commonly utilized resource, it was not the most costly. Indeed, the most significant contributor to the overall cost associated with CPSP was patients’ time loss from work (CAN$124). This was also the case in the study of Guerriere et al15 (CAN$1,613). In addition to differences in recruitment sites (surgical vs waitlist of tertiary care multidisciplinary pain settings) and pain duration (median pain duration of 5 years), one factor that might contribute to this cost difference is the employment status differences between the two samples. In the current study, 37% of patients were retired while this was the case for only 14% of patients in the study of Guerriere et al.15
Predictors of health care utilization/time lost and associated costs
With regards to predictors of use vs non-use of health care resource utilization and direct/indirect costs, none of the variables examined in this study was a consistent predictor of either outcome at the three follow-up time points. Nevertheless, we were able to identify several significant predictors at each follow-up time point.
Pain intensity
Consistent with other studies among chronic pain patients,13,27,37 pain intensity was associated with health care utilization and other incurred costs. For example, in a study of 1,703 neuropathic pain patients, pain intensity significantly predicted total pain-related health care costs, direct costs, and indirect costs.37
Prior health care utilization
Prior health care utilization has also been found to predict future health care costs among chronic pain patients.2 It is possible that patients with prior pain who do not respond to treatment will continue to access the health care system in an attempt to find a solution that will provide them with pain relief.
Catastrophizing
A greater tendency to catastrophize in the face of pain was also a significant predictor of higher health care utilization and costs. This construct has been associated with many different aspects of the patient pain experience. Increased pain-related distress among individuals with high levels of pain catastrophizing might be a strong motivator for health care consultations. In fact, anxiety generally has been associated with health care utilization.50
Study limitations
Our study has several limitations that we must acknowledge. First, results pertain to the economic burden of CPSP following cardiac surgery and cannot be generalized to other types of CPSP. Second, patients completed a one-month PCR at three distinct time points. Deriving costs using a one-month data collection may have resulted in overestimation or underestimation of expenses, as resource utilization rates may change over time. Third, our results were based on patient-reported data that could be subject to recall and information biases that could have over- or under-estimated costs. However, it is important to point out that research assistants carefully reviewed all completed PCR at the three time points and contacted on each occasion all participants by phone to validate and ensure completeness of the information or clarify certain points. Last, despite the overall large study sample size, results of our regression analyses used to identify significant predictors of resource utilization due to CPSP and direct/indirect costs are based on a relatively small sample size that may have reduced the power of our statistical analyses. Though we recognized this limit, this cohort of patients represents the largest Canadian sample of cardiac surgery patients suffering from CPSP to date.
Conclusion
This is the first study to have examined pain-related direct and indirect costs in a large sample of cardiac surgery patients who have developed CPSP. Despite low average costs among patients reporting CPSP, results reveal that most of these costs were attributed to a small proportion of patients. Costs of CPSP peaked one year after surgery and were mainly due to patients’/care givers’ time devoted to receiving and providing care. Health care utilization patterns and costs seem to depend not only on CPSP pain severity but also on psychological factors (pain catastrophizing). These results highlight the need to better understand how CPSP, psychological characteristics and their associations with health care utilization and costs evolve over time and how such characteristics can help to identify heavy health care utilizers. It will also be important to investigate these issues in other surgical populations.
Acknowledgments
The CARD-PAIN study was supported by grants received from the Canadian Institutes of Health Research (CIHR grant no MOP-69065) as well as from the Research Foundation of the Montreal Heart Institute. MGP was a recipient of a CIHR post-doctoral research fellowship.
Disclosure
The authors report no conflicts of interest in this work.
References
Andersen RM, Davidson PL. Improving access to care in America: Individual and contextual indicators. In: Changing the U.S. Health Care System: Key Issues in Health Services, Policy, and Management Andersen R, Rice T, Kominski E, editors. San Francisco: Jossey-Bass; 2001: 3–30. | ||
Antaky E, Lalonde L, Schnitzer ME, et al. Identifying heavy health care users among primary care patients with chronic non-cancer pain. Can J Pain. 2017;1(1):22–36. | ||
Breivik H, Collett B, Ventafridda V, Cohen R, Gallacher D. Survey of chronic pain in Europe: prevalence, impact on daily life, and treatment. Eur J Pain. 2006;10(4):287–333. | ||
Burns LC, Ritvo SE, Ferguson MK, Clarke H, Seltzer Z, Katz J. Pain catastrophizing as a risk factor for chronic pain after total knee arthroplasty: a systematic review. J Pain Res. 2015;8:21–32. | ||
Canadian Automobile Association [webpage on the Internet]. CAA Driving Costs Calculator; 2017. Available from: http://caa.ca/car_costs. Accessed March 9, 2017. | ||
Choinière M, Ware MA, Pagé MG, et al. Development and Implementation of a Registry of Patients Attending Multidisciplinary Pain Treatment Clinics: The Quebec Pain Registry. Pain Res Manag. 2017:8123812. | ||
Choinière M, Watt-Watson J, Victor JC, et al. Prevalence of and risk factors for persistent postoperative nonanginal pain after cardiac surgery: a 2-year prospective multicentre study. CMAJ. 2014;186(7): E213–E223. | ||
Chou R, Gordon DB, de Leon-Casasola OA, et al. Management of Postoperative Pain: A Clinical Practice Guideline From the American Pain Society, the American Society of Regional Anesthesia and Pain Medicine, and the American Society of Anesthesiologists’ Committee on Regional Anesthesia, Executive Committee, and Administrative Council. J Pain. 2016;17(2):131–157. | ||
Coley KC, Williams BA, Dapos SV, Chen C, Smith RB. Retrospective evaluation of unanticipated admissions and readmissions after same day surgery and associated costs. J Clin Anesth. 2002;14(5):349–353. | ||
Eisenberg JM. Clinical economics. A guide to the economic analysis of clinical practices. JAMA. 1989;262(20):2879–2886. | ||
Engel CC, von Korff M, Katon WJ. Back pain in primary care: predictors of high health-care costs. Pain. 1996;65(2–3):197–204. | ||
French DJ, Noël M, Vigneau F, French JA, Cyr CP, Evans RT. A French-language, French-Canadian adaptation of the Pain Catastrophizing Scale. Can J Behav Sci. 2005;37:181–192. | ||
Gaskin DJ, Richard P. The economic costs of pain in the United States. J Pain. 2012;13(8):715–724. | ||
Gerbershagen HJ, Rothaug J, Kalkman CJ, Meissner W. Determination of moderate-to-severe postoperative pain on the numeric rating scale: a cut-off point analysis applying four different methods. Br J Anaesth. 2011;107(4):619–626. | ||
Guerriere DN, Choinière M, Dion D, et al. The Canadian STOP-PAIN project - Part 2: What is the cost of pain for patients on waitlists of multidisciplinary pain treatment facilities? Can J Anaesth. 2010;57(6):549–558. | ||
Guerriere DN, Tullis E, Ungar WJ, et al. Economic burden of ambulatory and home-based care for adults with cystic fibrosis. Treat Respir Med. 2006;5(5):351–359. | ||
Guerriere DN, Ungar WJ, Corey M, et al. Evaluation of the ambulatory and home care record: Agreement between self-reports and administrative data. Int J Technol Assess Health Care. 2006;22(2):203–210. | ||
Guerriere DN, Wong AY, Croxford R, Leong VW, McKeever P, Coyte PC. Costs and determinants of privately financed home-based health care in Ontario, Canada. Health Soc Care Community. 2008;16(2):126–136. | ||
Guimarães-Pereira L, Reis P, Abelha F, Azevedo LF, Castro-Lopes JM. Persistent postoperative pain after cardiac surgery: a systematic review with meta-analysis regarding incidence and pain intensity. Pain. 2017;158(10):1869–1885. | ||
Gustavsson A, Bjorkman J, Ljungcrantz C, et al. Socio-economic burden of patients with a diagnosis related to chronic pain – register data of 840,000 Swedish patients. Eur J Pain. 2012;16(2):289–299. | ||
Hogan ME, Taddio A, Katz J, Shah V, Krahn M. Health utilities in people with chronic pain using a population-level survey and linked health care administrative data. Pain. 2017;158(3):408–416. | ||
Huang A, Azam A, Segal S, et al. Chronic postsurgical pain and persistent opioid use following surgery: the need for a transitional pain service. Pain Manag. 2016;6(5):435–443. | ||
Jensen MP, Karoly P. Self-report scales and procedures for assessing pain in adults. In: Turk DC, Melzack R, editors. Handbook of Pain Assessment. 2nd ed. New York: Guilford Press; 2001:15–34. | ||
Jonsdottir T, Jonsdottir H, Lindal E, Oskarsson GK, Gunnarsdottir S. Predictors for chronic pain-related health care utilization: a cross-sectional nationwide study in Iceland. Health Expect. 2015;18(6):2704–2719. | ||
Katz J, Seltzer Z. Transition from acute to chronic postsurgical pain: risk factors and protective factors. Expert Rev Neurother. 2009;9(5):723–744. | ||
Lamé IE, Peters ML, Vlaeyen JW, Kleef M, Patijn J. Quality of life in chronic pain is more associated with beliefs about pain, than with pain intensity. Eur J Pain. 2005;9(1):15–24. | ||
Langley PC. The societal burden of pain in Germany: health-related quality-of-life, health status and direct medical costs. J Med Econ. 2012;15(6):1201–1215. | ||
Leong VW, Guerriere DN, Croxford R, Coyte PC. The Magnitude, Share and Determinants of Private Costs Incurred by Clients (and Their Caregivers) of In-home Publicly Financed Care. Healthc Policy. 2007;3(1):e141–159. | ||
Lépine JP, Godchau M, Brun P, Lempérière T. Evaluation of anxiety and depression among patients hospitalized on an internal medicine service. Ann Med Psychol. 1985;143(2):175–189. | ||
Makris UE, Higashi RT, Marks EG, et al. Ageism, negative attitudes, and competing co-morbidities – why older adults may not seek care for restricting back pain: a qualitative study. BMC Geriatr. 2015;15:39. | ||
Ministry of Health and Long-Term Care Ontario [webpage on the Internet]. OHIP Schedule of Benefits and Fees; 2016 [cited April 3, 2017]. Available from: www.health.gov.on.ca/en/pro/programs/ohip/sob. Accessed October 2, 2018. | ||
Ministry of Health and Long-Term Care Ontario [webpage on the Internet]. Health Data Branch Web Portal; 2017 [cited April 14, 2017]. Available from: https://hsim.health.gov.on.ca/hdbportal/. | ||
Murphy BM, Elliott PC, Higgins RO, et al. Anxiety and depression after coronary artery bypass graft surgery: most get better, some get worse. Eur J Cardiovasc Prev Rehabil. 2008;15(4):434–440. | ||
Murphy BM, Elliott PC, Worcester MU, et al. Trajectories and predictors of anxiety and depression in women during the 12 months following an acute cardiac event. Br J Health Psychol. 2008;13(Pt 1):135–153. | ||
Pagé MG, Watt-Watson J, Choinière M. Do depression and anxiety profiles over time predict persistent post-surgical pain? A study in cardiac surgery patients. Eur J Pain. 2017;21(6):965–976. | ||
Parsons B, Schaefer C, Mann R, et al. Economic and humanistic burden of post-trauma and post-surgical neuropathic pain among adults in the United States. J Pain Res. 2013;6:459–469. | ||
Pérez C, Navarro A, Saldaña MT, Wilson K, Rejas J. Modeling the predictive value of pain intensity on costs and resources utilization in patients with peripheral neuropathic pain. Clin J Pain. 2015;31(3):273–279. | ||
Pollard CA. Preliminary validity study of the pain disability index. Percept Mot Skills. 1984;59(3):974. | ||
Raftery MN, Ryan P, Normand C, Murphy AW, de La Harpe D, McGuire BE. The economic cost of chronic noncancer pain in Ireland: results from the PRIME study, part 2. J Pain. 2012;13(2):139–145. | ||
Rice DP, MacKenzie J, Jones AS, et al. Cost of injury in the United States: a report to Congress. San Francisco: Institute for Health and Aging, University of California, Injury Prevention Centre, Johns Hopkins University; 1989. | ||
Schug SA, Pogatzki-Zahn EM. Chronic Pain after Surgery or Injury. Pain. 2011;XIX(1):1–5. | ||
Snaith RP, Zigmond AS. The Hospital Anxiety and Depression Scale - Manual. Windsor, UK: NFER-Nelson; 1994. | ||
Statistics Canada [webpage on the Internet]. Average hourly wages of employees by selected characteristics and occupation, unadjusted data, by province (monthly) (Canada); 2017 [cited February 10, 2017]. Available from: http://www.statcan.gc.ca/tables-tableaux/sum-som/l01/cst01/labr69a-eng.htm. Accessed October 2, 2018. | ||
Statistics Canada [webpage on the Internet]. Consumer Price Index, historical summary (1997 to 2016); 2017 [cited September 29, 2017]. Available from: http://www.statcan.gc.ca/tables-tableaux/sum-som/l01/cst01/econ46a-eng.htm. Accessed August 1, 2018. | ||
Stevens B, Guerriere D, McKeever P, et al. Economics of home vs. hospital breastfeeding support for newborns. J Adv Nurs. 2006;53(2):233–243. | ||
Sullivan MJL, Bishop SR, Pivik J. The Pain Catastrophizing Scale: Development and validation. Psychol Assess. 1995;7(4):524–532. | ||
The Lancet Commission on Global Surgery [webpage on the Internet]. Number of surgical procedures; 2017 [cited October 26, 2017]. Available from: https://data.worldbank.org/indicator/SH.SGR.PROC.P5?locations=CA. Accessed October 2, 2018. | ||
Thielke S, Sale J, Reid MC. Aging: are these 4 pain myths complicating care? J Fam Pract. 2012;61(11):666–670. | ||
Torgerson DJ, Donaldson C, Reid DM. Private versus social opportunity cost of time: valuing time in the demand for health care. Health Econ. 1994;3(3):149–155. | ||
Verstappen SM, Verkleij H, Bijlsma JW, et al. Determinants of direct costs in Dutch rheumatoid arthritis patients. Ann Rheum Dis. 2004;63(7):817–824. | ||
Ware J, Kosinski M, Keller SD. A 12-Item Short-Form Health Survey: construction of scales and preliminary tests of reliability and validity. Med Care. 1996;34(3):220–233. | ||
Ware JE, Kosinski M, Turner-Bowker DM, Gandek B. How to Score Version 2 of the SF-12 Health Survey; 2004, Boston, MA: QualityMetric Inc., Lincoln: RI and Health Assessment Lab. | ||
Weir S, Samnaliev M, Kuo TC, et al. The incidence and healthcare costs of persistent postoperative pain following lumbar spine surgery in the UK: a cohort study using the Clinical Practice Research Datalink (CPRD) and Hospital Episode Statistics (HES). BMJ Open. 2017;7(9):e017585. | ||
Werner MU, Kongsgaard UE. I. Defining persistent post-surgical pain: is an update required? Br J Anaesth. 2014;113(1):1–4. | ||
White IR, Royston P, Wood AM. Multiple imputation using chained equations: Issues and guidance for practice. Stat Med. 2011;30(4):377–399. | ||
Zigmond AS, Snaith RP. The hospital anxiety and depression scale. Acta Psychiatr Scand. 1983;67(6):361–370. |
Supplementary materials
Description of the multiple imputation sensitivity analysis
Given the modest sample size, the variables at 6, 12 and 24 months were imputed separately. Moreover, some categories of categorical variables (ie, participants’ work status) and cost categories (ie, total public costs, total out-of-pocket costs, total private insurance costs and total costs) were collapsed to obtain convergence of the imputation models. For each imputation model, only the data for subjects reporting any pain were considered.
The variables included in the imputation models were participants’ sex, age, work status (full- or part-time job, retired, other), education, pain intensity in the past 7 days, QOL physical summary, QOL mental summary, PDI score, PCS score, depression, anxiety, total public costs, total out of pocket expenses, total private insurance costs, total time cost, and resource utilization at prior visit (no, yes, not applicable – only for the 12- and 24-month models). Work status was imputed using a multinomial logistic regression model with a generalized logit link; education was imputed using an ordinal logistic regression model with a cumulative logit link; all continuous variables were imputed using predictive mean matching based on a linear regression model; and resource utilization at prior visit was imputed using a multinomial logistic regression model with a generalized logit link and performing data augmentation. This data augmentation adds a few pseudo observations to the data in a manner that biases associations towards the null and improves the stability of the estimation when data are sparse. One hundred imputed datasets were produced for each model.
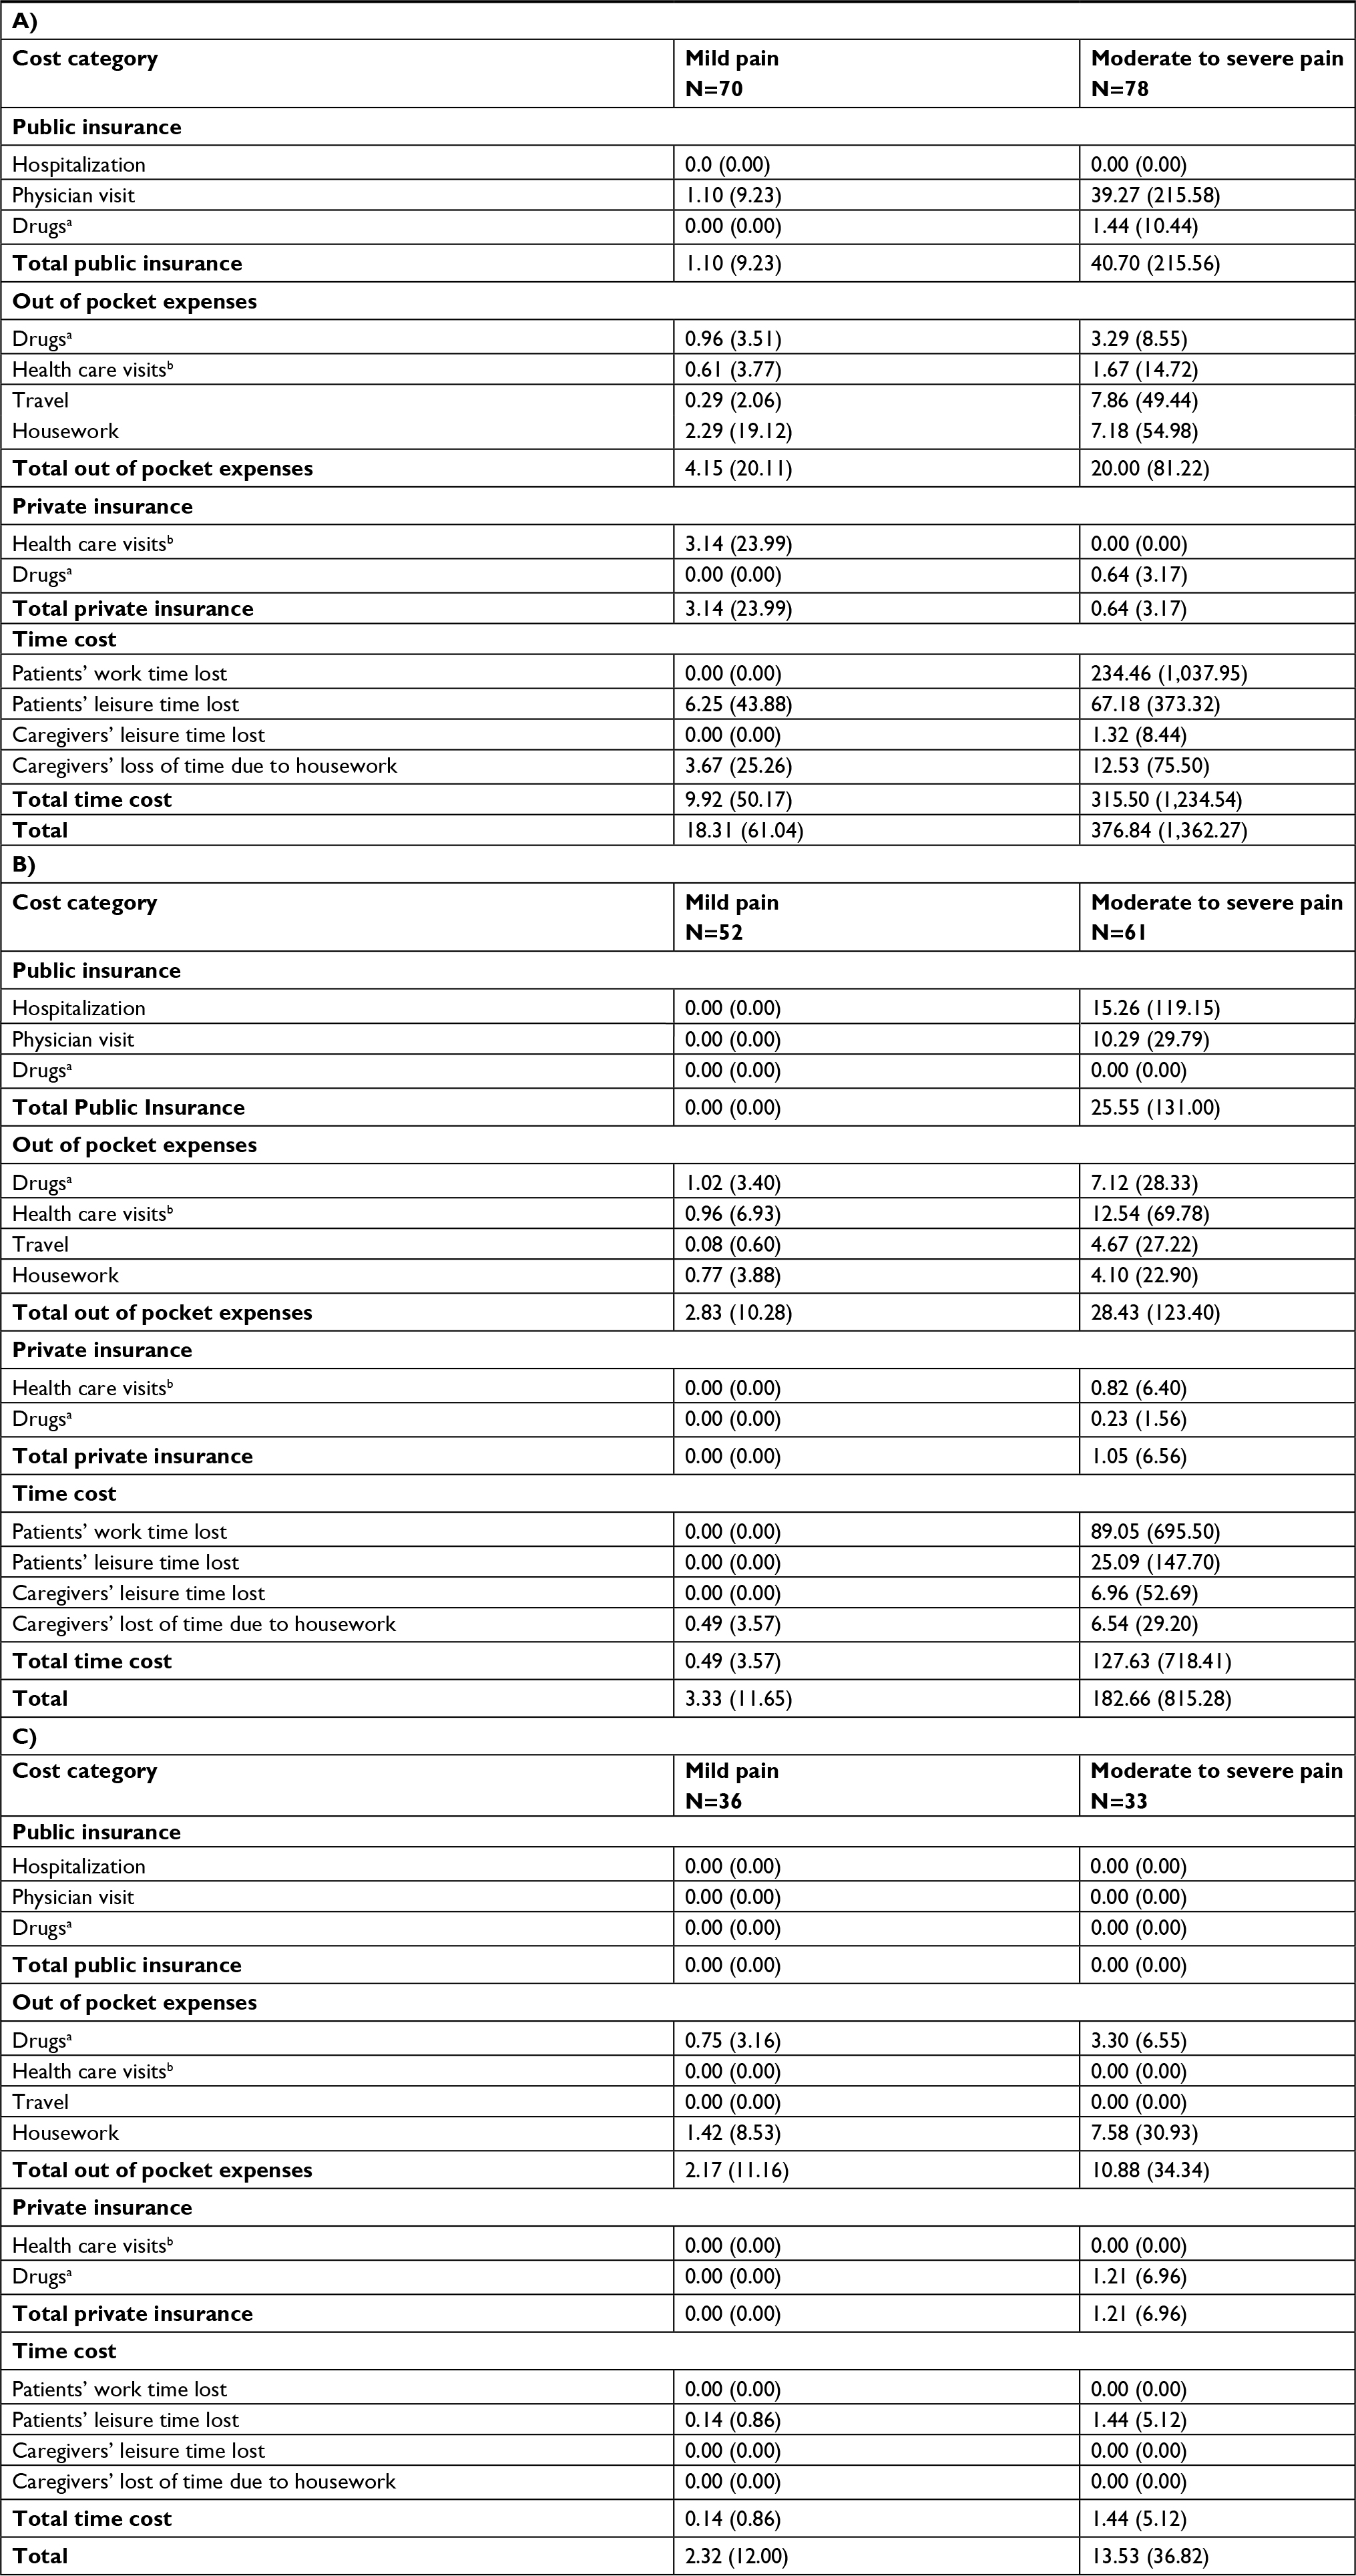 | Table S1 Average monetary value of resource utilized and time lost due to chronic post-surgical pain at the (A) 6-, (B) 12- and (C) 24-month follow-up, stratified by pain intensity Notes: All results are in Canadian dollars and are presented as mean (SD). aDrugs utilized by patients could be covered by public or private insurance or could be paid for directly by the patient depending on insurance plan and coverage. bIncludes all non-physician health care professionals as well as physicians practicing outside of the publicly insured health care system. Costs were stratified based on patients’ insurance plans and coverage. |
 | Table S2 Proportion of individuals utilizing medical resources or reporting time losses at the (A) 6-, (B) 12- and (C) 24-month follow-up obtained through multiple imputations Notes: All results are presented as N (%). Resources identified within the table were utilized in the last 30 days. |
 | Table S3 Per patient average cost of resource utilized and time lost due to pain at the 6, 12 and 24 month follow-up obtained through multiple imputations Notes: All results are in Canadian dollars and are presented as mean (SD) and total sum across all individuals. |
 | Table S4 Per patient average cost of medical resource utilized and time lost due to pain at the (A) 6, (B) 12 and (C) 24 month follow-up, stratified by pain level and obtained through multiple imputation Notes: All results are in Canadian dollars and are presented as mean (SD) and total sum across all individuals. |
 | Table S5 Results obtained through multiple imputations for the two-part models for the probability of utilizing resources and the monetary value of the utilized resource at the (A) 6, (B) 12 and (C) 24 month follow-up Notes: aPer point increment on the pain catastrophizing scale; breflects individuals who did not report any pain at 12 months in whom no resource could therefore be utilized. |
 © 2018 The Author(s). This work is published and licensed by Dove Medical Press Limited. The full terms of this license are available at https://www.dovepress.com/terms.php and incorporate the Creative Commons Attribution - Non Commercial (unported, v3.0) License.
By accessing the work you hereby accept the Terms. Non-commercial uses of the work are permitted without any further permission from Dove Medical Press Limited, provided the work is properly attributed. For permission for commercial use of this work, please see paragraphs 4.2 and 5 of our Terms.
© 2018 The Author(s). This work is published and licensed by Dove Medical Press Limited. The full terms of this license are available at https://www.dovepress.com/terms.php and incorporate the Creative Commons Attribution - Non Commercial (unported, v3.0) License.
By accessing the work you hereby accept the Terms. Non-commercial uses of the work are permitted without any further permission from Dove Medical Press Limited, provided the work is properly attributed. For permission for commercial use of this work, please see paragraphs 4.2 and 5 of our Terms.