")
Back to Journals » Diabetes, Metabolic Syndrome and Obesity » Volume 14
Joint Predictors of Hypertension and Type 2 Diabetes Among Adults Under Treatment in Amhara Region (North-Western Ethiopia)
Authors Tegegne AS
Received 6 March 2021
Accepted for publication 7 May 2021
Published 1 June 2021 Volume 2021:14 Pages 2453—2463
DOI https://doi.org/10.2147/DMSO.S309925
Checked for plagiarism Yes
Review by Single anonymous peer review
Peer reviewer comments 2
Editor who approved publication: Dr Konstantinos Tziomalos
Awoke Seyoum Tegegne
Department of Statistics, Bahir Dar University, Bahir Dar, Ethiopia
Correspondence: Awoke Seyoum Tegegne
Department of Statistics, Bahir Dar University, Bahir Dar, Ethiopia
Tel +251918779451
Email [email protected]
Background: One of the chronic diseases, all over the world, due to its significant contribution to the existence of other health problems is hypertension. It is known that hypertensive patients exposed to diabetes and the reverse is also true. The objective of the current investigation was to identify joint risk factors for hypertension and type 2 diabetes for adults under treatment.
Methods: A random sample of 748 hypertensive and type 2 diabetic patients was selected. A retrospective longitudinal study was conducted with the selected patients who were receiving treatment for both hypertension and type 2 diabetes. A joint linear mixed-effect model was used for data analysis in this investigation.
Results: The current investigation revealed that age (β = 0.18, p-value = 0.04 for hypertension, β = 0.81, p-value = 0.02 for type 2 diabetes) and weight of patients (β = 0.52, p-value < 0.01 for hypertension, β = 0.32, p-value < 0.01 for type 2 diabetes) were positively and significantly associated with existence of hypertension and type 2 diabetes whereas visiting times (β = − 0.08, p-value = 0.04 for hypertension, β = − 0.38, p-value = 0.03 for type 2 diabetes) were negatively associated with the variables of interest. Similarly, patients who do not exercise, who smoke, and drink and patients with a family history of disease were positively associated with the existence of the variables of interest.
Conclusion: Hypertension and diabetes are highly correlated and one is the causes of the other. Hypertensive and diabetic patients should be aware that they should stop drinking alcohol and smoking and should attend properly to their medication as prescribed by health staff. They should also be advised to undertake physical exercise to reduce risks related to these two correlated diseases.
Keywords: joint modeling, longitudinal data analysis, hypertension, systolic, diastolic, type 2 diabetes, mixed model
Background
Hypertension and type 2 diabetes are the two general conditions that have the most significant impacts on the health care systems in both the developed and developing worlds.1 The existence of type 2 diabetes (the amount of fasting glucose concentration in the blood) is about 2.5 times more likely in hypertensive patients as compared to non-hypertensive patients.2 These two associated diseases often co-exist and lead to serious cardiovascular problems.2 Adults with hypertension are also exposed to stroke and serious heart disease.2 Effective strategies to prevent type 2 diabetes in people with hypertension are urgently needed, especially in countries with a high prevalence of hypertension.3
Hypertension is one of the sources of and risk factors for the progression of a number of diseases.4,5 Progression of hypertension is also associated with cardiac and vascular abnormalities. This further becomes harmful for other parts of the body like the heart, kidneys and other organs.1 The progress of hypertension forces patients to check whether or not they are experiencing systolic and diastolic blood pressure.5
A hypertensive and type 2 diabetic patient should visit a health institution frequently in order to follow up the progression of the two diseases.5 For hypertensive patients, the average systolic reading is higher than 140 mm Hg and the average diastolic reading is greater than 90 mm Hg.5 For such patients, the small blood vessels are mostly affected over time.3 These blood vessels become toughened and less elastic, which leads to further organ injuries.5 Therefore, maintaining normal blood pressure is a very important component of reducing the risk of heart attack, stroke or organ injuries.4
The existence of very low and very high readings indicates that a person has hypertension, which is related to other diseases such as coronary heart disease and type 2 diabetes.6 Socio-demographic and clinical predictors can affect the risk/severity of these two diseases.7
Having hypertension appears to increase the risk of having type 2 diabetes, and having type 2 diabetes increases the risk of hypertension. In addition, having one or both conditions increases the risk of various complications and decreases kidney function, progressing to dialysis, and problems with blood vessels in the eyes, leading to vision loss and peripheral vascular disease.7 Hence, type 2 diabetes has been associated with an increased risk of hypertension and vice versa. However, whether there is a bidirectional causal relationship between type 2 diabetes and hypertension remains to be determined.7
Previously, separate studies were conducted to identify factors influencing only systolic blood pressure (SBP) or diastolic blood pressure (DBP), which did not investigate the joint effect of these two longitudinal responses.1,2 Joint modeling of continuous or discrete responses with time to event is also commonly conducted for each response.8 However, the results obtained from such longitudinal and time to event studies regarding predictors are controversial.9,10 Joint modeling of the two longitudinal responses with fixed and random effects is more flexible in terms of identifying the association between them.11–13
Therefore, the objective of the current investigation was to identify joint predictors of longitudinal responses, namely, hypertension (systolic/diastolic) and type 2 diabetes, for patients under treatment at Felege Hiwot Teaching and Specialized Hospital, North-Western Ethiopia. To the best of the author’s knowledge, there is a scarcity of previous studies conducted to identify joint predictors of the two longitudinal and correlated outcomes in the study area.
Previous research recommends joint modeling of two longitudinal responses to provide more efficient inferences than separate analyses, given that the interest is drawing joint inferences about similar or different outcomes.14,15 It is also the author’s firm belief that the statistically significant interaction effects of the two outcomes obtained in the current investigation make a practical contribution to the health sector. The results obtained in the current investigation also give insights into complex and advanced theories related to one of the critical problems facing the life sciences and public health practitioners. Hence, the interaction effect of two or more covariates/predictors helps to identify the bidirectional effect of the two longitudinal responses.
Methods and Materials
Study Design
A retrospective cohort study design was conducted on 748 hypertensive and diabetic type 2 patients at Felege Hiwot Specialized and Teaching Hospital, North-West Ethiopia.
Sources of Data
The data used for the current investigation were secondary sources obtained at Felege Hiwot Specialized and Teaching Hospital with the purpose of following up/checking blood pressure and fasting glucose concentration in the blood.
Sample Size and Sampling Procedure
From the total of 2004 hypertensive and diabetic patients who started their treatment in the hospital from September 2015 to June 2017, 748 were selected randomly using a residence-based stratified random sampling technique. The data were recorded at every follow up by the health staff, retrospectively, using the format developed by the Ministry of Health. Samples of data and associated variables were collected in the medical chart of each selected patient by the health staff, following orientation about the variables included in the current investigation.
Data Collection Tools and Procedures
The available information was first observed and discussed with health care service providers from the hospital. Data were extracted using a format developed by the investigator in consultation with health service providers. Patients' charts were retrieved using their registration card numbers found in the hospital's electronic database.
Quality of Data
The quality of the data was controlled by data controllers from the hospital as well as from the regional health research center who had received intensive training from the Ministry of Health for these and other purposes. The data extraction tools and variables included in the analysis were pre-tested for consistency of understanding, review of tools and completeness of data items on 45 random charts. Based on the pilot data results, the necessary amendments were made on the final data extraction format. The retrieval process was closely monitored by the principal investigator throughout the data collection period. Both predictor and response variables were checked regularly and any problem traced was immediately communicated to data collectors for correction.
Measurements
The diagnosis of type 2 diabetes was conducted by the endocrinologists in the hospital according to fasting venous blood glucose concentration (tested with the Glucose Oxidase Method) and was leveled based on the 1999 World Health Organization criteria.8 The hypertension reading was also tested and recorded by qualified health staff at each patient visit.
Inclusion Criterion
Both hypertensive and diabetic type 2 adult patients followed up between September 2015 and August 2017, with a minimum of three follow ups, were eligible for this study. A minimum of three visits was insisted upon to ensure the validity of results inferred from the whole patient cohort based on the information obtained in selected samples.
Variables Under Current Investigation
The hypertension reading and amount of fasting glucose concentration in the blood of a patient measured repeatedly at each follow up visit were considered response variables. Age in years, weight in kg, smoking status (yes, no), drinking status (yes, no), meat use (never, rarely, frequently), use of vegetables (never, rarely, frequently), physical exercise (never, rarely, frequently), residence area (rural, urban), sex (male, female), family disease history for hypertension or type 2 diabetes (yes, no), follow up visits (1, 2), marital status (living with partner, living without partner), level of education (illiterate, primary, secondary and above), and chewing chat (yes, no) were considered independent/predictor variables.
Data Analysis and Parameter Estimation
SAS software version 9.4 was used for data analysis. The general linear mixed-effect model, which consists of fixed and random components, was used for data analysis. The random components in the data analysis describe how the subject-specific profiles deviate from the average profile for the two outcomes. The joint modeling of the two response variables was used to detect the common risk factors of the variables of interest. Both the fixed and random components of the model were selected using Akaike Information Criteria (AIC) and Bayesian Information Criteria (BIC) considering the least is the best.
In the current investigation, model building was started from a single covariate analysis approach. To do this, first, a single covariate analysis was conducted to detect potentially significant variables in the multicovariate model. The normality assumption for the current investigation was also tested and the distribution satisfied the assumption under consideration. In order to fit the joint model of the two response variables, namely, hypertension and type 2 diabetes, linear mixed effect models were considered separately for parameter estimation of marginal models. Then, the conditional random effects model (combining the separate models for hypertension and type 2 diabetes) was developed. Finally, a joint multivariate distribution of random effects of the variables of interest was conducted. Parameter estimation of hypertension and type 2 diabetes considering hypertension as a linear predictor was constructed.
Results
The baseline characteristics of patients are shown in Table 1. It shows that 362 patients (44.4%) were female, 225 (30.1%) were living in a rural area and 236 (31.6%) were living without a partner. Among the patients, 145 (19.4%) were smokers and 215 (28.7%) were chewing chat. About 327 (43.7%) of the respondents were drinking alcohol. Regarding physical exercise, 252 (33.7%) did none at all. Table 1 also indicates that about 693 patients (92.6%) frequently eat meat. Of patients, 503 (67.2%) had a family history of one of the two diseases.
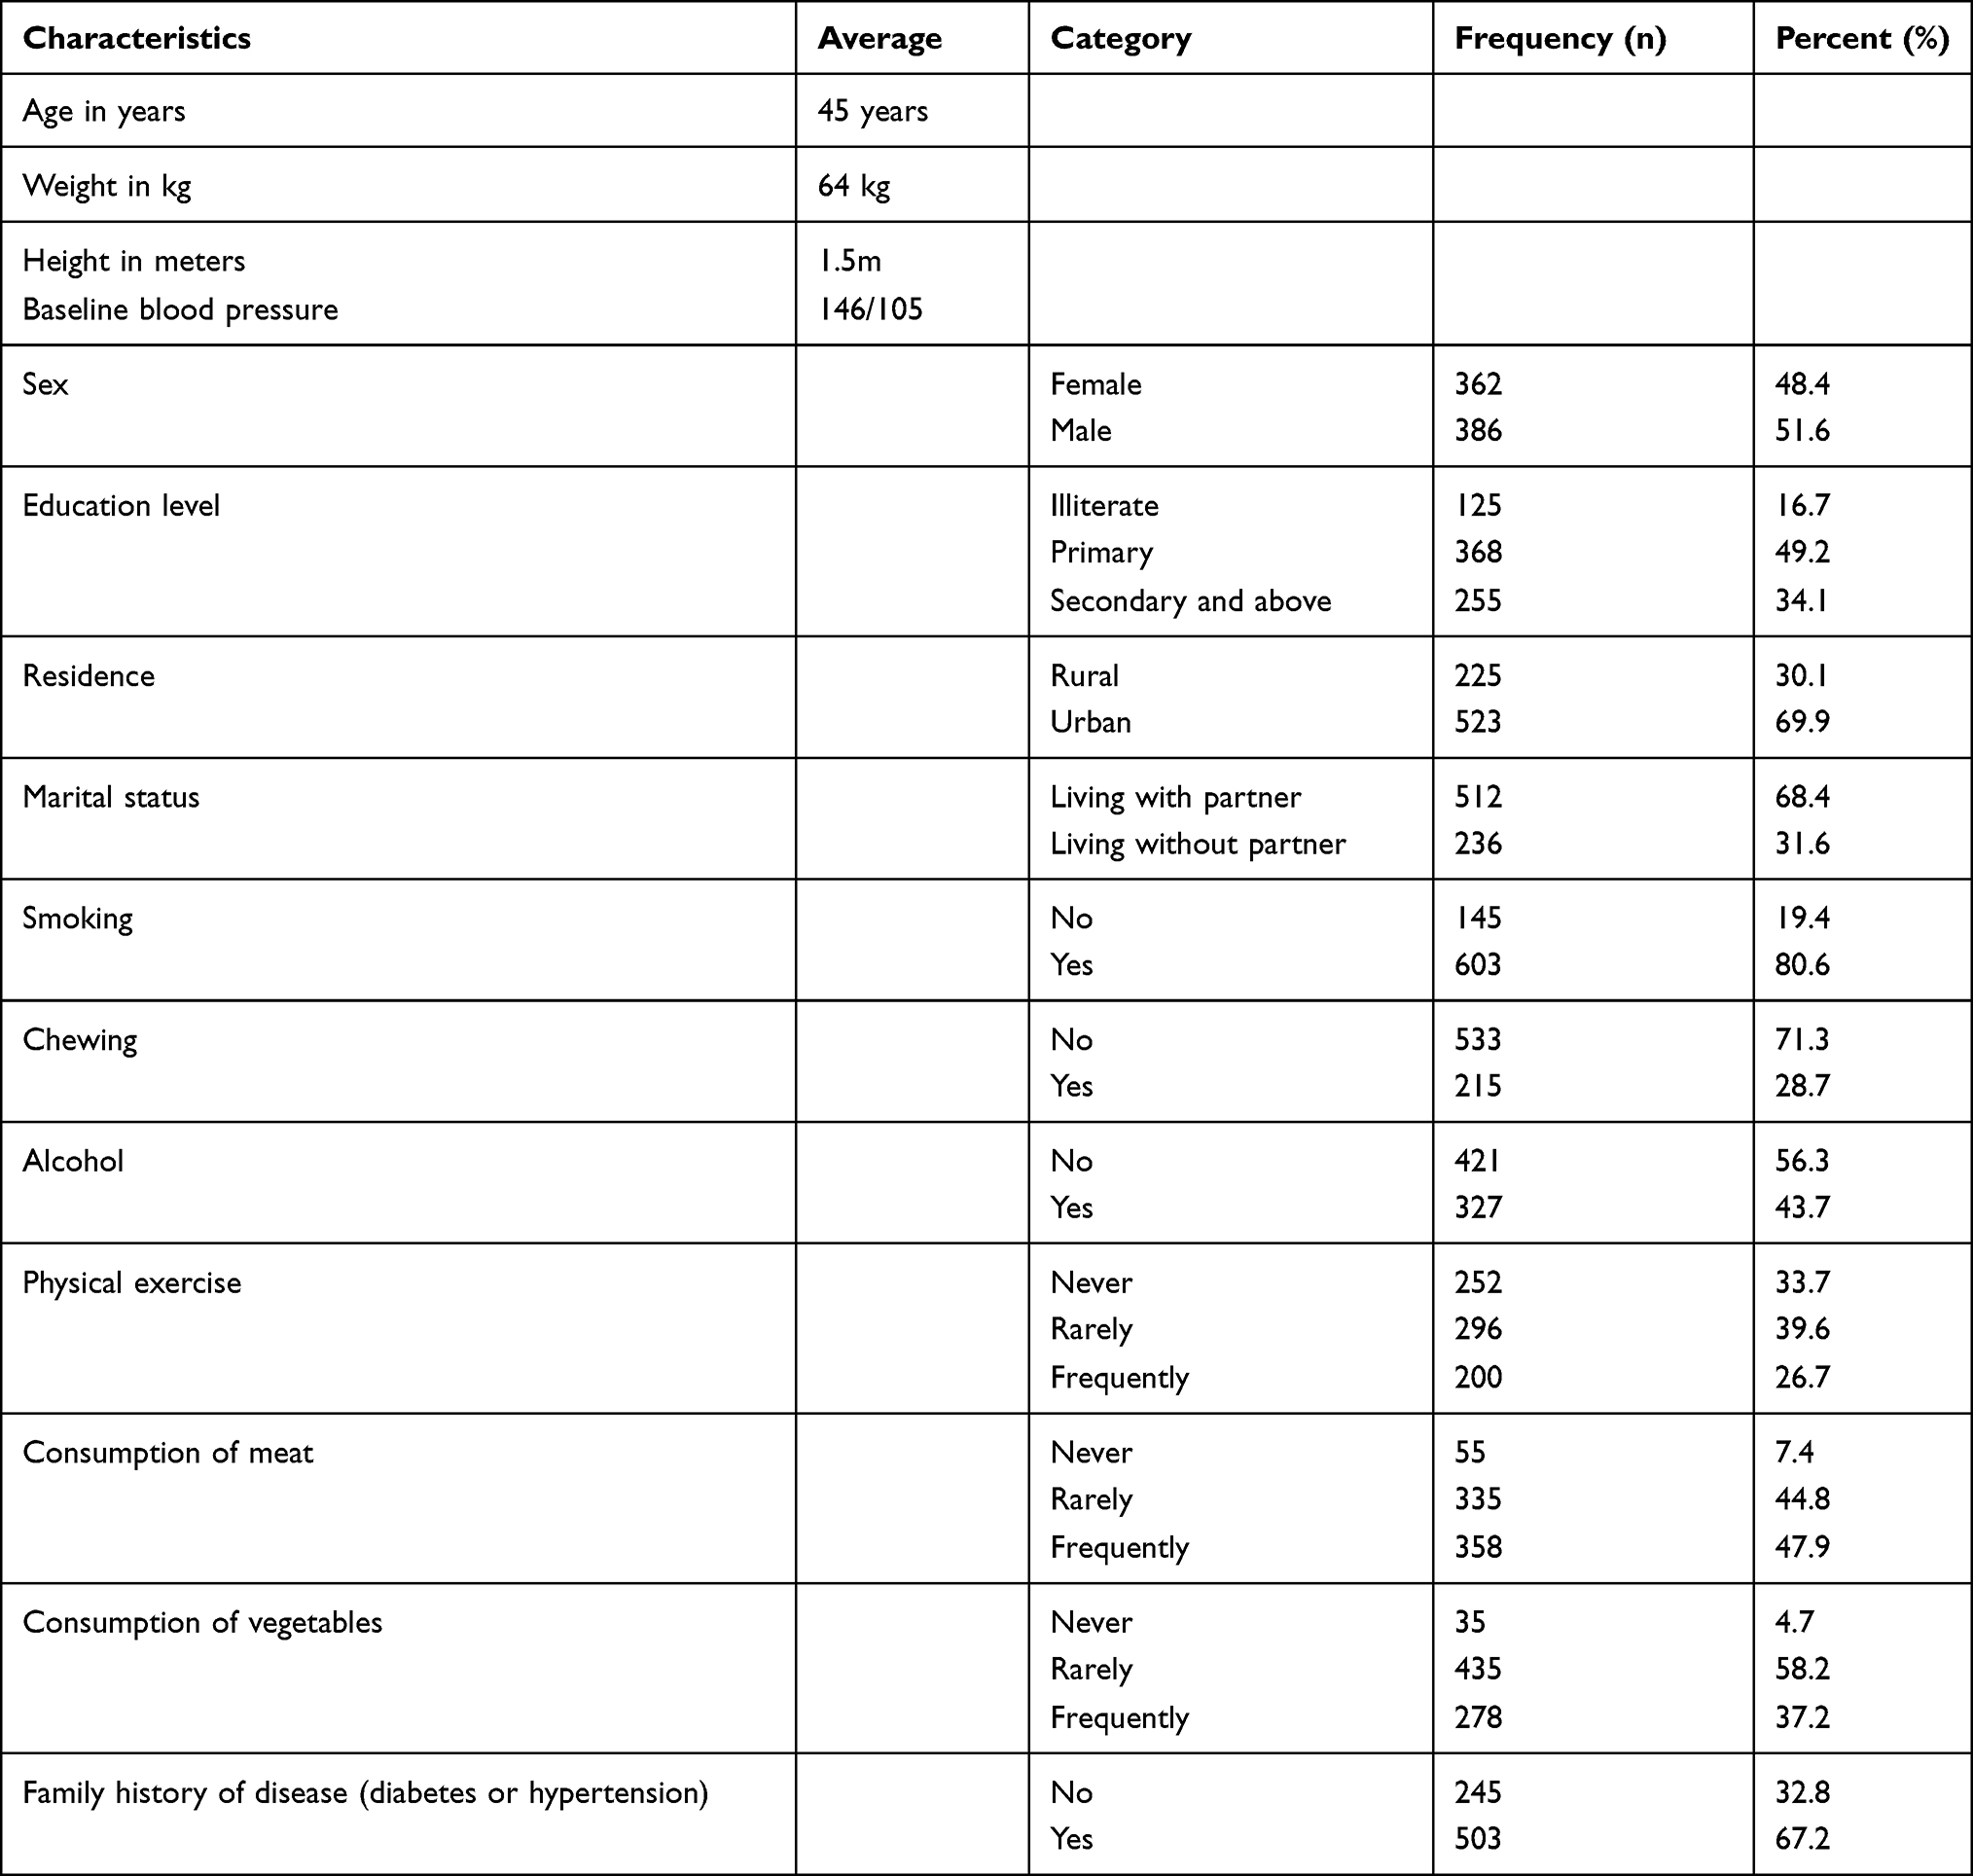 |
Table 1 Baseline Demographic and Clinical Characteristics of Hypertension and Diabetes Patients (n = 748) |
As it indicated in Table 1, continuous predictors were also recorded. The average age of patients was 45 years, with a standard deviation of 3 years; average weight of patients was 64 kg, with a standard deviation of 3.7 kg and average height of patients was 1.5 meters, with a standard deviation of 1.12 meters. Hence, the average BMI for all patients selected from the hospital was 28.44 kg/m2, with a standard deviation of 3.4 kg/m2, which indicates that their body weight was not proportional with their height. Table 1 indicates that the average hypertension value was 146/95mmHg, with a standard deviation of 4 mm HG and the average fasting glucose concentration was 132mg/dL, with a standard deviation of 3.5 mg/dL.
Among the random effects, fixed effect + random intercept and random slope had the smallest AIC and BIC; hence, it has been selected as a random effect and included in the current investigation.
Table 2 shows the separate parameter estimations; Table 3 shows the joint multivariate distribution of random effects of the variables of interest; and Table 4 indicates parameter estimations of hypertension and type 2 diabetes, considering hypertension as a linear predictor.
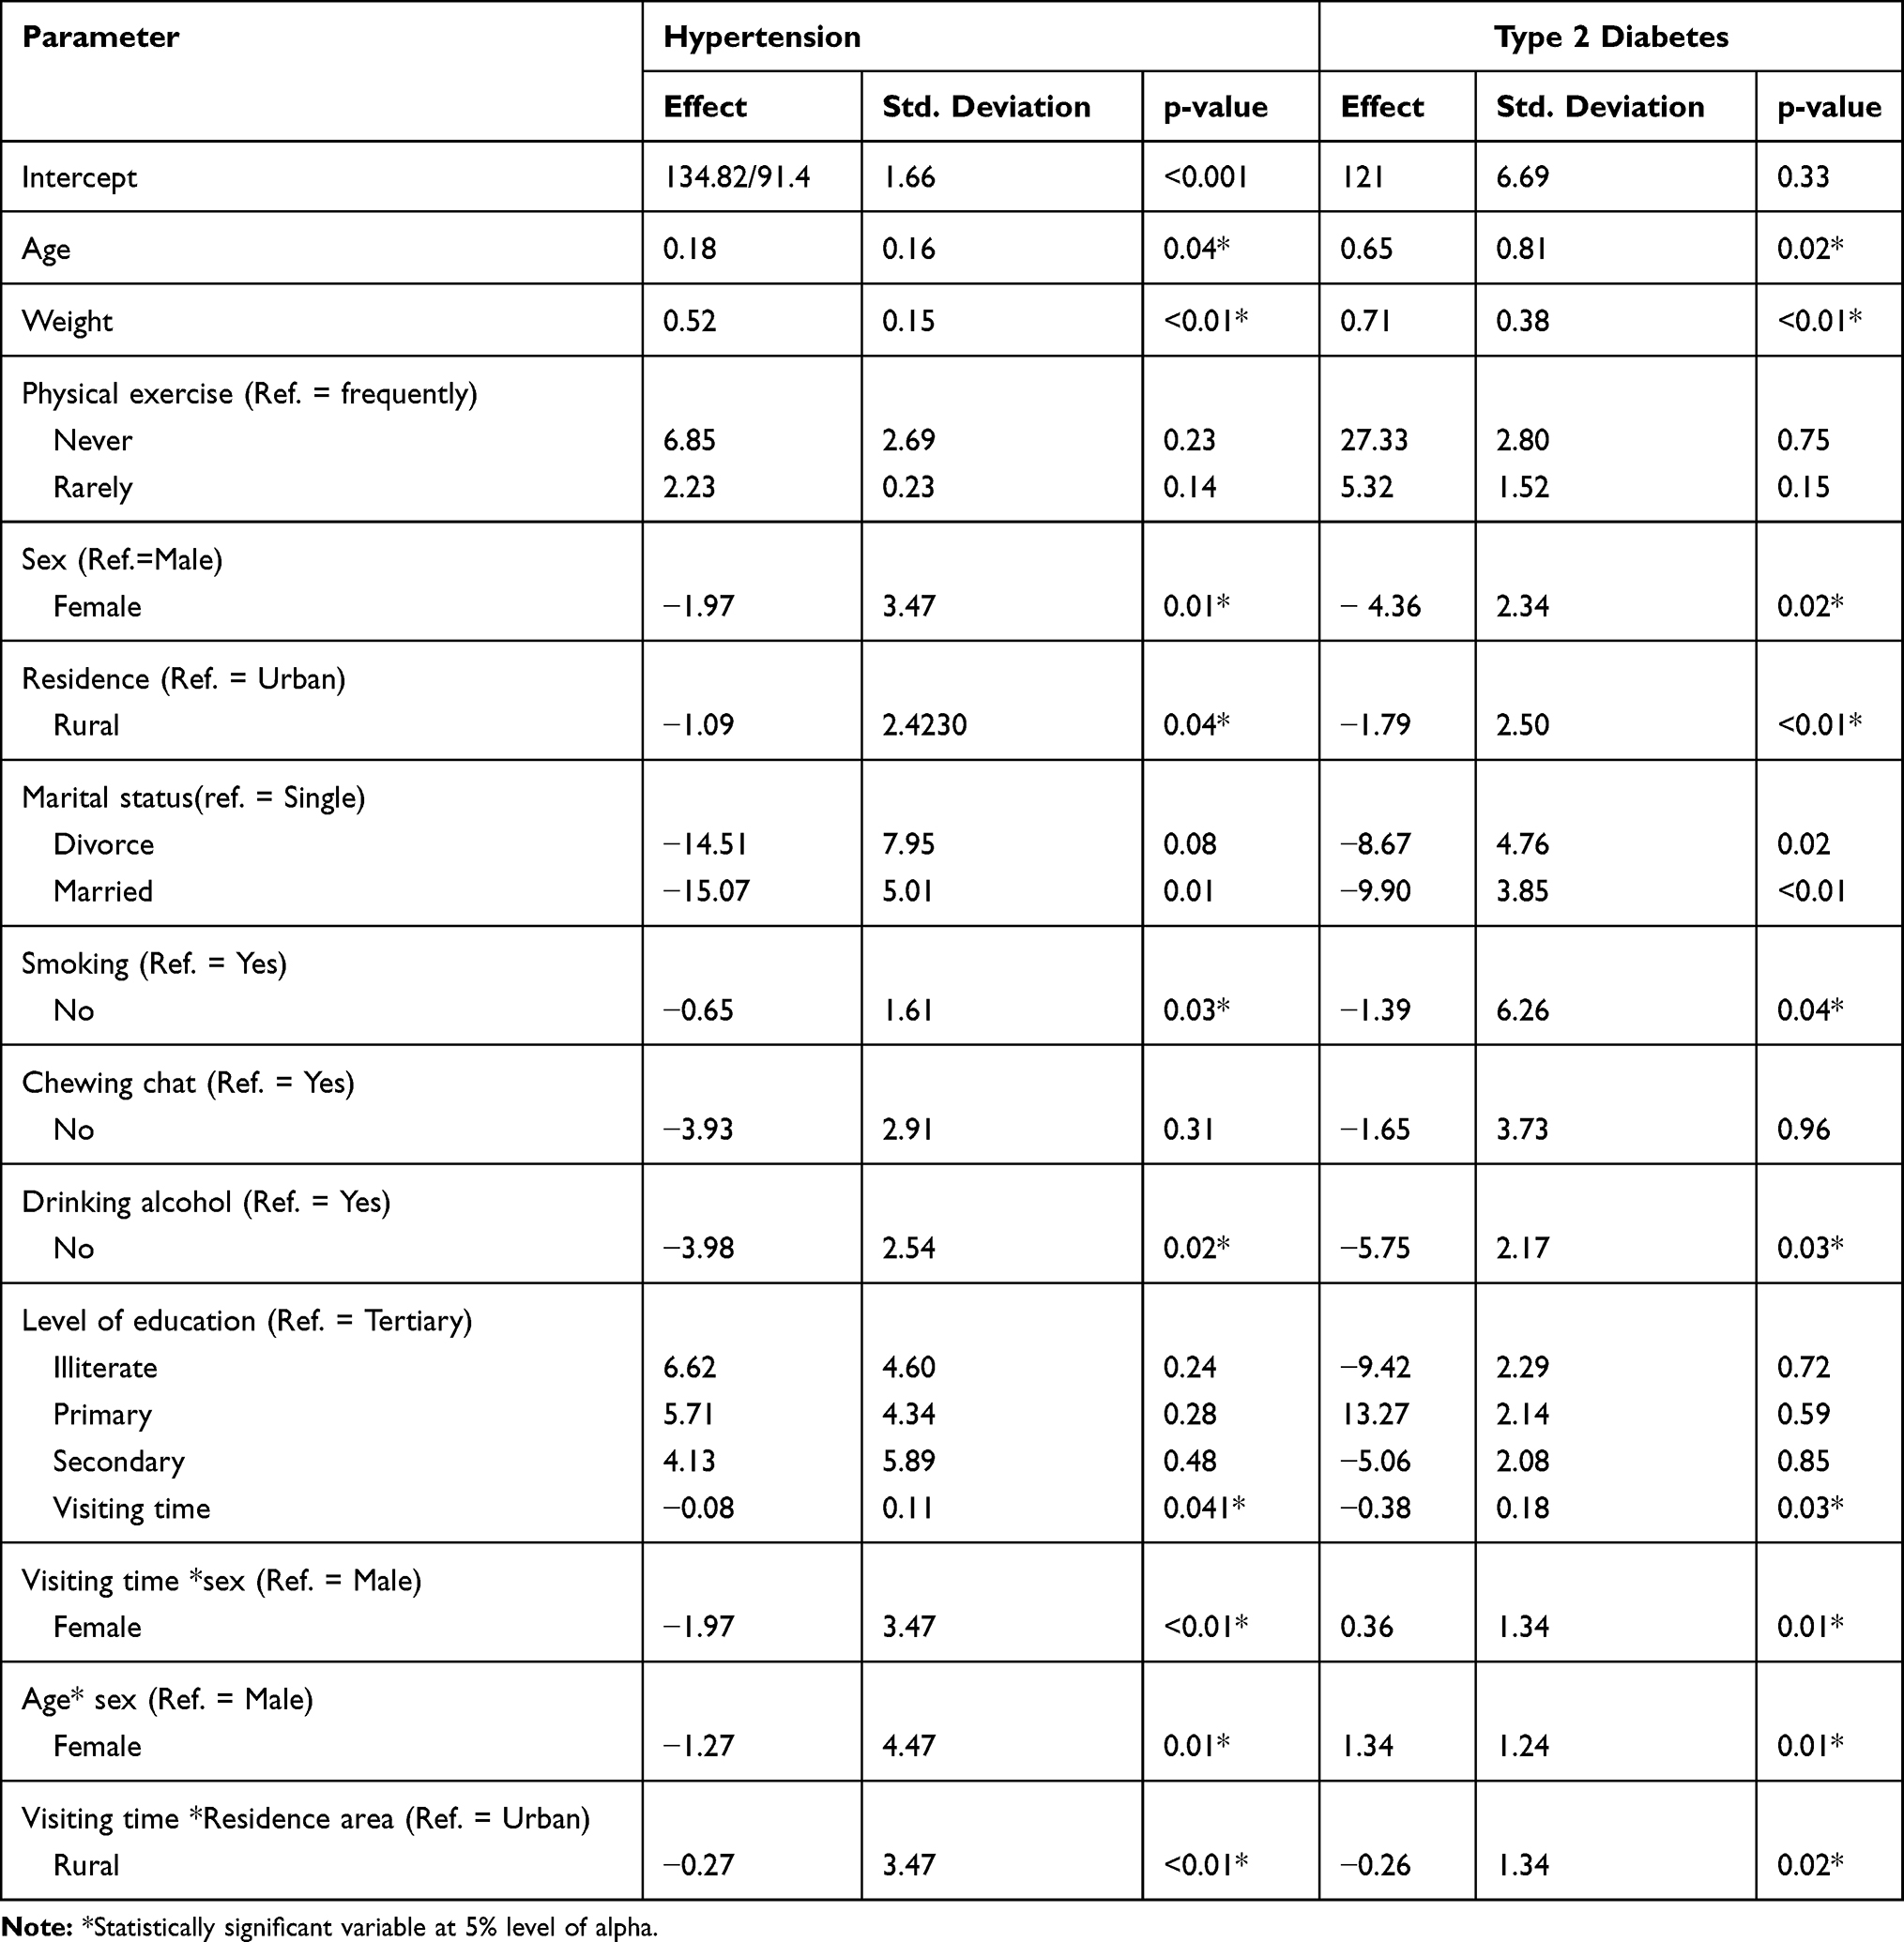 |
Table 2 Parameter Estimates and Corresponding Standard Errors for Univariate Data Analysis of Hypertension and Type 2 Diabetes |
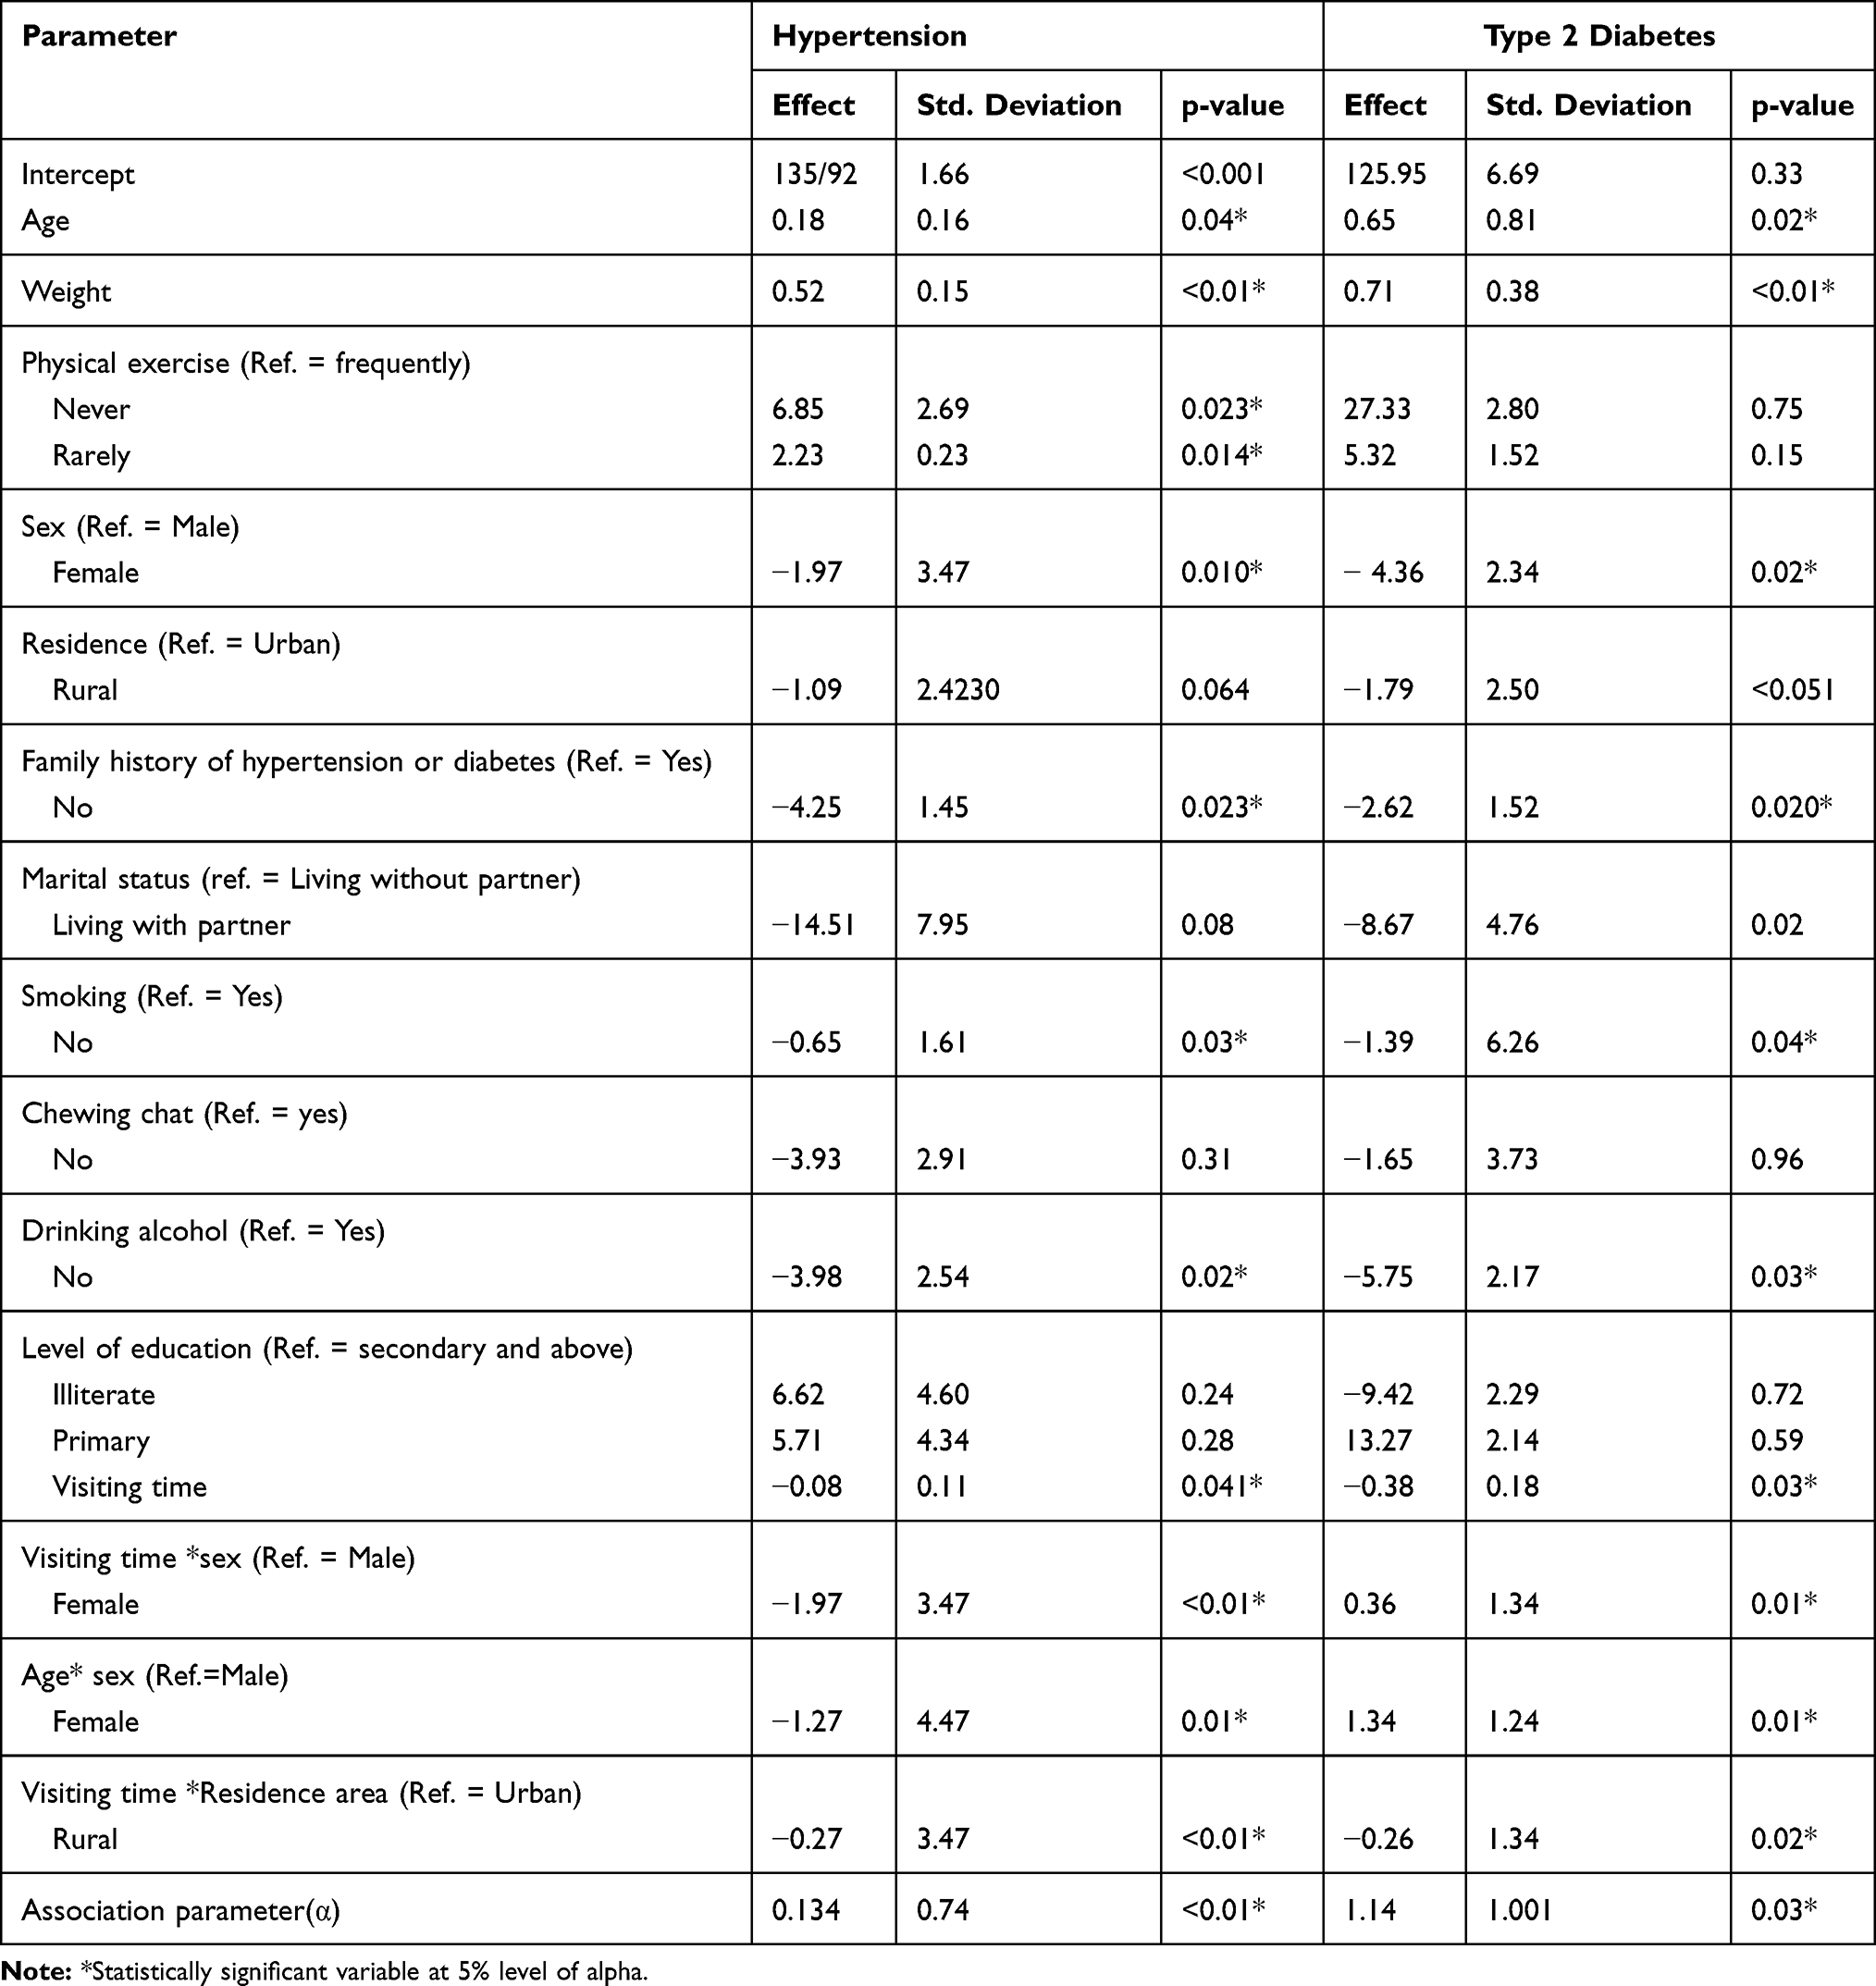 |
Table 3 Parameter Estimates and Corresponding Standard Errors for Conditional Independence Random Intercept Model with Hypertension and Type 2 Diabetes Data |
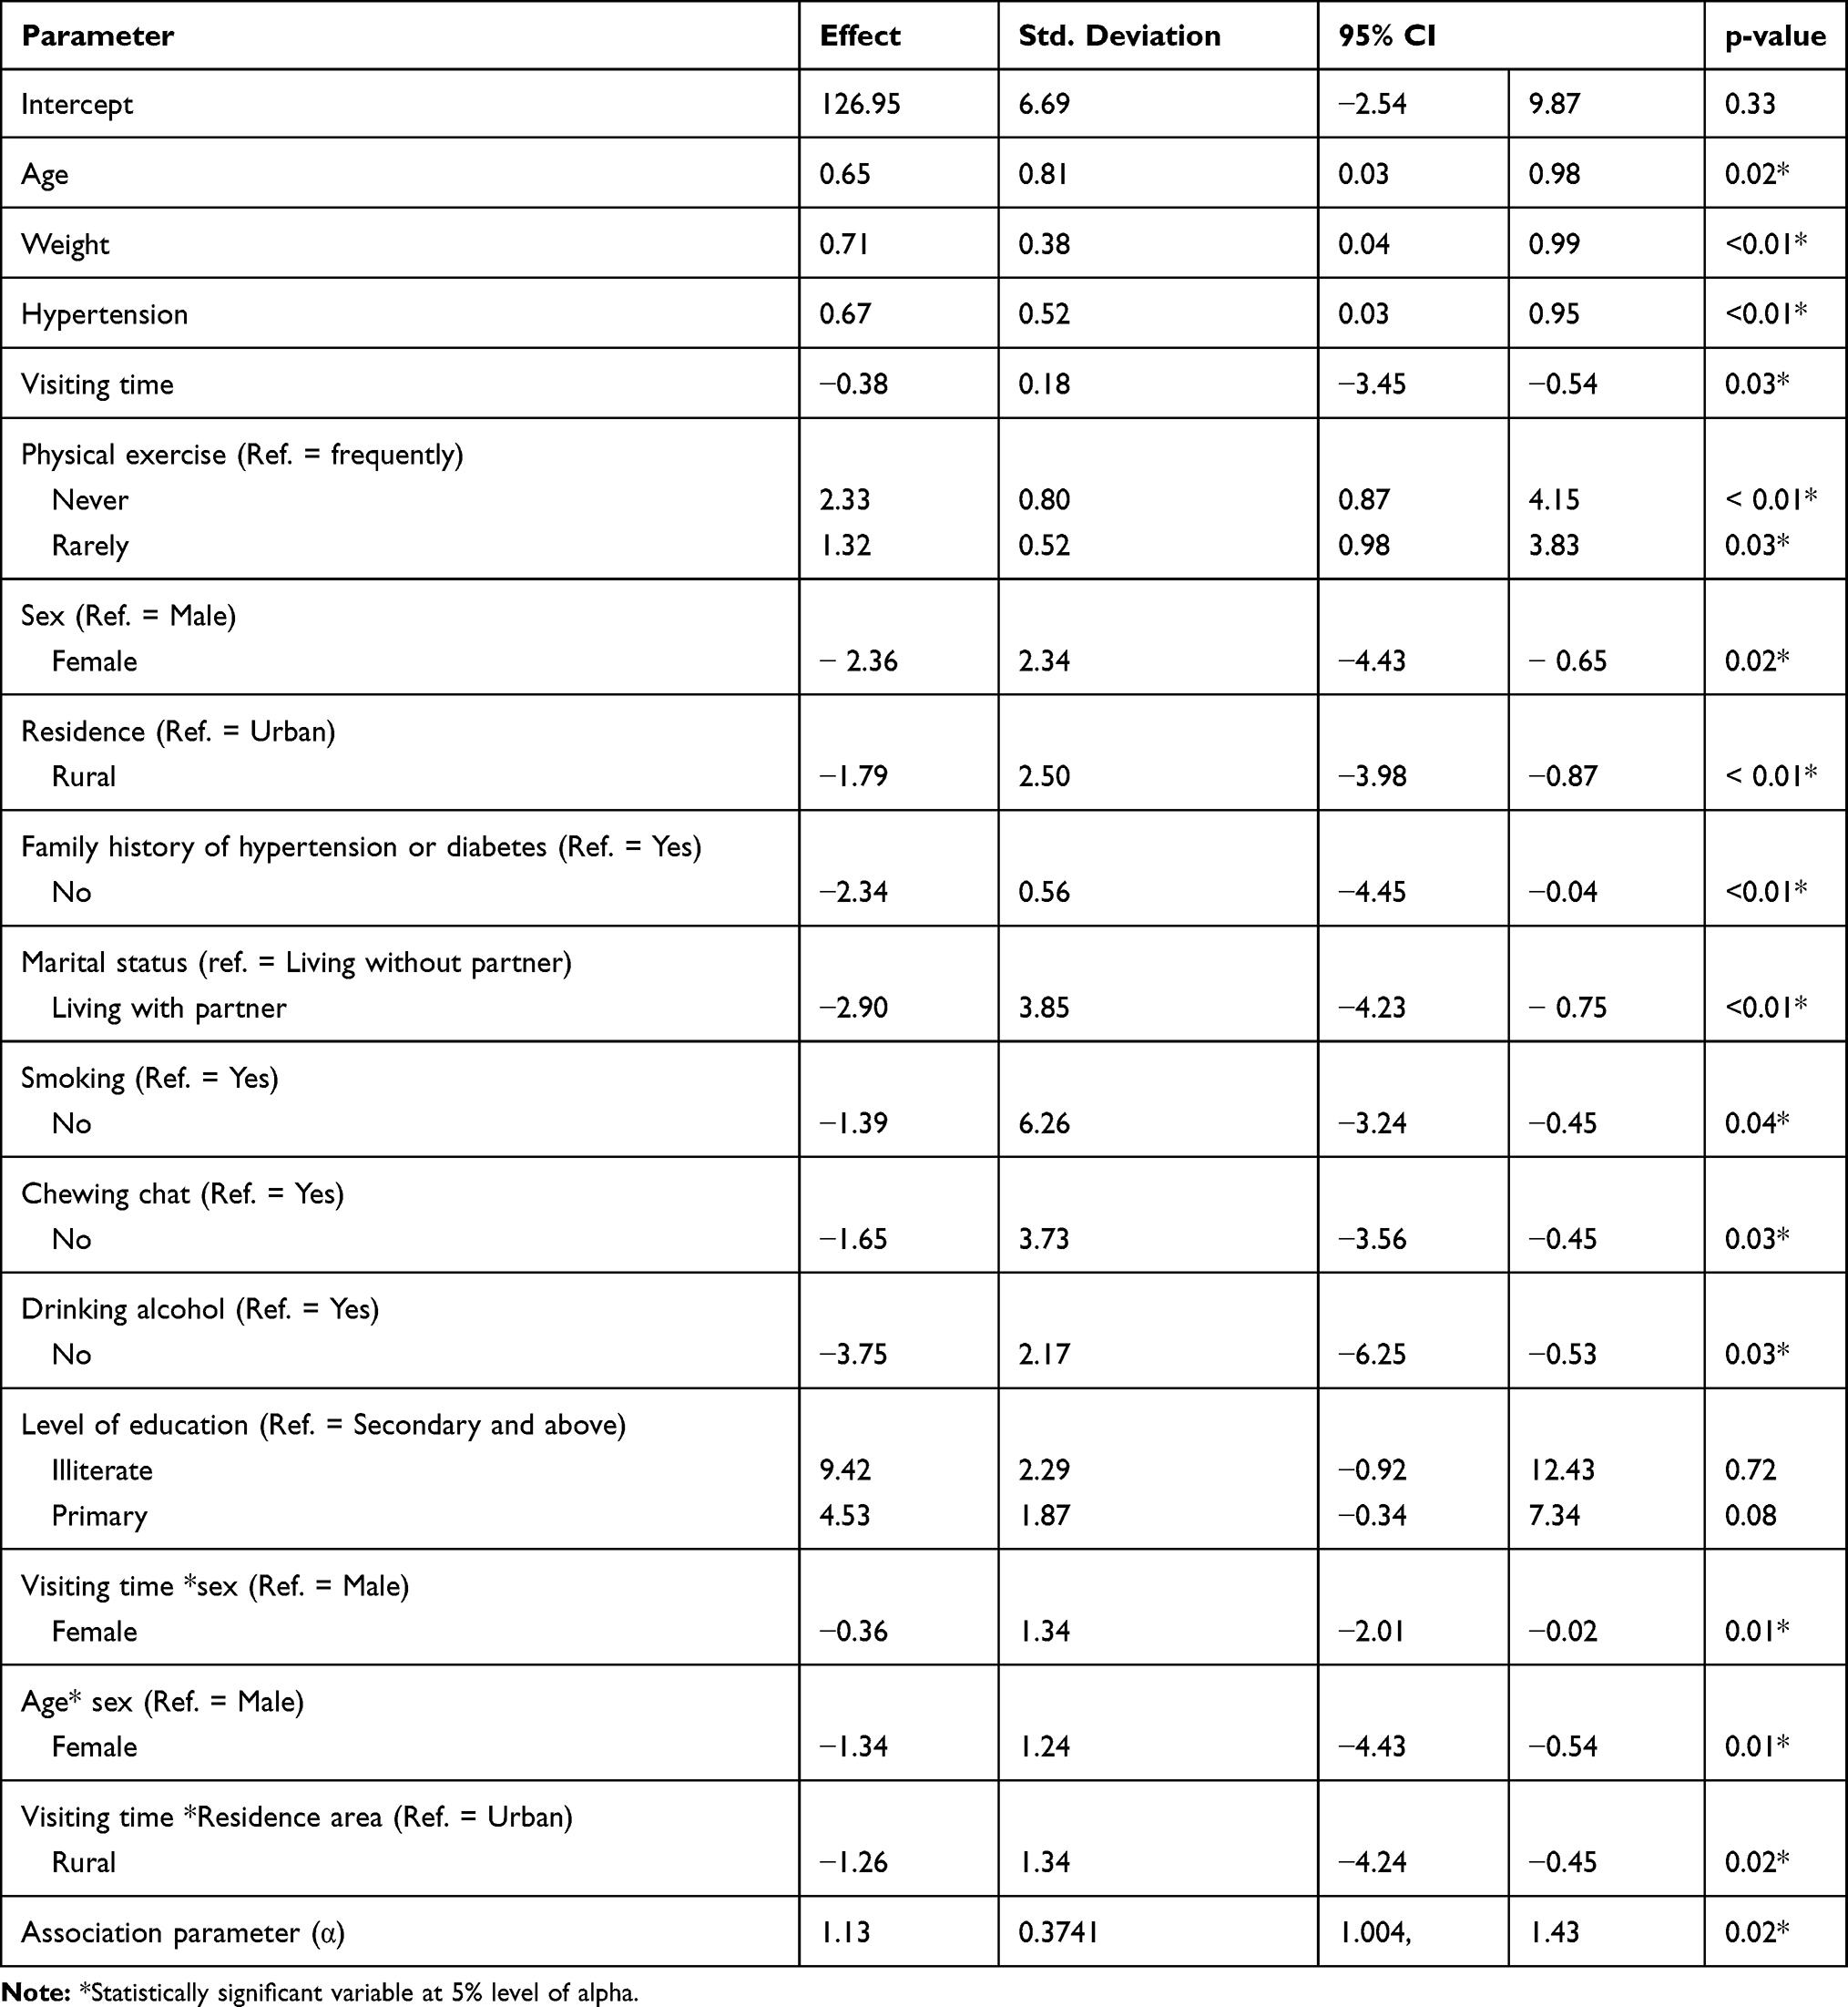 |
Table 4 Parameter Estimates for Joint Model of Type 2 Diabetes Data Using Linear Predictor for Hypertension |
The univariate separate model in Table 2 indicates that age, weight, sex, area of residence, smoking status, drinking status and visiting times statistically affected the two response variables. Similarly, among the interaction effects, visiting time with sex of patients, age with sex of patients and visiting time with area of residence significantly affected the variable of interest.
The conditional independence random intercept model in Table 3 indicates that age, weight, physical exercise, family history of disease, smoking status, drinking alcohol status, and visiting times were statistically significant for the two responses. On the other hand, the interaction effects like visiting time with sex, age with sex, and the interaction of visiting time with area of residence significantly affected the variable of interest.
In Table 3, the same sign in parameter estimations indicates a positive correlation between the two responses. The conditional independence assumption in Table 3 was too restrictive in introducing estimation of errors and the parameter estimation is not reliable. During this time, relaxation of conditional independence by re-fitting the joint random intercepts model with possible correlated errors is important. However, the relaxation of the conditional independence approach in Table 3 lacked convergence. In such situations, it is important to introduce the conditional dependence of one response on the other using a linear predictor16 which validates the observed correlation between the two responses arising from the association of random intercepts. This was done using a generalized linear mixed-effect model for type 2 diabetes as a response and hypertension as a linear predictor. The generalized linear mixed-effect model of type 2 diabetes considering hypertension as a linear predictor is shown in Table 4.
As shown in Table 4, age, hypertension, weight, physical exercise, sex, area of residence, family history of disease, smoking status, drinking alcohol status, marital status, chewing chat and visiting times significantly affected the progression rate of type 2 diabetes. Hence, as patients' age increased by one year, the amount of fasting glucose concentration in the blood increased by 0.65 mg/dL (95% CI: (0.03, 0.98), p-value <0.01) keeping the other variables constant. As patients' weight increased by 1 kg, amount of fasting glucose concentration in the blood also increased by 0.71 mg/dL (95% CI: (0.04, 0.99), p-value <0.01) keeping the other variables in the model constant.
Similarly, as patients’ hypertension increased by one unit, the amount of fasting glucose concentration in the blood also increased by 0.67 mg/dL (95% CI: (0.03, 0.95), p-value <0.01). As visiting time of a patient increased by one unit, the amount of fasting glucose concentration in the blood decreased by 0.38 mg/dL (95% CI: (−3.45, −0.54), p-value = 0.03).
Comparing female and male patients, the amount of fasting glucose concentration in the blood of female patients decreased by 2.36 (95% CI: (−4.43, −0.65), p-value = 0.02) as compared to male patients, keeping the other variables constant.
The amount of fasting glucose concentration in the blood of rural patients decreased by 1.79 (95% CI: (−3.98, −0.87), p-value <0.01) as compared to that of urban patients. Comparing smokers with non-smokers, the amount of fasting glucose concentration in the blood of non-smokers decreased by 1.39 (95% CI: (−3.24, −0.45), p-value = 0.04) as compared to smokers. Similarly, the average amount of fasting glucose concentration in the blood of non- alcohol consumers decreased by 3.75 (95% CI: (−6.25, −0.53)) as compared to alcohol consumers, keeping the other factors constant. Similar to main effects, some interaction effects were also significant in Table 4. Some of the significant interaction effects are described below.
Interaction Effects Between Visiting Time and Sex of Patients
The results in Table 3 indicate that, as visiting time increased by one unit, the amount of fasting glucose concentration in the blood of female patients decreased by 0.36 mg/dL compared to male patients, keeping the other variables constant. Therefore, the variation gap in the variables of interest between males and females observed at the beginning of the follow-up period increased as the number of follow-up visits increased.
Interaction Effect Between Visiting Time and Area of Residence
Even though rural patients had lower fasting glucose concentrations in their blood at initial treatment, the rate of decrease for average amount of fasting glucose concentration for urban patients was greater than that of rural patients after initiation of treatment. Hence, as time from commencement of treatment increased, the average decreasing rate of fasting glucose concentration for urban patients was faster than that of rural patients, keeping other things constant.
Interaction Effect Between Age and Sex of Patients
Table 4 indicates that, as patient age increased by one unit, the average amount of fasting glucose concentration also increased. Comparing female with male patients, the rate of increase for the variables of interest in female patients was smaller than that in male patients.
The joint mixed-effect model in Table 4 indicates that the variation in hypertension is also associated with the amount of fasting glucose concentration in the blood of patients. The association between the variables of interest increased as visiting time increased. In the current investigation, the variation between the random slopes for the variables of interest was positive and, hence, the larger value of the random slope between the variables of interest indicates a positive strong association between the response variables. Finally, the association parameter (α) had positive values with significant p-values (β = 1.13, 95% CI: (1.004, 1.43)). The positive value indicates that the two response variables were positively correlated and the occurrence of one leads to the occurrence of the other.
Discussion
In this research, certain predictors and covariates significantly and jointly affected the two responses, namely, hypertension and type 2 diabetes. As age of patient increased, the two responses also increased but the rates of increase for female and male patients were different. Hence, as age increased by one year, the average increasing rates of hypertension and type 2 diabetes for female patients were smaller as compared to male patients. This finding agrees with that of previous research.11,17
Weight of patients positively affected the two responses and this result also agreed with previous research.18 The potential reason for this may be the fact that patients who eat meat frequently weigh more than vegetarian patients and such patients are exposed to hypertension and associated diseases like type 2 diabetes.19 Patients who do not engage in physical exercise also weigh more than patients who do exercise19 and are thusalso exposed to hypertension and its correlated disease, diabetes 2.20
Male patients experience higher hypertension and type 2 diabetes readings as compared to females. The reason for this variation may be that females are always busy, with housework, childcare, shopping and cooking, which means they get more physical exercise, which postively influences their hypertension and type 2 diabetes readings. Females have good experience of taking pills for family planning and this might further lead to good adherence to medication for hypertension and type 2 diabetes. This result is consistent with one previous study21 and contradicted by another.22 Hence, this result needs further investigation in the future.
The severity of both diseases is greater in urban patients as compared to rural patients because of the nature of daily work for rural patients. Peasants are laborers, which involves physical activity and thus reduces their readingings for the two correlated diseases. This result is consistent with one of the previous studies.23
Hypertensive and type 2 diabetic patients who drink alcohol are exposed to greater severity of the two diseases. Such patients may not be adherent to medication after drinking alcohol, as described by health staff, because of the interaction between alcohol and the drug toxicity problem. Hence, such patients may skip taking pills after drinking alcohol, which leads to an inflation of readings for both diseases.23
Similarly, the severity of hypertension and type 2 diabetes for smokers leads to additional diseases such as cardiovascular disease; such patients are more likely to die than non-smokers. Smoking has side effects for the lungs of such patients and the existence of such additional diseases affects the severity of hypertension and its correlated disease, type 2 diabetes.24
Patients living with their partners experience less severe hypertension and type 2 diabetes because partners may give proper care and encourage them to adhere to prescribed medication. Partners may remind patients when to take their pills and to visit the health institution.25
As visiting time of patients increased by one unit, variables of interest decreased. The possible reason for this may be that successive treatment reduces hypertension and type 2 diabetes. However, the rate of reduction for female patients is greater than that for male patients. One possible reason for this is that women are used to adhering to child vaccination programs and family planning pills, which may positively affect their adherence to medication for hypertension and type 2 diabetes.26,27
As time from commencement of treatment increased by one unit, the rate of reduction for urban patients was greater than for rural patients. This result is similar to that of previous research.6 One possible reason for this might be that urban patients take their treatment more seriously, attend check ups and adhere to medication as instructedf. 28 Most of the time peasants living in rural areas go to health facilities whenever they are freed from regular activities rather than on the date prescribed by health staff. Patients in rural areas travel long distances to health facilities for follow-up appointments regarding their disease status and this may be another reason for loss to follow up.
Conclusions
This investigation indicates that the variables of interest decreased as visiting time of patients increased. However, the rate of decrease for different groups such as area of residence, sex, and marital status was different. Consequently, due attention should be given to the specific needs of each group of patients. Patients with very high hypertension and type 2 diabetes in this long-term treatment program were at risk and should receive continuous advice to engage in physical exercise. Rural patients under treatment, non-vegetarian patients, patients who do not engage in physical exercise, patients who drink alcohol and smoke cigarettes are at higher risk and should thus be identified for follow up.
The interaction effects of two or more covariates that occurred in the current investigation, and were not considered in previous investigations, indicate that this is a complicated health-related problem for both hypertension and type 2 diabetes. This further indicates that the occurrence of one is a cause of the other. The suggestions given in relation to the interaction effects of certain patient characteristics is useful for future research in this study area. The results obtained in the current investigation can help policy makers and health staff amend policies and instigate proper interventions aimed at reducing the severity of hypertension and type 2 diabetes.
This study was not without limitations. The data were obtained from only one treatment site and including more sites may provide additional information. The author recommends that future studies include additional treatment sites.
Availability of Data and Privacy Regulations
The data used in the current investigation is available from the author. The data accessed in the current investigation complied with relevant data protection and privacy regulations. This study was conducted in accordance with the Declaration of Helsinki.
Ethical Approval and Consent to Participate
An ethical approval certificate was obtained from the Bahir Dar University ethical approval committee, Bahir Dar University, Ethiopia (reference number: RCS/1412/2012). In data collection, there was no written or verbal consent from participants because secondary data was used.
Consent for Publication
This manuscript has not been published elsewhere and is not under consideration by any other journal. The author agreed on this manuscript being submitted in this journal for publication.
Author Contributions
The author contributed to data analysis, drafting or revising the article, agreed on the journal to which the article will be submitted, gave final approval of the version to be published, and agrees to be accountable for all aspects of the work.
Funding
There is no funding to report.
Disclosure
There are no financial or non-financial competing interests between the author and institutions. The author reports no conflicts of interest in this work.
References
1. Ginter E, Simko V. Global Prevalence and Future of Diabetes Mellitus. Springer; 2013:35–41.
2. Gress TW, Nieto FJ, Shahar E, Wofford MR, Brancati FL. Hypertension and antihypertensive therapy as risk factors for type 2 diabetes mellitus. N Engl J Med. 2000;342(13):905–912.
3. Hansson L, Lindholm LH, Niskanen L, et al. Effect of angiotensin-converting-enzyme inhibition compared with conventional therapy on cardiovascular morbidity and mortality in hypertension: the Captopril Prevention Project (CAPPP) randomised trial. Lancet. 1999;353(9153):611–616. doi:10.1016/S0140-6736(98)05012-0
4. Verdecchia P, Reboldi G, Angeli F, et al. Adverse prognostic significance of new diabetes in treated hypertensive subjects. Hypertension. 2004;43(5):963–969. doi:10.1161/01.HYP.0000125726.92964.ab
5. Zhong N-S, Li Y-M, Yang Z-F, et al. Chinese guidelines for diagnosis and treatment of influenza (2011). J Thorac Dis. 2011;3(4):274.
6. Sowers JR. Insulin resistance and hypertension. Am Physiological Soc. 2004.
7. Abramson JL, Weintraub WS, Vaccarino V. Association between pulse pressure and C-reactive protein among apparently healthy US adults. Hypertension. 2002;39(2):197–202. doi:10.1161/hy0202.104270
8. Davey DA, MacGillivray I. The classification and definition of the hypertensive disorders of pregnancy. Am J Obstet Gynecol. 1988;158(4):892–898. doi:10.1016/0002-9378(88)90090-7
9. Gebregziabher G, Giordano MA, Langan S, Namara RE. Economic analysis of factors influencing adoption of motor pumps in Ethiopia. J Dev Agric Econ. 2014;6(12):490–500.
10. Rizopoulos D. Joint Models for Longitudinal and Time-To-Event Data: With Applications in R. CRC press; 2012.
11. Ganjali M, Baghfalaki T. A copula approach to joint modeling of longitudinal measurements and survival times using monte carlo expectation-maximization with application to aids studies. J Biopharm Stat. 2015;25(5):1077–1099. doi:10.1080/10543406.2014.971584
12. Fieuws S, Verbeke G. Joint modelling of multivariate longitudinal profiles: pitfalls of the random‐effects approach. Stat Med. 2004;23(20):3093–3104. doi:10.1002/sim.1885
13. Lala P, Chakraborty C. Factors regulating trophoblast migration and invasiveness: possible derangements contributing to pre-eclampsia and fetal injury1. Placenta. 2003;24(6):575–587. doi:10.1016/S0143-4004(03)00063-8
14. Fitzmaurice G, Davidian M, Verbeke G, Molenberghs G. Longitudinal Data Analysis. CRC Press; 2008.
15. Centers for Disease Control and Prevention. Increasing prevalence of diagnosed diabetes–United States and Puerto Rico, 1995–2010. MMWR Morb Mortal Wkly Rep. 2012;61(45):918.
16. Ong KL, Cheung BM, Wong LY, Wat NM, Tan KC, Lam KS. Prevalence, treatment, and control of diagnosed diabetes in the US National Health and Nutrition Examination Survey 1999–2004. Ann Epidemiol. 2008;18(3):222–229. doi:10.1016/j.annepidem.2007.10.007
17. Grover G, Swain P, Deo V, Varshney M. A joint modeling approach to assess the impact of CD4 cell count on the risk of loss to follow up in HIV/AIDS patients on antiretroviral therapy. Int J Stat Appl. 2015;5(3):99–108.
18. Fieuws S, Verbeke G. Pairwise fitting of mixed models for the joint modeling of multivariate longitudinal profiles. Biometrics. 2006;62(2):424–431. doi:10.1111/j.1541-0420.2006.00507.x
19. Mancuso CA, Sayles W, Robbins L, et al. Barriers and facilitators to healthy physical activity in asthma patients. J Asthma. 2006;43(2):137–143. doi:10.1080/02770900500498584
20. Von Eynatten M, Lepper P, Liu D, et al. Retinol-binding protein 4 is associated with components of the metabolic syndrome, but not with insulin resistance, in men with type 2 diabetes or coronary artery disease. Diabetologia. 2007;50(9):1930–1937. doi:10.1007/s00125-007-0743-8
21. Cleland J, Bernstein S, Ezeh A, Faundes A, Glasier A, Innis J. Family planning: the unfinished agenda. Lancet. 2006;368(9549):1810–1827. doi:10.1016/S0140-6736(06)69480-4
22. Wasti SP, Simkhada P, Randall J, Freeman JV, Van Teijlingen E. Factors influencing adherence to antiretroviral treatment in Nepal: a mixed-methods study. PLoS One. 2012;7(5):e35547. doi:10.1371/journal.pone.0035547
23. Chopra A, Saluja M, Patil J, Tandale HS. Pain and disability, perceptions and beliefs of a rural Indian population: a WHO-ILAR COPCORD study. WHO-International League of Associations for Rheumatology. Community oriented program for control of rheumatic diseases. J Rheumatol. 2002;29(3):614–621.
24. Jia G, Di F, Wang Q, et al. Non-alcoholic fatty liver disease is a risk factor for the development of diabetic nephropathy in patients with type 2 diabetes mellitus. PLoS One. 2015;10(11):e0142808. doi:10.1371/journal.pone.0142808
25. Dal Canto E, Ceriello A, Rydén L, et al. Diabetes as a cardiovascular risk factor: an overview of global trends of macro and micro vascular complications. Eur J Prev Cardiol. 2019;26(2_suppl):25–32. doi:10.1177/2047487319878371
26. Tseng A, Foisy M, Hughes CA, et al. Role of the pharmacist in caring for patients with HIV/AIDS: clinical practice guidelines. Can J Hosp Pharm. 2012;65(2):125. doi:10.4212/cjhp.v65i2.1120
27. Fürst ELO, editor. Cooking and Femininity. Women’s Studies International Forum. Elsevier; 1997.
28. Neugut AI, Zhong X, Wright JD, Accordino M, Yang J, Hershman DL. Nonadherence to medications for chronic conditions and nonadherence to adjuvant hormonal therapy in women with breast cancer. JAMA Oncol. 2016;2(10):1326–1332. doi:10.1001/jamaoncol.2016.1291
 © 2021 The Author(s). This work is published and licensed by Dove Medical Press Limited. The full terms of this license are available at https://www.dovepress.com/terms.php and incorporate the Creative Commons Attribution - Non Commercial (unported, v3.0) License.
By accessing the work you hereby accept the Terms. Non-commercial uses of the work are permitted without any further permission from Dove Medical Press Limited, provided the work is properly attributed. For permission for commercial use of this work, please see paragraphs 4.2 and 5 of our Terms.
© 2021 The Author(s). This work is published and licensed by Dove Medical Press Limited. The full terms of this license are available at https://www.dovepress.com/terms.php and incorporate the Creative Commons Attribution - Non Commercial (unported, v3.0) License.
By accessing the work you hereby accept the Terms. Non-commercial uses of the work are permitted without any further permission from Dove Medical Press Limited, provided the work is properly attributed. For permission for commercial use of this work, please see paragraphs 4.2 and 5 of our Terms.