")
Back to Journals » Journal of Inflammation Research » Volume 16
Joint Application of Multiple Inflammatory Cytokines in Diagnosis of Gout Flare
Authors Yu H, Xue W, Yu H, Gu H, Qin L, Peng A
Received 16 February 2023
Accepted for publication 12 April 2023
Published 21 April 2023 Volume 2023:16 Pages 1771—1782
DOI https://doi.org/10.2147/JIR.S408929
Checked for plagiarism Yes
Review by Single anonymous peer review
Peer reviewer comments 2
Editor who approved publication: Professor Ning Quan
Hanqing Yu,* Wen Xue,* Hanjie Yu, Hongchen Gu, Ling Qin, Ai Peng
Center for Nephrology and Clinical Metabolomics, Division of Nephrology, Shanghai Tenth People’s Hospital, Tongji University School of Medicine, Shanghai, People’s Republic of China
*These authors contributed equally to this work
Correspondence: Ai Peng; Ling Qin, Center for Nephrology and Clinical Metabolomics, Division of Nephrology, Shanghai Tenth People’s Hospital, Tongji University School of Medicine, Shanghai, 200072, People’s Republic of China, Email [email protected]; [email protected]
Purpose: This study aimed to explore the accuracy for joint application of inflammatory cytokines in diagnosis of gout flare by comparison with peripheral blood cells.
Methods: We collected the clinical data of 96 acute gout patients and 144 remission gout patients, and compared the levels of peripheral blood cells, inflammatory cytokines and blood biochemistry indexes between acute and remission gout. We respectively assessed the area under curves (AUCs) for single and multiple inflammatory cytokines including C-reactive protein (CRP), interleukin-1β (IL-1β), interleukin-6 (IL-6), and tumor necrosis factor-α (TNF-α), and single and multiple peripheral blood cells including platelet (PLT), white blood cell (WBC), percentages of neutrophils (N%), lymphocytes (L%), eosinophils (E%), basophils (B%) in diagnosis of acute gout by receiver operating characteristic (ROC) curve analysis.
Results: By contrast with remission gout, the levels of PLT, WBC, N%, CRP, IL-1β, IL-6 and TNF-α increased, and the levels of L%, E% and B% decreased in acute gout. The AUCs of PLT, WBC, N%, L%, E% and B% in diagnosis of acute gout were respectively 0.591, 0.601, 0.581, 0.567, 0.608 and 0.635, while the AUC for joint application of these peripheral blood cells was 0.674. Moreover, the AUCs of CRP, IL-1β, IL-6 and TNF-α in diagnosis of acute gout were respectively 0.814, 0.683, 0.622 and 0.746, while the AUC for joint application of these inflammatory cytokines was 0.883, reflecting significantly higher levels than peripheral blood cells.
Conclusion: The joint application of multiple inflammatory cytokines can better distinguish acute gout from remission gout compared with peripheral blood cells.
Keywords: acute gout, diagnosis, multiple inflammatory cytokines
Introduction
Gout is a common inflammatory arthritis, caused by hyperuricemia and related monosodium urate (MSU) crystal deposition.1 According to a global epidemiologic report of gout in 2020, the prevalence and incidence of gout respectively range from <1% to 6.8% and 0.58 to 2.89 per 1000 person-years, and the data are likely to keep rising.2 Projections indicate that the mortality of gout may increase by 55% in 2060.3 Such heavy burden of gout prompts us to find faster, better and more accurate diagnostic methods of gout. Clinically, gout patients can suffer from repeated attacks of acute gout, typically manifested by redness, swelling, heat and pain of local bone and joints, which greatly reduce the quality of life.4 Although significant manifestations can largely assist with a definitive diagnosis of acute gout, it is still with relative difficulties for clinicians to diagnose atypical gout attacks and evaluate the levels of acute inflammation in gout.
Immune cells and inflammatory cytokines are major participants in gout flares. During an acute attack of gout, MSU crystals initially stimulate the activation of the NOD-like receptor thermal protein domain associated protein 3 (NLRP3) inflammasome, which then activate caspase-1, one kind of intracellular cysteine proteases, playing important roles in processing pro-IL-1β to active IL-1β in monocytes and macrophages.5 After the maturation of IL-1β, the inflammatory processes are amplified by recruitment and activation of neutrophils, and releases of pro-inflammatory cytokines, chemokines, and other factors.6,7
Acute gouty arthritis is not only a local but also a systemic inflammatory disease. Former studies have revealed large amounts of leukocytes and high levels of cytokines such as IL-1β, IL-6 and TNF-α in the synovial fluid during gout flares.8–11 Similarly, serum levels of pro-inflammatory cytokines such as IL-1β, IL-4, IL-6, IL-18, CRP were previously detected to elevate in acute gout compared with remission gout or normal controls.12–15 A Korean research team discovered that the pro-inflammatory factor macrophage migration inhibitory factor (MIF) and IL-8 in peripheral blood and synovial fluid of gout patients were conformably higher than normal controls.16 This finding indicated that we can evaluate the levels of inflammatory cytokines in the synovial fluid based on their levels in peripheral blood to determine whether gout is in the acute phase. Nevertheless, the diagnostic efficacy of peripheral inflammatory cytokines in acute gout remains little known.
In this study, we compared the clinical indexes including peripheral blood cells, inflammatory cytokines, blood biochemistry between acute and remission gout, and analyzed the receiver operating characteristic (ROC) curves of single peripheral blood cell, multiple peripheral blood cells, single inflammatory cytokine and multiple inflammatory cytokines to figure out the best diagnostic method in acute gout among them.
Materials and Methods
Study Population
This is a retrospective study, which involves 240 patients diagnosed as gout by two senior attending doctors between September 2021 and December 2022 from Center for Nephrology and Clinical Metabolomics, Division of Nephrology in Shanghai Tenth People’s Hospital. The Inclusion standards of gout patients were listed as follows: 1) age between 18 and 80 years; 2) male patients; 3) diagnostic score for gout more than 8 according to the American College of Rheumatology/the European League Against Rheumatism Executive Committee (ACR/EULAR) gout classification criteria in 201517; 4) evidence of MSU crystal deposition by dual-energy CT scan or ultrasonic examination within 3 months. The exclusion standards of gout patients were listed as follows: 1) acute or chronic infection, malignant tumor and other rheumatic immune diseases; 2) end-stage renal disease (ESRD) (eGFR <15 mL/min/1.73 m2); 3) usage of anti-inflammatory drugs such as non-steroidal drugs, glucocorticoids and immunosuppressors within 3 months; 4) vaccination within 6 months.
According to symptomatic episodes defined in 2015 ACR/EULAR clinical diagnostic criteria for gout and pathophysiological stages of gout,17,18 96 and 144 patients were respectively classified as acute gout group and remission gout group. The criterion for acute gout was clinical manifestations including redness, swelling, heat and pain at local joint or bursa. The criteria for remission gout included 1) remission of clinical manifestations including redness, swelling, heat and pain at local joint or bursa for at least 3 months since the last gout flare and 2) serum uric acid below 360μmol/L at least twice within 6 months. Our study complies with the Declaration of Helsinki. Informed consent was obtained from all patients. This study was approved by the Medical Ethics Committee of Shanghai Tenth People’s Hospital of Tongji University (SHSY-IEC-4.1/21-246/01).
Study Samples
Blood was drawn from peripheral veins of gout patients. Two-milliliter venous blood of each patient was added to vacuum tubes (including anticoagulant EDTA solution) for peripheral blood cell examination. Three-milliliter venous blood of each patient was added to vacuum tubes for inflammatory cytokine examination. Five-milliliter venous blood of each patient was added to vacuum tubes for blood biochemistry examination. The peripheral blood cells of all the patients were detected in the same anticoagulant blood samples. The inflammatory cytokines and blood biochemistry of all the patients were detected in the same serum samples. All the examinations were completed at the Department of Laboratory of Shanghai Tenth People’s Hospital.
Clinical Indexes
The clinical data of these 240 acute and remission gout patients were collected from the standardized medical records. Basic information included age, BMI (body mass index), systolic blood pressure (SBP) and diastolic blood pressure (DBP), among which BMI was calculated as weight (kg) divided by the square of height (m). Peripheral blood cell indexes included red blood cell (RBC), platelet (PLT), white blood cell (WBC), percentage of neutrophils (N%), percentage of monocytes (M%), percentage of lymphocytes (L%), percentage of eosinophils (E%), percentage of basophils (B%). Inflammatory cytokine indexes contained C-reactive protein (CRP), interleukin-1β (IL-1β), interleukin-2 (IL-2), interleukin-4 (IL-4), interleukin-5 (IL-5), interleukin-6 (IL-6), Interleukin-10 (IL-10), interleukin-17A (IL-17A), and tumor necrosis factor-α (TNF-α). Blood biochemistry indexes included alanine aminotransferase (ALT), aspartate aminotransferase (AST), total protein (TP), albumin (ALB), globulin (GLO), albumin-to-globulin ratio (A/G), total bilirubin (TBIL), direct bilirubin (DBIL), blood urea nitrogen (BUN), serum creatinine (SCr), serum uric acid (SUA), cystatin C (CysC), fasting blood glucose (FBG), glycosylated hemoglobin (HbA1c), total triglycerides (TG), total cholesterol (TC), high-density lipoprotein (HDL), low-density lipoprotein (LDL). We used the Chronic Kidney Disease Epidemiology (CKD-EPI) formula corrected for Asians to evaluate the eGFR.19 The equation for male is as follows: eGFR = 149 × (0.993)age × (SCr/0.7)−1.201, SCr >0.9; eGFR = 149 × (0.993)age × (SCr/0.7)−0.415, SCr ≤0.9.
Statistical Analysis
Statistical analysis was performed by using GraphPad Prism 9.0 (GraphPad Software Inc.) and IBM SPSS Statistics 27 (IBM Corp., Armonk, NY, USA). The Kolmogorov–Smirnov test was applied to determine the distribution of data. Data with normal distribution were presented as mean ± standard deviation (M ± SD), and data with skewed distribution were presented as median (interquartile range) [P50 (P25, P75)]. In comparison between the two groups, P values were evaluated by two-tailed unpaired t test for data with normal distribution and equal variance, by two-tailed Welch’s t test for data with normal distribution and unequal variance, and by two-tailed Mann–Whitney test for data with skewed distribution. The receiver operating characteristic (ROC) curve analysis was used to evaluate the area under the curves (AUCs) of various indexes in diagnosis of acute gout. The optimal cutoff value was selected with the maximum Youden index calculated by subtracting 1 from the sum of sensitivity and specificity. P value <0.05 indicated statistical difference.
Results
Acute Gout Showed Increases in Levels of Certain Peripheral Blood Cells and Inflammatory Cytokines Compared with Remission Gout
There were no statistical differences in age, BMI, SBP and DBP between acute and remission gout (Table 1). In comparison with remission gout, except for RBC, Hb and M% showing no differences between the two groups, PLT (P=0.017), WBC (P=0.008) and N% (P=0.033) increased in acute group, while L% (P=0.033), E% (P=0.004) and B% (P<0.001) decreased in acute gout (Table 1). For inflammatory cytokines, serum levels of IL-2, IL-4, IL-5, IL-10, IL-17A displayed no statistical differences between the two groups, whereas serum levels of CRP (P<0.001), IL1-β (P<0.001), IL-6 (P=0.001) and TNF-α (P<0.001) were much higher in acute gout than that in remission gout (Table 1). In blood biochemistry, apart from total bilirubin (TBIL) with a lower level in acute gout than that in remission gout (P=0.039), there were no statistical differences in indexes of liver function, renal function, glucose and lipid metabolism between acute and remission gout (Table 1).
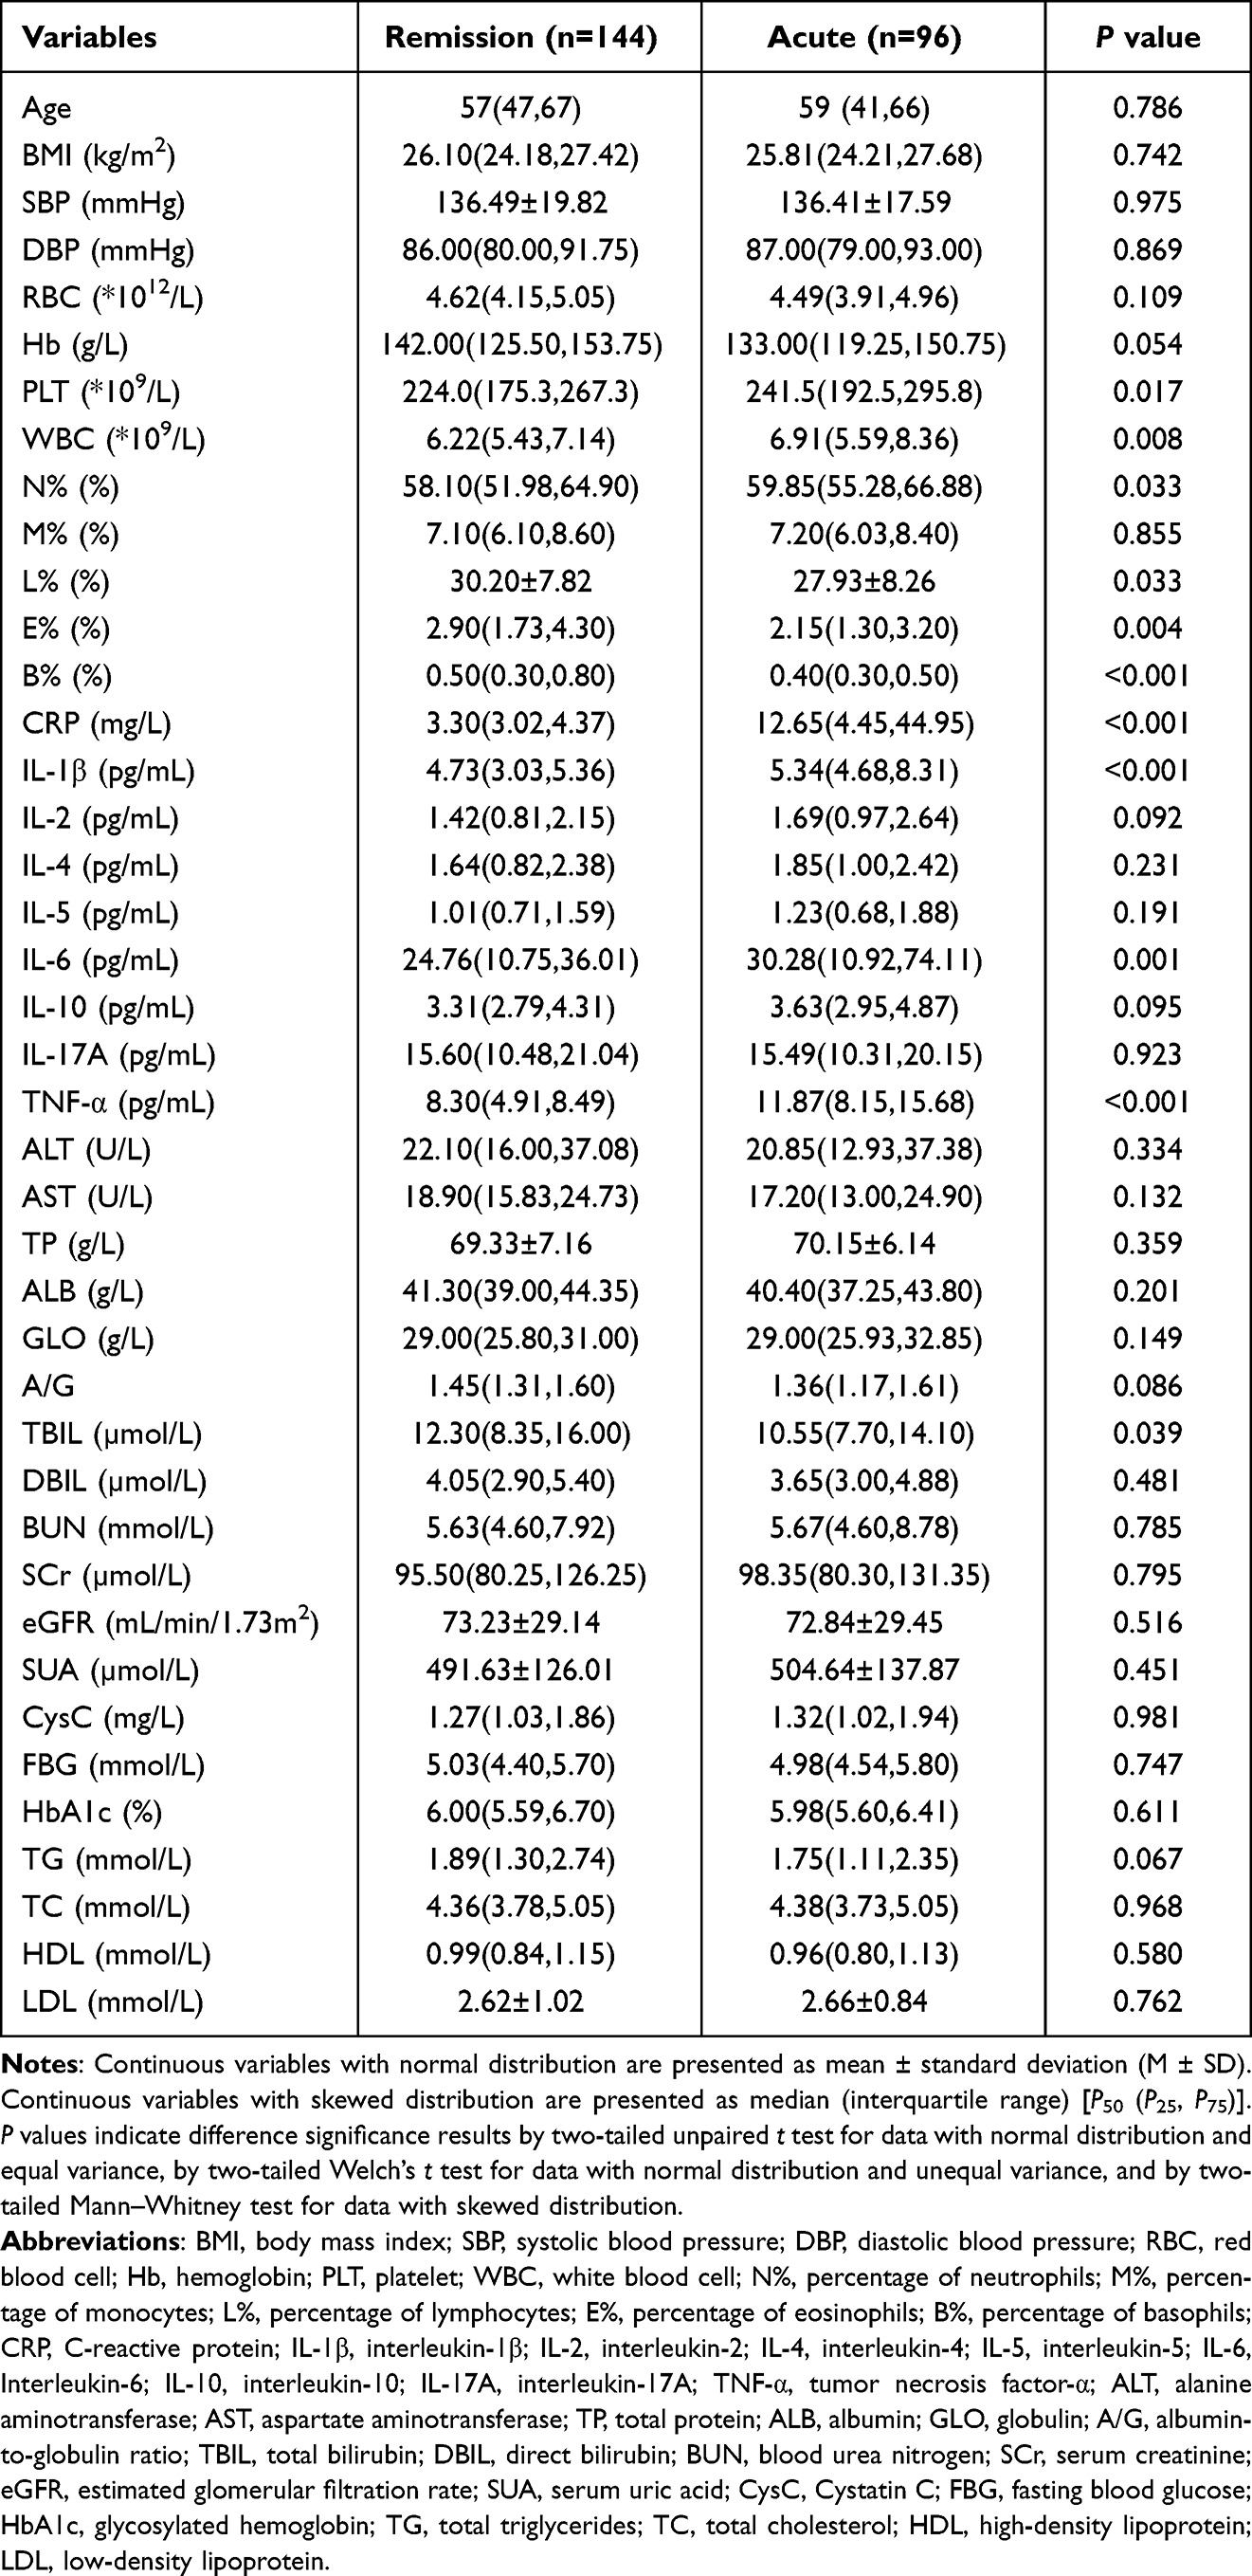 |
Table 1 Comparison of Clinical Indexes Between Remission and Acute Gout Patients |
Single Peripheral Blood Cell in Diagnosis of Acute Gout
In order to assess the value of peripheral blood cells which presented with statistical differences between acute and remission gout in diagnosis of acute gout, we conducted ROC curve analysis. For each single immune cell, the AUCs were 0.591 (95% confidence interval (95% CI): 0.518–0.664, P=0.017) in PLT, 0.601 (95% CI: 0.525–0.677, P=0.008) in WBC, 0.581 (95% CI: 0.508–0.654, P=0.033) in N%, 0.567 (95% CI: 0.493–0.641, P=0.079) in L%, 0.608 (95% CI: 0.535–0.681, P=0.005) in E% and 0.635 (95% CI: 0.565–0.705, P<0.001) in B% (Table 2, Figure 1A-F). The optimum cutoff value of PLT was 236.50 × 10⁹/L, with the Youden index, sensitivity and specificity as 0.149, 55.21% and 59.72% (Table 2, Figure 1A). The optimum cutoff value of WBC was 6.97 × 10⁹/L, with the Youden index, sensitivity and specificity as 0.219, 48.96% and 72.92% (Table 2, Figure 1B). The optimum cutoff value of N% was 53.05%, with the Youden index, sensitivity and specificity as 0.167, 85.42% and 31.25% (Table 2, Figure 1C). The optimum cutoff value of L% was 28.45%, with the Youden index, sensitivity and specificity as 0.118, 52.08%, 59.72% (Table 2, Figure 1D). The optimum cutoff value of E% was 2.95%, with the Youden index, sensitivity and specificity as 0.188, 70.83% and 47.92% (Table 2, Figure 1E). The optimum cutoff value of B% was 0.55%, with the Youden index, sensitivity and specificity as 0.247, 78.13% and 46.53% (Table 2, Figure 1F).
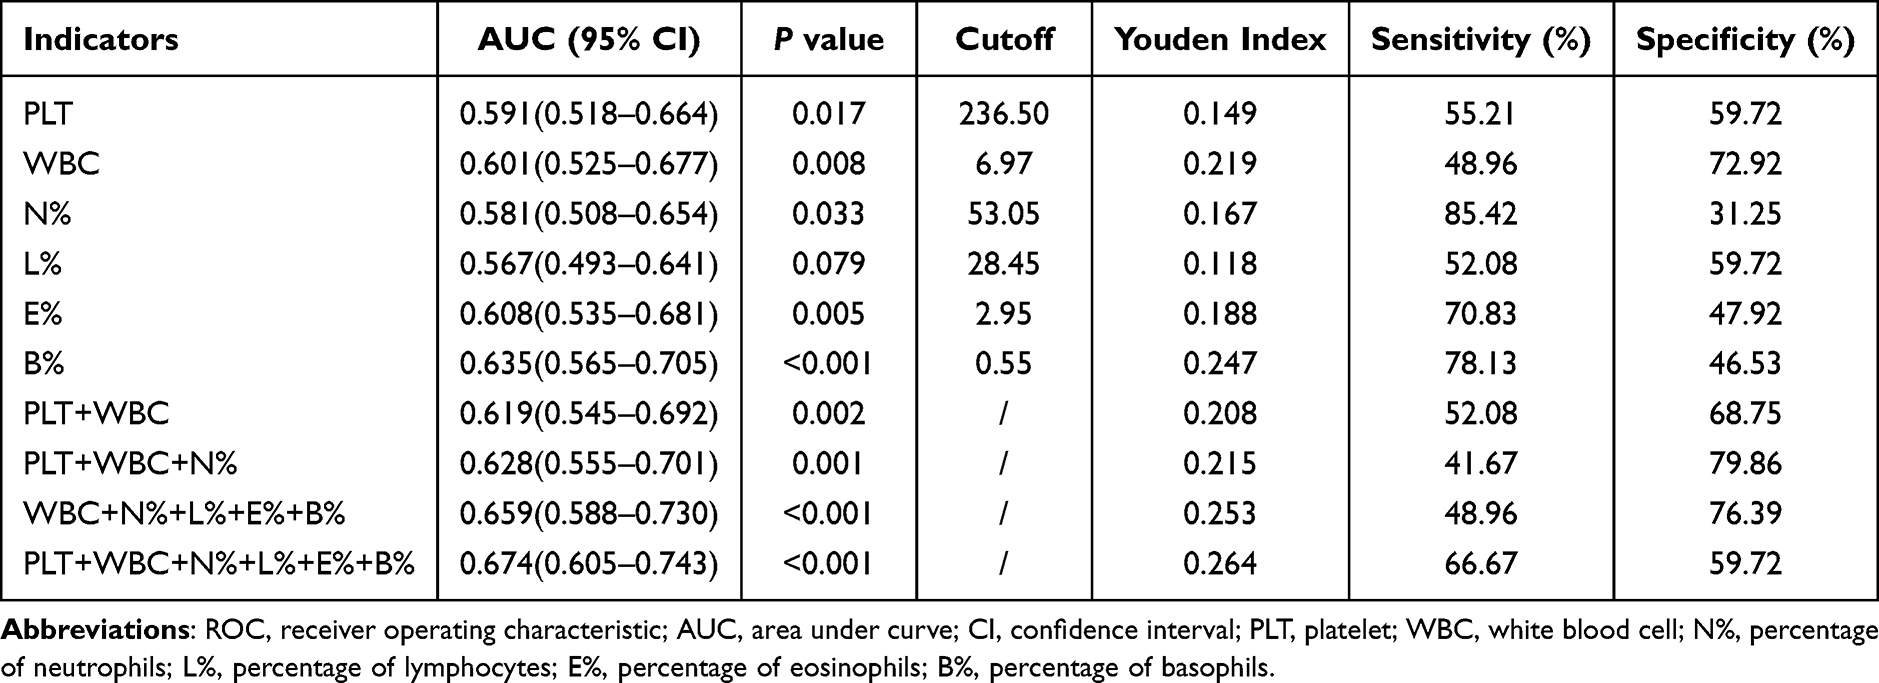 |
Table 2 ROC Curve Analysis of Peripheral Blood Cells in Diagnosis of Acute Gout |
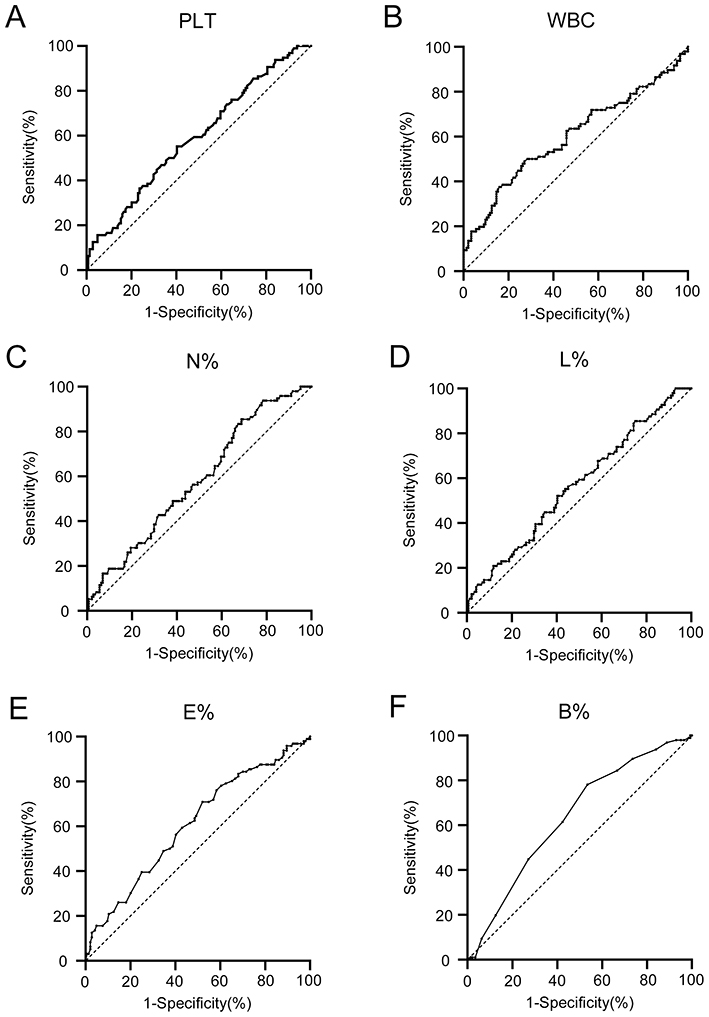 |
Figure 1 ROC curve analysis of single peripheral blood cell in diagnosis of acute gout. (A) ROC curve of PLT; (B) ROC curve of WBC; (C) ROC curve of N%; (D) ROC curve of L%; (E) ROC curve of E%; (F) ROC curve of B%. Abbreviations: ROC, receiver operating characteristic; PLT, platelet; WBC, white blood cell; N%, percentage of neutrophils; L%, percentage of lymphocytes; E%, percentage of eosinophils; B%, percentage of basophils. |
Joint Application of Multiple Peripheral Blood Cells Could Elevate the Accuracy in Diagnosis of Acute Gout
Then, we analyzed the ROC curves for combination of these peripheral blood cells. The AUC of PLT+WBC was 0.619 (95% CI: 0.545–0.692, P=0.002) with Youden index, sensitivity and specificity as 0.208, 52.08% and 68.75% (Table 2, Figure 2A). The AUC of PLT+WBC+N% was 0.628 (95% CI: 0.555–0.701, P=0.001) with Youden index, sensitivity and specificity as 0.215, 41.67% and 79.86% (Table 2, Figure 2B). The AUC of WBC+N%+L%+E%+B% was 0.659 (95% CI: 0.588–0.730, P<0.001) with Youden index, sensitivity and specificity as 0.253, 49.96% and 76.39% (Table 2, Figure 2C). The AUC of PLT+WBC+N%+L%+E%+B% was 0.674 (95% CI: 0.605–0.743, P<0.001) with Youden index, sensitivity and specificity as 0.264, 66.67% and 59.72% (Table 2, Figure 2D). The increased AUCs and Youden indexes in joint application of multiple peripheral blood cells suggested their elevated accuracy in diagnosis of acute gout compared with application of each single peripheral blood cell.
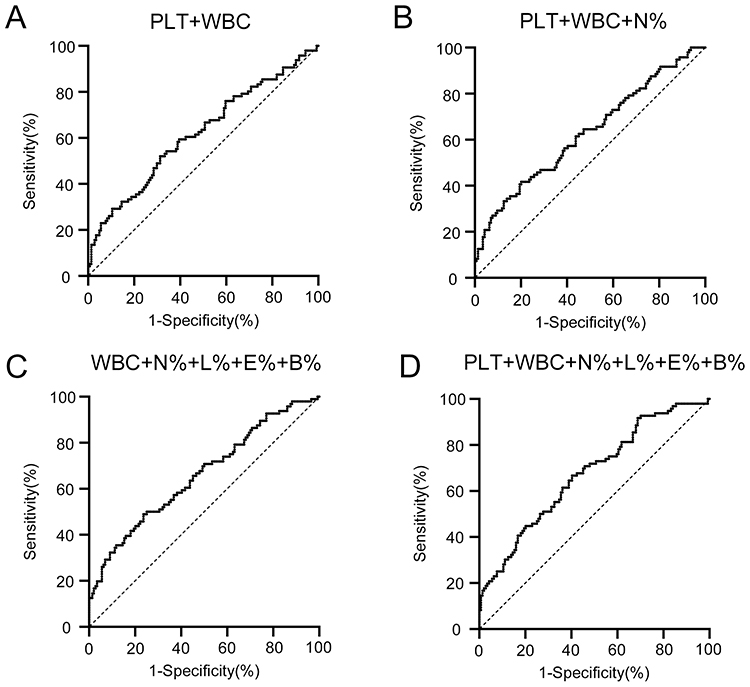 |
Figure 2 ROC curve analysis of multiple peripheral blood cells in diagnosis of acute gout. (A) ROC curve of PLT+WBC; (B) ROC curve of PLT+WBC+N%; (C) ROC curve of WBC+N%+L%+E%+B%; (D) ROC curve of PLT+WBC+N%+L%+E%+B%. Abbreviations: ROC, receiver operating characteristic; PLT, platelet; WBC, white blood cell; N%, percentage of neutrophils; L%, percentage of lymphocytes; E%, percentage of eosinophils; B%, percentage of basophils. |
Single Inflammatory Cytokine in Diagnosis of Acute Gout
To assess the value of inflammatory cytokines with statistical differences between acute and remission gout in diagnosis of acute gout, we analyzed their ROC curves. For each single inflammatory cytokine, the AUCs were 0.814 (95% CI: 0.752–0.876, P<0.001) in CRP, 0.683 (95% CI: 0.611–0.756, P<0.001) in IL-1β, 0.622 (95% CI: 0.544–0.699, P=0.001) in IL-6, 0.746 (95% CI: 0.678–0.814, P<0.001) in TNF-α (Table 3, Figure 3A-D). The optimum cutoff value of CRP was 9.865 mg/L, with the Youden index, sensitivity and specificity as 0.580, 61.46% and 96.53% (Table 3, Figure 3A). The optimum cutoff value of IL-1β was 7.50 pg/mL, with the Youden index, sensitivity and specificity as 0.403, 45.83% and 94.44% (Table 3, Figure 3B). The optimum cutoff value of IL-6 was 38.98 pg/mL, with the Youden index, sensitivity and specificity as 0.354, 47.92% and 87.50% (Table 3, Figure 3C). The optimum cutoff value of TNF-α was 8.94 pg/mL, with the Youden index, sensitivity and specificity as 0.559, 71.88% and 84.03% (Table 3, Figure 3D).
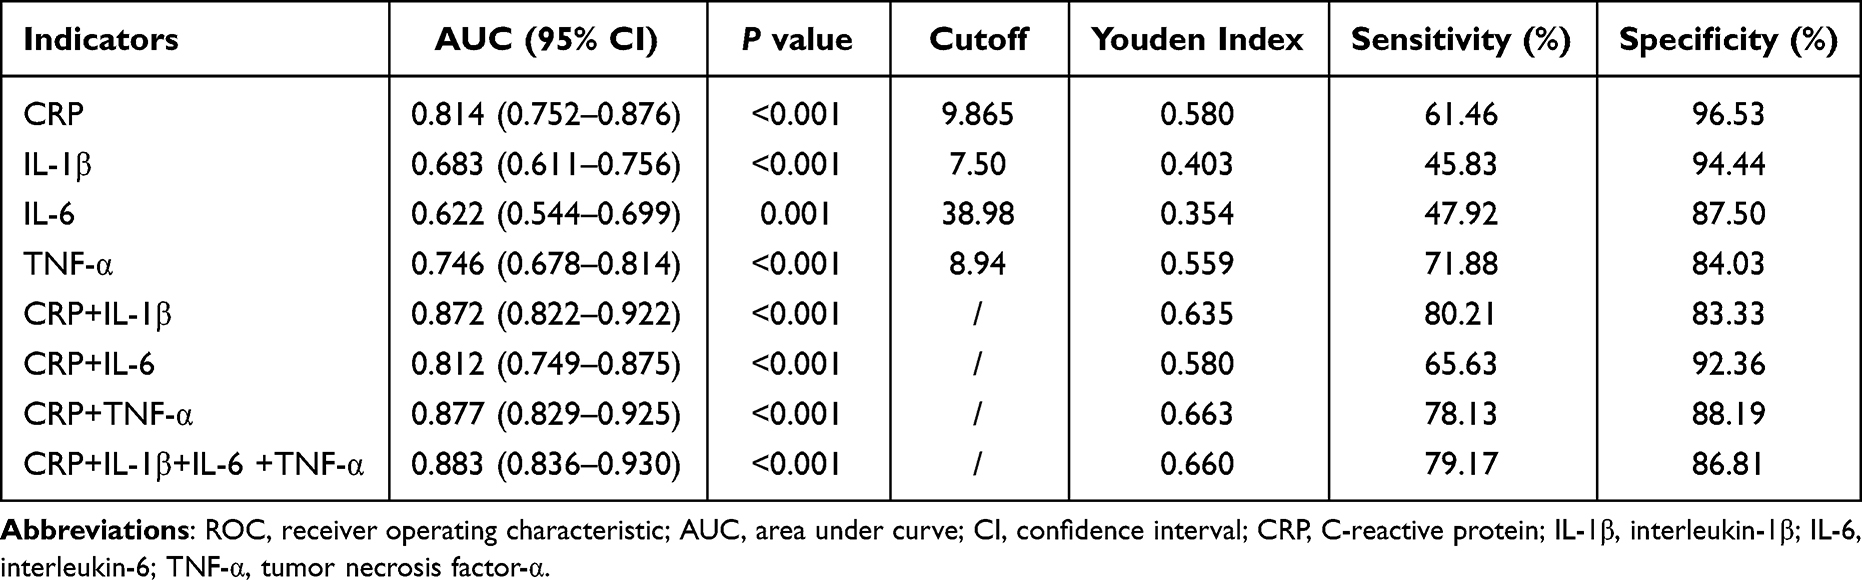 |
Table 3 ROC Curve Analysis of Inflammatory Cytokines in Diagnosis of Acute Gout |
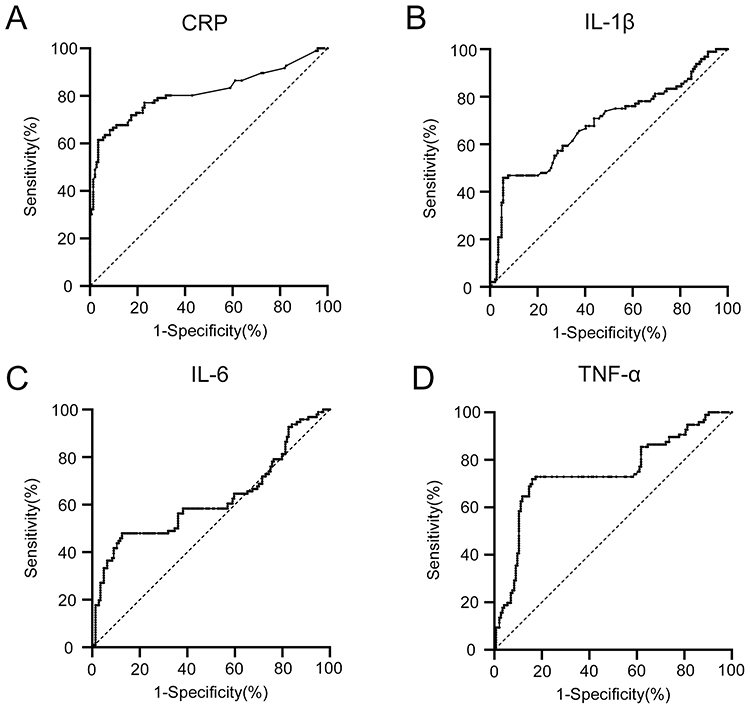 |
Figure 3 ROC curve analysis of single inflammatory cytokine in diagnosis of acute gout. (A) ROC curve of CRP; (B) ROC curve of IL-1β; (C) ROC curve of IL-6; (D) ROC curve of TNF-α. Abbreviations: ROC, receiver operating characteristic; CRP, C-reactive protein; IL-1β, interleukin-1β; IL-6, interleukin-6; TNF-α, tumor necrosis factor-α. |
Joint Application of Multiple Inflammatory Cytokines Could Better Elevate the Accuracy in Diagnosis of Acute Gout than Joint Application of Multiple Peripheral Blood Cells
We also analyzed the ROC curves for combination of multiple inflammatory cytokines. The AUC of CRP+ IL-1β was 0.872 (95% CI: 0.822–0.922, P<0.001) with Youden index, sensitivity and specificity as 0.635, 80.21% and 83.33% (Table 3, Figure 4A). The AUC of CRP+IL-6 was 0.812 (95% CI: 0.749–0.875, P<0.001) with Youden index, sensitivity and specificity as 0.580, 65.63% and 92.36% (Table 3, Figure 4B). The AUC of CRP+TNF-α was 0.877 (95% CI: 0.829–0.925, P<0.001) with Youden index, sensitivity and specificity as 0.663, 78.13% and 88.19% (Table 3, Figure 4C). The AUC of CRP+IL-1β+IL-6+TNF-α was 0.883 (95% CI: 0.836–0.930, P<0.001) with Youden index, sensitivity and specificity as 0.660, 79.17% and 86.81% (Table 3, Figure 4D). The increased AUCs and Youden indexes in joint application of multiple inflammatory cytokines suggested their elevated accuracy in diagnosis of acute gout compared with application of each single inflammatory cytokine. Furthermore, the higher levels of AUCs and Youden indexes of inflammatory cytokines than peripheral blood cells in diagnosis of acute gout indicated that joint application of multiple inflammatory cytokines could better distinguish acute gout from remission gout by contrast with joint application of multiple peripheral blood cells.
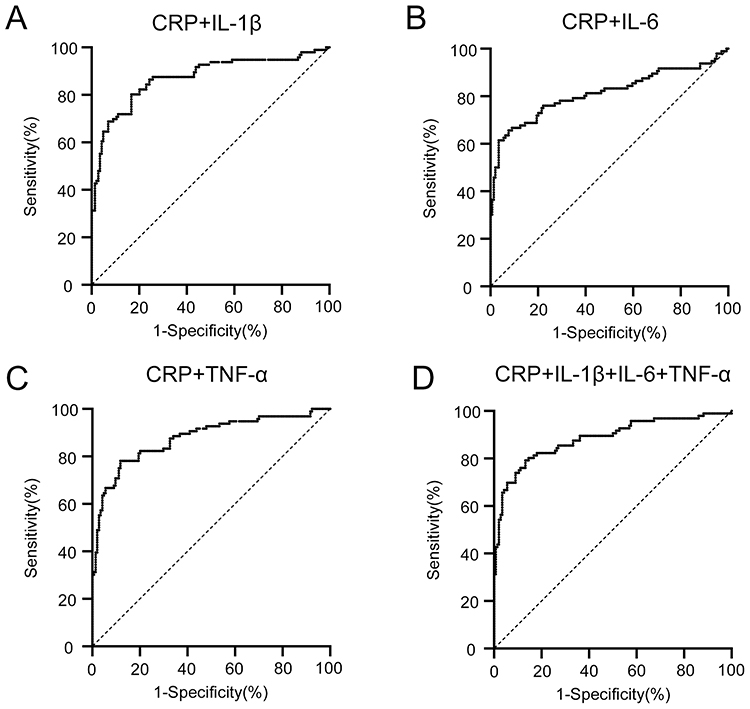 |
Figure 4 ROC curve analysis of multiple inflammatory cytokines in diagnosis of acute gout. (A) ROC curve of CRP+ IL-1β; (B) ROC curve of CRP+ IL-6; (C) ROC curve of CRP+TNF-α; (D) ROC curve of CRP+IL-1β+IL-6+TNF-α. Abbreviations: ROC, receiver operating characteristic; CRP, C-reactive protein; IL-1β, interleukin-1β; IL-6, interleukin-6; TNF-α, tumor necrosis factor-α. |
Discussion
In this study, we found that levels of certain peripheral blood cells including PLT, WBC, N%, L%, E%, B% presented with statistical differences between acute and remission gout, among which levels of PLT, WBC and N% elevated while L%, E% and B% reduced in acute gout. It has been reported that inflammation can cause endothelial activation characterized by intense interactions between leukocytes, endothelial cells and platelets.20 Large amounts of evidences revealed that platelets can be considered as an extension of the cellular immune system, which coordinate both innate and adaptive immune responses.21,22 According to a recent study, neutrophil–lymphocyte ratio (NLR) and platelet–lymphocyte ratio (PLR) were higher in acute gout patients than those in remission gout patients.23 Another study detected that platelet activation was exacerbated in gout especially during gout flares.24 Herein, the increase of PLT, WBC and N% and decrease of L% conforms with these former findings, and the reduction of E% and B% may result from the notable increase in proportion of neutrophils.
In comparison of inflammatory cytokines between acute gout and remission gout, our study revealed significantly increased serum levels of CRP, IL-1β, IL-6 and TNF-α in acute gout. CRP is an acute inflammatory factor produced by liver in response to immune cytokines.25 IL-1β is a pro-inflammatory cytokine mainly secreted by stimulated monocytes and macrophages, which directly or indirectly participates in both local and systemic responses including recruitment of immune cells, production of inflammatory enzymes and occurrence of inflammatory symptoms.26–29 IL-6 is a pleiotropic cytokine with multiple biologic activities, such as acute-phase immune reaction induction, inflammation regulation and hematopoiesis promotion.30 TNF-α takes crucial parts in vasodilatation, edema, fever, leukocyte adhesion during the process of inflammation.31 Consistent with previous findings on peripheral inflammatory cytokines in gout flares,32–35 we discovered significant elevation of CRP, IL-1β, IL-6 and TNF-α concentration in peripheral blood, indicating that these cytokines can be important biomarkers in diagnosis of acute gout.
For blood biochemistry, the serum level of TBIL was lower in acute gout, and there existed no statistical differences in other indexes of renal function, liver function, renal function, glucose and lipid metabolism between acute gout and remission gout. Serum bilirubin levels have been reported to be closely related to antioxidant and inflammatory inhibition in various diseases, such as atherosclerosis, psoriasis and diabetes.36–38 Herein, the decreased level of TBIL in acute gout indicates that bilirubin may participate in inflammatory processes in gout flares, which needs to be further clarified in future mechanism researches.
The diagnosis of acute gout has experienced a long-term development. Before 2010s, the most widely used classification criteria or diagnostic rules for gout was the 1977 ACR preliminary criteria for the classification of the acute gouty arthritis,39 later gradually improved and supplemented.40,41 By the year 2015, the ACR Board of Directors and the EULAR Executive Committee together worked out 2015 Gout classification criteria using scores for diagnosis, which has been adopted for gout identification worldwide.17 However, these diagnostic standards mainly apply to discriminating acute gout patients from healthy population, and some of the diagnostic bases depend on subjective symptoms of patients. Clinically, lots of gout patients cannot always follow the medical order for urate-lowering or anti-inflammatory therapies, since there is no discomfort of typical clinical episodes most of the time. As a result, the irrational drug uses increase the risk of recurrent attack of gout flares or even lead to the occurrences of complications. If there were more precise diagnostic criteria to decide whether gout patients are at the acute stage of gout, doctors could instruct the medication with objective evidences to enhance the compliance of patients and improve their life quality.
Since combination of different indexes may contribute to elevation of sensitivity and specificity in diagnostic process,42–44 we respectively compared the diagnostic efficacy in acute gout for single index and multiple indexes of peripheral blood cells and inflammatory cytokines. By ROC curve analysis, we discovered that the AUCs for joint application of multiple peripheral blood cells exceeded the AUCs for each single peripheral blood cell in the diagnosis of acute gout. Similarly, the AUCs for joint application of multiple inflammatory cytokines exceeded the AUCs for each single inflammatory cytokine in the diagnosis of acute gout. Thus, the combination of multiple indexes of peripheral blood cells and inflammatory cytokines can both improve the accuracy of acute gout. Furthermore, by comparison, we found that the AUCs for joint application of multiple inflammatory cytokines also exceeded the AUCs for joint application of multiple peripheral blood cells, suggesting the combination of multiple inflammatory cytokines more effective than peripheral blood cells in diagnosis of acute gout. The above findings reveal the highest diagnostic efficiency in gout flare for joint application of multiple inflammatory cytokines in comparison with other three methods, including single peripheral blood cell, joint application of multiple peripheral blood cells, and single inflammatory cytokine. Accordingly, the measurement of multiple inflammatory cytokines and their joint analysis can largely contribute to differentiation between acute and remission gout.
In clinical work, the peripheral blood cell examination belongs to blood routine, one of the most common laboratory indicators, while inflammatory cytokine detection is less commonly used. Our results demonstrate that it is necessary for gout patients to routinely measure the serum levels of multiple inflammatory cytokines such as CRP, IL-1β, IL-6 and TNF-α, which may provide objective and precise bases for distinguishment between acute and remission gout. Additionally, the joint application of multiple inflammatory cytokines can evaluate the level of inflammation and instruct the anti-inflammatory therapies in acute gout.
There are some limitations in this study. Firstly, it is a retrospective study, whose findings should be validated in later prospective cohorts. Secondly, we only selected male gout patients here due to much higher prevalence of gout in men, and whether the results are applicable to female gout patients need to be clarified in an independent study. Last but not least, the kinds of inflammatory cytokines in this study are limited, and more inflammatory cytokines ought to be detected and analyzed in the future so that their sensitivity and specificity in diagnosis of acute gout can be further improved.
Conclusion
In summary, joint application of multiple inflammatory cytokines can notably increase the diagnostic accuracy of gout flare compared with peripheral blood cells, and inflammatory cytokine detection is necessary to be incorporated into routine examination of gout patients clinically.
Disclosure
The authors declare no conflicts of interest in this work.
References
1. Dalbeth N, Choi HK, Joosten LAB, et al. Gout. Nat Rev Dis Primers. 2019;5(1):69. doi:10.1038/s41572-019-0115-y
2. Dehlin M, Jacobsson L, Roddy E. Global epidemiology of gout: prevalence, incidence, treatment patterns and risk factors. Nat Rev Rheumatol. 2020;16(7):380–390. doi:10.1038/s41584-020-0441-1
3. Mattiuzzi C, Lippi G. Recent updates on worldwide gout epidemiology. Clin Rheumatol. 2020;39(4):1061–1063. doi:10.1007/s10067-019-04868-9
4. Taylor WJ, Fransen J, Jansen TL, et al. Study for updated gout classification criteria: identification of features to classify gout. Arthritis Care Res. 2015;67(9):1304–1315. doi:10.1002/acr.22585
5. Narang RK, Dalbeth N. Pathophysiology of gout. Semin Nephrol. 2020;40(6):550–563. doi:10.1016/j.semnephrol.2020.12.001
6. Martinon F, Petrilli V, Mayor A, Tardivel A, Tschopp J. Gout-associated uric acid crystals activate the NALP3 inflammasome. Nature. 2006;440(7081):237–241. doi:10.1038/nature04516
7. Cronstein BN, Sunkureddi P. Mechanistic aspects of inflammation and clinical management of inflammation in acute gouty arthritis. J Clin Rheumatol. 2013;19(1):19–29. doi:10.1097/RHU.0b013e31827d8790
8. Scanu A, Oliviero F, Ramonda R, Frallonardo P, Dayer JM, Punzi L. Cytokine levels in human synovial fluid during the different stages of acute gout: role of transforming growth factor beta1 in the resolution phase. Ann Rheum Dis. 2012;71(4):621–624. doi:10.1136/annrheumdis-2011-200711
9. Bertazzo A, Punzi L, Bertazzolo N, et al. Tryptophan catabolism in synovial fluid of various arthropathies and its relationship with inflammatory cytokines. Adv Exp Med Biol. 1999;467:565–570. doi:10.1007/978-1-4615-4709-9_70
10. Guerne PA, Terkeltaub R, Zuraw B, Lotz M. Inflammatory microcrystals stimulate interleukin-6 production and secretion by human monocytes and synoviocytes. Arthritis Rheum. 1989;32(11):1443–1452. doi:10.1002/anr.1780321114
11. McNearney T, Baethge BA, Cao S, Alam R, Lisse JR, Westlund KN. Excitatory amino acids, TNF-alpha, and chemokine levels in synovial fluids of patients with active arthropathies. Clin Exp Immunol. 2004;137(3):621–627. doi:10.1111/j.1365-2249.2004.02563.x
12. Zeng M, Dang W, Chen B, et al. IL-37 inhibits the production of pro-inflammatory cytokines in MSU crystal-induced inflammatory response. Clin Rheumatol. 2016;35(9):2251–2258. doi:10.1007/s10067-015-3109-5
13. Cavalcanti NG, Marques CD, Lins ELTU, et al. Cytokine profile in gout: inflammation driven by IL-6 and IL-18? Immunol Invest. Jul. 2016;45(5):383–395. doi:10.3109/08820139.2016.1153651
14. Martin WJ, Grainger R, Harrison A, Harper JL. Differences in MSU-induced superoxide responses by neutrophils from gout subjects compared to healthy controls and a role for environmental inflammatory cytokines and hyperuricemia in neutrophil function and survival. J Rheumatol. 2010;37(6):1228–1235. doi:10.3899/jrheum.091080
15. Horvathova V, Bohata J, Pavlikova M, et al. Interaction of the p.Q141K variant of the ABCG2 gene with clinical data and cytokine levels in primary hyperuricemia and gout. J Clin Med. 2019;8(11):65. doi:10.3390/jcm8111965
16. Kim KW, Kim BM, Lee KA, Kim HS, Lee SH, Kim HR. Reciprocal interaction between macrophage migration inhibitory factor and interleukin-8 in gout. Clin Exp Rheumatol. 2019;37(2):270–278.
17. Neogi T, Jansen TL, Dalbeth N, et al. 2015 Gout classification criteria: an American College of Rheumatology/European League Against Rheumatism collaborative initiative. Ann Rheum Dis. 2015;74(10):1789–1798. doi:10.1136/annrheumdis-2015-208237
18. Dalbeth N, Stamp L. Hyperuricaemia and gout: time for a new staging system? Ann Rheum Dis. 2014;73(9):1598–1600. doi:10.1136/annrheumdis-2014-205304
19. Stevens LA, Claybon MA, Schmid CH, et al. Evaluation of the Chronic Kidney Disease Epidemiology Collaboration equation for estimating the glomerular filtration rate in multiple ethnicities. Kidney Int. 2011;79(5):555–562. doi:10.1038/ki.2010.462
20. Wagner DD, Burger PC. Platelets in inflammation and thrombosis. Arterioscler Thromb Vasc Biol. 2003;23(12):2131–2137. doi:10.1161/01.ATV.0000095974.95122.EC
21. Semple JW, Italiano JE, Freedman J. Platelets and the immune continuum. Nat Rev Immunol. 2011;11(4):264–274. doi:10.1038/nri2956
22. Franco AT, Corken A, Ware J. Platelets at the interface of thrombosis, inflammation, and cancer. Blood. 2015;126(5):582–588. doi:10.1182/blood-2014-08-531582
23. Wu H, Zhou H, Chen P. Correlation of neutrophil-lymphocyte ratio (NLR), platelet-lymphocyte ratio (PLR), and mean platelet volume (MPV) with gout activity: a monocentric and retrospective study. Medicine. 2022;101(35):e30242. doi:10.1097/MD.0000000000030242
24. Conway R, Murphy CL, Madigan A, et al. Increased platelet reactivity as measured by plasma glycoprotein VI in gout. Platelets. 2018;29(8):821–826. doi:10.1080/09537104.2017.1366974
25. Rhodes B, Furnrohr BG, Vyse TJ. C-reactive protein in rheumatology: biology and genetics. Nat Rev Rheumatol. 2011;7(5):282–289. doi:10.1038/nrrheum.2011.37
26. Gabay C, Lamacchia C, Palmer G. IL-1 pathways in inflammation and human diseases. Nat Rev Rheumatol. 2010;6(4):232–241. doi:10.1038/nrrheum.2010.4
27. Dinarello CA. The interleukin-1 family: 10 years of discovery. FASEB J. 1994;8(15):1314–1325. doi:10.1096/fasebj.8.15.8001745
28. Jacques C, Gosset M, Berenbaum F, Gabay C. The role of IL-1 and IL-1Ra in joint inflammation and cartilage degradation. Vitam Horm. 2006;74:371–403. doi:10.1016/S0083-6729(06)74016-X
29. Dinarello CA. Biologic basis for interleukin-1 in disease. Blood. 1996;87(6):2095–2147. doi:10.1182/blood.V87.6.2095.bloodjournal8762095
30. Akira S, Taga T, Kishimoto T. Interleukin-6 in biology and medicine. Adv Immunol. 1993;54:1–78. doi:10.1016/s0065-2776(08)60532-5
31. Zelova H, Hosek J. TNF-alpha signalling and inflammation: interactions between old acquaintances. Inflamm Res. 2013;62(7):641–651. doi:10.1007/s00011-013-0633-0
32. Roseff R, Wohlgethan JR, Sipe JD, Canoso JJ. The acute phase response in gout. J Rheumatol. 1987;14(5):974–977.
33. Tang H, Zhao Y, Tan C, Liu Y. Significance of serum markers and urinary microalbumin in the diagnosis of early renal damage in patients with gout. Clin Lab. 2021;67(5):56. doi:10.7754/Clin.Lab.2020.200722
34. Ma Y, Yin Z, Dai H, et al. Increased metallothionein-1 associated with gout activity and tophi. Immunol Invest. 2023:1–13. doi:10.1080/08820139.2023.2173078
35. Jiang X, Li M, Yang Q, Du L, Du J, Zhou J. Oxidized low density lipoprotein and inflammation in gout patients. Cell Biochem Biophys. 2014;69(1):65–69. doi:10.1007/s12013-013-9767-5
36. Vitek L, Jiraskova A, Malikova I, et al. Serum bilirubin and markers of oxidative stress and inflammation in a healthy population and in patients with various forms of atherosclerosis. Antioxidants. 2022;11(11):543. doi:10.3390/antiox11112118
37. Zhou ZX, Chen JK, Hong YY, et al. Relationship between the serum total bilirubin and inflammation in patients with psoriasis vulgaris. J Clin Lab Anal. 2016;30(5):768–775. doi:10.1002/jcla.21936
38. Inoguchi T, Sonoda N, Maeda Y. Bilirubin as an important physiological modulator of oxidative stress and chronic inflammation in metabolic syndrome and diabetes: a new aspect on old molecule. Diabetol Int. 2016;7(4):338–341. doi:10.1007/s13340-016-0288-5
39. Wallace SL, Robinson H, Masi AT, Decker JL, McCarty DJ, Yu TF. Preliminary criteria for the classification of the acute arthritis of primary gout. Arthritis Rheum. 1977;20(3):895–900. doi:10.1002/art.1780200320
40. Janssens HJ, Fransen J, van de Lisdonk EH, van Riel PL, van Weel C, Janssen M. A diagnostic rule for acute gouty arthritis in primary care without joint fluid analysis. Arch Intern Med. 2010;170(13):1120–1126. doi:10.1001/archinternmed.2010.196
41. Pelaez-Ballestas I, Hernandez Cuevas C, Burgos-Vargas R, et al. Diagnosis of chronic gout: evaluating the American College of Rheumatology Proposal, European League Against Rheumatism recommendations, and clinical judgment. J Rheumatol. 2010;37(8):1743–1748. doi:10.3899/jrheum.091385
42. Lu ZL, Chen YJ, Jing XY, Wang NN, Zhang T, Hu CJ. Detection and identification of serum peptides biomarker in papillary thyroid cancer. Med Sci Monit. 2018;24:1581–1587. doi:10.12659/msm.907768
43. Enroth S, Berggrund M, Lycke M, et al. High throughput proteomics identifies a high-accuracy 11 plasma protein biomarker signature for ovarian cancer. Commun Biol. 2019;2:221. doi:10.1038/s42003-019-0464-9
44. Zha X, Yang B, Xia G, Wang S. Combination of uric acid and pro-inflammatory cytokines in discriminating patients with gout from healthy controls. J Inflamm Res. 2022;15:1413–1420. doi:10.2147/JIR.S357159
 © 2023 The Author(s). This work is published and licensed by Dove Medical Press Limited. The full terms of this license are available at https://www.dovepress.com/terms.php and incorporate the Creative Commons Attribution - Non Commercial (unported, v3.0) License.
By accessing the work you hereby accept the Terms. Non-commercial uses of the work are permitted without any further permission from Dove Medical Press Limited, provided the work is properly attributed. For permission for commercial use of this work, please see paragraphs 4.2 and 5 of our Terms.
© 2023 The Author(s). This work is published and licensed by Dove Medical Press Limited. The full terms of this license are available at https://www.dovepress.com/terms.php and incorporate the Creative Commons Attribution - Non Commercial (unported, v3.0) License.
By accessing the work you hereby accept the Terms. Non-commercial uses of the work are permitted without any further permission from Dove Medical Press Limited, provided the work is properly attributed. For permission for commercial use of this work, please see paragraphs 4.2 and 5 of our Terms.