")
Back to Journals » Journal of Inflammation Research » Volume 14
iTRAQ and PRM-Based Proteomic Analysis Provides New Insights into Mechanisms of Response to Triple Therapy in Patients with Rheumatoid Arthritis
Authors Chen J, Li S, Ge Y , Kang J, Liao JF, Du JF, Tian J, Xie X , Li F
Received 28 September 2021
Accepted for publication 8 December 2021
Published 18 December 2021 Volume 2021:14 Pages 6993—7006
DOI https://doi.org/10.2147/JIR.S340351
Checked for plagiarism Yes
Review by Single anonymous peer review
Peer reviewer comments 4
Editor who approved publication: Professor Ning Quan
Jian Chen, Shu Li, Yan Ge, Jin Kang, Jia-fen Liao, Jin-feng Du, Jing Tian, Xi Xie, Fen Li
Department of Rheumatology and Immunology, The Second Xiangya Hospital of Central South University, Changsha, Hunan, People’s Republic of China
Correspondence: Fen Li
Department of Rheumatology and Immunology, The Second Xiangya Hospital of Central South University, No. 139 Ren Min Middle Road, Changsha, 410011, People’s Republic of China
Email [email protected]
Background: Approximately 30% of patients with rheumatoid arthritis (RA) respond poorly to combination therapy of multiple drugs. The molecular mechanisms of different responses to methotrexate + leflunomide + infliximab therapy in patients with RA were explored in this study.
Methods: Infliximab was administered to patients with RA whose disease activity score was higher than 5.1 after 1 month of combination therapy with methotrexate and leflunomide. After 14 weeks of undergoing triple therapy, patients with RA were classified as responders and non-responders. Protein profiles at baseline and 14th week were investigated via isobaric tags for relative and absolute quantification (iTRAQ), and proteins with significant differences ≥ 1.2 folds change or ≤ 0.8 folds change were defined as differentially expressed proteins (DEPs). Overlapping DEPs between responders and non-responders were confirmed by parallel reaction monitoring (PRM). Bioinformatic analyses were performed for DEPs.
Results: The results revealed 5 non-responders (NRs) and 15 responders (Rs). iTRAQ analysis indicated 13 overlapping DEPs and included 6 opposite change DEPs such as testicular tissue protein Li 70, cofilin 1, fibrinogen beta chain, galectin-10, serotransferrin (TF) and albumin. The difference in serotransferrin between responders and non-responders confirmed by PRM was significant. Verification by PRM indicated that TF was elevated in the Rs group and was reduced in the NRs group. Bioinformatic analysis indicated that serotransferrin was involved in the hypoxia-inducible factor-1 pathway and ferroptosis.
Conclusion: Serotransferrin-related molecular mechanism may be a new direction to study refractory RA.
Keywords: rheumatoid arthritis, proteomics, effectiveness, disease modifying antirheumatic drugs, serotransferrin
Introduction
Rheumatoid arthritis (RA) is a chronic autoimmune inflammatory disease with manifestations such as irreversible peripheral joint destruction and functional loss.1 In the past decades, clinical outcomes of RA have been greatly improved by the application of immune-targeted therapy.2,3 Conventional synthetic disease-modifying antirheumatic drugs (csDMARDs) represented by methotrexate (MTX) are the cornerstone of the therapeutics of RA. As one of the biological disease-modifying antirheumatic drugs (bDMARDs), infliximab (IFX) is recommended as a second-line drug to patients who fail to respond to csDMARDs.4 However, approximately 30% of patients respond poorly to IFX.5 Considering the uncertainty of treatment effect and high cost, it is necessary to identify biomarkers that can predict the treatment effect of bDMARDs.6 Simultaneously, the resistance mechanism of non-responders to IFX remains unclear except for the influence of drug concentrations and anti-drug antibodies.7
Quantitative proteomic approaches are widely applied for investigating the therapeutic mechanisms of drugs.8 Owing to higher accuracy and reproducibility in protein quantitation, isobaric tags for relative and absolute quantification (iTRAQ) and parallel reaction monitoring (PRM) have emerged as promising tools for comparative proteomic analysis.9,10 However, their high cost greatly limits their wide application.11 Currently, bDMARDs are recommended for refractory RA with higher disease activity in China. We designed a clinical trial, “Predictability Studies on the Efficacy of TNF-α Inhibitors in Chinese RA from Real World” (ID: NCT02878161), in which IFX was administered to patients whose disease activity score of 28 joints for C reactive protein (DAS28-CRP) remained higher than 5.1 after 1 month of combination therapy of MTX and leflunomide (LEF). The purpose of this clinical trial was to guide therapeutic choices and probe into mechanisms related to the variability of the drug’s efficacy. The initial results of comparative proteomic analysis were used to screen for predictive biomarkers to distinguish responders (Rs) from non-responders (NRs) before triple therapy were published in 2019.12 The second parts of results from the comparative proteomic analysis were deeply discussed in this study. In this paper our study compared proteins that were significantly changed after 14 weeks of combination treatment of MTX + LEF + IFX between the NRs and Rs group to determine the underlying mechanisms of different efficacy. This study primarily focused on analyzing differentially expressed proteins (DEPs) and identifying mechanisms leading to differences in drug efficacy between NRs and Rs.
Materials and Methods
Clinical Trial Design
Briefly, patients with RA who met the 2019 ACR/EULAR classification criteria were enrolled from the inpatient department of Rheumatology and Immunology, Second Xiangya Hospital, Central South University.13 IFX was administered to patients whose DAS28-CRP remained higher than 5.1 after 1 month of combination therapy of MTX and LEF. After 14 weeks of treatment with MTX + LEF + IFX, all patients (n = 20) were classified as good responders (GRs) (n = 9), moderate responders (MRs) (n = 6) or non-responders (NRs) (n = 5) according to the EULAR response criteria based on DAS28-CRP.14 Rs was the sum of GRs and MRs. Clinical and demographic characteristics including age, sex, disease duration, tender joint count (TJC), swollen joint count (SJC), pain visual analogue scale (VAS), patient’s global assessment (PtGA), physician’s global assessment (PGA), health assessment questionnaire (HAQ), erythrocyte sedimentation rate (ESR), C reactive protein (CRP), albumin (ALB), rheumatoid factor positive rate (RF+%), anti-cyclic citrullinated peptide antibody-positive rate (anti-CCP+%), DAS28-CRP, DAS28-ESR, clinical disease activity index (CDAI) and simplified disease activity index (SDAI) were all observed. The exclusion criteria were as follows: i) patients with systemic disease, ii) patients with malignancies, iii) patients with loss of mobility and iv) patients with abnormal experimental examination results as listed in ClinicalTrials.gov (ID: NCT02878161). All 20 included patients signed the written informed consent forms, and the medical ethics committee of the Second Xiangya Hospital approved the trial (XYEYY-GZ81571599-20160118-1). This study was conducted following the Declaration of Helsinki.
The workflow of the study is presented in Figure 1. A total of 5 NRs and 15 Rs were enrolled in quantitative proteomic analysis. Serum proteins of four NRs and four Rs at weeks 0 and 14 were separately mixed and screened by iTRAQ. Proteins whose ratio compared at weeks 0 and 14 was ≥1.2 or ≤0.8 folds change with statistical significance were defined as DEPs. Bioinformatic analyses using GO and KEGG were performed. Subsequently, DEPs overlapping between Rs and NRs from iTRAQ were then selected for technical feasibility analysis and were finally confirmed through PRM using samples of 0 and 14 weeks for all 20 patients. KEGG analysis was performed on statistically significant overlapping DEPs to investigate molecular mechanisms of resistance to MTX + LEF + IFX therapy in patients with RA.
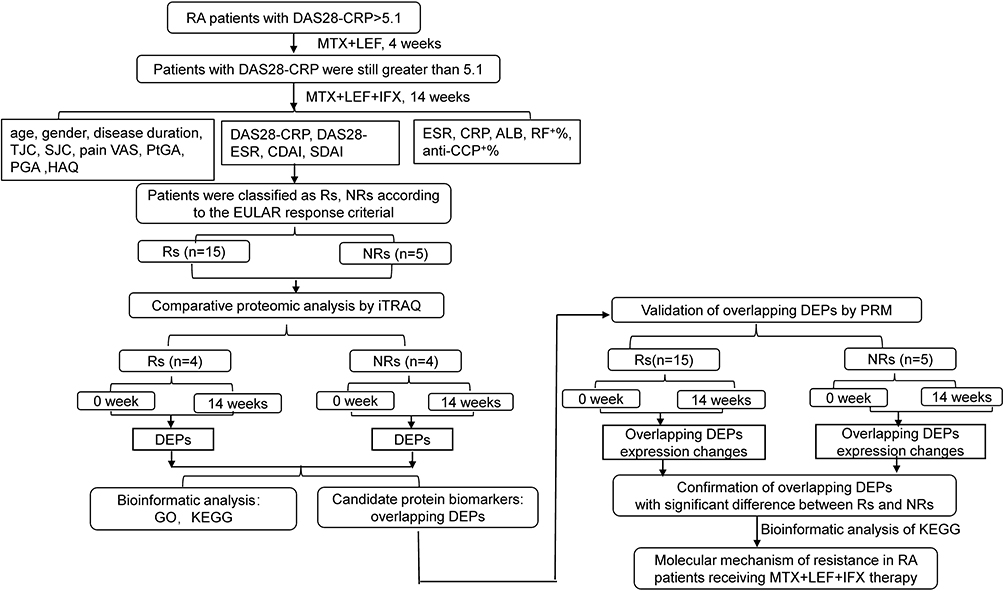 |
Figure 1 The workflow of study was displayed. Abbreviations: ALB, albumin; anti-CCP, anti-cyclic citrullinated peptide antibody positive rate; CRP, C reactive protein; CDAI, clinical disease activity index; DAS28-CRP, disease activity score of 28 joints for C reactive protein; DAS28-ESR, disease activity score of 28 joints for erythrocyte sedimentation rate; DEPs, differentially expressed proteins; ESR, erythrocyte sedimentation rate; HAQ, health assessment questionnaire; iTRAQ, isobaric tags for relative and absolute quantification; NRs, non-responders; PGA, physician’s global assessment; PtGA, patient’s global assessment; PRM, parallel reaction monitoring; RF, rheumatoid factor; Rs, responders; SDAI, simplified disease activity index; SJC, swollen joint count; TJC, tender joint count; VAS, visual analogue scale. |
DEPs Screened by iTRAQ
Preparation of Serum Peptide
Serum peptides were analysis in serum samples at weeks 0 and 14. The 14 most abundant proteins were removed using the Agilent Human 14 Multiple Affinity Removal System Column (Agilent Technologies, Wilmington), and low abundance proteins were collected. The level of proteins was measured using the BCA protein assay kit (Bio-Rad, USA), and the composition was identified via separation on 12.5% sodium dodecyl sulphate-polyacrylamide gels. Subsequently, the proteins were digested into peptides via filter-aided proteome preparation (FASP),15 desalted on C18 Cartridges (Empore SPE Cartridges C18, Sigma), concentrated by vacuum centrifugation, reconstituted in 0.1% (v/v) formic acid and measured under UV light at 280 nm.
Peptides Labelled by iTRAQ
iTRAQ experiments were conducted to quantify peptide mixtures from four patients of the same group. According to the manufacturer’s instructions, peptides were labelled with 4-plex iTRAQ reagents (Applied Biosystems) in which each iTRAQ reagent consisted of three different components as follows: a reporter group (with a variable mass in the range of 114–117 amu), a balanced group, and an amine reactive group. The iTRAQ/isopropanol reagents were mixed with peptides/TEAB solution and incubated for 2 h at 37 °C.
Peptide Fractionation by Strong Cation Exchange (SCX) Chromatography
iTRAQ-labelled peptides were fractionated via SCX chromatography on an AKTA purifier system (GE Healthcare). The peptides were reconstituted, acidified and separated using reagent A (10-mM KH2PO4 in 25% of ACN, pH 3.0) and reagent B (500-mM KCl, 10-mM KH2PO4 in 25% of ACN, pH 3.0).16 Furthermore, fractionated peptide mixtures were continuously collected every 1 min in a 58-min eluting process, combined into 30 pools, desalted on C18 cartridges, concentrated by vacuum, reconstituted in 0.1% formic acid and stored at −80 °C.
High-Performance Liquid Chromatography-MS/MS (HPLC-MS/MS)
HPLC-MS/MS was performed using an Easy nLC system (Thermo Fisher Scientific) coupled with Q Exactive mass spectrometer (Thermo Scientific). The peptide mixture was loaded onto a reverse-phase trap column (Thermo Scientific Acclaim PepMap100, 100 μm*2 cm, nano Viper C18), connected to a C18 reversed-phase analytical column (Thermo Scientific Easy Column) and then separated by different linear gradients buffer composed of buffer A (0.1% formic acid) and buffer B (84% acetonitrile and 0.1% formic acid) at a flow rate of 300 nL/min within 60 min.16
Identification of DEPs
Analysis of MS/MS raw spectra was performed using MASCOT 2.2 engine (Matrix Science, UK) embedded into Proteome Discoverer 1.4 software (Thermo Scientific, USA)17 against the UniprotKB human database (154,711 total entries, http://www.uniprot.org, Accessed 5 January 2017). The mass spectrometer was set at positive ion mode. Peptide mass tolerance was defined as ± 20 ppm, and the fragment mass tolerance was set as 0.1 Da. Proteins with at least one peptide above 95% confidence level and a threshold of false discovery rate (FDR) set to 0.01 were identified.18 The ratio of relative abundance for proteins at weeks 14 and 0 was calculated, and proteins whose ratio were ≥1.2 or ≤0.8 folds were subjected to statistical analysis by significance A using Perseus, and proteins with P ≤ 0.05 were considered as DEPs.
DEPs Verified by PRM
PRM was performed on a Q-Exactive mass spectrometer coupled with equipment of Easy nLC system. Tryptic peptides of each sample were mixed with the equivalent heavy isotope AQUA peptide (as an internal standard) and loaded onto a trap column to connect with C18 reversed-phase analytical column (Thermo Scientific Easy Column). Furthermore, they were separated by different linear gradients buffers composed of buffer A (0.1% formic acid) and buffer B (84% acetonitrile and 0.1% formic acid) at a flow rate of 250 nL/min for 1 hour. Thereafter, each sample was analysis on a Q-Exactive Plus mass spectrometer (Thermo Scientific) with parameters set as follows: full MS scan set to 300–1800 m/z, positive ion mode, orbitrap resolution set to 6000 (at m/z 200), automatic gain control (AGC) value set to 3e6 and maximum ion injection time (IT) set to 200 ms. Eventually, MS-MS was performed with scans from 350 to 900 m/z, orbitrap resolution of 3000 (at m/z 200) and isolation window for target precursor ions of 1.6 Th. Precursor ions were fragmented through HCD with normalized collision energies of 27 eV. ACG target value was 3e6, and maximum IT was 120 ms. Raw data were analysis using the Skyline software (MacCoss Lab, University of Washington, V.1.6). The mass spectrometry proteomic data were deposited to the ProteomeXchange Consortium via the PRIDE partner repository with the dataset identifier PXD010378.
Bioinformatic Analysis and Statistical Analysis
Statistical analysis was performed using SPSS Statistics for Windows version 20.0 (IBM Corp., Armonk, NY, USA). Briefly, quantitative data were expressed as mean ± standard deviation (SD), and count data were expressed as n (%). Comparisons were performed using independent t-test or Mann–Whitney test (Supplement Table 1 and Figure 3A). For the results of ITRAQ, hierarchical clusters of DEPs were processed using Cluster 3.0 (http://bonsai.hgc.jp/∼mdehoon/software.htm) and Java Treeview software (http://jtreeview.sourceforge.net). Functional annotations with Gene Ontology (GO) were conducted using the Blast2GO (Version 3.3.5) program. Pathway analysis with Kyoto Encyclopedia of Genes and Genomes (KEGG) was performed using the KEGG database (http://www.genome.jp/kegg/). The results of PRM revealed that expression changes in the relative abundance of DEPs between NRs and Rs group were compared, and KEGG pathway analysis was performed. P-value < 0.05 was considered statistically significant.
Results
Clinical Characteristics
Clinical indices including age (year), disease duration (year) and DAS28-CRP (score) before triple treatment in the NRs group (47.80 ± 7.66, 5.70 ± 3.23 and 5.86 ± 0.19) were similar to those in the Rs group (49.66 ± 10.15, 5.57 ± 2.43 and 5.77 ± 0.3), and male/female distribution had no significant difference between the two groups. The main clinical data including TJC, SJC, PGA, PtGA, HAQ and four DAS indices at week 0 showed no significant differences between the NRs and Rs group; however, there were significant differences after 14 weeks of triple treatment (Supplement Table 1).
Quantitative Proteomic Analysis via iTRAQ and Functional Significance and Pathway Analyses
A total of 590 proteins with characteristics of at least two peptides and their 95% confidence intervals were identified via iTRAQ–mass spectrometry with LC-MS/MS. Proteins with fold change ≥1.2 or ≤0.8 at weeks 0 and 14 and P < 0.05 were considered DEPs. Consequently, there were 56 DEPs in the Rs group including 26 up-regulated and 30 down-regulated proteins (Table 1), whereas there were 62 DEPs in the NRs group including 41 up-regulated and 21 down-regulated proteins (Table 2).
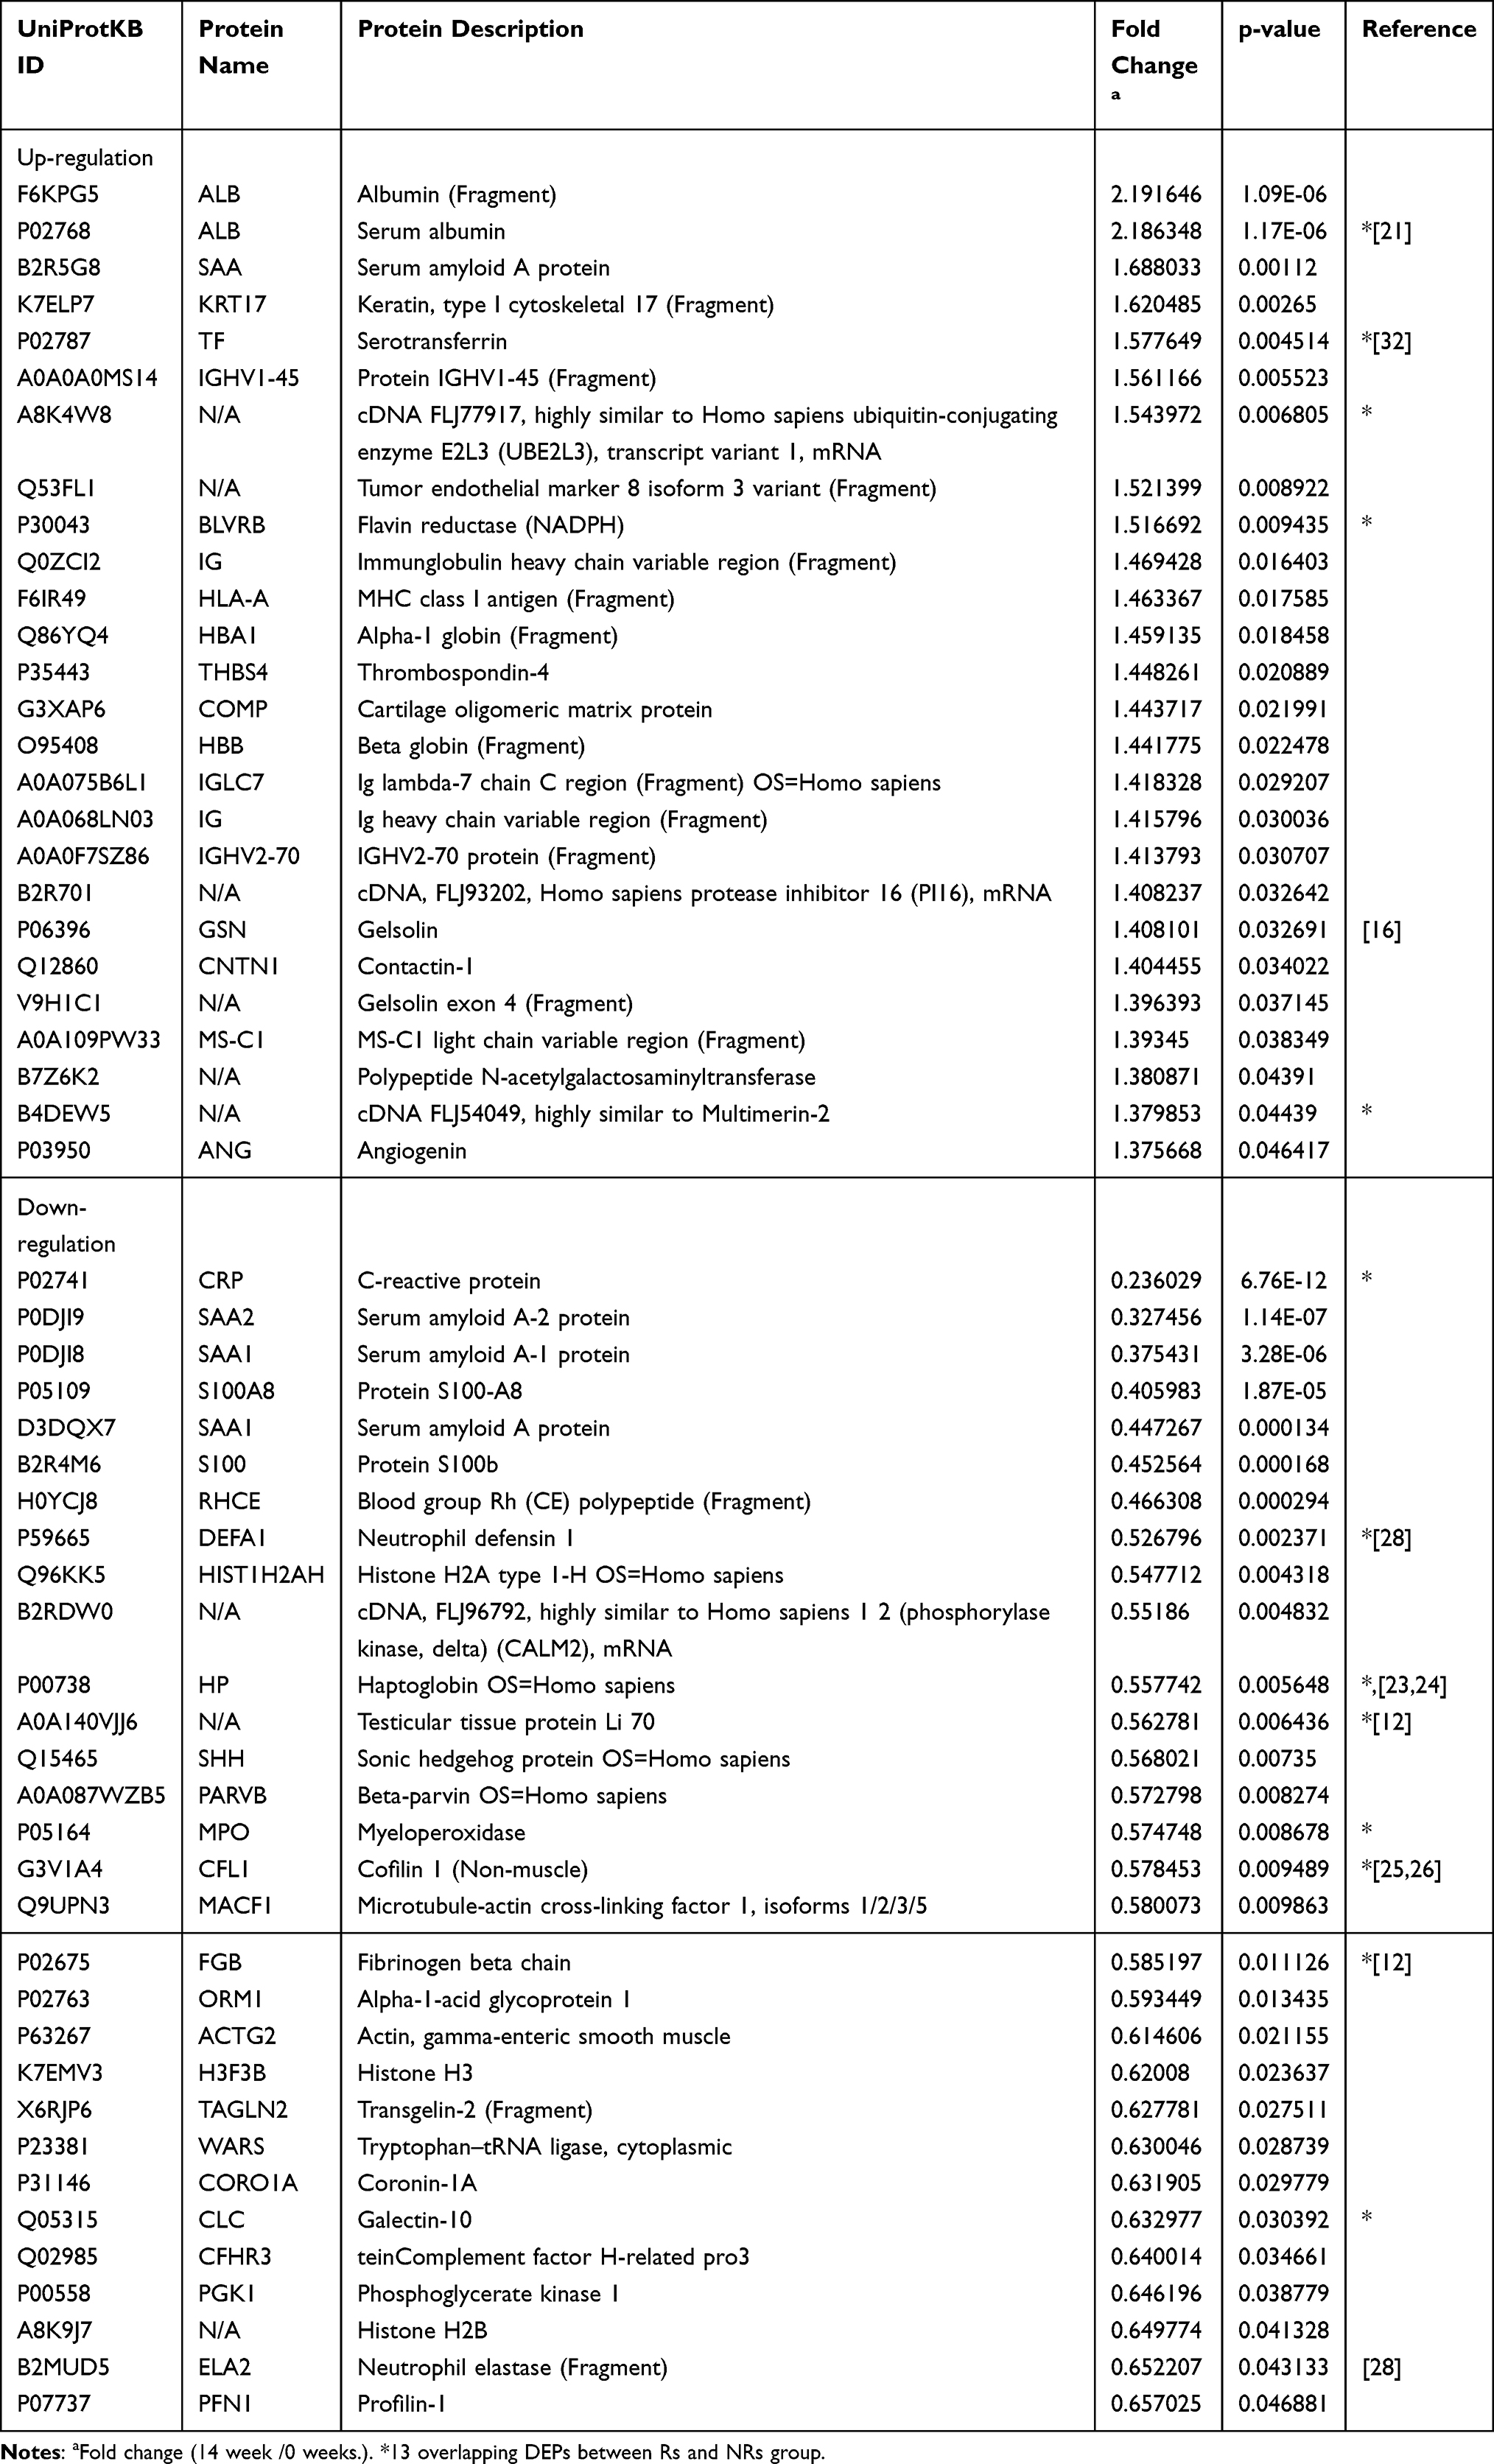 |
Table 1 Differentially Expressed Proteins in Responders Compared Between 0 Week and 14 Weeks’ Treatment |
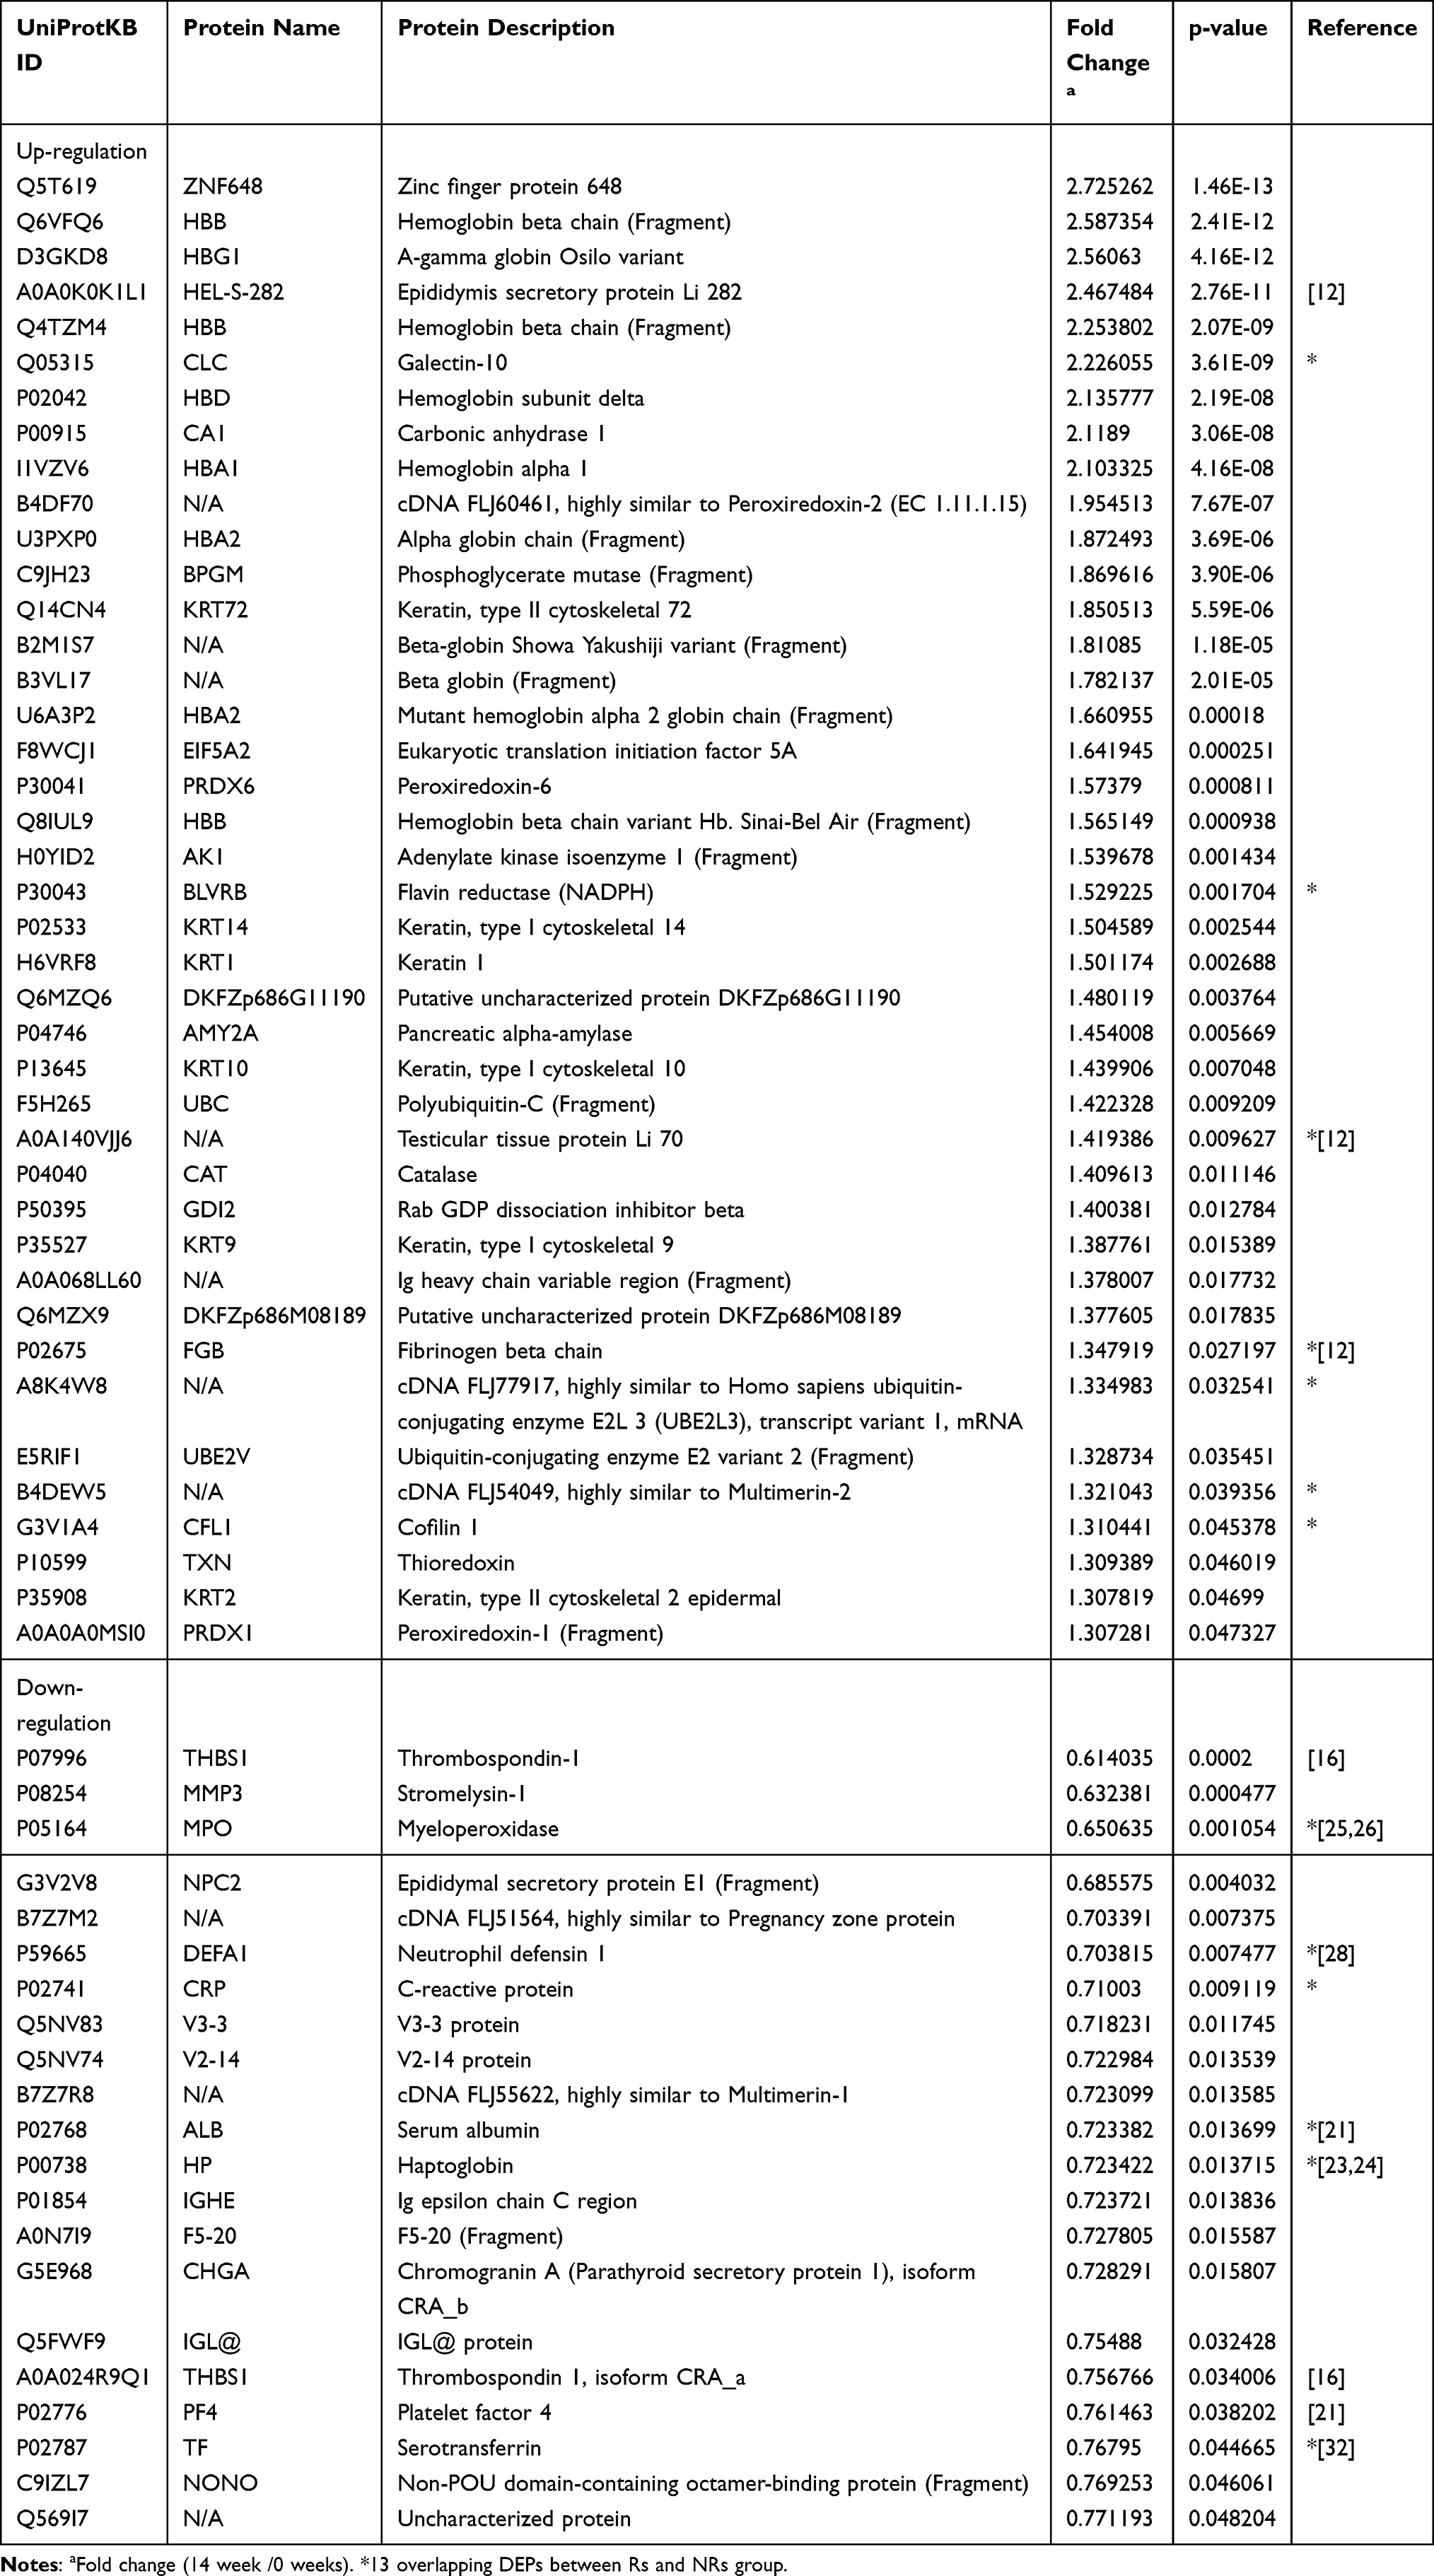 |
Table 2 Differentially Expressed Proteins in Non-Responders Compared Between 0 Week and 14 Weeks’ Treatment |
Proteins with significant differences in abundance (P-value<0.05) between the Rs and NRs group were presented in a hierarchical cluster (Figure 2A). The functional significance of DEPs identified via iTRAQ was analysis through GO classification using the following three terms: biological process (BP), molecular function (MF) and cellular component (CC) (Figure 2B). For BP categories, the top three enriched categories for the Rs Group were positive regulation of protein metabolic process, positive regulation of cellular protein metabolic process and response to a metal ion. Furthermore, the response to an inorganic substance, response to oxidative stress and metabolic process of reactive oxygen species were the top three enriched BP categories for the NRs group. For MF classification, anion, cytoskeletal protein and glycosaminoglycan binding were the three major functional classes of DEPs of the Rs group, whereas the top three enriched MF categories for the NRs group were oxidoreductase, antioxidant and peroxidase activities. As for CC classification, DEPs in the Rs group were enriched in intracellular, organelle part and intracellular non-membrane-bound organelle, whereas most EDPs in the NRs group were components of cytosol, cytoplasmic vesicle lumen and vesicle lumen.
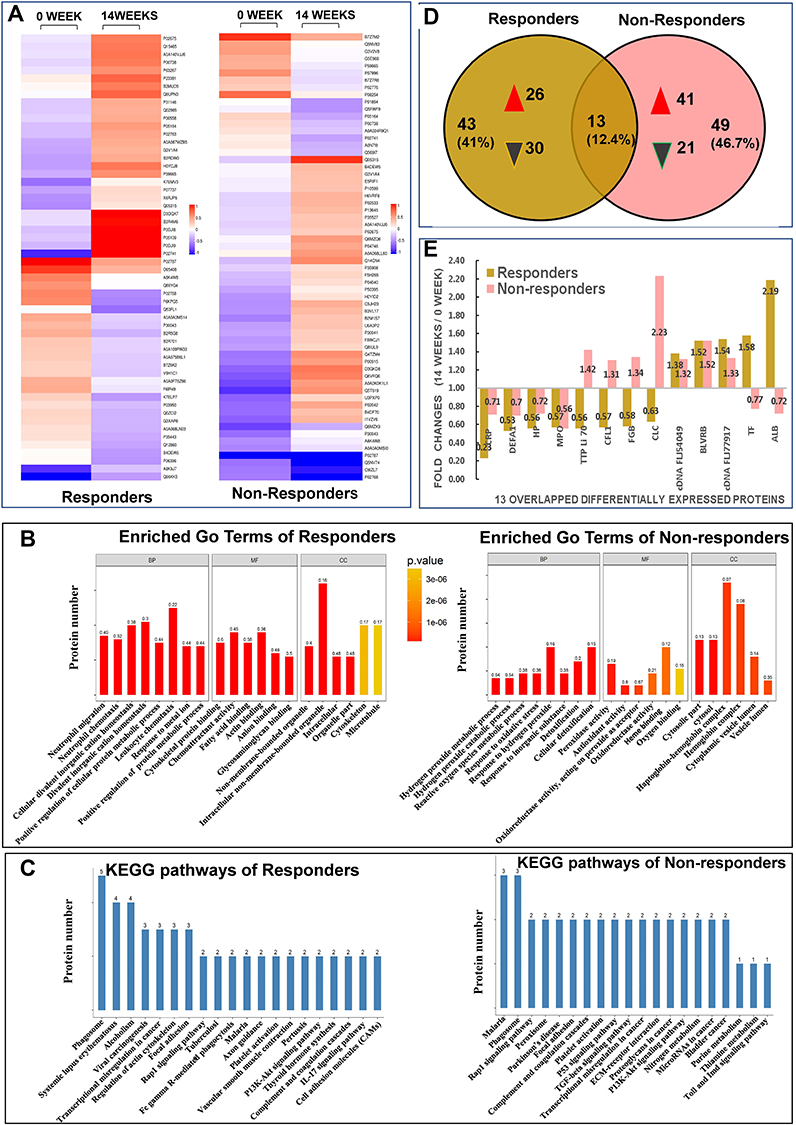 |
Figure 2 Results from quantitative proteomic analysis screened from iTRAQ were displayed. (A) hierarchical cluster of DEPs were showed; left column was results from responders compared between weeks 14 and 0; right column was results from non-responders compared between weeks 14 and 0. (B) enriched GO terms of DEPs were showed; left panel was results from responders, right panel was results from non-responders. (C) KEGG pathways of DEPs were showed; left panel was results from responders, right panel was results from non-responders. (D) Venn diagrams of DEPs between responders and non-responders were conducted. There were 13 overlapping DEPs between 2 groups. (E) fold changes (14 weeks/0 week) of all 13 overlapping DEPs between responders and non-responders were showed. Abbreviations: ALB, albumin; BP, biological process; BLVRB, flavin reductase NADPH; CC, cellular component; cDNA FLJ54049, highly similar to multimerin-2; cDNA FLJ77917, highly similar to Homo sapiens ubiquitin-conjugating enzyme E2L3; CFL, cofilin 1; CLC, galectin-10; DEFA1, neutrophil defensin 1; DEPs, differentially expressed proteins; FGB, fibrinogen beta chain; GO, gene ontology; HP, haptoglobin; iTRAQ, isobaric tags for relative and absolute quantification; Kyoto encyclopedia of genes and genome, KEGG; MF, molecular function; MPO, myeloperoxidase; TF, serotransferrin; TTP Li70, testicular tissue protein Li 70. |
To reveal the mechanisms underlying different responses to MTX + LEF + IFX triple therapy, KEGG analysis was performed. The 56 DEPs from the Rs group were mapped to 88 pathways; the top 20 enriched pathways and the number of DEPs were presented in Figure 2C. Moreover, 5 of the 88 KEGG pathways were significantly enriched, including alcoholism, phagosome, vascular smooth muscle contraction, transcriptional mis-regulation in cancer and viral carcinogenesis. The 62 DEPs from the NRs group were mapped to 64 KEGG pathways. Figure 2C presents the top 20 enriched pathways. Pathways involved in nitrogen metabolism, peroxisome, Parkinson’s disease, malaria, p53 and TGF-beta were significantly enriched in the NRs group.
Venn diagrams showed 13 overlapping DEPs between the NRs and Rs group (Figure 2D). These 13 overlapping DEPs were C-reactive protein (CRP, P02741), neutrophil defensin 1 (DEFA1, P59665), haptoglobin (HP, P00738), myeloperoxidase (MPO, P05164), testicular tissue protein Li 70 (A0A140VJJ6), cofilin 1 (CFL1, G3V1A4), fibrinogen beta chain (FGB, P02675), galectin-10 (CLC, Q05315), cDNA FLJ54049 (highly similar to multimerin-2, B4DEW5), BLVRB (flavin reductase [NADPH], P30043), cDNA FLJ77917 (highly similar to Homo sapiens ubiquitin-conjugating enzyme E2L 3, A8K4W8), serotransferrin (TF, P02787) and serum albumin (ALB, P02768). Eventually, 6 DEPs with opposite changes were identified, including TTP Li 70, CFL1, FGB, CLC, TF and ALB (Figure 2E).
Verification of DEPs via PRM and Signal Pathway Analysis Using KEGG
Another proteomic analysis known as PRM was conducted to testify the reliability of DEPs based on iTRAQ results. A total of 28 DEPs were enrolled in PRM analysis; however, only five proteins from the 13 overlapping DEPs detected via iTRAQ met the feasibility of PRM validation technology, including FGB, HP, TTP Li 70, CRP and TF. The results of PRM confirmed significant differences in the expression changed of TF (namely, the level at week 14 subtracted from that of week 0 between the NRs and Rs group). The level of TF in the Rs group was elevated, whereas that in the NRs group was reduced (Figure 3A). Furthermore, KEGG analysis of TF revealed that it was primarily involved in hypoxia-inducible factor-1 (HIF-1) signal pathway (Figure 3B), ferroptosis pathway (Figure 3C) and mineral absorption pathway (not shown in this study).
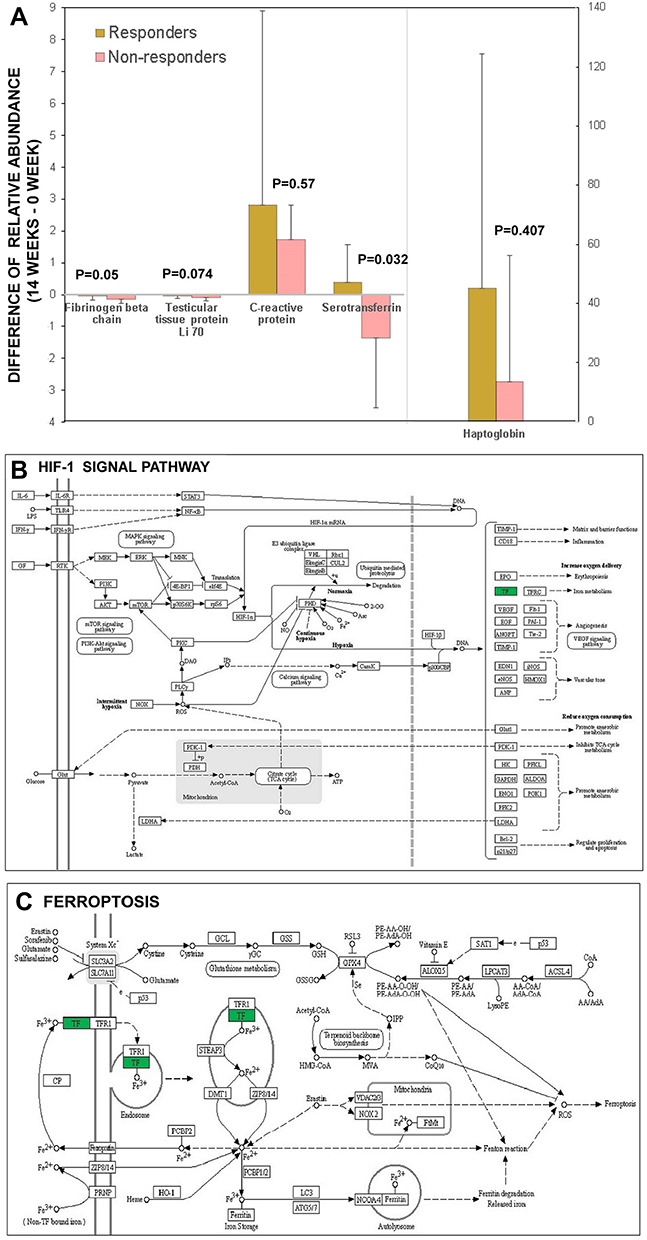 |
Figure 3 Results from quantitative proteomic analysis verified from PRM were displayed. (A) 5 proteins including fibrinogen beta chain, testicular tissue protein Li 70, C reactive protein, serotransferrin, haptoglobin from the 13 overlapping DEPs detected via iTRAQ were confirmed by PRM and compared between responders and non-responders. The results of PRM confirmed significant differences in the expression changes of TF. (B) bioinformatics analysis showed upstream pathway of TF was associated with HIF-1 signal. (C) bioinformatics analysis showed downstream pathway of TF was associated with ferroptosis. Abbreviations: DEPs, differentially expressed proteins; HIF-1, hypoxia inducible factor-1; iTRAQ, isobaric tags for relative and absolute quantification; PRM, parallel reaction monitoring; TF, serotransferrin. |
Discussion
RA is a common chronic inflammatory disease that can cause serious damage and disability of the articular cartilage and bone.19 Although bDMARDs can greatly alleviate DAS28-CRP compared with csDMARDs, the ineffective rate is still as high as 30%.20 Our study aimed to compare proteins (DEPs) that were significantly changed after 14 weeks of combination treatment of MTX + LEF + IFX between the NRs and Rs group to determine the underlying mechanisms of different efficacy. The results of iTRAQ revealed 6 DEPs including TTP Li 70, CFL1, FGB, CLC, TF and ALB with opposite changes at weeks 0 and 14 between the NRs and Rs group. Verification by PRM indicated that TF was elevated in the R group and was reduced in the NR group. Bioinformatic analysis of TF suggested that HIF-1 pathway and ferroptosis were involved in the therapeutic mechanism of MTX + LEF + IFX and could be potential targets of therapy for NRs.
Our data revealed similar parameters between two groups of patients at baseline (Supplement Table 1). After 14 weeks of MTX + LEF + IFX treatment, changes in clinical data including TJC, SJC, PtGA (VAS), PGA (VAS), HAQ, DAS28 (CRP), DAS (ESR), CDAI and SDAI exhibited significant differences. Hierarchical clustering analysis and Venn diagrams detected 13 overlapping DEPs between the NRs and Rs group, and 6 DEPs were identified with opposite direction changes including TTP Li 70, CFL1, FGB, CLC, TF and ALB (Figure 2E). Some DEPs such as ALB and FGB were familiar to clinicians. Regarding albumin, the iTRAQ data revealed that albumin was elevated in the Rs group and was reduced in the NRs group; however, clinical data from this study revealed that the difference in ALB between the NRs and Rs group was not statistically significant, possibly owing to the mixture of four samples involved in iTRAQ analysis, which required further confirmation in more patients. Similarly, according to Nguyen,21 a multivariate model that includes prealbumin can predict the response of patients with RA to TNF inhibitors. Therefore, the role of albumin in response mechanisms needs to be investigated further. There is currently no direct evidence supporting the role of FGB in response to combination treatment. Although three epitope regions in human fibrinogen were susceptible to citrullination by peptidyl arginine deiminase type 2 (PAD2) and PAD4, mass spectrometry results revealed efficient mapping between the citrullinated epitopes of fibrinogen and RA autoantibodies; therefore, it was speculated that FGB participated in the mechanism of drug efficacy.22 There have been few reports on the role of the other three DEPs including TTP Li 70, CFL1 and CLC in RA.
Another seven overlapping DEPs including CRP, DEFA1, HP, MPO, cDNA FLJ54049, BLVRB and cDNA FLJ77917 exhibited similar direction changes in the Rs and NRs group after triple therapy; however, further investigation is required (Figure 2E). In terms of HP, a study (2015) reported that serum levels of HP-α1, HP-α2 and vitamin D-binding protein (VDBP) were significantly upregulated in Rs after etanercept treatment.23 Tan (2016) reported that high baseline serum HP levels were associated with poor response to 12 weeks of MTX treatment in recent-onset patients with RA.24 Our study revealed that HP was significantly reduced in the Rs and NRs groups. Therefore, studies with larger sample size are required to validate the role of HP. As for MPO, several reports have suggested that IFX could reduce MPO concentrations25 and induce MPO-associated glomerulonephritis,26 indicating a complicated and unclear mechanism of MPO in the treatment of RA. In addition, it was observed that DEFA1 influences the production of MMPs, IL-8 and IL-6 through JNK and/or ERK and NF-kB pathways.27 In a recent study, it was discovered that patients with active RA had significantly higher serum α-DEFA1 levels than those in patients with remission. α-DEFA1 can be a useful biomarker in the assessment of disease activity.28 A study concerning single nucleotide polymorphisms (SNPs) of UBE2L3 revealed a significant association of RA with the cDNA FLJ77917 (highly similar to Homo sapiens UBE2L3). However, the role of UBE2L3 in RA treatment remains unclear.29 There have been a few reports on the cDNA FLJ54049 and BLVRB in RA. These studies indicate that the potential role of these seven proteins in evaluating the mechanism of RA drug efficacy cannot be neglected.
Owing to the technical limitation of PRM, not all DEPs detected via iTRAQ could be verified via PRM, and only 28 DEPs fulfilled the feasibility of PRM technology and were hence used for PRM. Only 5 of the 13 overlapping DEPs were selected to be tested via PRM, which were FGB, HP, TTP Li 70, CRP and TF. Eventually, TF was found to be the only DEP with statistical significance that was up-regulated in Rs and down-regulated in NRs (Figure 3A). Moreover, the fold changes of TF (Rs/NRs) at week 0 were 0.36 with P < 0.05, which had been reported in our recent study.13 This finding indicated that TF participated in the mechanism of efficacy during the treatment of triple therapy of MTX + LEF + IFX. Iron is an essential element for immune response and haematopoiesis, which could modulate the secretion of TNF-α, change antigen-presenting cell activity and regulate cellular immune responses.30 The main biological function of TF is to regulate iron transport and iron metabolism. In addition, TF induces the secretion of TNF-α independent of iron-donating capacity,31 which implies that TF may influence the secretion of TNF via pathways other than iron transport. Our results revealed that the TF level in the NRs group decreased after 14 weeks of triple therapy in patients with RA, indicating the possible role of TF in drug resistance, which was consistent with a previous study on inflammatory bowel disease (IBD).32
To better understand the relationship between TF and RA, we conducted bioinformatic analysis on TF. Using KEGG analysis, we observed that TF was involved in the HIF-1 signal pathway, ferroptosis and mineral absorption. HIF-1α is involved in the pathogenesis of RA. In a study, chronic intermittent hypobaric hypoxia (CIHH) pretreatment inhibited the progression of collagen-induced arthritis (CIA) by downregulating HIF-1α.33 In addition, HIF-1α accelerates the pathological process in RA fibroblast-like synoviocytes (RA-FLS) by promoting the interaction between T and B cells.34 Further bioinformatic analysis revealed that the PI3K/Akt/HIF-1α pathway as an upstream signal of TF can increase the migration and invasion of RA-FLS by regulating MMP-2 and MMP-9 expression.35,36 Therefore, we speculated that the activation of PI3K/Akt/HIF-1α pathway exacerbated resistance to triple therapy. In addition, the major biological function of TF was the transfer of iron between different biological tissues. Ferroptosis with iron deposition as the core is a novel form of programmed cell death in which the accumulation of intracellular iron promotes lipid peroxidation, leading to cell death. Some recent studies have provided direct evidence that reactive oxygen species-induced autophagy regulated ferritin degradation and transferrin receptor-1 expression.37,38 More investigation into the underlying mechanisms of transferrin–ferroptosis–autophagy in triple therapy resistance may be required.
Although our study was one of the few to use two proteomic methods to study the efficacy of triple therapy in RA, it still had several limitations. As a single prospective study, only 20 patients with RA were enrolled owing to the high cost of proteomic analysis and expensive drugs. If a new group of patients with RA is used for verification, the results of the proteomic analysis may be improved. More evidence in vivo or in vitro is required for more comprehensive research on mechanism of non-responser to triple therapy.
Conclusions
Our study compared the proteomic changes between NRs and Rs 14 weeks after MTX + LEF + IFX combination treatment. iTRAQ screening and PRM verification revealed that TF was reduced in the NRs group and elevated in the Rs group; bioinformatic analysis revealed that TF participated in HIF-1 pathway and ferroptosis, which may determine the therapeutic effect of MTX + LEF + IFX and can be potential targets of therapy for refractory RA.
Ethical Approval and Consent to Participate
The protocol was approved by the Ethics Committee of the Second Xiangya Hospital of Central South University, Changsha, Hunan, China (GZ81571599-20160118-1). All procedures in this study involving human participants were in accordance with Declaration of Helsinki. The patient or the legal agent signed the written informed consents. This article did not include research on animals.
Acknowledgments
We thank Jing Yu, Heng Li and Li Liu from the team of Shanghai Applied Protein Technology for technical advice and assistance in bioinformatics analysis. We thank Bullet Edits Limited for the linguistic editing and proofreading of the manuscript. Jian Chen, now work at Department of International Medical Service, People’s Hospital of Guangxi Zhuang Autonomous Region, Nanning, Guangxi, China.
Author Contributions
All authors made an important contribution to the work reported, whether that was in the conception, study design, execution, acquisition of data, analysis and interpretation, or in all these areas; took part in drafting, revising or critically reviewing the article; gave final approval of the version to be published; have agreed on the journal to which the article has been submitted; and finally agreed to be accountable for all aspects of the work.
Supporting Information
The following are available online at ProteomeXchange Consortium (http://www.proteomexchange.org). Project Name: Screening protein predictive of response to tumor necrosis factor-α inhibitors treatment in rheumatoid arthritis by using iTRAQ technique and investigating its mechanism through signal pathway. iTRAQ (Project accession: PXD010400; Username: [email protected]; Password: iNMAbevs). PRM (Project accession: PXD010378; Username: [email protected], Password: bFhENmEW). To access the data please visit: https://www.ebi.ac.uk/pride/archive/login.
Funding
This study was supported by the National Natural Science Foundation of China (81571599, 81873882); National foundation of HUNAN province (2018JJ2588, 2021JJ30934); Hunan Provincial Health Committee 225 Talent Project (2019-196); Educational Fund of Hunan Provincial Finance Department (2021-22-2050205); Project of Changsha Science and Technology Bureau (kq1901119).
Disclosure
The authors have report no conflicts of interest in this work.
References
1. Smolen JS, Aletaha D, McInnes IB. Rheumatoid arthritis. Lancet. 2016;388(10055):2023–2038. doi:10.1016/S0140-6736(16)30173-8
2. Burmester GR, Pope JE. Novel treatment strategies in rheumatoid arthritis. Lancet. 2017;389(10086):2338–2348. doi:10.1016/S0140-6736(17)31491-5
3. Isaacs JD, Ferraccioli G. The need for personalised medicine for rheumatoid arthritis. Ann Rheum Dis. 2011;70(1):4–7. doi:10.1136/ard.2010.135376
4. Tracey D, Klareskog L, Sasso EH, Salfeld JG, Tak PP. Tumor necrosis factor antagonist mechanisms of action: a comprehensive review. Pharmacol Ther. 2008;117(2):244–279. doi:10.1016/j.pharmthera.2007.10.001
5. Ramiro S, Sepriano A, Chatzidionysiou K, et al. Safety of synthetic and biological DMARDs: a systematic literature review informing the 2016 update of the EULAR recommendations for management of rheumatoid arthritis. Ann Rheum Dis. 2017;76(6):1101–1136. doi:10.1136/annrheumdis-2016-210708
6. Xie X, Li F, Li S, et al. Application of omics in predicting anti-TNF efficacy in rheumatoid arthritis. Clin Rheumatol. 2018;37(1):13–23.
7. Moots RJ, Xavier RM, Mok CC, et al. The impact of anti-drug antibodies on drug concentrations and clinical outcomes in rheumatoid arthritis patients treated with Adalimumab, etanercept, or infliximab: results from a multinational, real-world clinical practice, non-interventional study. PLoS One. 2017;12(4):e0175207. doi:10.1371/journal.pone.0175207
8. Gao F, Liu X, Shen Z, et al. Andrographolide sulfonate attenuates acute lung injury by reducing expression of myeloperoxidase and neutrophil-derived proteases in mice. Front Physiol. 2018;9:939. doi:10.3389/fphys.2018.00939
9. Li X, Qiao H, Qin F, et al. Comparative analysis of iTRAQ-based proteome profiles of Schistosoma japonicum female worms coming from single-sex infections and bisexual infections. J Proteomics. 2020;213:103597. doi:10.1016/j.jprot.2019.103597
10. Peterson AC, Russell JD, Bailey DJ, Westphall MS, Coon JJ. Parallel reaction monitoring for high resolution and high mass accuracy quantitative, targeted proteomics. Mol Cell Proteomics. 2012;11(11):1475–1488. doi:10.1074/mcp.O112.020131
11. Li LH, Huang QM, Barbero M, et al. Quantitative proteomics analysis to identify biomarkers of chronic myofascial pain and therapeutic targets of dry needling in a rat model of myofascial trigger points. J Pain Res. 2019;12:283–298. doi:10.2147/JPR.S185916
12. Chen J, Tang MS, Xu LC, et al. Proteomic analysis of biomarkers predicting the response to triple therapy in patients with rheumatoid arthritis. Biomed Pharmacother. 2019;116:109026. doi:10.1016/j.biopha.2019.109026
13. Aletaha D, Neogi T, Silman AJ, et al. 2010 Rheumatoid arthritis classification criteria: an American College of Rheumatology/European League Against Rheumatism collaborative initiative. Arthritis Rheum. 2010;62(9):2569–2581. doi:10.1002/art.27584
14. van Gestel AM, Haagsma CJ, van Riel PL. Validation of rheumatoid arthritis improvement criteria that include simplified joint counts. Arthritis Rheum. 1998;41(10):1845–1850. doi:10.1002/1529-0131(199810)41:10<1845:AID-ART17>3.0.CO;2-K
15. Wiśniewski JR, Zougman A, Nagaraj N, Mann M. Universal sample preparation method for proteome analysis. Nat Methods. 2009;6(5):359–362. doi:10.1038/nmeth.1322
16. Ortea I, Roschitzki B, Ovalles JG, et al. Discovery of serum proteomic biomarkers for prediction of response to infliximab (a monoclonal anti-TNF antibody) treatment in rheumatoid arthritis: an exploratory analysis. J Proteomics. 2012;77:372–382. doi:10.1016/j.jprot.2012.09.011
17. Shilov IV, Seymour SL, Patel AA, et al. The Paragon Algorithm, a next generation search engine that uses sequence temperature values and feature probabilities to identify peptides from tandem mass spectra. Mol Cell Proteomics. 2007;(9):1638–1655. doi:10.1074/mcp.T600050-MCP200
18. Elias JE, Gygi SP. Target-decoy search strategy for increased confidence in large-scale protein identifications by mass spectrometry. Nat Methods. 2007;4(3):207–214. doi:10.1038/nmeth1019
19. Mian A, Ibrahim F, Scott DL. A systematic review of guidelines for managing rheumatoid arthritis. BMC Rheumatol. 2019;3:42. doi:10.1186/s41927-019-0090-7
20. Syversen SW, Goll GL, Jørgensen KK, et al. Therapeutic drug monitoring of infliximab compared to standard clinical treatment with infliximab: study protocol for a randomised, controlled, open, parallel-group, Phase IV study (the NOR-DRUM study). Trials. 2020;21(1):13. doi:10.1186/s13063-019-3734-4
21. Nguyen MVC, Baillet A, Romand X, et al. Prealbumin, platelet factor 4 and S100A12 combination at baseline predicts good response to TNF alpha inhibitors in rheumatoid arthritis. Joint Bone Spine. 2019;86(2):195–201. doi:10.1016/j.jbspin.2018.05.006
22. van Beers JJ, Raijmakers R, Alexander LE, et al. Mapping of citrullinated fibrinogen B-cell epitopes in rheumatoid arthritis by imaging surface plasmon resonance. Arthritis Res Ther. 2010;12(6):R219. doi:10.1186/ar3205
23. Blaschke S, Rinke K, Maring M, et al. Haptoglobin-α1, -α2, vitamin D-binding protein and apolipoprotein C-III as predictors of etanercept drug response in rheumatoid arthritis. Arthritis Res Ther. 2015;17(1):45. doi:10.1186/s13075-015-0553-1
24. Tan W, Wang F, Guo D, et al. High serum level of haptoglobin is associated with the response of 12 weeks methotrexate therapy in recent-onset rheumatoid arthritis patients. Int J Rheum Dis. 2016;19(5):482–489. doi:10.1111/1756-185X.12380
25. Feijóo M, Túnez I, Tasset I, et al. Infliximab reduces myeloperoxidase concentration in chronic inflammatory joint diseases. Pharmacology. 2009;83(4):211–216. doi:10.1159/000200022
26. Stokes MB, Foster K, Markowitz GS, et al. Development of glomerulonephritis during anti-TNF-alpha therapy for rheumatoid arthritis. Nephrol Dial Transplant. 2005;20(7):1400–1406. doi:10.1093/ndt/gfh832
27. Ahn JK, Huang B, Bae EK, et al. The role of α-defensin-1 and related signal transduction mechanisms in the production of IL-6, IL-8 and MMPs in rheumatoid fibroblast-like synoviocytes. Rheumatology (Oxford). 2013;52(8):1368–1376. doi:10.1093/rheumatology/ket147
28. Okcu M, Oktayoglu P, Mete N, et al. A useful marker in the assessment of remission and activation of disease in patients with rheumatoid arthritis: serum human neutrophil peptides 1-3. J Back Musculoskelet Rehabil. 2018;31(6):1145–1150. doi:10.3233/BMR-160743
29. Orozco G, Eyre S, Hinks A, et al. Study of the common genetic background for rheumatoid arthritis and systemic lupus erythematosus. Ann Rheum Dis. 2011;70(3):463–468. doi:10.1136/ard.2010.137174
30. Poljak-Blazi M, Hrvacić B, Zupanović Z, Hadzija M, Stanić B, Polancec D. Differing effects of two iron compounds on experimental arthritis, TNF-alpha levels and immune response in mice. Int Immunopharmacol. 2003;3(13–14):1743–1749. doi:10.1016/S1567-5769(03)00204-2
31. Muõz C, Olivares M. Transferrin modulates tumor necrosis factor-alpha secretion by cultured human mononuclear cells: influence of iron status. Nutrition. 2000;16(3):229–230. doi:10.1016/s0899-9007(99)00276-2
32. Gazouli M, Anagnostopoulos AK, Papadopoulou A, et al. Serum protein profile of Crohn’s disease treated with infliximab. J Crohns Colitis. 2013;7(10):e461–70. doi:10.1016/j.crohns.2013.02.021
33. Shi M, Cui F, Liu AJ, et al. The protective effects of chronic intermittent hypobaric hypoxia pretreatment against collagen-induced arthritis in rats. J Inflamm (Lond). 2015;12:23. doi:10.1186/s12950-015-0068-1
34. Hu F, Liu H, Xu L, et al. Hypoxia-inducible factor-1α perpetuates synovial fibroblast interactions with T cells and B cells in rheumatoid arthritis. Eur J Immunol. 2016;46(3):742–751. doi:10.1002/eji.201545784
35. Li G, Zhang Y, Qian Y, et al. Interleukin-17A promotes rheumatoid arthritis synoviocytes migration and invasion under hypoxia by increasing MMP2 and MMP9 expression through NF-κB/HIF-1α pathway. Mol Immunol. 2013;53(3):227–236. doi:10.1016/j.molimm.2012.08.018
36. Li GQ, Zhang Y, Liu D, et al. PI3 kinase/Akt/HIF-1α pathway is associated with hypoxia-induced epithelial-mesenchymal transition in fibroblast-like synoviocytes of rheumatoid arthritis. Mol Cell Biochem. 2013;372(1–2):221–231. doi:10.1007/s11010-012-1463-z
37. Park E, Chung SW. ROS-mediated autophagy increases intracellular iron levels and ferroptosis by ferritin and transferrin receptor regulation. Cell Death Dis. 2019;10(11):822. doi:10.1038/s41419-019-2064-5
38. Chen LL, Huang YJ, Cui JT, Song N, Xie J. Iron Dysregulation in Parkinson’s Disease: focused on the Autophagy-Lysosome Pathway. ACS Chem Neurosci. 2019;10(2):863–871. doi:10.1021/acschemneuro.8b00390
 © 2021 The Author(s). This work is published and licensed by Dove Medical Press Limited. The full terms of this license are available at https://www.dovepress.com/terms.php and incorporate the Creative Commons Attribution - Non Commercial (unported, v3.0) License.
By accessing the work you hereby accept the Terms. Non-commercial uses of the work are permitted without any further permission from Dove Medical Press Limited, provided the work is properly attributed. For permission for commercial use of this work, please see paragraphs 4.2 and 5 of our Terms.
© 2021 The Author(s). This work is published and licensed by Dove Medical Press Limited. The full terms of this license are available at https://www.dovepress.com/terms.php and incorporate the Creative Commons Attribution - Non Commercial (unported, v3.0) License.
By accessing the work you hereby accept the Terms. Non-commercial uses of the work are permitted without any further permission from Dove Medical Press Limited, provided the work is properly attributed. For permission for commercial use of this work, please see paragraphs 4.2 and 5 of our Terms.