")
Back to Journals » Clinical and Experimental Gastroenterology » Volume 11
Isolation and gene expression profiling of intestinal epithelial cells: crypt isolation by calcium chelation from in vivo samples
Authors Balfe A, Lennon G, Lavelle A, Docherty NG, Coffey JC, Sheahan K, Winter DC, O'Connell PR
Received 30 June 2017
Accepted for publication 11 September 2017
Published 12 January 2018 Volume 2018:11 Pages 29—37
DOI https://doi.org/10.2147/CEG.S145224
Checked for plagiarism Yes
Review by Single anonymous peer review
Peer reviewer comments 2
Editor who approved publication: Professor Andreas M. Kaiser
Aine Balfe,1,2 Grainne Lennon,1,2 Aonghus Lavelle,1,2 Neil G Docherty,1 J Calvin Coffey,3 Kieran Sheahan,4 Desmond C Winter,2 P Ronan O’Connell1,2
1School of Medicine and Medical Science, University College Dublin, Belfield, Dublin, 2Centre for Colorectal Disease, St Vincent’s University Hospital Dublin, Dublin, 3Graduate Entry Medical School, University Hospital Limerick, 4i Centre for Interventions in Infection, Inflammation and Immunity, University of Limerick, Limerick, 4Histopathology Department, St. Vincent’s University Hospital Dublin, Dublin, Ireland
Aim: The epithelial layer within the colon represents a physical barrier between the luminal contents and its underlying mucosa. It plays a pivotal role in mucosal homeostasis, and both tolerance and anti-pathogenic immune responses. Identifying signals of inflammation initiation and responses to stimuli from within the epithelial layer is critical to understanding the molecular pathways underlying disease pathology. This study validated a method to isolate and analyze epithelial populations, enabling investigations of epithelial function and response in a variety of disease setting.
Materials and methods: Epithelial cells were isolated from whole mucosal biopsies harvested from healthy controls and patients with active ulcerative colitis by calcium chelation. The purity of isolated cells was assessed by flow cytometry. The expression profiles of a panel of epithelial functional genes were investigated by reverse transcription-polymerase chain reaction (PCR) in isolated epithelial cells and corresponding mucosal biopsies. The expression profiles of isolated cells and corresponding mucosal biopsies were evaluated and compared between healthy and inflamed colonic tissue.
Results: Flow cytometry identified 97% of cells isolated as intestinal epithelial cells (IECs). Comparisons of gene expression profiles between the mucosal biopsies and isolated IECs demonstrated clear differences in the gene expression signatures. Sixty percent of the examined genes showed contrasting trends of expression between sample types.
Conclusion: The calcium chelation isolation method provided a reliable method for the isolation of a pure population of cells with preservation of epithelial cell-specific gene expression. This demonstrates the importance of sample choice when investigating functions directly affecting the colonic epithelial layer.
Keywords: epithelial cells, ulcerative colitis, gene expression, mucosal biopsies, molecular pathways, colonic inflammation
Introduction
Epithelial surfaces, including the skin, respiratory, urinary, and gastrointestinal tracts, provide a physical and immunological barrier between the host and the external environment.1 Within the colon, a single layer of intestinal epithelial cells (IECs) separates the colonic microbiome, estimated at 1014 bacterial cells,2 and other external antigens from the underlying lamina propria (LP).1 IECs also participate in co-ordination of appropriate immune responses, including tolerance and anti-pathogen responses.1
Gene expression analysis of colonic mucosa from animals,3–6 patients with inflammatory bowel disease7–9 and other conditions associated with impaired IEC barrier function, such as graft-versus-host disease, autism, type 1 diabetes, rheumatoid arthritis, and multiple sclerosis,10–15 has provided insights into the molecular pathways of IEC function. However, mucosal biopsies may not be appropriate to investigate gene expression changes in IECs due to the heterogenic nature of tissues in mucosal biopsies.16–19 Thus, gene expression in IECs may be obscured by gene expression of other cell types,20,21 masking subtle gene expression changes.22
Fluorescence-activated cell sorting (FACS) is widely used for high throughput cell sorting, allowing simultaneous measurement of over 20 parameters per cell 23 at a rate of 1,000 cells per second.24–26 An alternative method for cell sorting is laser capture microdissection, which can be used to isolate IECs;27 however, ultraviolet and infrared laser energy can damage isolated cells28 and stereology of the sample is lost.29
The primary aim of this study was to develop a technique to isolate IECs from mucosal biopsies obtained from patients with ulcerative colitis (UC) and healthy volunteers in order to successfully study gene expression in cells that provide the primary interface between the host and the colonic microbiota. In doing so, IECs must be isolated in sufficient volume and integrity that preserves both gene expression signature and RNA quality. Here, we describe adoption of a method (calcium chelation) routinely used to isolate IECs for cell culture, to yield high-quality RNA for the purpose of gene expression studies.
Materials and methods
Patient volunteers
Volunteers were recruited from St. Vincent’s University Hospital (SVUH), Dublin, Ireland, in accordance with ethical approval granted by SVUH, Ethics Committee, and Medical Research Committee. All individuals provided written informed consent prior to the procedure. All participants were greater than 18 years of age.
Two mucosal biopsy specimens were harvested from the descending colon in 10 healthy volunteers and 10 patients with active UC. Healthy volunteers underwent routine day-case colonoscopy and were found to have no active pathology. Volunteers with a history of inflammatory bowel disease, colon cancer, active gastrointestinal bleeding, or hospital admission in the preceding 6 weeks were excluded. All volunteers had received a bowel preparation of sodium picosulfate. Individuals with UC underwent total colectomy for medically refractory UC or acutely unresponsive disease.
Phenotypic data and demographics were collected at the time of consent and following a review of medical notes (Table 1). No significant differences were observed between the two cohorts regarding sex or age (P>0.05).
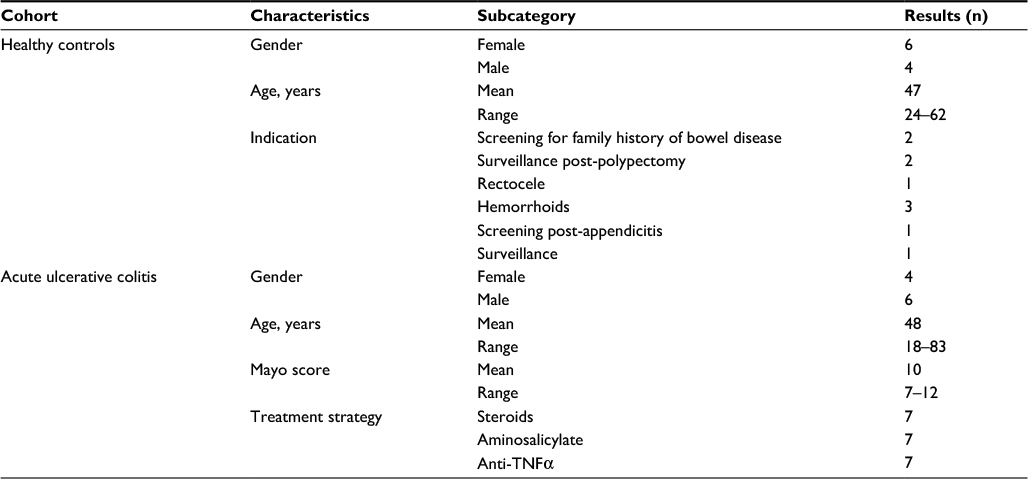 | Table 1 Phenotypic data and demographics of study volunteers Abbreviation: TNF, tumor necrosis factor. |
Sample collection and processing
Parallel mucosal biopsies were harvested from the descending colon of recruited individuals. For healthy individuals, biopsy samples were collected using a Radial Jaw® 3 biopsy forceps (Boston Scientific, Natick, MA, USA). For individuals with UC, biopsy samples were collected at the time of colonic resection. The colon was opened along the antimesenteric border and sampled immediately post-removal. Immediately following collection, two biopsy samples were placed in RNAlater® solution (Ambion, Austin, TX, USA) and stored at 4°C for 24 hours prior to storage at –80°C. One of the mucosal biopsy samples was used for epithelial cell isolation and analysis. The second sample was used for whole mucosal analysis.
Calcium chelation solution
EDTA (ethylenediaminetetraacetic acid) calcium chelation solution was prepared as described previously.30 Briefly, the solution contained the following: 96 mM/L NaCl, 1.5 mM/L KCl, 10 mM HEPES/Tris, 27 mM NaEDTA, 45 mM/L Sorbitol, and 28 mM/L sucrose. All reagents were sourced from Sigma-Aldrich Co. (St Louis, MO, USA). Prior to use, the solution was treated with 1X RNase secure (Ambion) for 10 minutes at 65°C.
Crypt isolation by calcium chelation protocol
Mucosal biopsies were washed three times in 1.5 mL of Dulbecco’s phosphate buffered solution (dPBS) (Thermo Fisher Scientific, Waltham, MA, USA), which was pretreated with 1X RNAse secure (Ambion) for 10 minutes. Biopsies were then transferred to a fresh, sterile microcentrifuge tube and incubated in 1.5 mL of calcium chelation solution, and shaken on ice for 1 hour with gentle agitation at 80 rpm. After incubation samples were shaken vigorously, the supernatant (containing the epithelial cells) was transferred to a fresh sterile microcentrifuge and centrifuged at 200× g for 10 minutes to pellet the cells. The supernatant was discarded and the cell pellet was washed twice in 1.5 mL of dPBS and resuspended in dPBS.
Following this, 50 μL of the cell suspension was aliquoted for the purpose of purity assessment through flow cytometry. The remainder of the sample was utilized for the purpose of RNA extraction.
Flow cytometry assessment of epithelial cell purity
The purity of isolated cells was assessed through flow cytometry in combination with antibody labeling specific for epithelial cells. Isolated cells were diluted 1:1 with 0.4% trypan blue stain (Thermo Fisher Scientific) counted using a Countess™ automated cell counter (Thermo Fisher Scientific). Following this, samples were diluted to 106 cells/mL and blocked in 1% bovine serum albumin (Sigma-Aldrich Co.) prior to incubation for 1 hour at room temperature with Anti-Human CD326 (EpCAM) eFluor® 660 antibody conjugated with allophycocyanin (APC; eBioscience, Hatfield, UK) at a final concentration of 0.06 μg/mL. The labeled cells were analyzed using the BD Accuri™ C6 (Accuri Cytomerers, Ann Arbor, MI, USA) and BD Accuri C6 software. Unlabeled cells that served as a negative control were used in gating analysis to establish single cell populations and to exclude nonepithelial cells.
Extraction of total RNA and cDNA generation from isolated epithelial cells and whole mucosal biopsy
RNA was extracted from mucosal biopsies and the isolated IECs using the Qiagen RNeasy® Fibrous Tissue kit (Qiagen, Hilden, Germany) according to the manufacturer’s method for tissue samples.
Nucleic acid concentration and purity was determined by the NanoDrop ND-100- spectrophotometer (Thermo Fisher Scientific). The integrity of RNA from mucosal biopsies was evaluated using the Agilent 2100 Bioanalyzer (Agilent, Santa Clara, CA, USA) in conjunction with the RNA Nano 6000 kit (Agilent). As the RNA yield from epithelial cells was below the limit of detection for the RNA Nano Kit, the remainder of the biopsy sample, representing the LP and had undergone crypt isolation by calcium chelation in conjunction with the epithelial cells, was used as a proxy to investigate the integrity of the epithelial cells.
Preamplification of RNA from isolated epithelial cells
Following RNA isolation, cDNA was generated using the High Capacity cDNA Reverse Transcription Kit (Applied Biosystems, Foster City, CA, USA) as per the manufacturer’s instructions. Given the low yield of RNA from the isolated IECs, the cDNA generated from these samples was preamplified prior to gene expression analysis. This was carried out using the Roche Pre-Amp Mastermix and Pre-Amp Primer Pool (Hoffman-La Roche Ltd., Basel, Switzerland) as per the manufacturer’s instructions. Preamplification reactions consisted of an initial denaturation step for 1 minute at 95°C followed by 14 amplification cycles of 95°C for 15 seconds and 60°C for 4 minutes. Finally, samples were cooled to 37°C for 15 minutes. Each amplification reaction mixture was then diluted 1:40 with nuclease-free water (Hoffman-La Roche Ltd.) and stored at –20°C prior to gene expression analysis.
Gene expression profiling
Roche RTR Custom Panels (Hoffman-La Roche Ltd.) were employed to study the gene expression of 20 gene targets and three reference genes. Prior to performing reverse transcription-PCR the Roche RTR Human Reference Gene Panel (Hoffman-La Roche Ltd.) was used to investigate the crossing point (Cp) values of 19 common reference genes in our two patient cohorts. Subsequently, RefFinder software31 (http://www.leonxie.com/referencegene.php) identified the most stable genes across the two cohorts. RefFinder considers the normalization calculations of geNorm,32 NormFinder,33 BestFinder,34 and delta Cp values.35 RefFinder predicted IPO8 as the most stable gene across the given sample tissues with Beta-globulin being the least. Furthermore, NormFinder predicted three as the ideal number of reference genes required for normalization. On this basis, IPO8, HPRT1, and GUSB were selected as the ideal reference genes for performing normalization in subsequent RT-PCR experimental designs. All assays were carried out on a LightCycler® 480 Instrument (Hoffman-La Roche Ltd.) as per the standard PCR cycling conditions. Data analysis was performed using LightCycler software 4.1 (Hoffman-La Roche Ltd.). Cp values were derived using the second derivative algorithm and normalization. Cp value for each target was used to calculate the relative expression levels using the comparative Cp method.36 Statistical significance was evaluated using the Mann–Whitney U-test with a Bonferroni correction for multiple hypothesis testing. All statistical analysis was carried out using SPSS software version 20 (IBM Corporation, Armonk, NY, USA).
Results
Crypt isolation by calcium chelation
Flow cytometry was used to detect the binding of an antibody specific to epithelial cell adhesion molecule, on the surface of the isolated epithelial cell population. An aliquot of isolated cells from eight individuals was counted and stained with Anti-Human CD326 (EpCAM) eFluor 660 conjugated with APC. The labeled cells were analyzed using the BD Accuri C6. Gating was established using unlabeled cells that acted as a negative control (Figure 1). It was determined that 97% (range: 77–99%) of cells were of epithelial origin (Figure 1, Table 2). Direct microscopical examination of the isolate culture also identified a pure population of epithelial cells (Figure 2).
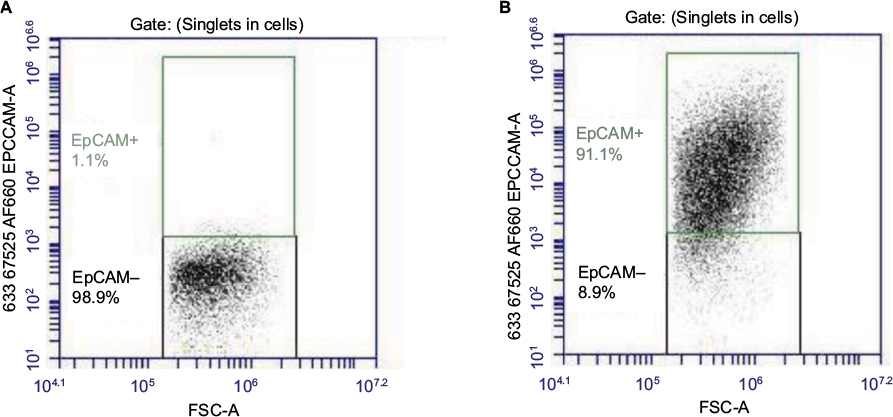 | Figure 1 Confirmation of epithelial cells isolated by calcium chelation technique. (A) Unstained cells acted as a negative control for the purpose of performing gating analysis and (B) 97% (median) of cells within the population were positive for EpCAM staining. Abbreviation: FSC-A, forward scatter area. |
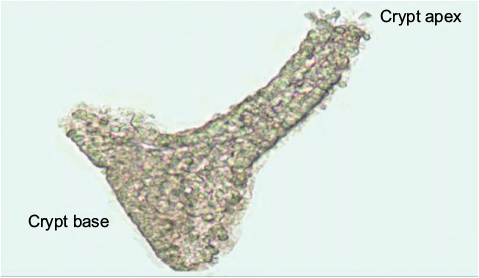 | Figure 2 Microscopical image of isolated epithelial cells (40× magnification). |
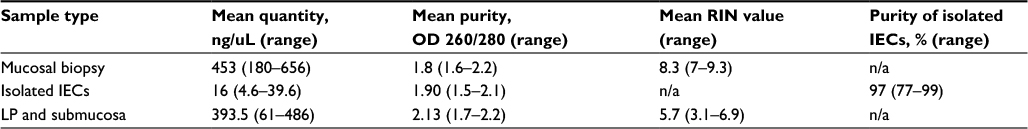 | Table 2 Summary of RNA yields and quality checks from whole mucosal biopsies and isolated IECs Abbreviations: IECs, intestinal epithelial cells; LP, lamina propria; OD, optical density; RIN, RNA integrity number; n/a, not applicable. |
The mean yields of RNA, its quality and purity of isolated IECs are presented in Table 2. Given the low yields of RNA from the isolated IECs, an assessment of the RNA integrity was not feasible. As a proxy for this measurement, a parallel extraction of RNA was performed from the remaining biopsy tissue (LP) from which the IECs were isolated.
Transcriptional profiling of mucosal biopsies and isolated IECs
Relative gene expression (ΔCp) of both mucosal biopsies and isolated IECs in healthy and inflamed UC tissue are presented in Table 3, along with fold changes (2-ΔΔCp) of each tissue type in UC compared to healthy controls (Figure 3). The panel of 20 genes investigated were selected with the purpose of investigating signatures from IEC-specific functions.
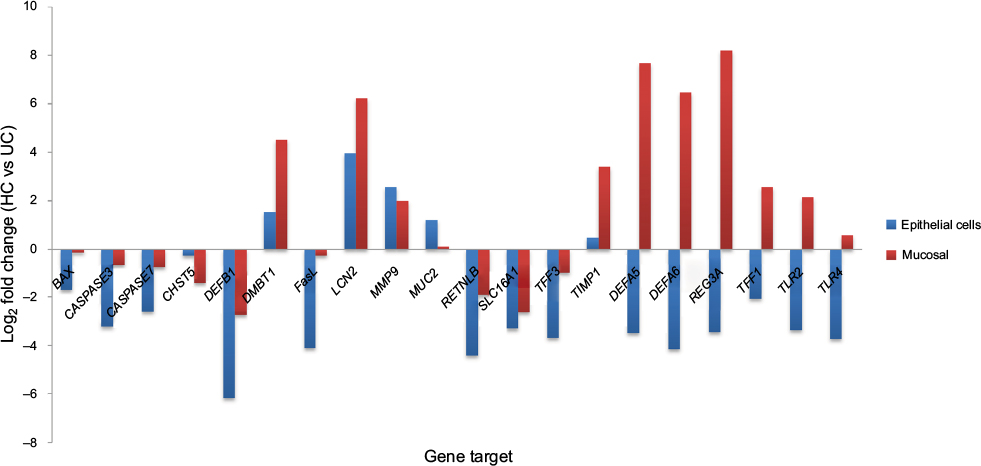 | Figure 3 Log2 fold change (HC vs UC) in gene expression for mucosal biopsy (red) and isolated IECs (blue). Abbreviations: IECs, intestinal epithelial cells; UC, ulcerative colitis; HC, healthy controls. |
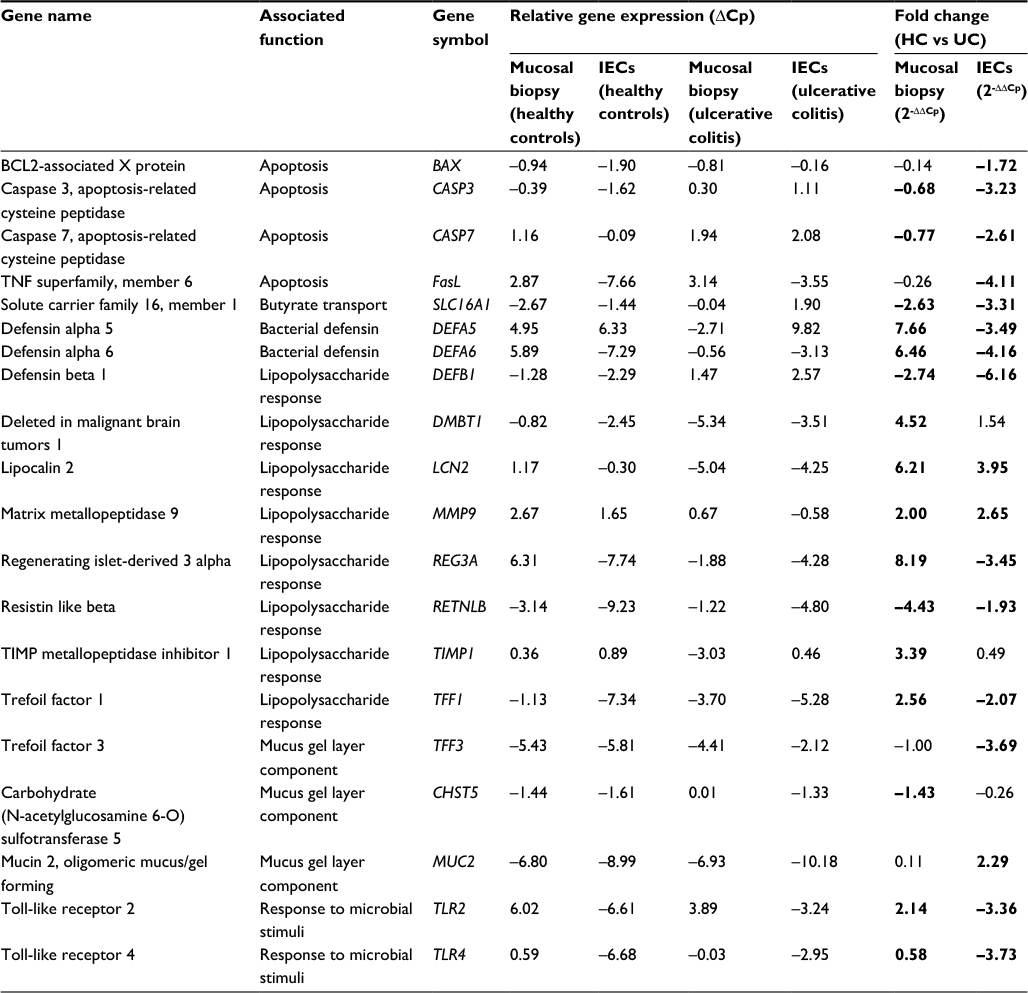 | Table 3 ΔCp and relative fold change in gene expression for mucosal biopsy and isolated IECs Notes: Fold change expression which showed significant difference between UC and healthy controls is highlighted in bold. Abbreviations: IECs, intestinal epithelial cells; ΔCp, relative gene expression; HC, healthy controls; UC, ulcerative colitis; TNF, tumor necrosis factor. |
Comparisons of gene expression (ΔCp) between the mucosal biopsies and isolated IECs demonstrated clear differences in the gene expression signatures of each sample type. Twelve of the 20 genes examined showed contrasting trends of gene expression between sample types in one or both of the sample cohorts, indicating that the mixed tissues of the mucosal biopsies do not appropriately reflect the gene signatures of the epithelial cell environment. A comparison of the fold changes in gene expression between samples obtained from individuals with UC and that of healthy controls further highlighted this observation. Seven of the 20 genes showed a dichotomy in the direction of expression between the sample types and importantly all but one of these genes were significantly altered between the cohorts. Also of importance was the observation that 6/20 of the genes were significantly altered in one of the sample types only. To further demonstrate the dissimilarity of the sample types (IEC vs mucosal biopsies), Pearson’s correlation coefficients were calculated between the two sample types of each patient cohort (healthy controls [HC] and UC) and found no significant discernible correlation between the tissue types in either of the tested cohorts (Table 4).
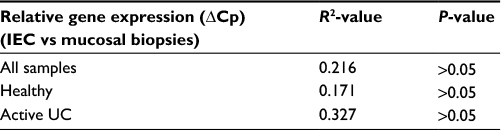 | Table 4 Pearson’s correlation coefficients between gene expression profiles of IEC versus mucosal biopsies Abbreviations: IECs, intestinal epithelial cells; ΔCp, relative gene expression; UC, ulcerative colitis. |
Discussion
The technique described represents an adoption of a previously published method30 to isolate IECs, resulting in a robust and efficient method for preservation of IEC-specific gene expression signatures. The original technique has been extensively used for physiology studies of the epithelial layer, without any adverse effect on epithelial function reported.30,37 Moreover; crypt isolation by calcium chelation has been used in studies investigating calcium-sensing receptor (CaSR). Exposure of isolated epithelial cells to CaSR activator R568 (100 nM) resulted in a sustained increase of [Ca2+]i from 100 nm to 350 nm,38–40 suggesting that intracellular calcium stimulation is not directly affected by the chelation technique. The technique along with the more expensive FACS technique has been used for the isolation of both organoids and enteroids for subsequent studies,41,42 to offer a better understanding of how stem cells differentiate and to study the role these cells may play in the biology of colonic diseases such as colorectal cancer.43 While these studies have offered the potential to explore interactions involved in pathogenesis, the techniques employed have not preserved the gene expression profiles that directly reflect in vivo circumstances and do not offer the potential to study these.
The adopted technique includes a reagent pretreatment step to remove contaminating RNAse enzymes and performs all isolation steps on ice, thus allowing for the integrity of the resulting RNA to be preserved and ensuring suitability for gene expression analysis. However, due to the small sample size yielded from the IEC isolation method, it was not feasible to check the RNA integrity of the extracts before proceeding to amplification and analysis. To overcome this, the mucosa that remained post-IEC isolation was also subjected to RNA extraction and was used as a proxy for the purpose of assessment of RNA integrity.
In this study, the RNA yielded from the EDTA calcium chelation method described earlier was isolated, from a single biopsy collected with a Radial Jaw 3 biopsy forceps that provided sufficient RNA to study 20 genes. Future studies could increase the number of gene targets investigated by increasing the number of biopsies harvested from a patient and pooling the IECs prior to RNA extraction or by using animal models whereby large amounts of the colon could be harvested for IEC extraction.
IECs play an important role in colonic homeostasis and are considered to be deregulated in a number of colonic conditions.1 The panel of genes chosen for gene expression analysis was based on known functions of epithelial cells including mucus gel layer (MGL) and defensin secretions, responses to lipopolysaccharides, and apoptosis. Initial comparisons of the changes in expression relative to the reference genes showed that the expression of these genes within the IECs and mucosal biopsies was dissimilar in both UC and healthy tissue. Importantly in the case of 12 of these genes, the direction of expression was inconsistent between sample types (i.e., upregulated in one sample type and downregulated in the other). This illustrates how the confounding issues of mixed tissue and cell types are likely to mask subtle changes in gene expression within low abundance cell types of a given sample.
The method allowed investigation of genes involved in MGL secretion directly in the cells that produce the constituent mucus. In doing so, an increase in MUC2 production by goblet cells and a corresponding decrease in TFF3 was identified, reflecting a reduction in both the stabilization and protective capacity.44
The expression of microbial sensing receptors (TLR2 and 4) was downregulated in epithelial cells from patients with active UC, a finding that was masked in the assessments of whole mucosal biopsies. A dichotomy in the expression of bacterial defensins was also observed, with downregulation of defensins in epithelial cells and upregulation in mucosa. Downregulation of intestinal DEFb1, the function of which is to prevent microbes colonizing the inner sterile MGL,45 supports the hypothesis of a dysfunctioning MGL in UC. This reduced protective capacity of the MGL may afford bacterial species or their endotoxins an opportunity to colonize close to or within the colonic mucosa, triggering an overt inflammatory response.
These results indicate that current studies utilizing mucosal biopsies to investigate specific pathways associated with epithelial cell responses may be inadvertently omitting vital data and has highlighted the need for subfractioning the studies. Furthermore, in the case of the colon, studies offering expression profiles of the LP would be advantageous to understand the mechanisms that are occurring underneath the disrupted epithelial layer. The current study has utilized tissues from individuals with UC to demonstrate the necessity to specifically investigate gene signatures associated with isolated IECs. However, the importance of investigating IEC-specific signatures is not limited to conditions associated with inflammatory bowel disease. Other conditions such as graft-versus-host disease, autism, type 1 diabetes, rheumatoid arthritis, and multiple sclerosis have all been implicated with pathologies associated with gut health.10–15
Conclusion
The study describes a robust method for the isolation of pure populations of IECs to allow for RNA processing and subsequent gene expression analysis. Differences in the gene expression signatures between IECs and whole mucosal biopsies observed in this study demonstrate the importance of sample choice when investigating functions or processes directly affecting the epithelial layer.
Acknowledgment
This work was supported by Science Foundation Ireland (grant number 09/IN.1/B2606).
Disclosure
The authors report no conflicts of interest in this work.
References
Artis D. Epithelial-cell recognition of commensal bacteria and maintenance of immune homeostasis in the gut. Nat Rev Immunol. 2008;8(6):411–420. | ||
Luckey T. Introduction to intestinal microecology. Am J Clin Nutr. 1972;25(12):1292–1294. | ||
Berghofer P, Peterson RG, Schneider K, Fehmann HC, Goke B. Incretin hormone expression in the gut of diabetic mice and rats. Metabolism. 1997;46(3):261–267. | ||
Costello CM, Mah N, Hasler R, et al. Dissection of the inflammatory bowel disease transcriptome using genome-wide cDNA microarrays. PLoS Med. 2005;2(8):e199. | ||
Bragde H, Jansson U, Jarlsfelt I, Soderman J. Gene expression profiling of duodenal biopsies discriminates celiac disease mucosa from normal mucosa. Pediatr Res. 2011;69(6):530–537. | ||
Jauregi-Miguel A, Fernandez-Jimenez N, Irastorza I, Plaza-Izurieta L, Vitoria JC, Bilbao JR. Alteration of tight junction gene expression in celiac disease. J Pediatr Gastroenterol Nutr. 2014;58(6):762–767. | ||
Suenaert P, Bulteel V, Lemmens L, et al. Anti-tumor necrosis factor treatment restores the gut barrier in Crohn’s disease. Am J Gastroenterol. 2002;97(8):2000–2004. | ||
Vogelsang H, Schwarzenhofer M, Oberhuber G. Changes in gastrointestinal permeability in celiac disease. Dig Dis. 1999;16(6):333–336. | ||
Khounlotham M, Kim W, Peatman E, et al. Compromised intestinal epithelial barrier induces adaptive immune compensation that protects from colitis. Immunity. 2012;37(3):563–573. | ||
Wen L, Ley RE, Volchkov PY, et al. Innate immunity and intestinal microbiota in the development of Type 1 diabetes. Nature. 2008;455(7216):1109–1113. | ||
Lee YK, Menezes JS, Umesaki Y, Mazmanian SK. Proinflammatory T-cell responses to gut microbiota promote experimental autoimmune encephalomyelitis. Proc Natl Acad Sci USA. 2011;108(Suppl 1):4615–4622. | ||
Berer K, Mues M, Koutrolos M, et al. Commensal microbiota and myelin autoantigen cooperate to trigger autoimmune demyelination. Nature. 2011;479(7374):538–541. | ||
Wu H-J, Ivanov II, Darce J, et al. Gut-residing segmented filamentous bacteria drive autoimmune arthritis via T helper 17 cells. Immunity. 2010;32(6):815–827. | ||
Brown GR, Lindberg G, Meddings J, Silva M, Beutler B, Thiele D. Tumor necrosis factor inhibitor ameliorates murine intestinal graft-versus-host disease. Gastroenterology. 1999;116(3):593–601. | ||
de Magistris L, Familiari V, Pascotto A, et al. Alterations of the intestinal barrier in patients with autism spectrum disorders and in their first-degree relatives. J Pediatr Gastroenterol Nutr. 2010;51(4):418–424. | ||
Kim M, Lee S, Yang SK, Song K, Lee I. Differential expression in histologically normal crypts of ulcerative colitis suggests primary crypt disorder. Oncol Rep. 2006;16(4):663–670. | ||
Smith M, Culhane A, Donovan M, et al. Analysis of differential gene expression in colorectal cancer and stroma using fluorescence-activated cell sorting purification. Br J Cancer. 2009;100(9):1452–1464. | ||
Winegarden N. Microarrays in cancer: moving from hype to clinical reality. Lancet. 2003;362(9394):1428. | ||
Smith MJ, Culhane AC, Donovan M, et al. Analysis of differential gene expression in colorectal cancer and stroma using fluorescence-activated cell sorting purification. Br J Cancer. 2009;100(9):1452–1464. | ||
Sugiyama Y, Sugiyama K, Hirai Y, Akiyama F, Hasumi K. Microdissection is essential for gene expression profiling of clinically resected cancer tissues. Am J Clin Pathol. 2002;117(1):109–116. | ||
Ross DT, Scherf U, Eisen MB, et al. Systematic variation in gene expression patterns in human cancer cell lines. Nat Genet. 2000;24(3):227–235. | ||
Smith MJ, Coffey JC, Wang JH, Cotter TG, Redmond HP. Gene expression profiling in biliary atresia. Lancet. 2003;361(9361):971–972; author reply 972. | ||
Chattopadhyay PK, Hogerkorp CM, Roederer M. A chromatic explosion: the development and future of multiparameter flow cytometry. Immunology. 2008;125(4):441–449. | ||
Yang G, Rich JR, Gilbert M, Wakarchuk WW, Feng Y, Withers SG. Fluorescence activated cell sorting as a general ultra-high-throughput screening method for directed evolution of glycosyltransferases. J Am Chem Soc. 2010;132(30):10570–10577. | ||
Shah PK, Herrera-Loeza SG, Sims CE, Yeh JJ, Allbritton NL. Small sample sorting of primary adherent cells by automated micropallet imaging and release. Cytometry A. 2014;85(7):642–649. | ||
Xu W, Sims CE, Allbritton NL. Microcup arrays for the efficient isolation and cloning of cells. Anal Chem. 2010;82(8):3161–3167. | ||
George MD, Wehkamp J, Kays RJ, et al. In vivo gene expression profiling of human intestinal epithelial cells: analysis by laser microdissection of formalin fixed tissues. BMC Genomics. 2008;9(1):209. | ||
Gjerdrum LM, Lielpetere I, Rasmussen LM, Bendix K, Hamilton-Dutoit S. Laser-assisted microdissection of membrane-mounted paraffin sections for polymerase chain reaction analysis: identification of cell populations using immunohistochemistry and in situ hybridization. J Mol Diagn. 2001;3(3):105–110. | ||
Nyengaard JR. Stereologic methods and their application in kidney research. J Am Soc Nephrol. 1999;10(5):1100–1123. | ||
Winter D, Schneider M, O’Sullivan G, Harvey B, Geibel J. Rapid effects of aldosterone on sodium-hydrogen exchange in isolated colonic crypts. J Membr Biol. 1999;170(1):17–26. | ||
Xie F, Sun G, Stiller JW, Zhang B. Genome-wide functional analysis of the cotton transcriptome by creating an integrated EST database. PloS One. 2011;6(11):e26980. | ||
Vandesompele J, De Preter K, Pattyn F, et al. Accurate normalization of real-time quantitative RT-PCR data by geometric averaging of multiple internal control genes. Genome Biol. 2002;3(7):RESEARCH0034. | ||
Andersen C, Jensen J, Orntoft T. Normalization of real-time quantitative reverse transcription-PCR data: a model-based variance estimation approach to identify genes suited for normalization, applied to bladder and colon cancer data sets. Cancer Res. 2004;64:5245–5250. | ||
Pfaffl MW, Tichopad A, Prgomet C, Neuvians TP. Determination of stable housekeeping genes, differentially regulated target genes and sample integrity: BestKeeper – Excel-based tool using pair-wise correlations. Biotechnol Lett. 2004;26(6):509–515. | ||
Silver N, Best S, Jiang J, Thein S. Selection of housekeeping genes for gene expression studies in human reticulocytes using real-time PCR. BMC Mol Biol. 2006;7(1):33. | ||
Livak KJ, Schmittgen TD. Analysis of relative gene expression data using real-time quantitative PCR and the the 2(-Delta Delta C(T)) method. Methods. 2001;25(4):402–408. | ||
Collins D, Hogan AM, Skelly MM, Baird AW, Winter DC. Cyclic AMP-mediated chloride secretion is induced by prostaglandin F2alpha in human isolated colon. Br J Pharmacol. 2009;158(7):1771–1776. | ||
Rogers A. Polyamines and Their Influence on Colonic Physiology. Dublin: Faculty of Medicine, University College; 2013. | ||
Medani M, Collins D, Mohan HM, Walsh E, Winter DC, Baird AW. Prostaglandin D2 regulates human colonic ion transport via the DP1 receptor. Life Sci. 2015;122:87–91. | ||
Rogers AC, McDermott FD, Mohan HM, O’Connell PR, Winter DC, Baird AW. The effects of polyamines on human colonic mucosal function. Eur J Pharmacol. 2015;764:157–163. | ||
Zachos NC, Kovbasnjuk O, Foulke-Abel J, et al. Human enteroids/colonoids and intestinal organoids functionally recapitulate normal intestinal physiology and pathophysiology. J Biol Chem. 2016;291(8):3759–3766. | ||
Jung P, Sato T, Merlos-Suarez A, et al. Isolation and in vitro expansion of human colonic stem cells. Nat Med. 2011;17(10):1225–1227. | ||
van der Flier LG, Clevers H. Stem cells, self-renewal, and differentiation in the intestinal epithelium. Ann Rev Physiol. 2009;71:241–260. | ||
Kindon H, Pothoulakis C, Thim L, Lynch-Devaney K, Podolsky DK. Trefoil peptide protection of intestinal epithelial barrier function: cooperative interaction with mucin glycoprotein. Gastroenterology. 1995;109(2):516–523. | ||
Wehkamp J, Schmid M, Stange EF. Defensins and other antimicrobial peptides in inflammatory bowel disease. Curr Opin Gastroenterol. 2007;23(4):370–378. |
 © 2018 The Author(s). This work is published and licensed by Dove Medical Press Limited. The full terms of this license are available at https://www.dovepress.com/terms.php and incorporate the Creative Commons Attribution - Non Commercial (unported, v3.0) License.
By accessing the work you hereby accept the Terms. Non-commercial uses of the work are permitted without any further permission from Dove Medical Press Limited, provided the work is properly attributed. For permission for commercial use of this work, please see paragraphs 4.2 and 5 of our Terms.
© 2018 The Author(s). This work is published and licensed by Dove Medical Press Limited. The full terms of this license are available at https://www.dovepress.com/terms.php and incorporate the Creative Commons Attribution - Non Commercial (unported, v3.0) License.
By accessing the work you hereby accept the Terms. Non-commercial uses of the work are permitted without any further permission from Dove Medical Press Limited, provided the work is properly attributed. For permission for commercial use of this work, please see paragraphs 4.2 and 5 of our Terms.