")
Back to Journals » Diabetes, Metabolic Syndrome and Obesity » Volume 11
Is there an association between liraglutide use and female breast cancer in a real-world setting?
Authors Funch D, Mortimer K, Li L , Norman H , Major-Pedersen A, Olsen AH, Kaltoft MS , Dore DD
Received 18 April 2018
Accepted for publication 3 August 2018
Published 22 November 2018 Volume 2018:11 Pages 791—806
DOI https://doi.org/10.2147/DMSO.S171503
Checked for plagiarism Yes
Review by Single anonymous peer review
Peer reviewer comments 2
Editor who approved publication: Professor Ming-Hui Zou
Donnie Funch,1 Kathleen Mortimer,1 Ling Li,1 Heather Norman,1 Atheline Major-Pedersen,2 Anne Helene Olsen,3 Margit S Kaltoft,4 David D Dore1,5
1Optum Epidemiology, Boston, MA, USA; 2Global Safety, Novo Nordisk A/S, Copenhagen, Denmark; 3Epidemiology, Novo Nordisk A/S, Copenhagen, Denmark; 4Global Development, Novo Nordisk A/S, Copenhagen, Denmark; 5Department of Health Services, Policy & Practice, Brown University School of Public Health, Providence, RI, USA
Background: Liraglutide is a human glucagon-like peptide-1 receptor agonist approved for treatment of adults with type 2 diabetes mellitus at a maximum dose of 1.8 mg/day (Victoza®) and more recently at 3.0 mg/day for weight management (Saxenda®). During the evaluation of liraglutide for approval in weight management, a minor imbalance in the numbers of reported breast neoplasms was observed, motivating the present study. Our objective was to quantify the association between liraglutide and incidence of breast cancer (BC) among women in a real-world setting.
Patients and methods: Women initiating liraglutide or other antidiabetic therapies and who were enrolled in a large US health plan (2010–2014) were included. Comparisons of BC incidence rates were made between matched cohorts of initiators of liraglutide and cohorts of initiators of exenatide, metformin, pioglitazone, sulfonylureas, and dipeptidyl peptidase-4 inhibitors separately and as two “all comparators” groupings: with or without exenatide. Women with two or more claims with BC diagnosis codes within 61days of each other were identified as possible cases, with additional confirmation by clinician review of comprehensive claims listings. Propensity score matched intention-to-treat (ITT) and time-on-drug (TOD) analyses were completed via Poisson regression. A latency analysis was performed.
Results: Relative risks for BC for liraglutide vs comparators from the ITT analyses ranged from 0.90 (95% CI: 0.67–1.22) for both the “all comparator” and “all comparator except exenatide” cohorts to 1.46 (95% CI: 0.96–2.22) relative to exenatide. Latency analyses excluding the first year of follow-up yielded slightly attenuated point estimates. The TOD analyses of cumulative use of liraglutide suggested no increased risk of BC.
Conclusion: Neither the ITT (overall or latency analysis) nor cumulative TOD analyses suggested an elevated risk of BC among liraglutide initiators. Short length of follow-up and the potential for confounding by unmeasured factors limit the full assessment of long-term risk.
Keywords: glucagon-like peptide-1 receptor agonist, type 2 diabetes, administrative claims, intention-to-treat, time-on-drug
Introduction
Liraglutide is a human glucagon-like peptide-1 receptor agonist (RA) approved for the treatment of adults with type 2 diabetes mellitus (T2DM) and more recently for weight management.1,2 In the randomized trials conducted for liraglutide 3.0 mg (Saxenda®; Novo Nordisk A/S, Copenhagen, Denmark) weight management indication, a twofold imbalance of breast neoplasms occurred. While the numbers were small, this imbalance was not seen in the development program for T2DM.3 Most breast cancer (BC) cases were diagnosed during the first year of follow-up and occurred more frequently among women who lost more weight, potentially making discovery of the cancers more likely, suggesting detection bias.4,5 Nevertheless, these findings were sufficient to result in a concern that GLP-1 RAs might increase the risk of BC.6 Hicks et al have also presented a hypothesis relating to a possible biological effect.7 Preclinical studies have shown that GLP-1 receptors are located on normal breast tissue8 and suggest that GLP-1 analogs could promote tumor growth via fibroblast growth factor 7.9,10 Given that both T2DM and obesity are also known risk factors for BC, evaluation of medications that may increase the risk of BC is warranted.11–13 These concerns motivated the current investigation, taking advantage of an ongoing post-marketing safety study of liraglutide (1.2 mg and 1.8 mg) used for treatment of diabetes.
This study quantifies the relationship between liraglutide and BC relative to comparison groups using a new-user, active-comparator study design within a well-defined population of women from a US administrative health care database.14
Research design and methods
Study population and exposures
A prospective cohort study was conducted within the Optum Research Database, a large, geographically diverse population of commercial health insurance enrollees in the US. The study antidiabetic drugs (ADs) included liraglutide and comparator medications, including exenatide, metformin, pioglitazone, a sulfonylurea (SU; glyburide, glipizide, glimepiride), or a dipeptidyl peptidase-4 inhibitor (DPP-4i; sitagliptin, saxagliptin, linagliptin). Patients were women aged 18 years and over who initiated liraglutide or a comparator following at least 6 months of continuous health plan enrollment with complete medical and pharmacy benefits. Drug initiation was defined as an observed dispensing for a study AD, with the absence of a dispensing of that drug or drug class during the preceding baseline period of 6 months. Patients with any ICD ninth edition (ICD-9) diagnosis codes for malignant neoplasm of female breast (174.x) or personal history of malignant neoplasm of breast (V10.3) in the baseline period were excluded as prevalent cancers. This study was approved by the New England Institutional Review Board and Privacy Board.
Patients with eligible initiations were identified from 01 February 2010 to 30 November 2014. Due to changing prescribing patterns and composition of drugs in the US market, cohorts were assembled quarterly for 2010–2012 and annually for 2013–2014 (14 calendar blocks). Follow-up time began the day after the first eligible initiation and continued until the earliest of disenrollment from the health plan, the occurrence of BC, or the end of the study period (December 31, 2014).
Covariates and propensity score (PS) modeling
PS matched analyses were conducted to balance baseline covariates characterizing demography, comorbidity, concomitant medications, and intensity of health care utilization. PSs were estimated separately for each of the seven comparison groups (five comparator drugs as well as for “all comparators” and “all comparators minus exenatide” [to remove any GLP-1 RA effect]).15–17 Key covariates, including use of other ADs including insulin, are noted in Table 1. Because PSs balance only measured covariates and their correlates, missing or miss-measured covariates may allow for residual confounding.18 Several hundred covariates were considered for the PS model to reduce the impact of potential residual confounding.19
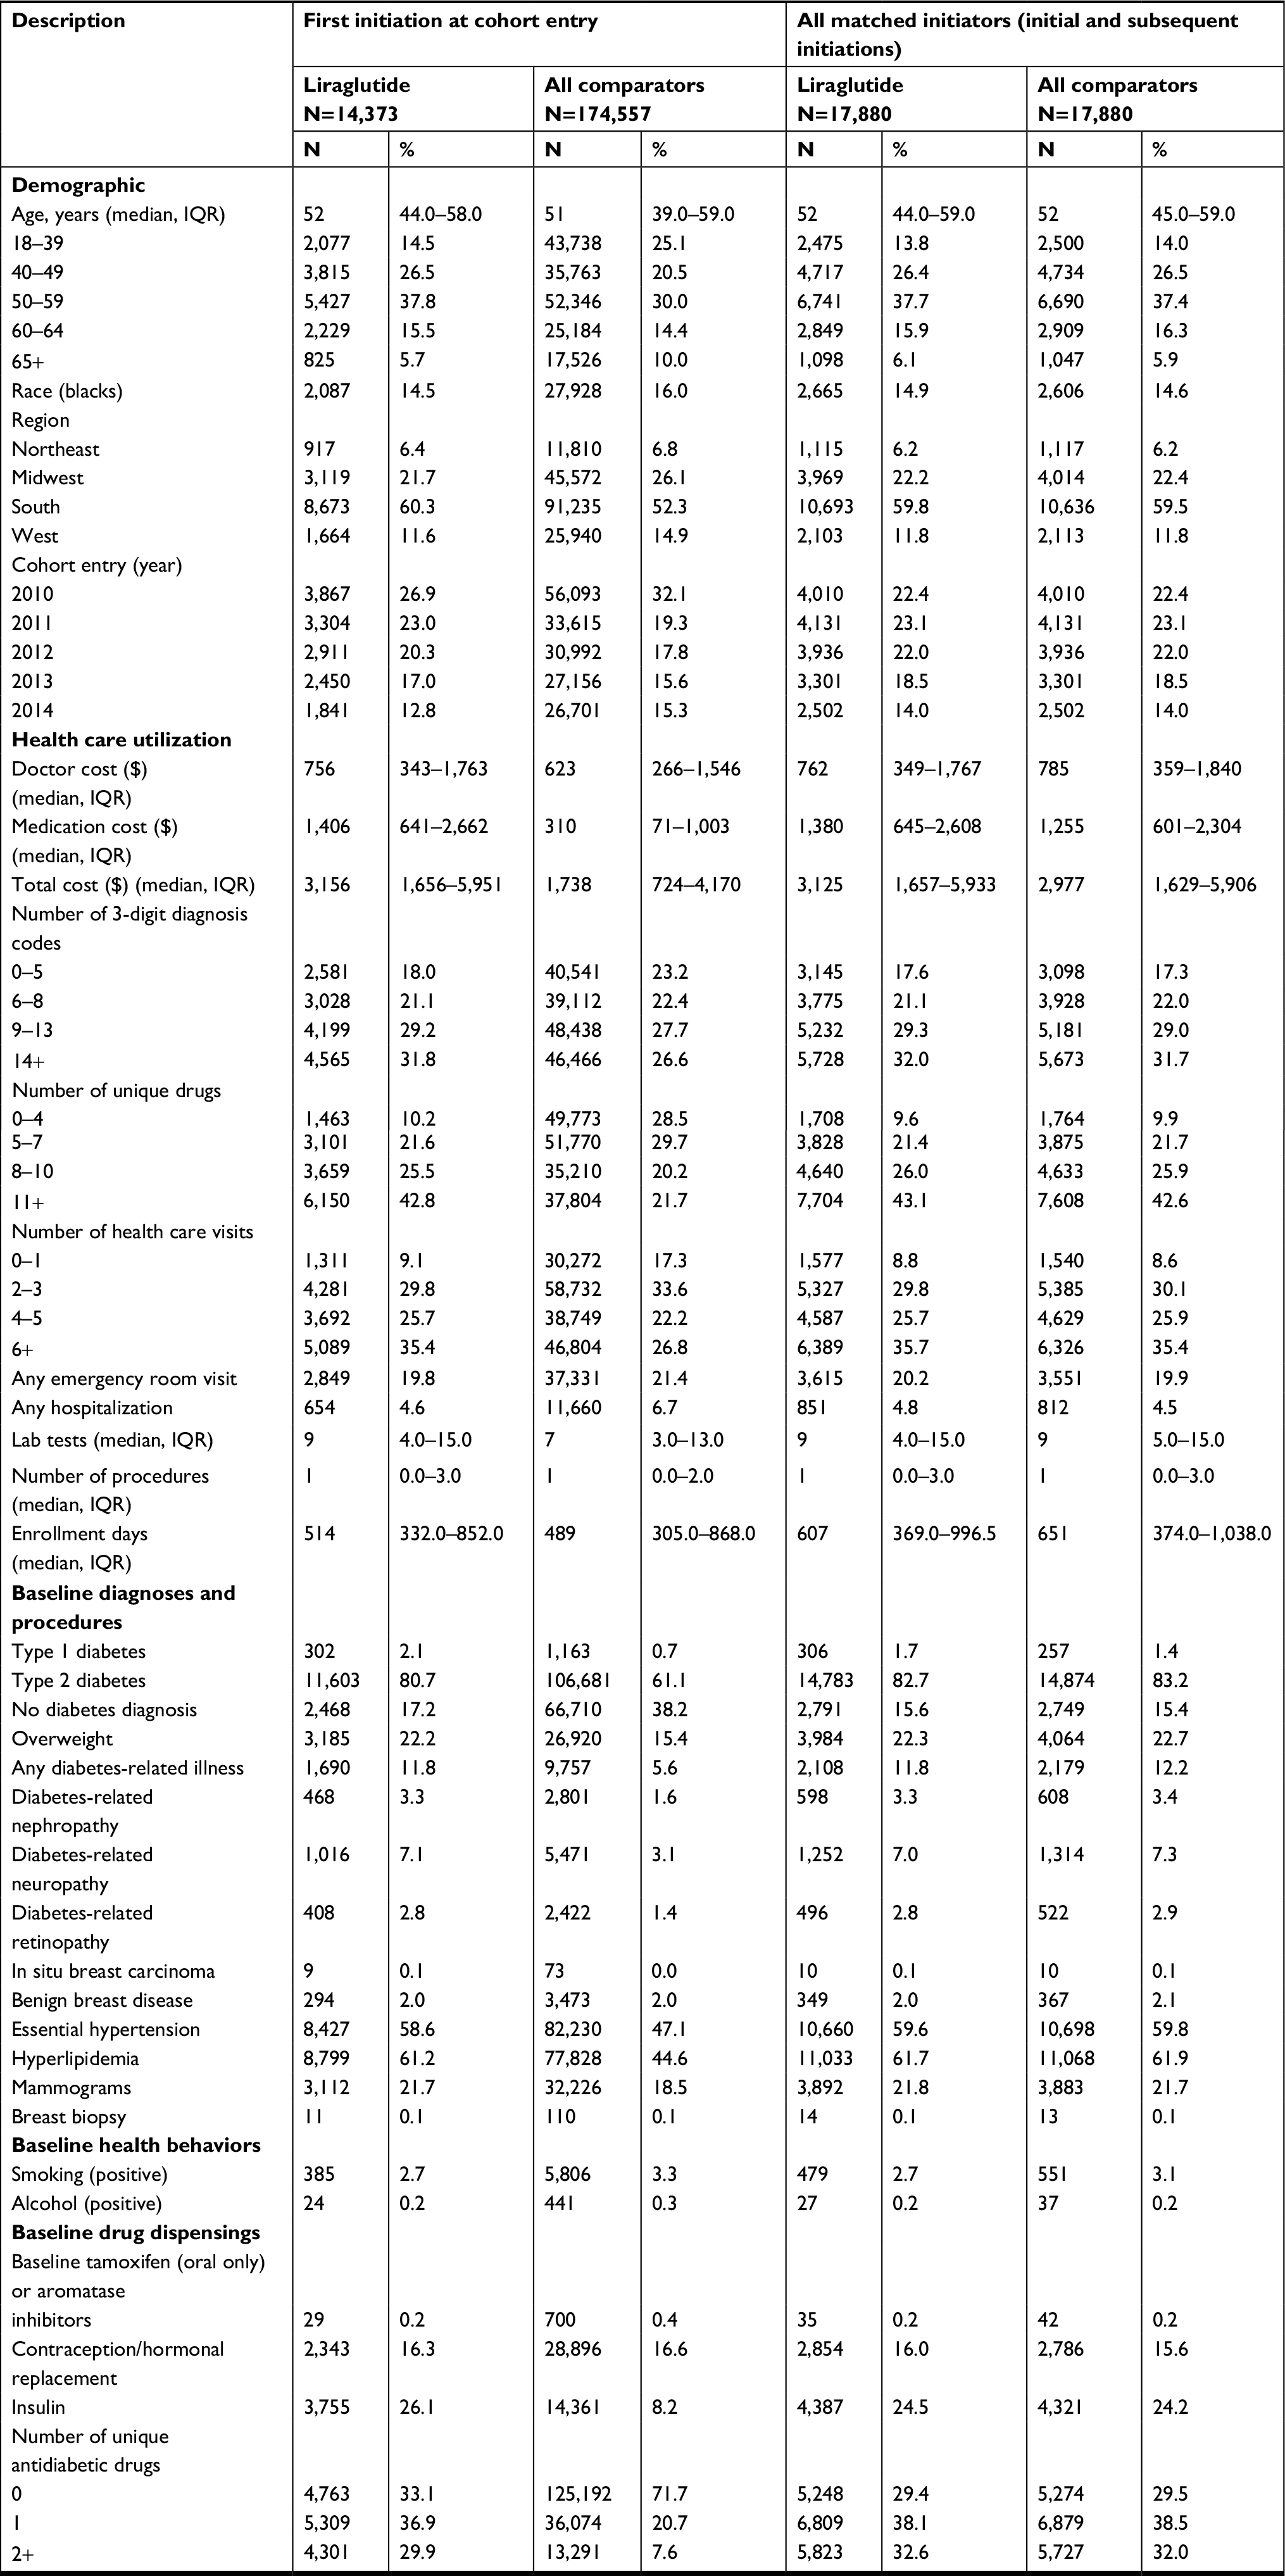 | Table 1 Baseline descriptive characteristics for all female initiators at the time of their first initiation and matcheda initiators (from all initiations) Notes: aPatients may have initiated multiple times during the study period, but are allowed to match only once into each drug cohort pair. |
Variables that were correlated with the exposures and likely to be correlated with BC were forced into the model to ensure that they contributed to the final PS estimates. Known risk factors for BC (eg, ductal carcinoma in situ, overweight/obesity), screening procedures, markers for diabetes severity, and variables representing baseline AD use were included. Additional predictors were selected with forward stepwise regression.
Within each of the 14 calendar blocks, initiators of liraglutide were PS matched 1:1 to initiators in each of the comparison groups.20 Patients who did not match during one accrual time block but initiated that same drug or another study drug in a later accrual time block were again eligible for matching, and the PS was re-estimated using a 6-month baseline period prior to that initiation. Patients could enter into multiple matched cohorts but were allowed to match into each drug cohort pair only once. For logistical reasons, BC case status was determined prior to the PS estimation, but matching occurred without consideration of case status.
Outcome assessment
Potential claims-identified BC cases were initially identified by an algorithm developed by Setoguchi et al .21 The algorithm required 2 or more days with claims with an ICD-9 code for malignant neoplasm of the breast (ICD-9 174.x) within 61 days of each other that were associated with inpatient, outpatient, or emergency room encounters. This algorithm had a high positive predictive value (PPV) within Medicare claims data (PPV 76.6%), but the population of the Optum study was younger and therefore was considered to be potentially at lower risk for BC.22 Given that the validity of measurement of outcomes will generally decrease with decreasing frequency of occurrence23 and the Setoguchi study also included in situ BCs which were not included in this study, an additional review of detailed chronological listings of claims for services and treatments (patient profiles) for each potential case of BC was included. An independent clinical consultant conducted claims review using patient profiles covering the period 3 months prior to the qualifying BC diagnosis to the end of a woman’s follow-up data or the end of the study (December 31, 2014). The clinical reviewer considered the presence and timing of relevant procedures (eg, biopsies and mammograms), diagnoses, treatments (eg, chemotherapy, radiation, mastectomy), types of specialists associated with diagnoses (eg, oncologist), and general patterns of care to classify potential cases into one of the following three categories:
- New-onset (incident) BC (highly likely BC case occurring following study drug initiation date)
- BC with onset date likely prior to study cohort entry date (prevalent case)
- Not a case of BC (sufficient evidence to rule out BC)
For incident BC cases, the clinical reviewer also recorded the earliest date on which there was an indication that BC was present. Only incident cases were used in the analyses.
Statistical methods
Baseline characteristics are provided for liraglutide initiators and “all comparators” combined. Because of the complexity of drug use patterns, several methods were used to separately quantify risks associated with starting liraglutide, being on liraglutide currently, and cumulative exposure. As the primary analysis, an analog to intention-to-treat (ITT) analysis of randomized trials was applied to quantify the risk associated with starting treatment, attributing all follow-up time to the initial exposure cohort. Incidence rates (BC cases per 100,000 person-years) were estimated as the number of patients with BC divided by the person-years of follow-up. Poisson regression models were used to estimate incidence rate ratios (RRs) and 95% CIs for liraglutide vs each comparator group. Generalized estimating equations (GEEs) were used to account for the paired nature of the data created by matching, except in cases when data were too sparse to support the GEE estimation.24 In a latency analysis, person-time and BC cases from the first year of each patient’s follow-up were excluded to focus on the probable period of any liraglutide effect on BC.
A time-on-drug (TOD) analysis was performed to evaluate the effect of recency of use of liraglutide. The dispensing date and days’ supply (ie, a pharmacist-estimated number of days that a prescription is expected to last if taken according to the prescribing instructions) were used to categorize each person-day of follow-up into “current”, “recent”, and “past” use, for each study drug. “Current” use included the day after the dispensing date up through the end of the days’ supply. A 31-day grace period was added to the end of days’ supply to allow for variable adherence. “Current” use continued as long as new refill dispensings were observed before the grace period ended. Once the grace period expired, it was assumed the patient discontinued that drug. The next 31 days (person-time occurring between 32 and 62 days after “current” use) were considered as “recent” use. Person-time occurring after “recent” use was categorized as “past” use and persisted unless the patient re-started the same treatment, thereby re-entering the “current” use category. Because many patients switched and added AD therapies regularly, patients in matched pairs may have had use of both liraglutide and a comparator during follow-up. If BC was diagnosed while the patient was currently on liraglutide and had past use of the comparator, for example, the BC case and corresponding person-time were included in the incidence estimate for “current” liraglutide use and “past” comparator use. When patients had concurrent use of both drugs in the comparison, cases and person-time were included in “current” use for both drugs. Poisson regression was used to estimate the RRs and 95% CIs for “current”, “recent”, and “past” use of liraglutide vs the same “current-recent-past” category for comparators, adjusted by the logit of the PS to address confounding.
An additional TOD analysis quantified patients’ cumulative time on liraglutide from cohort entry and compared the associated rate of BC within time unexposed to liraglutide (which was generally exposed to other ADs). For patients who initiated one of the other study drugs and later initiated liraglutide, cumulative exposure to liraglutide began at the time of that dispensing and subsequent person-time was no longer considered “liraglutide unexposed”. RRs were estimated using Poisson regression modeling within categories of cumulative time (<6 months, 6–18 months, and >18 months) relative to all “liraglutide unexposed” time, and models were adjusted for the logit of the PS.
The potential for surveillance bias was considered by comparing frequency of mammography during follow-up for each exposure group. The timing of BC diagnosis relative to cohort entry was examined for each of the seven matched cohorts. In addition, the distribution of cases by age group was examined, relative to the distribution of patients overall.
Results
Over the study period, 192,752 women were identified across all the drug cohorts. Of these, 4,202 (2.2%) had claims consistent with BC in the baseline period and were excluded from this analysis, leaving 188,550 women in the study. There were 1,009 algorithm-identified cases, of which 151 (15.0%) were consistent with prevalent BC, eight (0.8%) were determined to be non-cases, and 850 (84.2%) were clinical reviewer-confirmed incident BC cases (Figure 1).
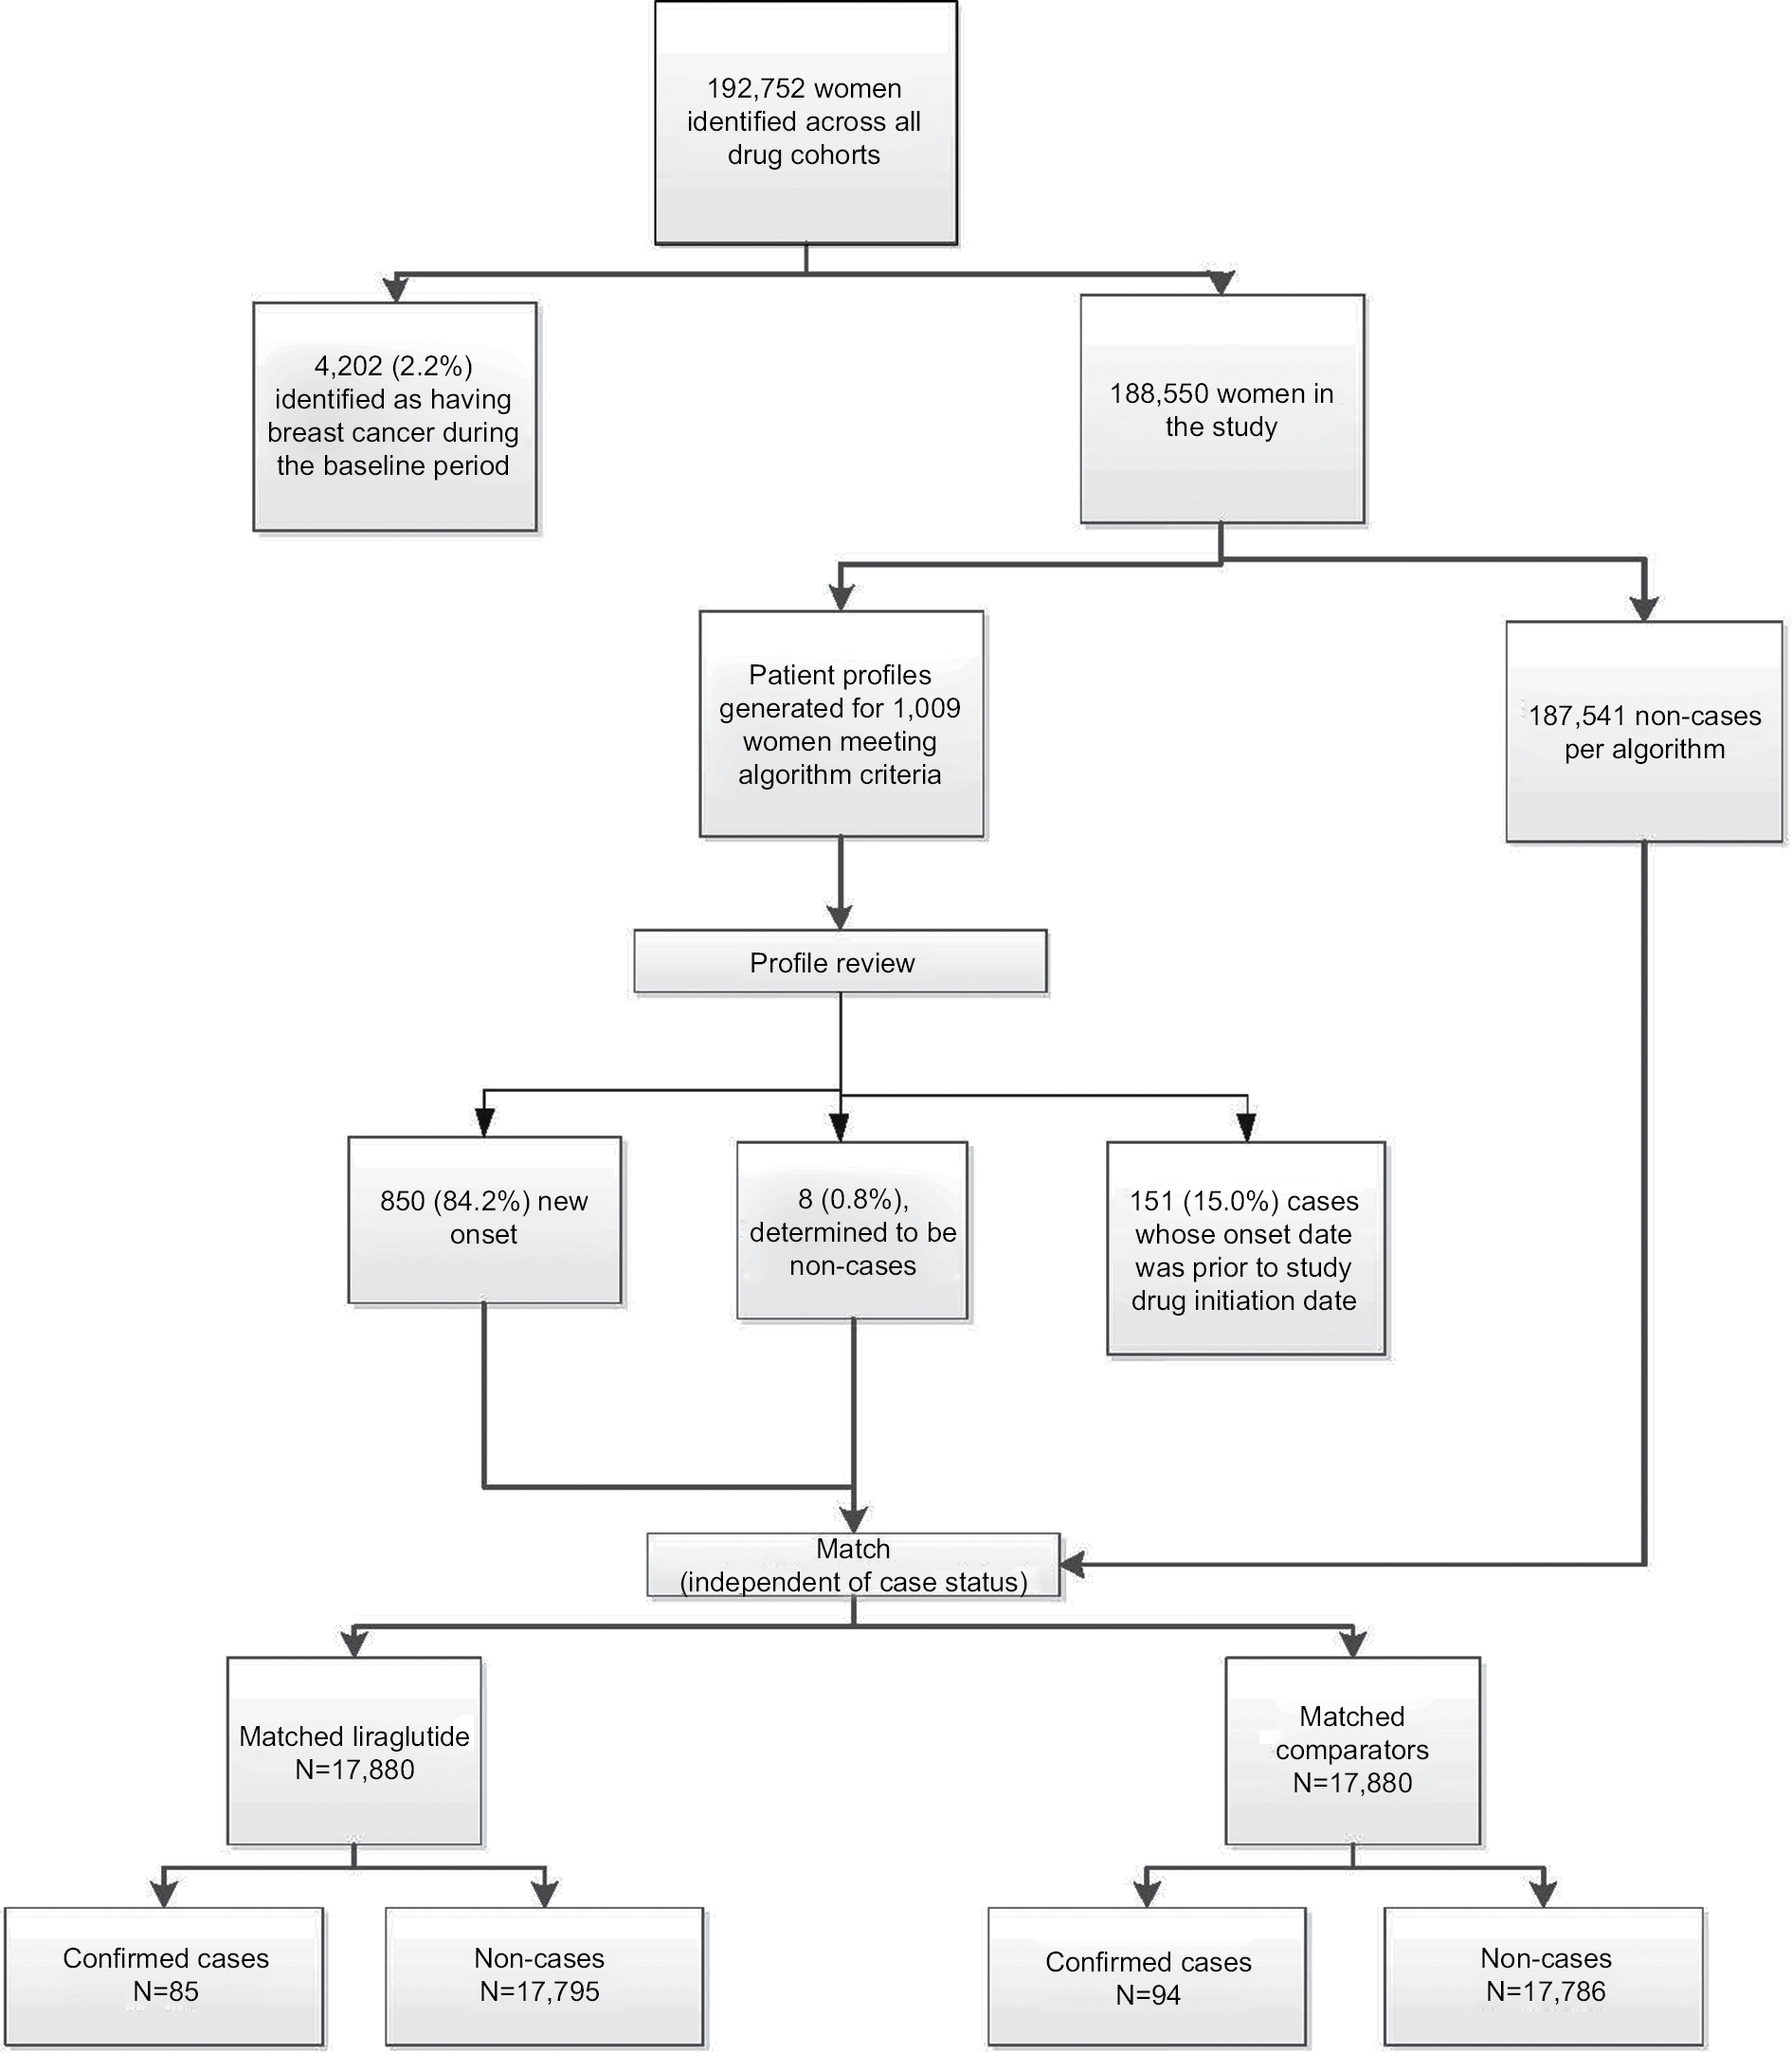 | Figure 1 Identification process and outcome for breast cancer case adjudication Notes: Numbers in the upper portion of this figure reflect the number of actual women and numbers in the matched section of the figure reflect number of matched initiations, including some women who initiated multiple times. |
Among the matched liraglutide and “all comparator” initiators (n=17,880 in each cohort, Figure 1), there were 85 and 94 confirmed cases, respectively. Substantial differences in the sizes of matched cohort pairs were due to variations in available comparators across study drugs.
After PS matching, the baseline characteristics were well matched in the liraglutide and “all comparator” pairs (Table 1) and all other comparator pairs (data not shown). In the matched cohorts, the proportion of cases across age groups was similar, except that the liraglutide cohort cases tended to have a higher proportion in the 60–64 years group and a lower proportion in 40–49 years (Table S1). For all cohorts, the distribution of cases was skewed toward the older ages, relative to the distribution of patients by age. For example, while 5.9% of the “all comparator” patients were age 65+ years, 11.7% of the cases were in that age group. A similar pattern was observed in the liraglutide cohort (6.1% of liraglutide patients were age 65+ years vs 10.6% of cases). Median lengths of follow-up were similar “within” matched drug cohorts, with some variation “across” matched sets (Table 2). Results for the ITT and TOD analyses are presented in Figure 2. In the primary analysis (ITT), RRs ranged from a low of 0.90 for both the comparison with “all comparators” (95% CI: 0.67–1.21) and “all comparators excluding exenatide” (95% CI: 0.67–1.22) to a high of 1.46 (95% CI: 0.96–2.22) relative to exenatide.
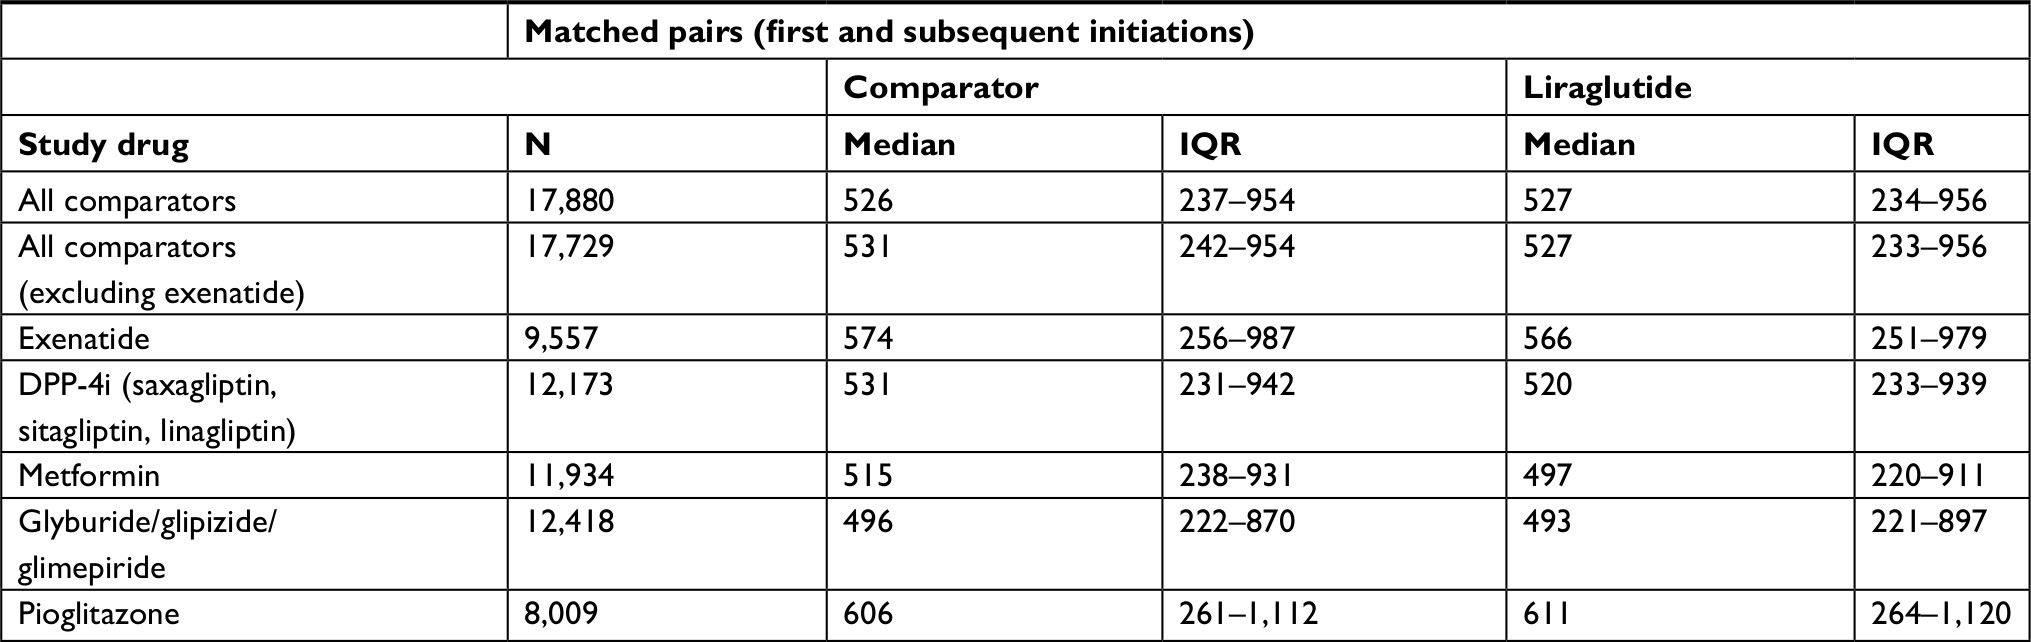 | Table 2 Study follow-up timea in days for matchedb liraglutide/study drug pairs Notes: aFollow-up begins on the day following initiation and continues until end of enrollment, or end of study period (December 31, 2014), whichever comes first. bPatients may have initiated multiple times during the study period, but are allowed to match only once into each drug cohort pair. Abbreviation: DPP-4i, dipeptidyl peptidase-4 inhibitor. |
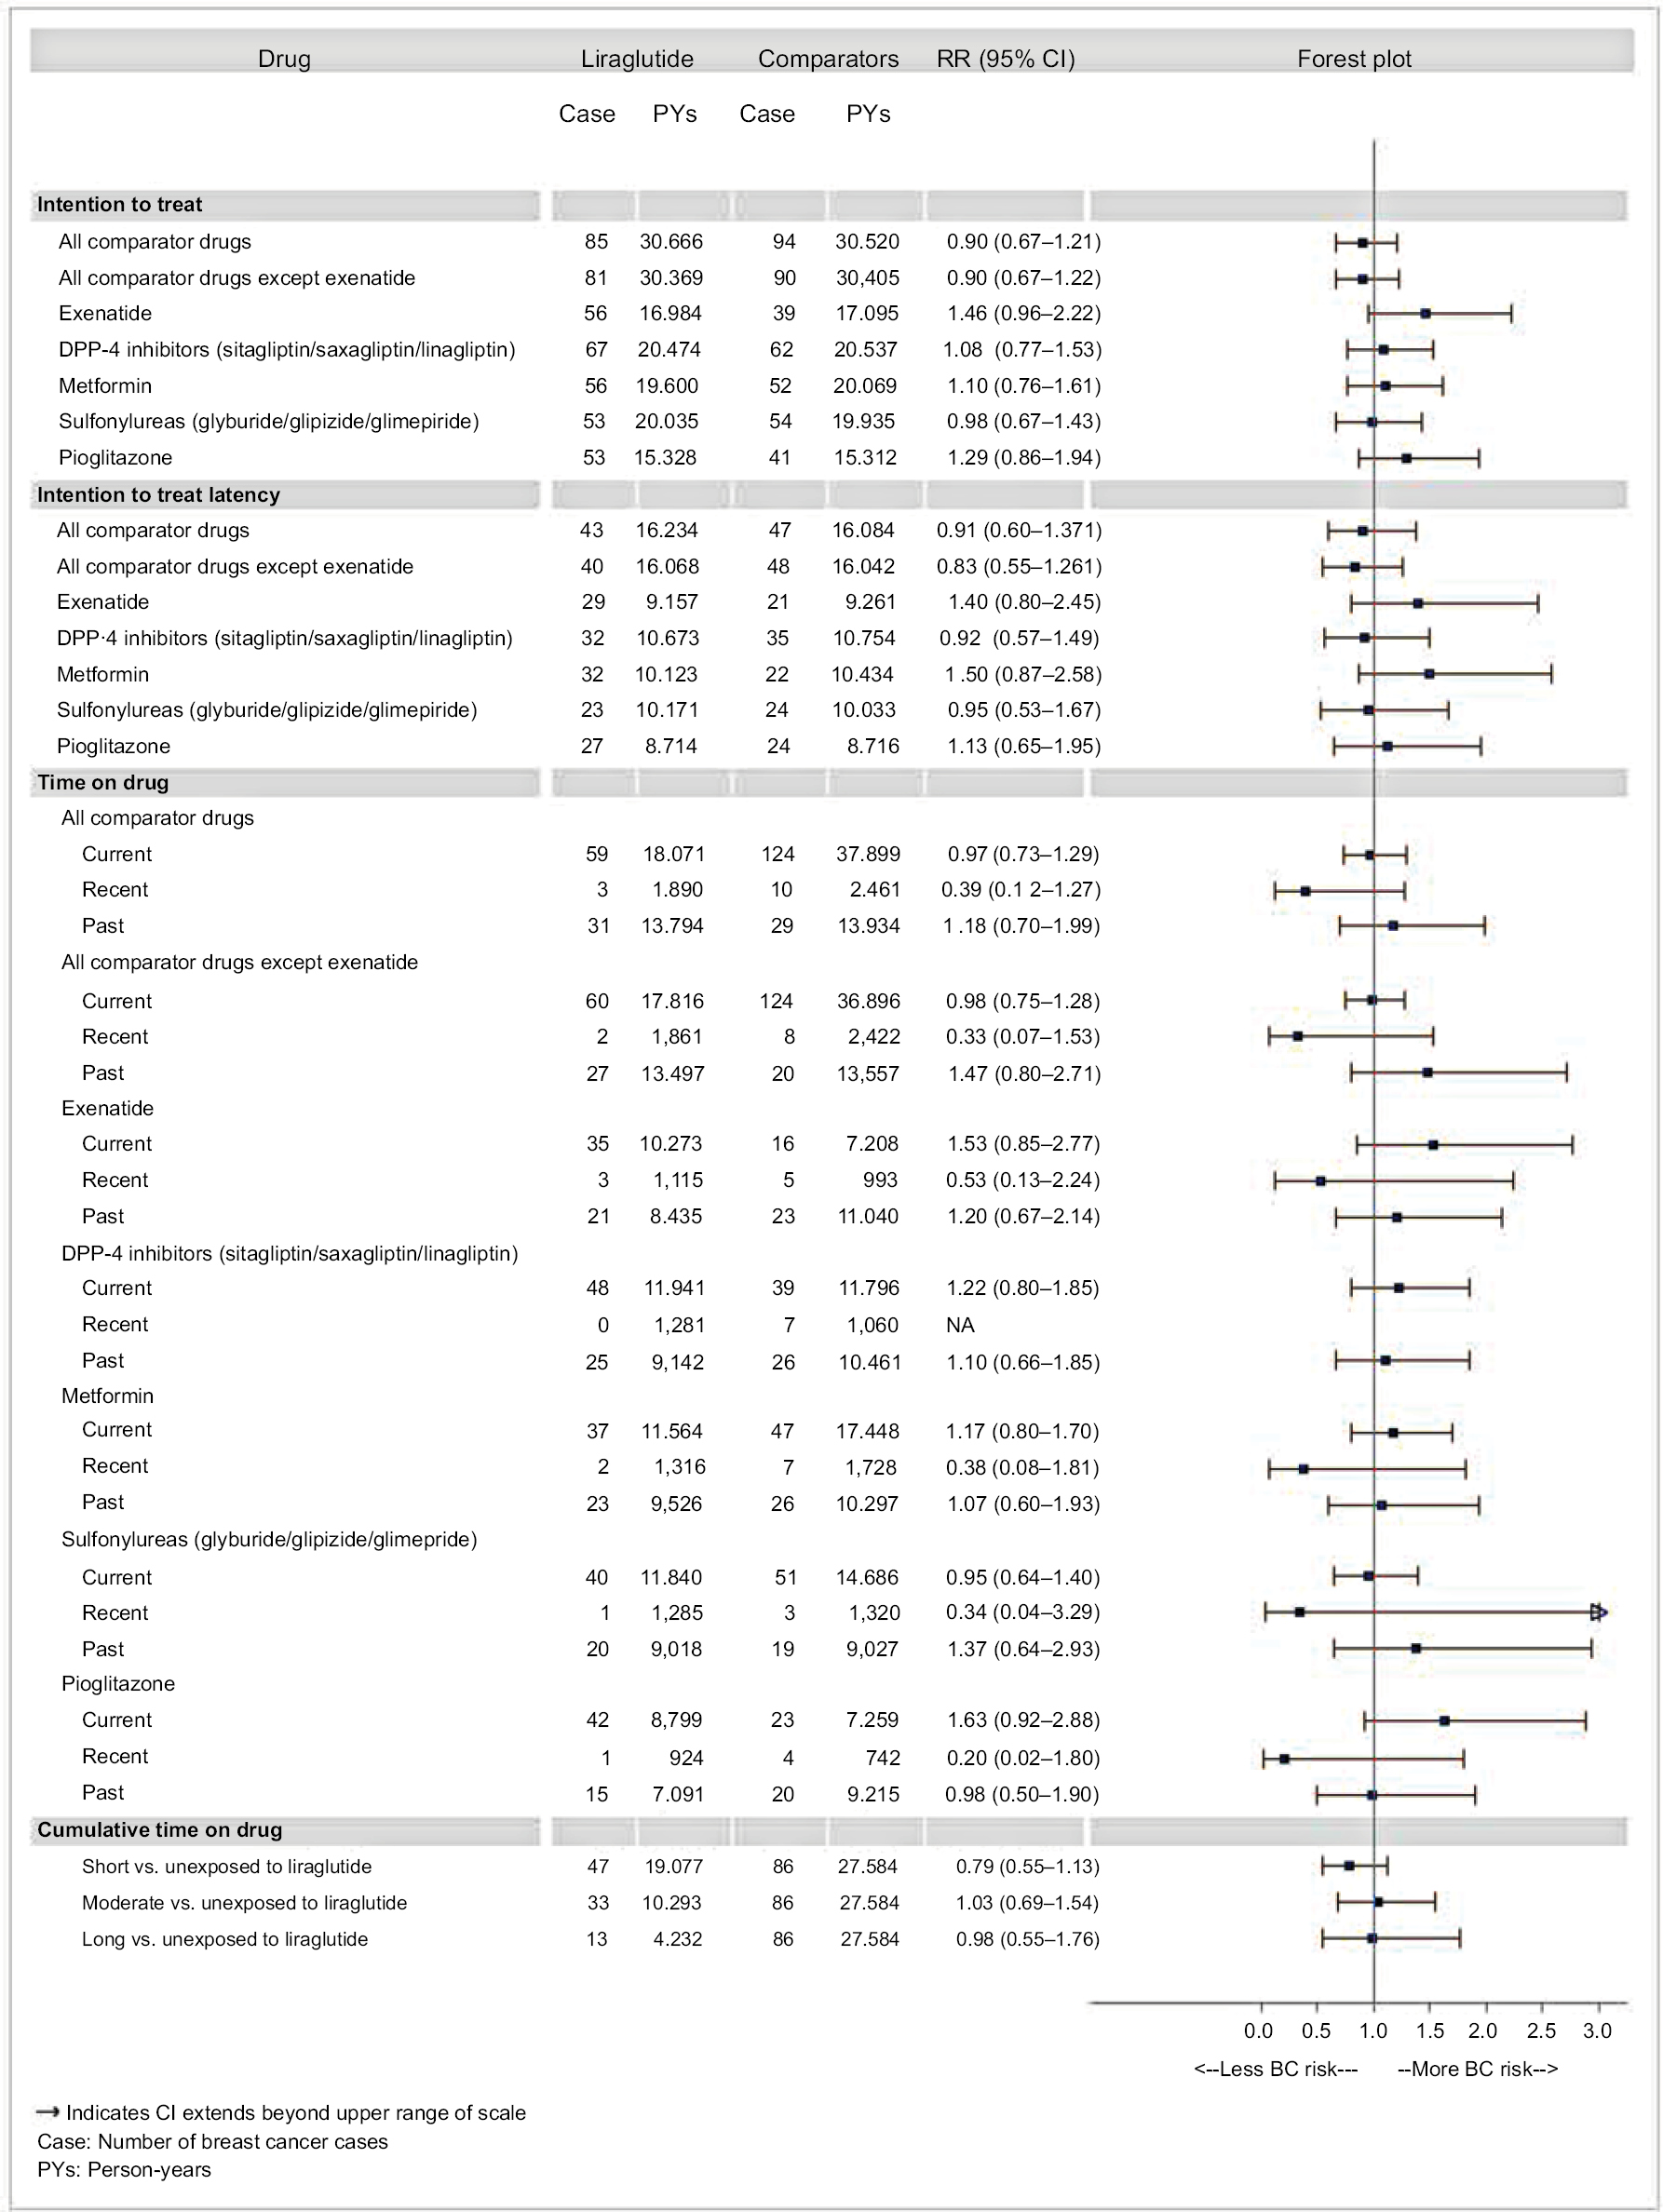 | Figure 2 Propensity score matched ITT and TOD analyses for BC. Abbreviations: ITT, intention-to-treat; TOD, time-on-drug; RR, rate ratio; BC, breast cancer. |
Approximately 50% of all BC cases in the matched cohorts occurred during the first year of follow-up, leading to less precise estimates in the latency analysis. The observed RRs ranged from a low of 0.83 (95% CI: 0.55–1.26) for “all comparators excluding exenatide” to a high of 1.50 (95% CI: 0.87–2.58) for metformin. The RRs in the latency analyses were all the same or smaller and less precise, with the exception of the increase observed for the metformin comparison, from RR 1.10 (95% CI: 0.76–1.61) to 1.50 (95% CI: 0.87–2.58).
In the TOD analyses, RRs during “current” use ranged from a low of 0.95 (95% CI: 0.64–1.40) for SUs to a high of 1.63 (95% CI: 0.92–2.88) for pioglitazone. RRs for “recent” use (32–62 days after current use) were consistently lower than “current” use. RRs for “past” time followed no consistent pattern. The cumulative TOD analysis was performed only for the liraglutide vs “all comparator” matched cohorts. RRs were 0.79 (95% CI: 0.55–1.13) for <6 months of liraglutide exposure, 1.03 (95% CI: 0.69–1.54) for 6–18 months of exposure, and 0.98 (95% CI: 0.55–1.76) for ≥18 months of exposure. Across all ITT and TOD analyses, all comparisons had 95% CIs that included the null.
Assessment of surveillance bias revealed that liraglutide and exenatide cohorts had more mammograms during follow-up than the other cohorts (mean of 0.78 [SD 1.15] and 0.84 [SD 1.22], respectively). In contrast, the SU cohort had a mean of 0.51 (SD 0.95). Within each matched cohort, the time to diagnosis was similar with the exception of the metformin cohort which had a substantially shorter median time to diagnosis (309 vs 415 days) and the DPP-4i cohort which had a longer median time (479 vs 339 days) (Table 3; also see Figures S1–S7).
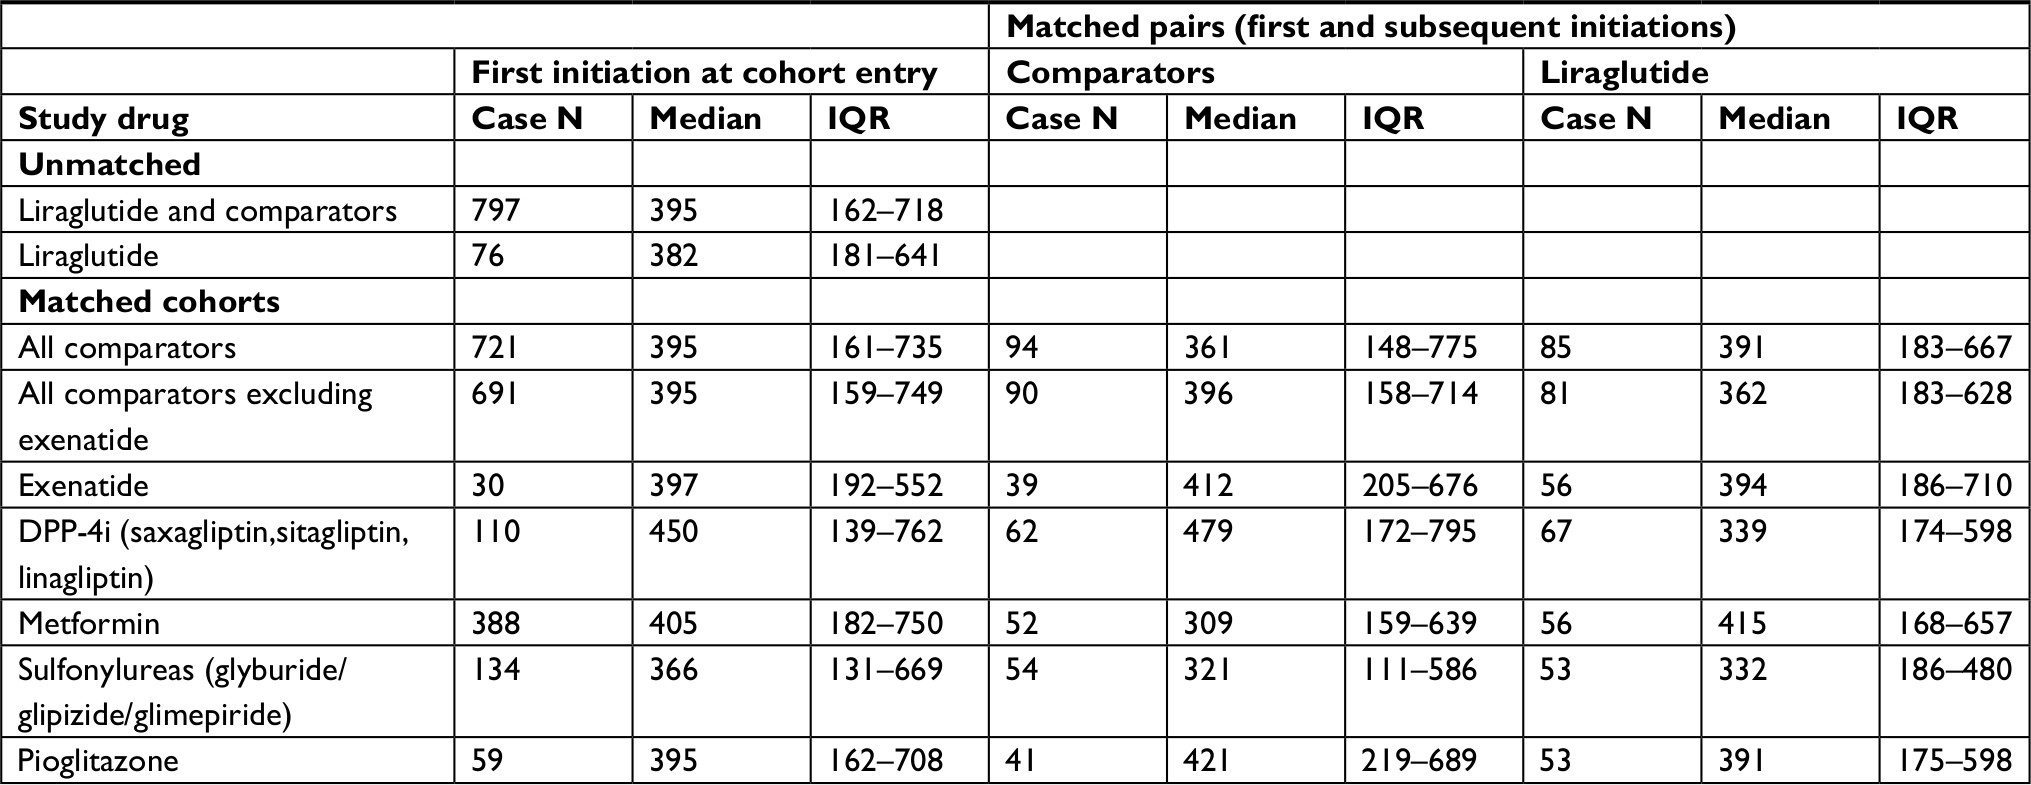 | Table 3 Timea to BC diagnosis in days for adjudicated BC cases (all first initiations and matchedb liraglutide/study drug pairs) Notes: aTime is from day after index date to BC adjudication-determined diagnosis date. bPatients may have initiated multiple times during the study period, but are allowed to match only once into each drug cohort pair. Abbreviations: DPP-4i, dipeptidyl peptidase-4 inhibitor; BC, breast cancer. |
Discussion
Overall, these data are consistent with no association between the use of liraglutide and risk of incident BC across different comparators and several different analyses, similar to the findings of Hicks et al and the LEADER (Liraglutide Effect and Action in Diabetes: Evaluation of Cardiovascular Outcome Results) trial.7,25 Baseline differences between liraglutide initiators and those of other ADs were largely accounted for with the PS matching.
The motivation for this study was the observation of an imbalance in the reported proportion of BC cases in the early liraglutide weight management trials in which adjudicated BCs were reported in 17 (0.7%) of 2,379 liraglutide-treated women compared with three (0.2%) of 1,300 placebo-treated women.3 Most cases were diagnosed during the first year of follow-up, which would likely include BCs that were preclinical at the time of study initiation; follow-up in general was limited (mean of 46 weeks, maximum of 160 weeks). The numbers included ductal carcinoma in situ (four liraglutide and one placebo).
A recently published observational study in the UK using the Clinical Practice Research Datalink compared BC incidence in initiators of GLP-1 RAs (exenatide, liraglutide, others) with initiators of DPP-4i.7 No overall increased risk of BC associated with use of GLP-1 RAs was found (adjusted hazard ratio [HR] 1.40 (95% CI: 0.91–2.16). Findings were similar when liraglutide was the only GLP-1 RA compared to DPP-4i. While the study included 44,984 patients, the primary analysis involved only 498 patients using a GLP-1 RA and 2,422 patients using a DPP-4i. These findings were consistent with findings in the recently completed LEADER trial, comparing liraglutide with placebo. Patients were followed for up to 172 weeks (median, 86 weeks). In LEADER, a small number of malignant breast neoplasms were identified in both groups: 21 patients in the liraglutide group (1.3%, 0.33/100 person-years) and 20 patients in the placebo group (1.2%, 0.31/100 person-years, HR 1.06; 95% CI: 0.57–1.96).25
Several limitations should be considered when interpreting our study findings. Despite balance on a wide array of measurable baseline covariates, the potential for residual confounding by unmeasured factors remains. In particular, a patient’s body mass may influence physicians’ prescribing, particularly for antidiabetic medications which are known to be associated with additional weight loss benefits (eg, liraglutide). If body mass is sufficiently correlated with the included measured covariates, then residual confounding is unlikely, but this is not testable with the available data.
A substantial proportion of the BC cases in the current study were observed within the first year following study drug initiation, and many within the first 6 months. It is recognized that causative agents do not lead to cancers immediately after exposure and may manifest clinically only after several decades.26 While it is possible that diabetic therapies might accelerate the development of a cancer already initiated, each of the pathways to clinically evident cancer requires time before the cancer reaches the point of detection.27
A latency analysis addressed the concern about inclusion of prevalent but undiagnosed cancers at the time of drug initiation. In general, both the overall and the latency analyses provided similar results. Less than a quarter of the matched initiators had 3 or more years of follow-up. Both the current study and the clinical trials had follow-up times that may not allow for full assessment of long-term effects, given the biologically plausible development times for BC.28
The complexity of therapies for patients with diabetes in real-world use settings poses challenges to the design and interpretation of a matched cohort study for BC. The definition of “initiation” required only 6 months with no use of that drug and consequently earlier exposures may not have been captured. In addition to the comparator medications included in this study, patients receive additional ADs and therapies for comorbidities, such as obesity and hypertension. In fact, nearly half of all initiators in each drug cohort had baseline dispensings for metformin (other than metformin initiator cohort). As their diabetes progresses, patients may switch, drop, or add drugs to the initial regimen. Despite the inclusion of many baseline covariates in the PSs to balance the cohorts with respect to these exposures, including insulin and the number of antidiabetic agents, use may differ during the follow-up period leading up to the BC diagnosis.
The first TOD analysis allocated person-time into “current”, “recent”, and “past” time. While for an acute outcome such as a hypersensitivity reaction, the expectation is that “current” time on the drug would be most critical, for outcomes such as cancer with long latency periods, “past” use is highly relevant, but requires lengthy follow-up. The second type of TOD analysis evaluated the potential for a dose–response relationship through calculation of cumulative exposure to liraglutide. In the present study, the similarity of conclusions for the ITT and TOD approaches lends more weight to the finding of no excess risk for BC among liraglutide initiators.
Both obesity and diabetes are recognized risk factors for BC; however, since all of the patients in the study are on antidiabetic medications, and cohorts were matched on many factors related to obesity, the effect estimates are likely to be unconfounded by these factors.
There are a number of strengths. The cohorts were enumerated via a large administrative claims database. The size and breadth of this database enabled numerous comparator cohorts to which liraglutide could be compared, representing therapies with different mechanisms of action. The cohorts were matched across a wide range of variables, including known risk factors for BC. A validated algorithm was used to identify BC cases, supplemented with claims profiles review to further validate case status. This review process is less resource intensive than medical chart adjudication, allowing for the review of a larger population of patients, and since the review is blinded, clinical interpretation of case status was independent of exposure. Analyses to other plausible sources of bias were performed.
Conclusion
Although the relatively short length of follow-up and the potential for residual confounding by unmeasured factors such as obesity limit the ability to fully assess long-term risk, overall the data appear consistent with no effect of liraglutide on the occurrence of BC.
Acknowledgments
The authors would like to acknowledge the contributions of Nicole Brooks for her project oversight and Danielle Cupka for her technical assistance in preparing this manuscript.
This study was funded by a research contract with Novo Nordisk A/S. As part of this contract, Optum Epidemiology retains the right to publish all results. Because this work was undertaken to meet a regulatory requirement, Novo Nordisk reviewed and commented on the protocol and statistical analysis plan underlying this work as well as the final report. The original study design and analytic plan required US FDA approval.
Author contributions
DDD had full access to all the data in the study and took responsibility for the integrity of the data and the accuracy of the data analysis. Because this work was in response to a regulatory (European Medicines Agency) request, Novo Nordisk reviewed and commented on the protocol and statistical analysis plan underlying this work. Study concept and design: DDD, DF, and KM; acquisition of data: LL and HN; analysis and interpretation of data: DDD, DF, KM, LL, and HN; drafting of the manuscript: DF; and critical revision of the manuscript for important intellectual content: DDD, KM, AM-P, AHO, and MSK. All authors contributed toward data analysis, drafting and revising the paper, gave final approval of the version to be published and agree to be accountable for all aspects of the work.
Disclosure
The authors report no conflicts of interest in this work.
References
Available from: https://www.accessdata.fda.gov/drugsatfda_docs/nda/2010/022341s000approv.pdf. Accessed October 10, 2017. | ||
Taylor PN, Baglioni P. Liraglutide in weight management. N Engl J Med. 2015; 373:1779–1782. | ||
Available from: http://www.novonordisk.ca/content/dam/Canada/AFFILIATE/www-novonordisk-ca/OurProducts/PDF/Saxenda_PM_English.pdf. Accessed October 26, 2017. | ||
Pi-Sunyer X, Astrup A, Fujioka K, et al; SCALE Obesity and Prediabetes NN8022-1839 Study Group. A randomized, controlled trial of 3.0 mg of liraglutide in weight management. N Engl J Med. 2015;373(1):11–22. | ||
Eichholzer M, Huang DJ, Modlasiak A, et al. Impact of body mass index on prognostically relevant breast cancer tumor characteristics. Breast Care (Basel). 2013;8(3):192–198. | ||
Available from: http://www.ema.europa.eu/docs/en_GB/document_library/EPAR_-_Public_assessment_report/human/003780/WC500185788.pdf. Accessed November 14, 2017. | ||
Hicks BM, Yin H, Yu OH, Pollak MN, Platt RW, Azoulay L. Glucagon-like peptide-1 analogues and risk of breast cancer in women with type 2 diabetes: population based cohort study using the UK Clinical Practice Research Datalink. BMJ. 2016;355:i5340. | ||
Körner M, Stöckli M, Waser B, Reubi JC. GLP-1 receptor expression in human tumors and human normal tissues: potential for in vivo targeting. J Nucl Med. 2007;48(5):736–743. | ||
Koehler JA, Baggio LL, Yusta B, et al. GLP-1R agonists promote normal and neoplastic intestinal growth through mechanisms requiring Fgf7. Cell Metab. 2015;21(3):379–391. | ||
Tannheimer SL, Rehemtulla A, Ethier SP. Characterization of fibroblast growth factor receptor 2 overexpression in the human breast cancer cell line SUM-52PE. Breast Cancer Res. 2000;2(4):311–320. | ||
Larsson SC, Mantzoros CS, Wolk A. Diabetes mellitus and risk of breast cancer: a meta-analysis. Int J Cancer. 2007;121(4):856–862. | ||
Hardefeldt PJ, Edirimanne S, Eslick GD. Diabetes increases the risk of breast cancer: a meta-analysis. Endocr Relat Cancer. 2012;19(6):793–803. | ||
Neuhouser ML, Aragaki AK, Prentice RL, et al. Overweight, obesity, and postmenopausal invasive breast cancer risk. JAMA Oncol. 2015;1(5):611–621. | ||
Lund JL, Richardson DB, Stürmer T. The active comparator, new user study design in pharmacoepidemiology: historical foundations and contemporary application. Curr Epidemiol Rep. 2015;2(4):221–228. | ||
D’Agostino RB Jr. Propensity score methods for bias reduction in the comparison of a treatment to a non-randomized control group. Stat Med. 1998;17(19):2265–2281. | ||
Rubin DB, Thomas N. Matching using estimated propensity scores: relating theory to practice. Biometrics. 1996;52(1):249–264. | ||
Rosenbaum PR, Rubin DB. The central role of the propensity score in observational studies for causal effects. Biometrika. 1983;70(1):41–55. | ||
Seeger JD, Kurth T, Walker AM. Use of propensity score technique to account for exposure-related covariates: an example and lesson. Med Care. 2007;45(10 Suppl 2):S143–S148. | ||
Schneeweiss S, Rassen JA, Glynn RJ, Avorn J, Mogun H, Brookhart MA. High-dimensional propensity score adjustment in studies of treatment effects using health care claims data. Epidemiology. 2009;20(4):512–522. | ||
Parsons LS. Reducing bias in a propensity-score matched-pair sample using greedy matching techniques. In: Proceedings of the Twenty-Sixth Annual SAS Users Group International Conference; April 22–25, 2001; Cary, NC, USA. Paper 214–226. | ||
Setoguchi S, Solomon DH, Glynn RJ, Cook EF, Levin R, Schneeweiss S. Agreement of diagnosis and its date for hematologic malignancies and solid tumors between medicare claims and cancer registry data. Cancer Causes Control. 2007;18(5):561–569. | ||
Koroukian SM, Cooper GS, Rimm AA. Ability of Medicaid claims data to identify incident cases of breast cancer in the Ohio Medicaid population. Health Serv Res. 2003;38(3):947–960. | ||
Green MS. Use of predictive value to adjust relative risk estimates biased by misclassification of outcome status. Am J Epidemiol. 1983;117(1):98–105. | ||
Austin PC. Type I error rates, coverage of confidence intervals, and variance estimation in propensity-score matched analyses. Int J Biostat. 2009;5(1):Article 13. | ||
Marso SP, Daniels GH, Brown-Frandsen K, et al. Liraglutide and cardiovascular outcomes in type 2 diabetes. N Engl J Med. 2016;375(4):311–322. | ||
Howard J. White Paper on Minimum latency and types or categories of cancer. World Trade Center Health Program, May 1, 2013. Available from: https://www.cdc.gov/wtc/pdfs/policies/wtchpminlatcancer2013-05-01-508.pdf. Accessed November 14, 2017. | ||
Vogelstein B, Kinzler KW. The Path to Cancer – Three Strikes and You’re Out. N Engl J Med. 2015;373(20):1895–1898. | ||
Nadler DL, Zurbenko IG. Estimating cancer latency times using a Weibull model. Adv Epidemiol. 2014;2014(1):1–8. |
Supplementary materials
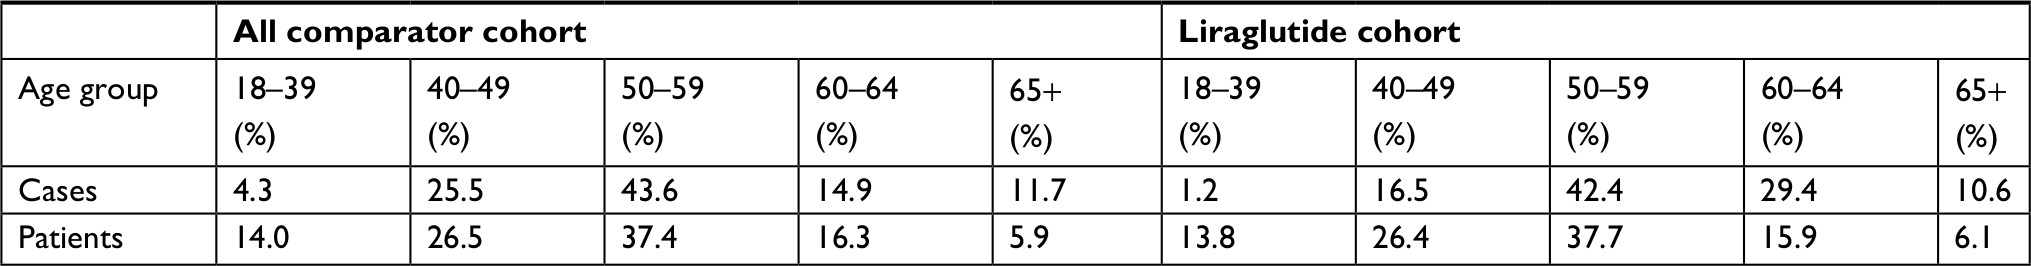 | Table S1 Distribution of breast cancer cases and patients by age group and matched cohorts |
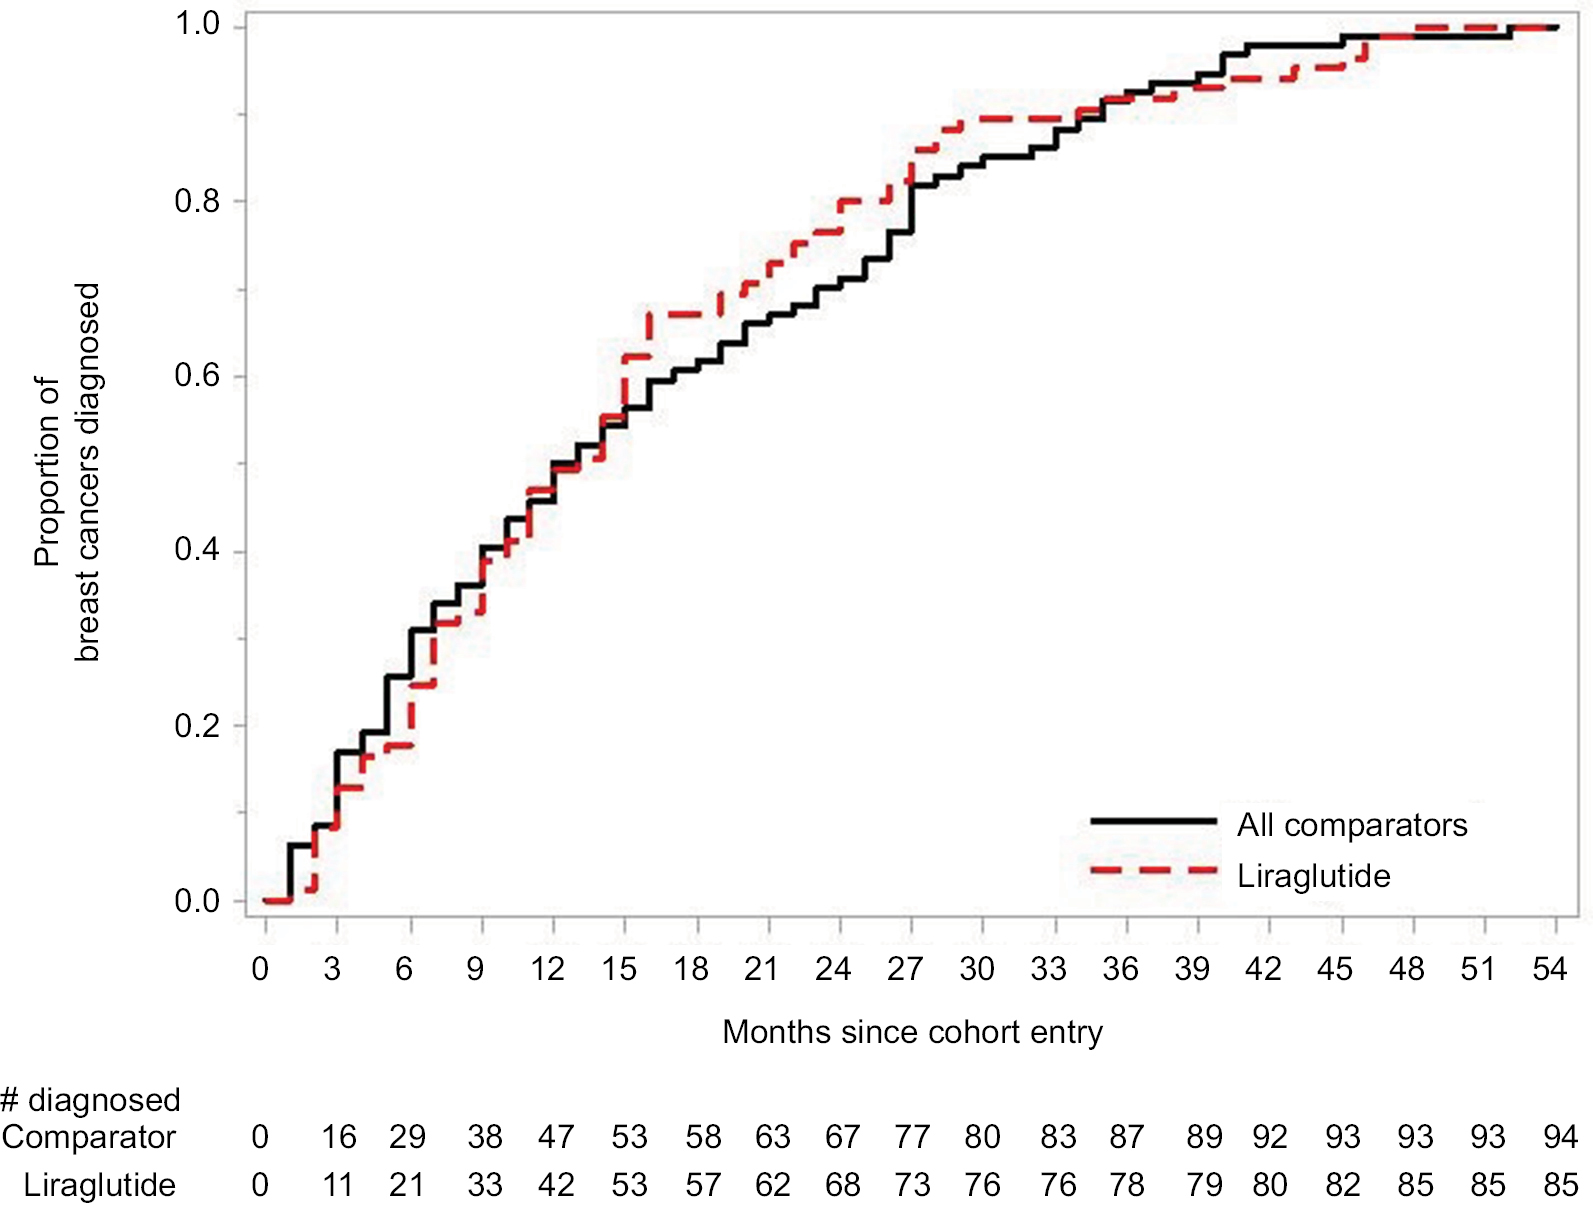 | Figure S1 Time to diagnosis: liraglutide and all comparators. |
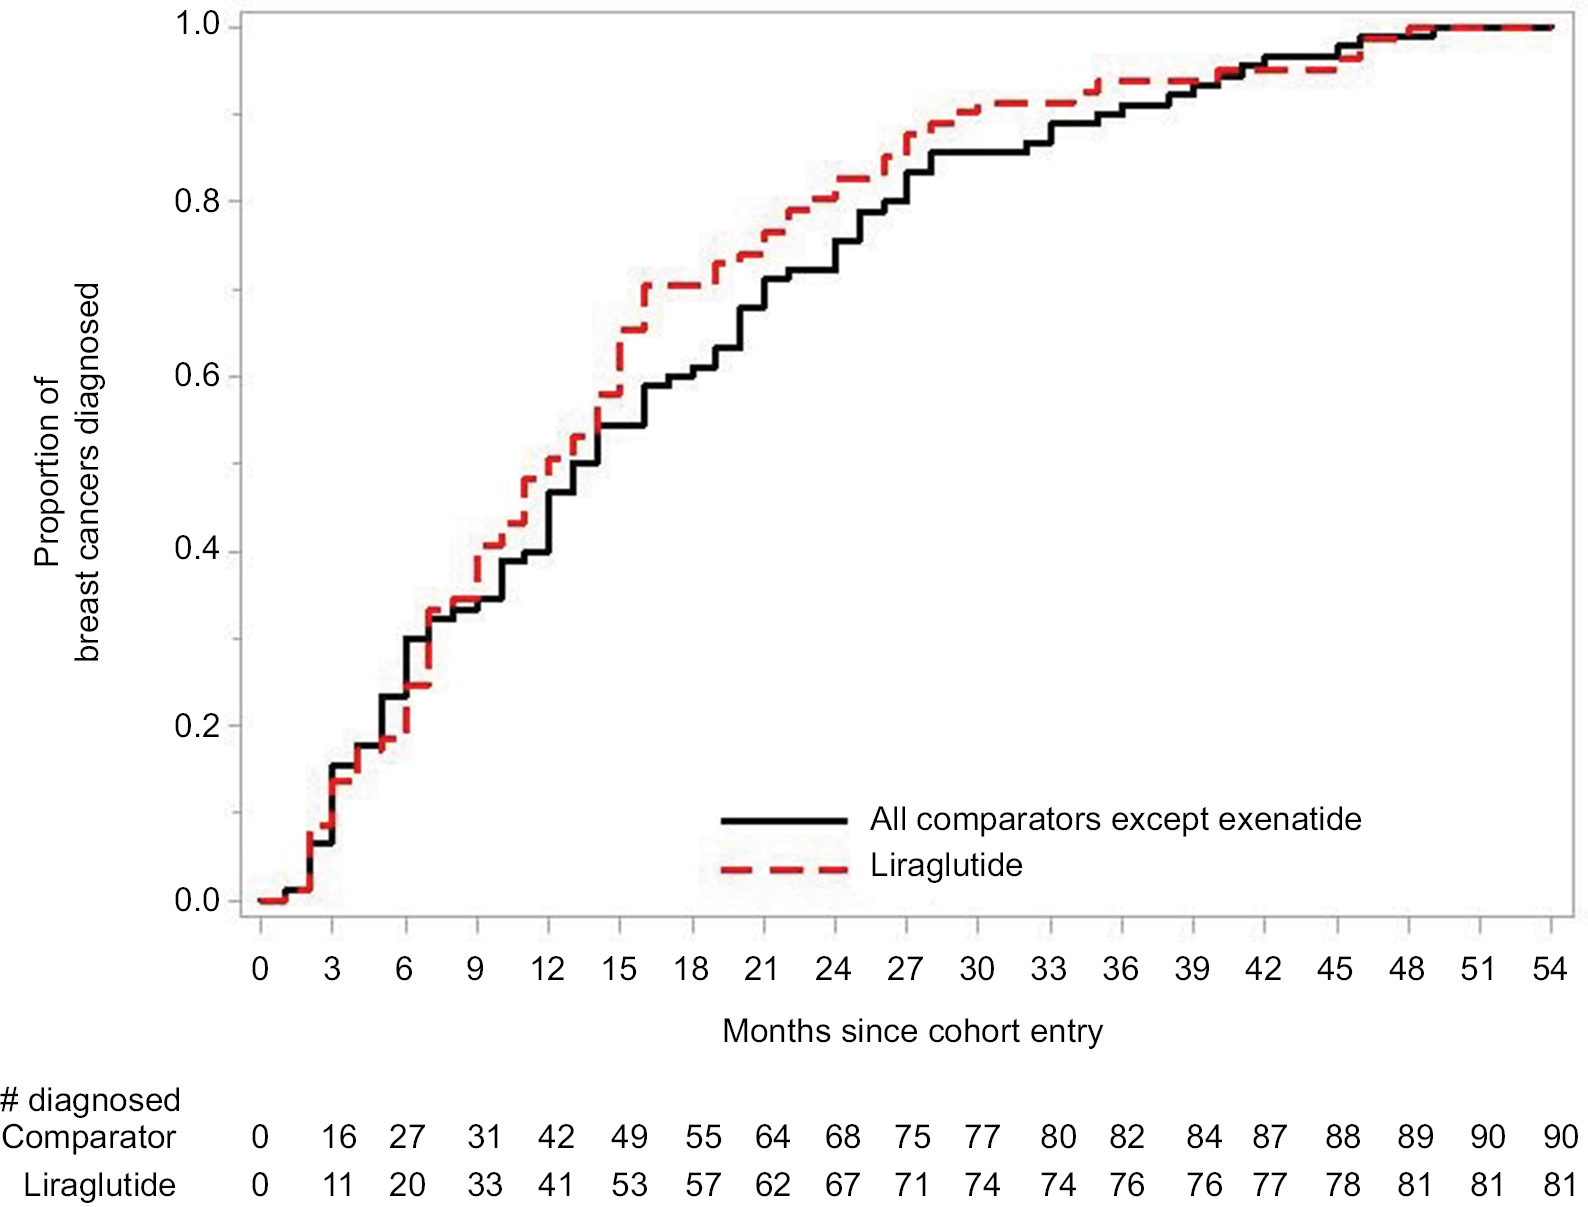 | Figure S2 Time to diagnosis: liraglutide and all comparators excluding exenatide. |
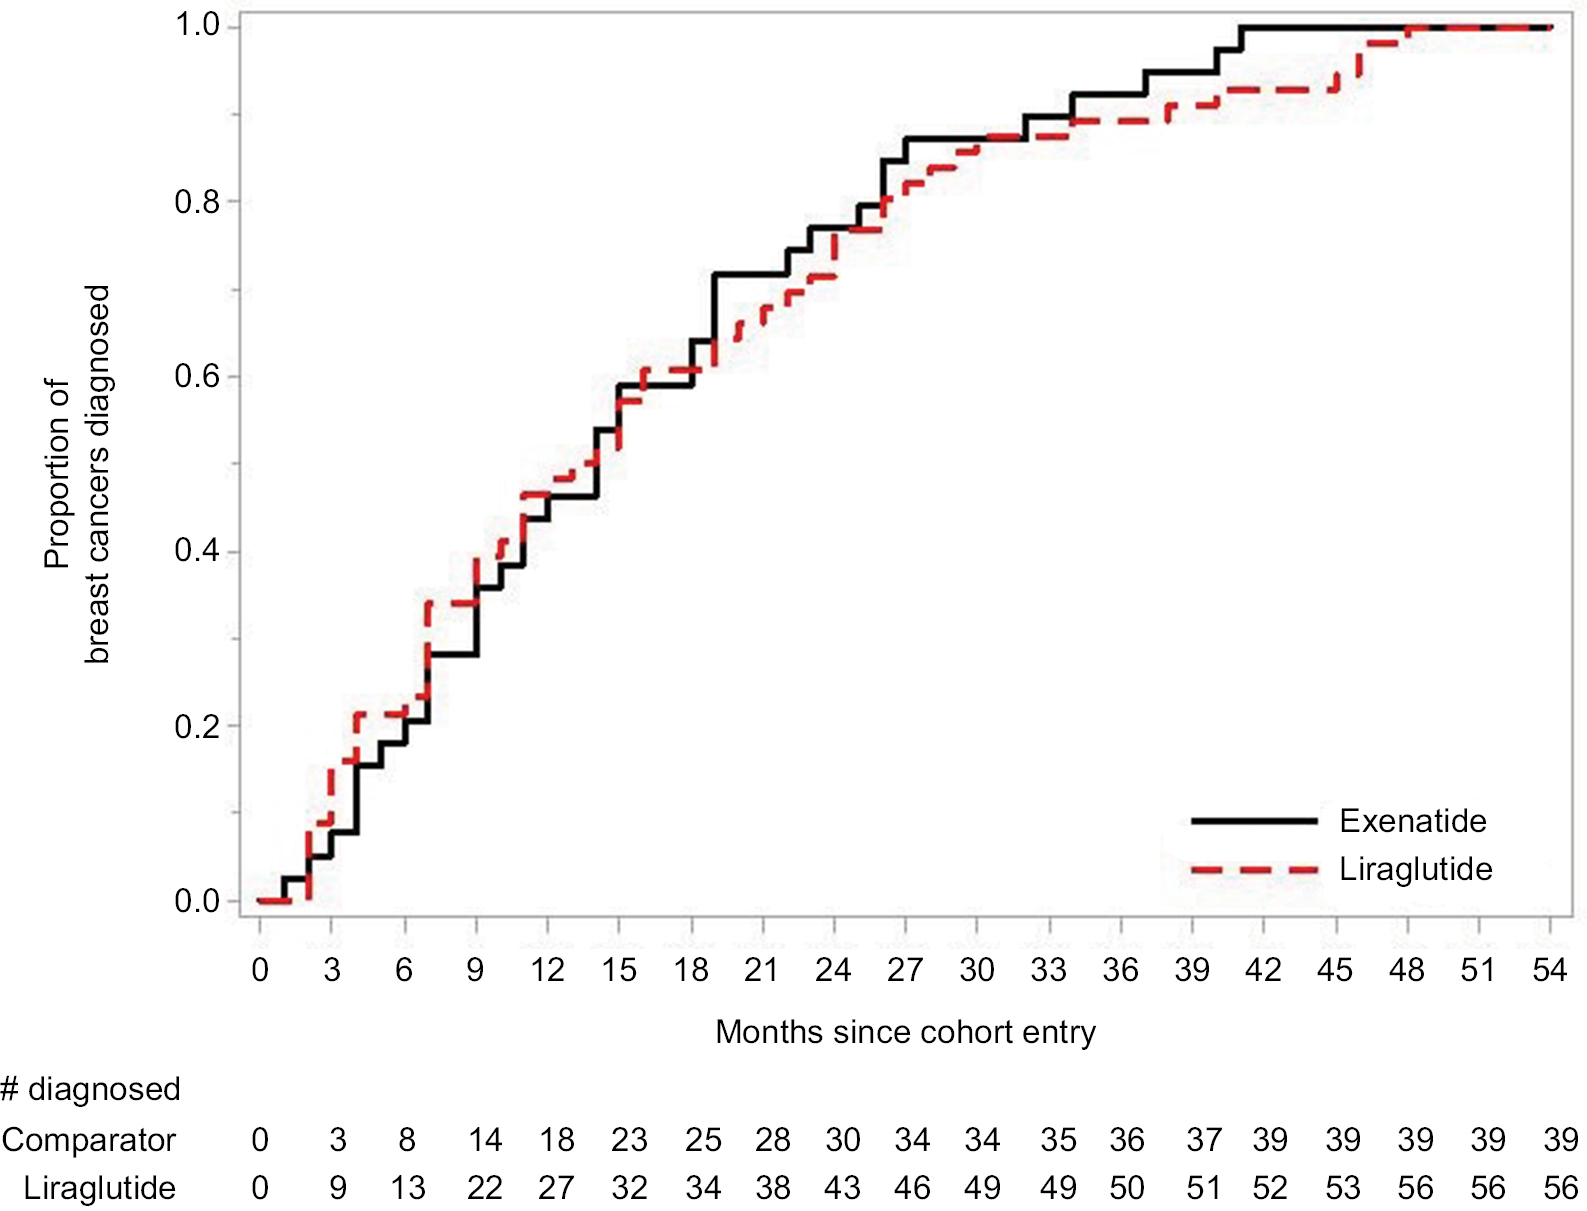 | Figure S3 Time to diagnosis: liraglutide and exenatide. |
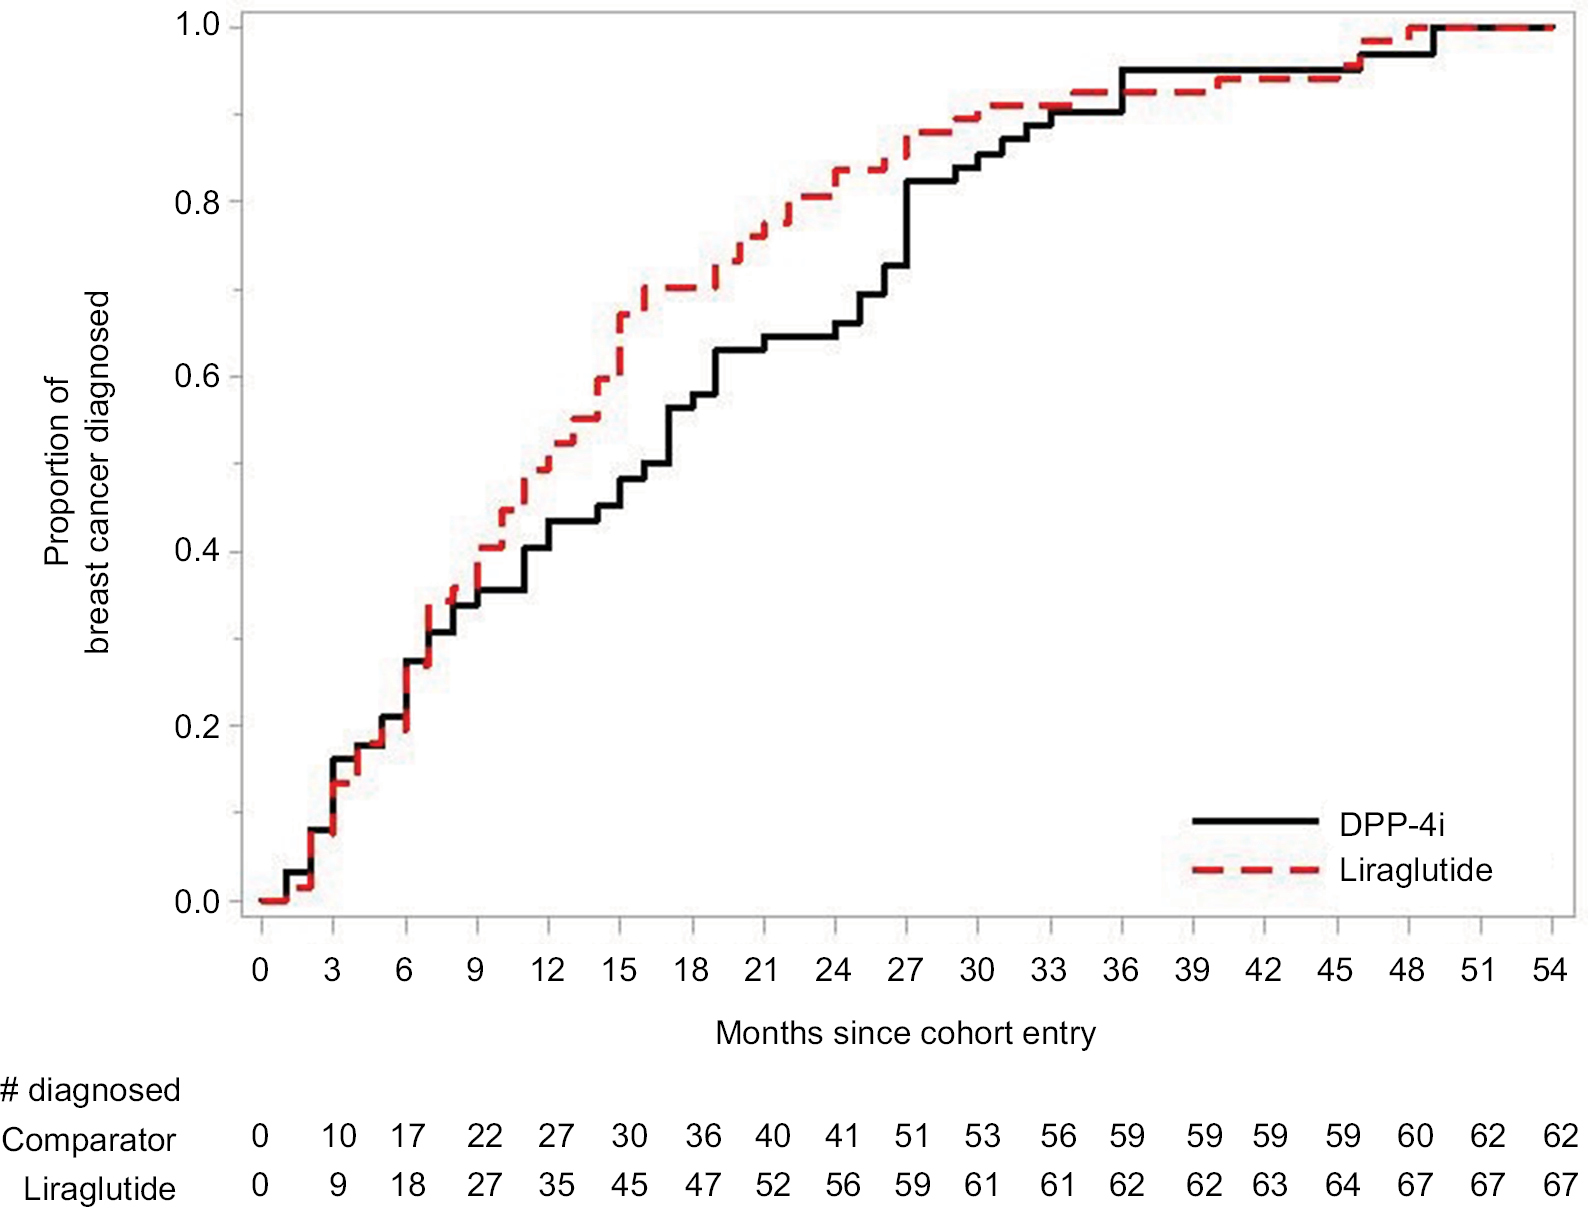 | Figure S4 Time to diagnosis: liraglutide and DPP4i. Abbreviation: DPP4i, dipeptidyl peptidase-4 inhibitor. |
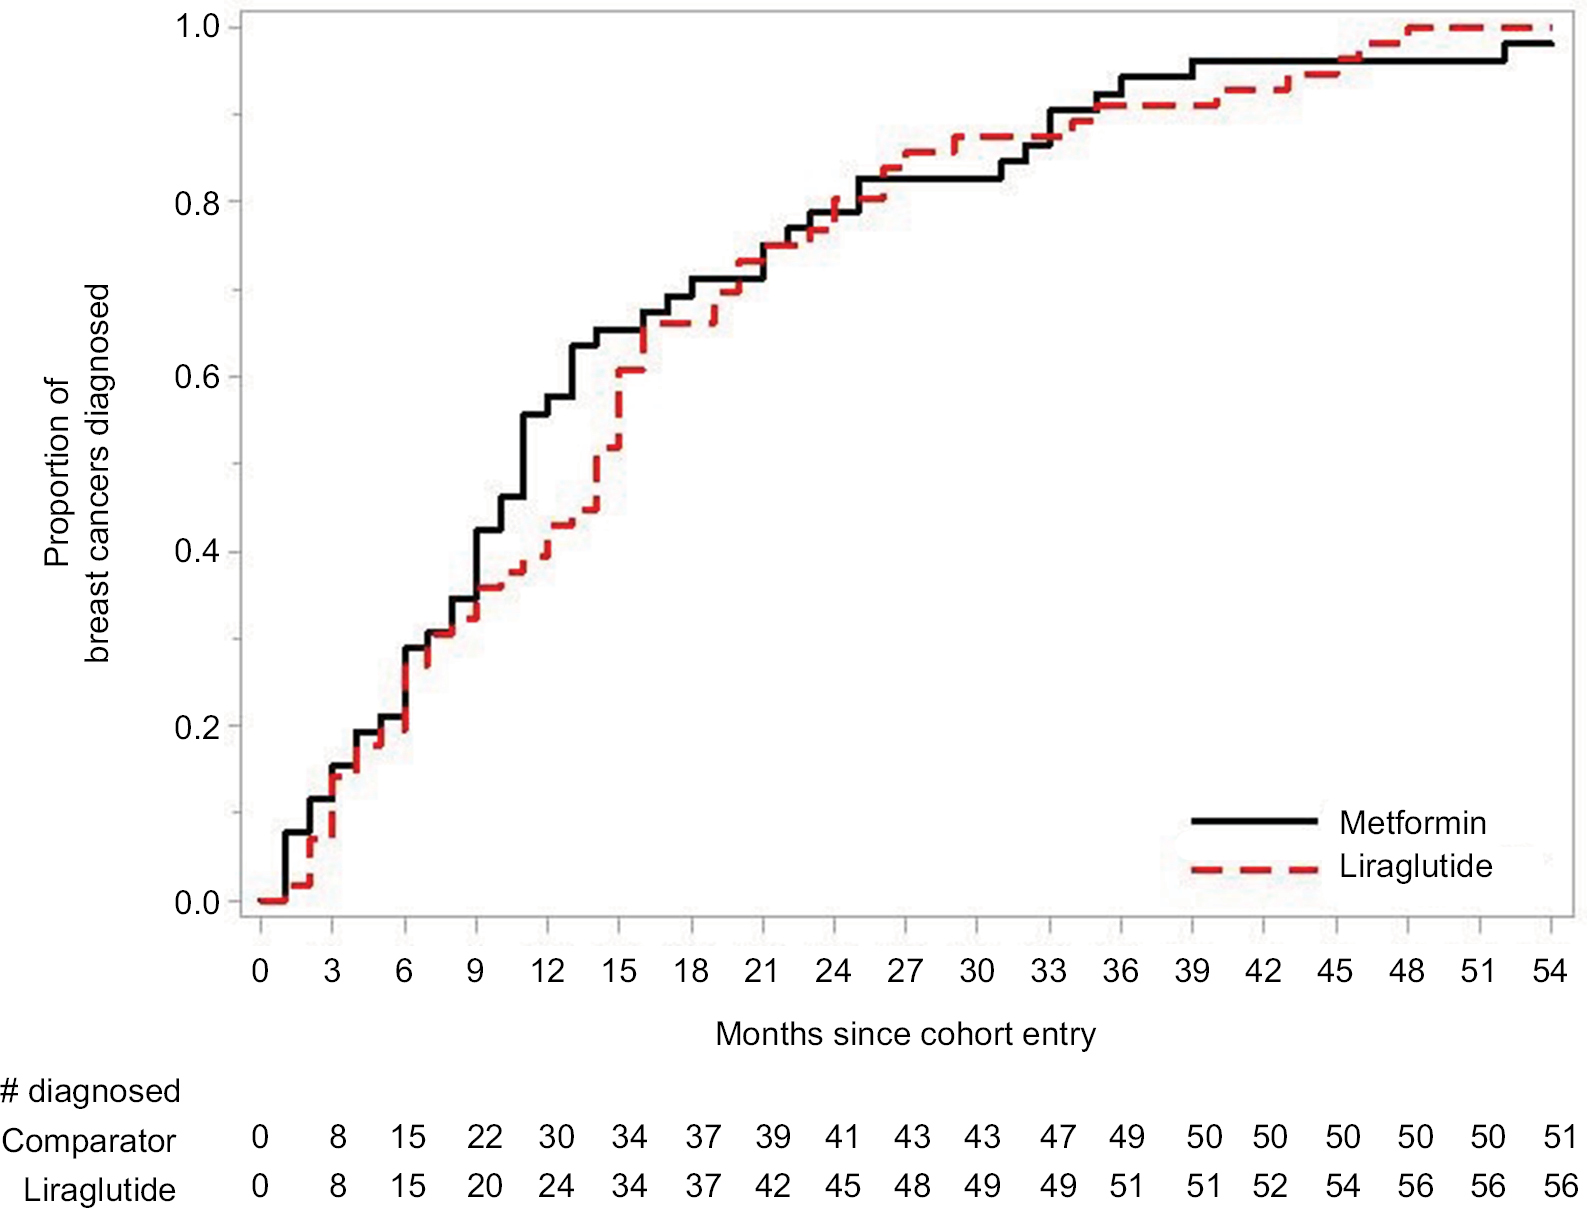 | Figure S5 Time to diagnosis: liraglutide and metformin. |
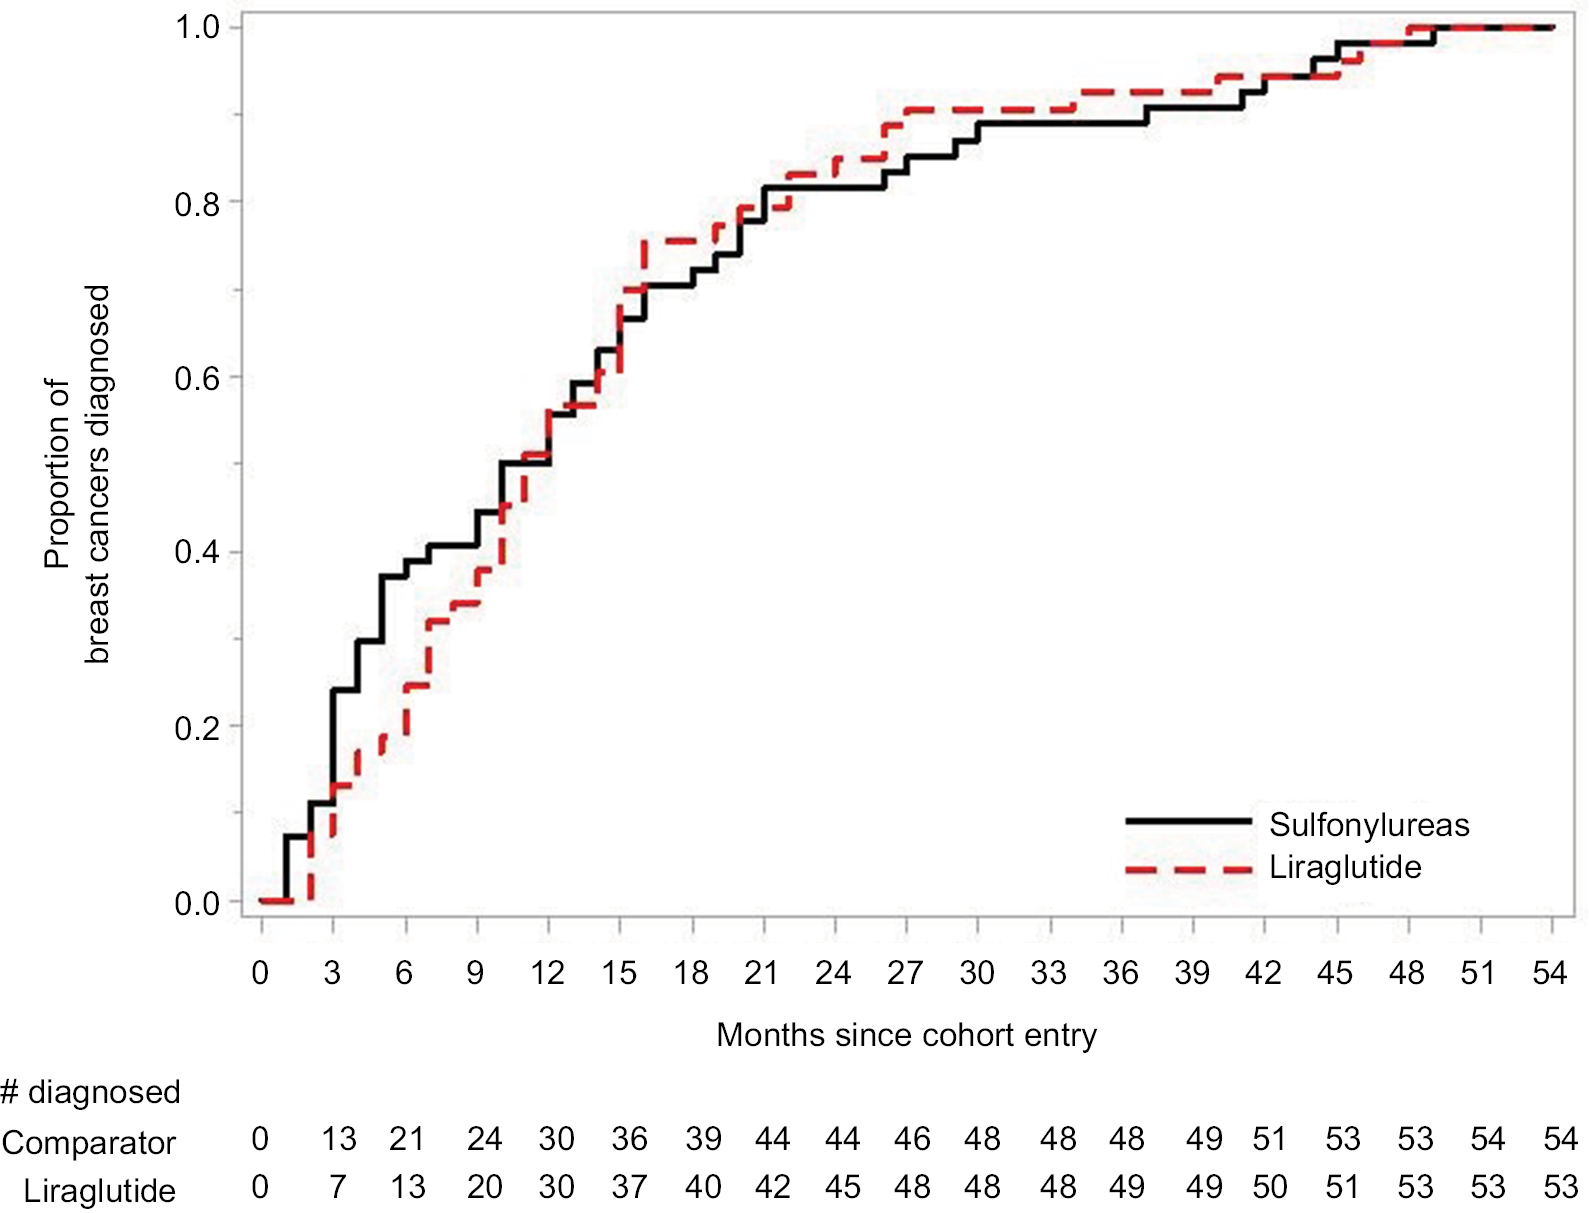 | Figure S6 Time to diagnosis: liraglutide and sulfonylureas. |
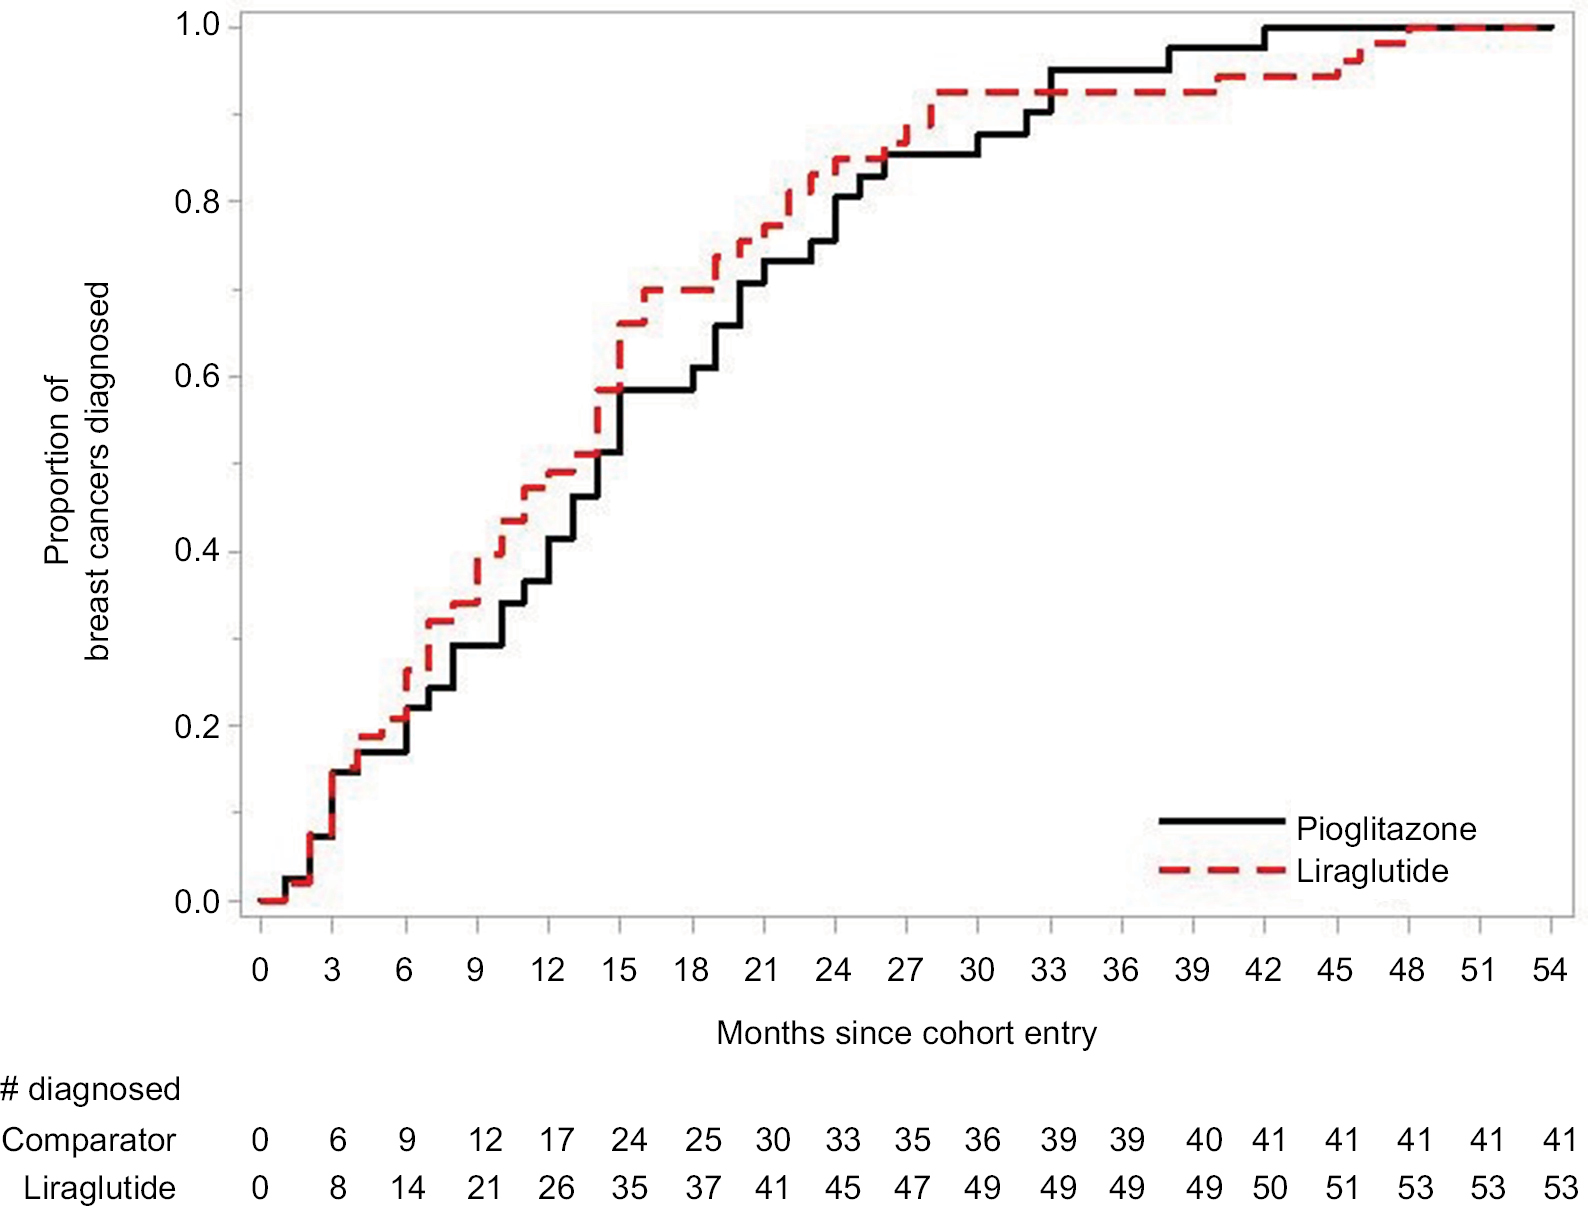 | Figure S7 Time to diagnosis: liraglutide and pioglitazone. |
 © 2018 The Author(s). This work is published and licensed by Dove Medical Press Limited. The full terms of this license are available at https://www.dovepress.com/terms.php and incorporate the Creative Commons Attribution - Non Commercial (unported, v3.0) License.
By accessing the work you hereby accept the Terms. Non-commercial uses of the work are permitted without any further permission from Dove Medical Press Limited, provided the work is properly attributed. For permission for commercial use of this work, please see paragraphs 4.2 and 5 of our Terms.
© 2018 The Author(s). This work is published and licensed by Dove Medical Press Limited. The full terms of this license are available at https://www.dovepress.com/terms.php and incorporate the Creative Commons Attribution - Non Commercial (unported, v3.0) License.
By accessing the work you hereby accept the Terms. Non-commercial uses of the work are permitted without any further permission from Dove Medical Press Limited, provided the work is properly attributed. For permission for commercial use of this work, please see paragraphs 4.2 and 5 of our Terms.