")
Back to Journals » The Application of Clinical Genetics » Volume 11
IRS-1 genetic polymorphism (r.2963G>A) in type 2 diabetes mellitus patients associated with insulin resistance
Authors Yousef AA, Behiry EG, Abd Allah WM, Hussien AM , Abdelmoneam AA, Imam MH , Hikal DM
Received 14 April 2018
Accepted for publication 14 June 2018
Published 28 September 2018 Volume 2018:11 Pages 99—106
DOI https://doi.org/10.2147/TACG.S171096
Checked for plagiarism Yes
Review by Single anonymous peer review
Peer reviewer comments 3
Editor who approved publication: Prof. Dr. Martin Maurer
Anas A Yousef,1 Eman G Behiry,1 Wafaa M Abd Allah,1 Ahmed M Hussien,2 Abdelmoneam A Abdelmoneam,2 Mahmoud H Imam,2 Doaa M Hikal,1
1Department of Clinical and Chemical Pathology, Benha Faculty of Medicine, Benha University, Benha, Egypt; 2Department of Internal Medicine, Benha Faculty of Medicine, Benha University, Benha, Egypt
Background: Insulin receptor substrate (IRS) molecules are key mediators in insulin signaling. Several polymorphisms in the IRS genes have been identified, but only the Gly to Arg 972 substitution of IRS-1 seems to have a pathogenic role in the development of type 2 diabetes mellitus (T2DM). Many polymorphisms described in IRS-1 gene, especially Gly972Arg substitution, are shown to be associated with insulin resistance (IR) in T2DM.
Subjects and methods: This prospective case–control study was performed during the period from November 2014 to May 2015. All patients were selected from the Department of Internal Medicine and were screened for eligibility for this study. Subjects were divided into two groups: first group consisted of 100 T2DM patients; second group consisted of 120 nondiabetic controls. First group was further divided into two subgroups: 66 IR patients and 34 insulin-sensitive (IS) patients (homeostatic model assessment [HOMA] was performed). Restriction fragment length polymorphism (RFLP) was performed using specific primers for scanning single-nucleotide polymorphisms (SNPs) such as Gly972Arg (rs1801278 SNP).
Results: Taking GG genotype and G allele as references, GA, GA+AA genotypes and A allele showed significantly higher frequency in the T2DM group when compared to the control group, with higher risk to develop T2DM in healthy controls. Taking GG as a reference, rs1801278GA+AA genotype and A allele showed significantly higher proportion in IR when compared to IS, with higher risk to develop IR in T2DM patients. Logistic regression analysis showed that higher FBG, fasting plasma insulin (FPI), HOMA-IR, GA+AA genotypes were associated with higher risk to develop IR in univariable analysis.
Conclusion: IRS-1 genetic factor may be a significant genetic determinant for IR in T2DM patients during severe/acute-phase hyperglycemia.
Keywords: T2DM, insulin receptor substrate, RFLP
Introduction
Type 2 diabetes mellitus (T2DM) comprises multiple metabolic dysfunctions leads to hyperglycaemia because of the mix of decreased insulin production and increased insulin resistance and abnormal glucagon metabolism.1 Insulin resistance (IR) is a condition in which the body’s cells get to be impervious to the effects of insulin, and therefore larger amounts of insulin are required to have its appropriate impacts. Along these lines, the pancreas repays by attempting to deliver more insulin. This resistance happens against body’s own particular insulin (endogenous) or against the insulin (exogenous). The pancreas creates more insulin until it stops delivering adequate insulin for the body’s requests, then glucose rises. IR is a dangerous element for the improvement of diabetes and coronary illness.2 A great many people with IR do not know that they have it for a long time – until they get T2DM, a genuine, deep-rooted ailment. In case people learn they have insulin resistance immediately, they can frequently avoid or postpone diabetes by making improvements to their way of life.3
Insulin receptor substrate (IRS) particles is a key center receptor in insulin signaling and assume a focal part in keeping up essential cell capacities, for example, development, survival, and digestion system. A few polymorphisms in the IRS qualities have been distinguished. However, the Gly to Arg 972 substitution of IRS-1, acting with natural elements, appears to have a pathogenic part in the advancement of T2DM.4 Many polymorphisms described in IRS-1 gene, located in 2q36-37, especially Gly972Arg substitution, are shown to be associated with IR in T2DM.5
IRS encodes a protein, which is phosphorylated by the insulin receptor tyrosine kinase. Mutations in this gene are associated with T2DM and susceptibility to IR.6
Previous studies of T2DM patients complicated with acute hyperglycemic attack discovered the possibility of genetic polymorphism that influences IR. While the IRS is an important intermediate in insulin signaling and plays a key role in maintaining the basic function of the cell, so any polymorphism in IRS genes acts as a competitive inhibitor of the insulin receptor. The identification of genetic predictors for increasing IR can help in the treatment of T2DM during the acute phase of hyperglycemia. The quantification of genomic DNA samples can be performed using polymerase chain reaction (PCR)–restriction fragment length polymorphism (RFLP) technique.7
Therefore, the genetic polymorphisms that may contribute to the worsening of IR in T2DM with severe hyperglycemia should be identified to optimize management and treatment.
Subjects and methods
Subjects
This case–control study was conducted during the period from November 2014 to May 2015 in the Clinical Pathology Department, Benha University, and all patients were selected from the Department of Internal Medicine at Benha University Hospital and were screened for eligibility for this study. This study was approved by an ethics committee according to World Medical Association Declaration of Helsinki.8 Ethical approval was obtained from the ethical review board of Benha University. All the participants gave their informed written consent. Subjects were divided into two groups: the first group consisted of 100 T2DM patients; the second group consisted of 120 nondiabetic controls which matched with the first group in age, gender and body mass index (BMI). The first group was further divided into two subgroups: 66 people in insulin resistant and 34 people in insulin-sensitive (IS).
Inclusion criteria
The inclusion criteria were as follows: T2DM patients who were diagnosed according to the American Diabetes Association diagnostic criteria, patients who had the blood glucose level of >250 mg/dL (severe hyperglycemia) at admission, subjects aged over 30 years and patients who used only insulin during hospitalization.
Exclusion criteria
The exclusion criteria were as follows: patients aged <30 years, patients who used oral hypoglycemic agents during hospitalization, pregnant women, patients with critical illness or renal dysfunction, heart diseases and hypertension and patients who required corticosteroids.
Methods
Sampling
Participants discontinued insulin for 12 hours before their blood samples were taken. Eight milliliters of venous blood was withdrawn under aseptic precautions after fasting for 10 hours and distributed as follows:
- Two milliliters of whole blood was put into EDTA vacutainer (violet cap) and mixed up and down gently and then used to measure the complete blood count (CBC) and to identify single-nucleotide polymorphism (SNP) by PCR/RFLP method.
- Two milliliters of whole blood was put into Na fluoride serum test tubes and centrifuged at 1,500 rpm for 10 minutes. The separated serum was used for the assay of fasting blood sugar.
- 1.5 mL of blood was put in a plain test tube without anticoagulant. The plain test tubes were left till coagulation. After coagulation, samples were centrifuged at 1,500 rpm for 15 minutes. The separated serum was used for the assay of lipid profile.
- The remaining blood volume was put into plain tube (red cap), left to clot and then centrifuged at 2,000 rpm for 10 minutes for the assay of insulin.
- Fasting blood sugar was found by glucose enzymatic colorimetric method.
- Lipid profile, such as total cholesterol, high-density lipoprotein cholesterol (HDL-C) and triglycerides, was found by colorimetric method. Low-density lipoprotein cholesterol (LDL-C) was calculated according to Friedewald’s equation as follows:
LDL-C = total cholesterol–(HDL-C+TG/5).
All biochemical tests were performed using Biosystem A15 auto-analyzer (Bardelona, Spain).
- Glycated HB was performed by Stanbio Glycohemoglobin Procedure (catalog number: 0350; lot number: 26121).
- Fasting insulin level was found by using Calbiotech (Spring Valley, CA, USA) kit for the determination of human insulin in human serum or plasma using the ELISA technique. For IR measurement, homeostatic model assessment (HOMA) was performed and HOMA-IR (HOMA of IR) was calculated using the following equation: HOMA-IR = fasting glucose (mg/dL) × fasting insulin (IU/mL)/405. Cutoff point to define IR was ≥3.8.
- Genetic study was performed using specific primers for scanning SNPs such as Gly972Arg. The forward and reverse primers were 5′AGTCTGGCTACTTGTCTGGC3′ and 5′ATGAGTTGTCCCCGTCAGA3′, respectively (Thermofisher Scientific, Waltham, MA, USA).
DNA extraction method
The genomic DNA was separated utilizing Thermo Scientific Gene-JET entire blood genomic DNA filtration (Waltham, MA, USA); specimens were processed with proteinase K in lysis arrangement; the lysate was blended with ethanol and stacked into purging section, where the DNA tied to the silica film. Contamination was adequately uprooted by washing the section. Genomic DNA was then eluted under a low ionic strength condition with the elution under the elution buffer.
DNA quantification
A total of 10 µL of DNA solution was diluted with 990 µL of high-grade water. The absorbance (OD) of the DNA solution was measured at wavelengths of 260 and 280 nm using an ultraviolet (UV) spectrophotometer, and the OD260/OD280 ratio was determined. A ratio of 1.8–2.0 indicated the range of UV absorbance due to nucleic acids. The amount of DNA (in µg/mL) was determined according to the equation: DNA concentration = A×100×50 µg/mL/100, etc.
RFLP
Thermo Scientific Taq green master mix containing Taq DNA polymerase, optimized buffer, MgCl2 and dNTPs was supplemented with two tracking dyes that did not interfere with PCR performance and compatibility with the downstream application. The dyes have absorption peaks at 424 and 615 nm.
First Dream Taq master mix was thawed, vortexed and centrifuged; then, thin-walled PCR tube was placed on ice. Twenty-five Ul of master mix, 1 mM forward and reverse primers, 1 µg template DNA, then completed to 50 Ul by nuclease free water, then samples were vortexed and spinned down, and the reaction mixture was covered by 25 mL mineral oil. PCR thermal cycling conditions were as follows: initial denaturation: 95°C, 2 minutes; denaturation: 95°C, 30 seconds, annealing: 30 seconds; extension: 72°C, 10 minutes for 40 cycles; then, 10 mL of PCR mixture was loaded on the gel. The resultant restriction fragments were ascertained on a 3% agarose gel. PCR amplification products were digested with BstNI restriction enzyme for the IRS-1 gene: a solution of 10 µL containing 7 µL of PCR product, 1 µL of 10× New England buffer solution, restriction enzymes (0.2 µL), 0.1 µL 100×bovine serum albumin (BSA) and nuclease-free water. The solution was incubated for 1 hour at 60°C. Tris-acetate-EDTA (TAE) gels containing 2.0 or 2.5% agarose were electrophoresed at 100 V for 50 minutes. The DNA bands were observed in a gel.
The studied rs1801278 SNP was composed of G and A alleles. G and A nucleotide change resulted in GGG and AGG codon changes that resulted in the change from glycine amino acid to arginine. It is located in the long arm of chromosome 2 within IRS-1 gene.
DNA ladder
Thermo Scientific Gene Ruler 50 bp DNA ladder was used for sizing and approximate quantification of wide-range double-strand DNA on an agarose gel; this ladder comprised of individual DNA fragments, 1000, 900, 800, 700, 600, 500, 400, 300, 250, 200, 150, 100, 50 bp, containing two references bands (500 and 250 bp); it was premixed with 6× DNA loading dye and loading buffer, 10 mM Tris–HCl (pH 7.6), 10 mM EDTA.
Statistical analyses
The data were tabulated and analyzed using the computer program SPSS version 16 (SPSS Inc., Chicago, IL, USA): normality was tested using Kolmogorov–Smirnov test. “Quantitative data” were calculated in the form of mean and SD, frequency and distribution for quantitative data; the significance of difference was tested using Student’s t-test and Mann–Whitney test (U test) which were used to compare the mean of two groups of quantitative data. For measuring categorical data, inter-group comparison was performed by using chi-squared test and Fisher’s exact test (FET). For measuring regression analysis, logistic regression analysis was used for the prediction of risk factors.
Results
In this study, identification of the IRS-1 r.2963G>A (p.Gly972Arg) quality polymorphism depended on the SNP reference number (rs 1801278). The polymorphism happened when nucleotide G at amino acid glycine (GGG) at codon 972 was changed to nucleotide A and amino acid arginine (AGG). This sample of individuals was selected randomly from the population in Qalybeya Governorate. Power analysis was conducted (81.3%), and the significance level of 5% was sufficient. Chi-squared goodness-of-fit test of the studied genotypes revealed that the studied SNP was in Hardy–Weinberg equilibrium (Table 1). The current study was conducted on 100 T2DM cases; their mean age was 49.3 (SD=6.7) years. They composed 46 males (46%) and 54 females (54%). Control group was selected to be matched in age and gender. No significant differences were found in anthropometric measures between the studied groups. Cases had significantly higher proportion of family history (FH) of diabetes when compared to the control group. Triglycerides, total cholesterol, HDL, FBG, fasting plasma insulin (FPI), HOMA-IR, HBA1C, IR and waist circumference were significantly higher in the T2DM group when compared to the control group (Table 2). Taking GG genotype and G allele as references, GA, GA+AA genotypes and A allele showed significantly higher frequency in the T2DM group when compared to the control group, with higher risk to develop T2DM in healthy controls (Table 3).
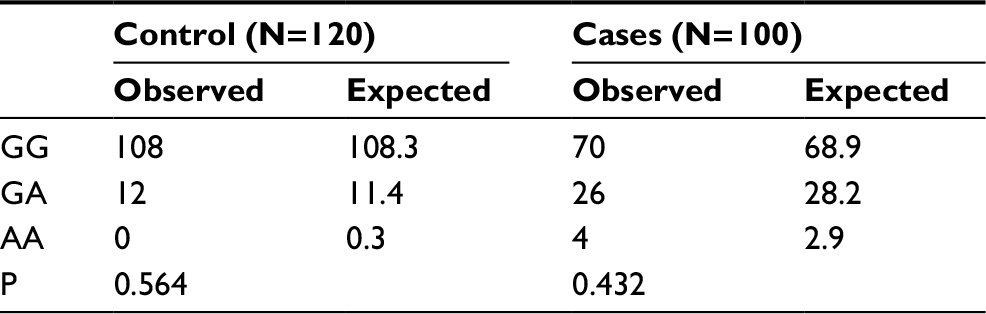 | Table 1 Assessment of Hardy–Weinberg equilibrium for rs1801278 genotypes Note: Deviations from Hardy–Weinberg equilibrium expectations were determined using the chi-squared test. |
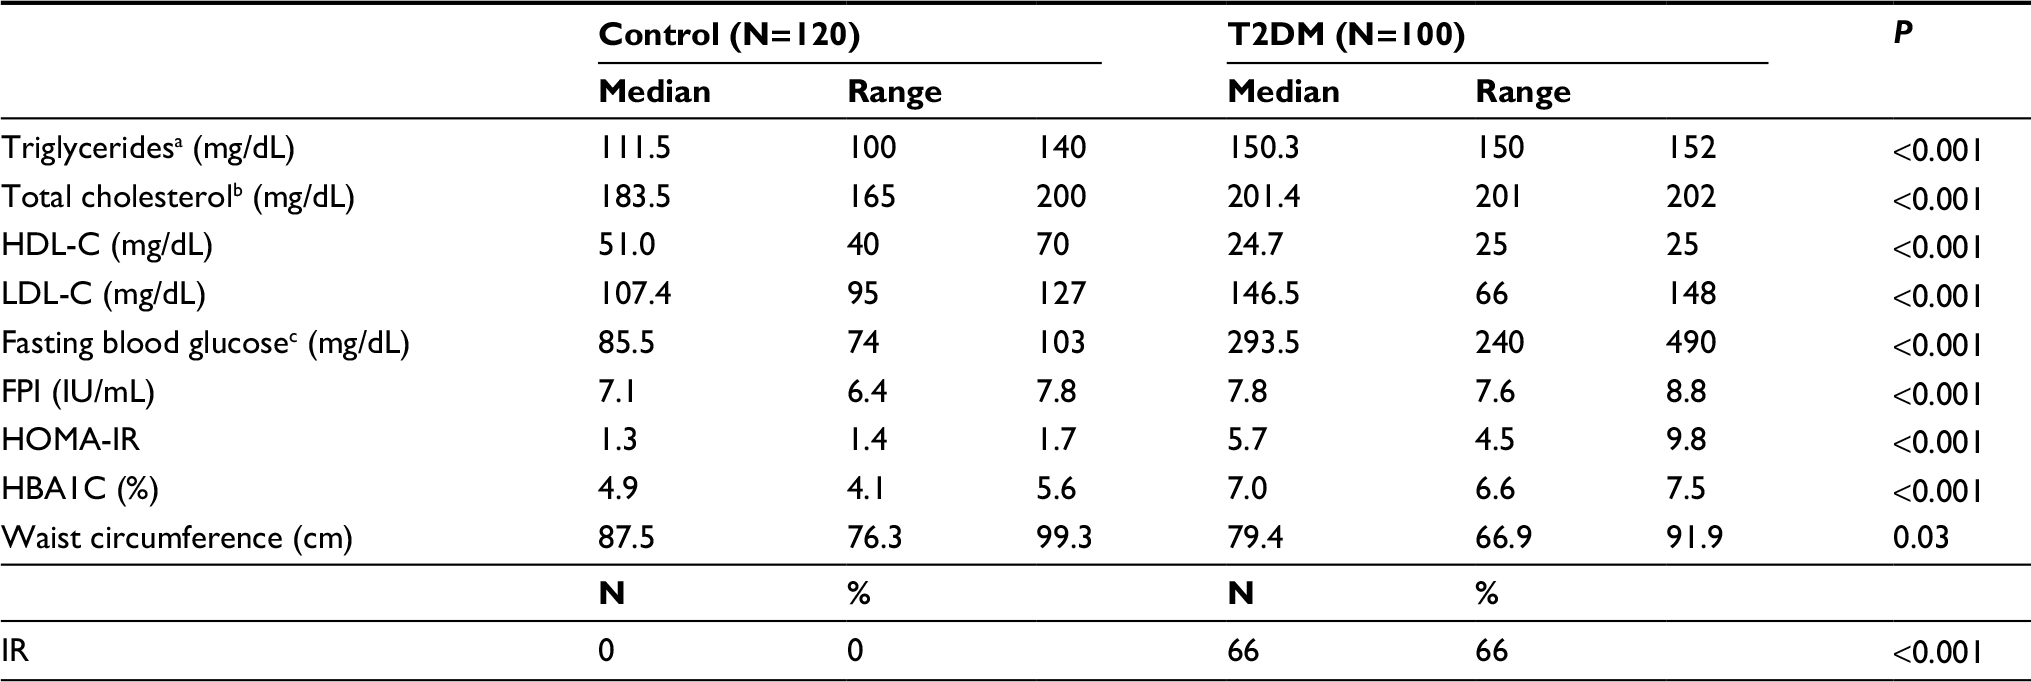 | Table 2 Mean fasting serum glucose, insulin, HOMA and lipid profile concentration in T2DM patients and the control group Notes: Numerical data are expressed as median, range, compared by Mann–Whitney test. Categorical data are expressed as number and percentage, compared by FET. aSI conversion factors: to convert triglycerides to millimoles per liter and to multiply values by 0.0113. bSI conversion factors: to convert cholesterol to millimoles per liter and to multiply values by 0.0259. cSI conversion factors: to convert glucose to millimoles per liter and to multiply values by 0.0555. Abbreviations: IS, insulin sensitive; FET, Fisher’s exact test; FPI, fasting plasma insulin; HDL-C, high-density lipoprotein cholesterol; HOMA, homeostatic model assessment; IR, insulin resistance; LDL-C, low-density lipoprotein cholesterol; T2DM, type 2 diabetes mellitus. |
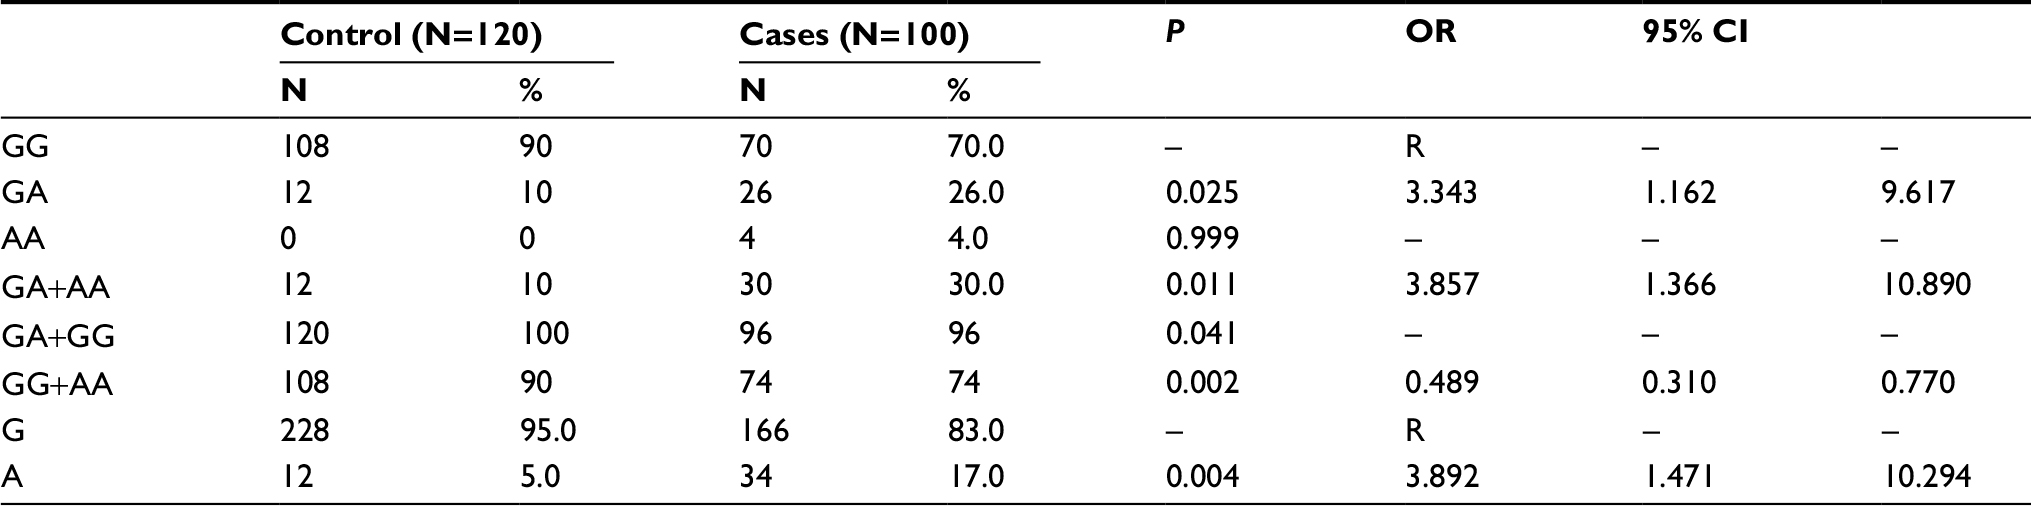 | Table 3 Comparison of rs1801278 (alleles and genotypes) in all the studied T2DM patients and healthy controls Note: Logistic regression test was used. Abbreviations: R, reference; T2DM, type 2 diabetes mellitus. |
Figure 1 demonstrates the example of electrophoresis for IRS-1 genotype r.2963G>A (p.Gly972Arg), which was broken down utilizing the PCR–RFLP. BstNI restriction enzyme cut the PCR amplicon at position 5′-CC/WGG-3′ to create products that were 108, 81, 51 and 23 bp in the IRS-1-972A allele and 159, 81 and 23 bp in the IRS1-972G allele. The 51 and 23 bp products were obvious under the bright light transillumination.
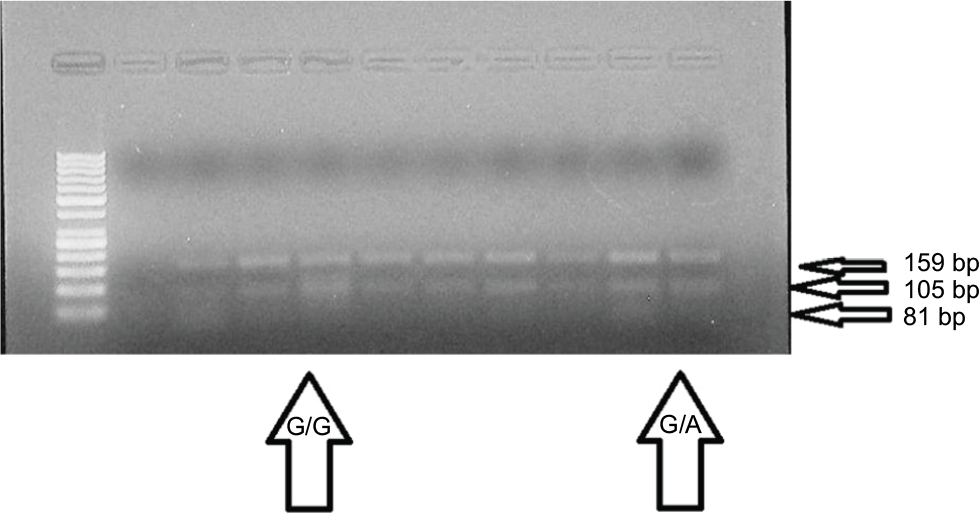 | Figure 1 Identification of IRS1 gene polymorphism (r.2963G>A) using PCR-RFLP method. Abbreviations: PCR, polymerase chain reaction; RFLP, restriction fragment length polymorphism. |
FBG, FPI and HOMA-IR were significantly higher in patients with IR when compared to those sensitive to insulin. Lipid profile, HBA1C or waist circumference did not differ significantly according to IR (Table 4). Taking GG as a reference, rs1801278GA+AA genotype and A allele showed significantly higher proportion in IR when compared to IS, with higher risk to develop IR in T2DM cases (Table 5). Logistic regression analysis was conducted for the prediction of IR in T2DM cases, using age, gender, BMI, FH, laboratory data and rs1801278 genotypes as covariates. Higher FBG, FPI, HOMA-IR and GA+AA genotypes were associated with higher risk to develop IR in univariable analysis. Taking these covariates with significant association in univariable analysis into multivariable analysis revealed that FPI, HOMA-IR and GA+AA genotypes were considered as independent-risk factors to develop IR in T2DM patients (Table 6). Logistic regression analysis was conducted for the prediction of T2DM in healthy controls, using age, gender, BMI, laboratory data and rs1801278 genotypes as covariates. Higher BMI, TG, TC, LDL, FBG, FPI, HOMA-IR, HBA1C, lower HDL and GA+AA genotypes were associated with higher risk to develop T2DM in univariable analysis. Taking these covariates with significant association in univariable analysis into multivariable analysis revealed that higher BMI, TG, TC, FBG, FPI, HOMA-IR, HBA1C, lower HDL and GA+AA genotypes were considered as independent-risk factors for risk to develop T2DM in healthy controls (Table 7).
 | Table 4 Comparison of laboratory data according to IR Note: Numerical data are expressed as median, minimum and maximum, compared by Mann–Whitney test. Abbreviations: FPI, fasting plasma insulin; HDL-C, high-density lipoprotein cholesterol; HOMA, homeostatic model assessment; IR, insulin-resistance; IS, insulin-sensitive; LDL-C, low-density lipoprotein cholesterol. |
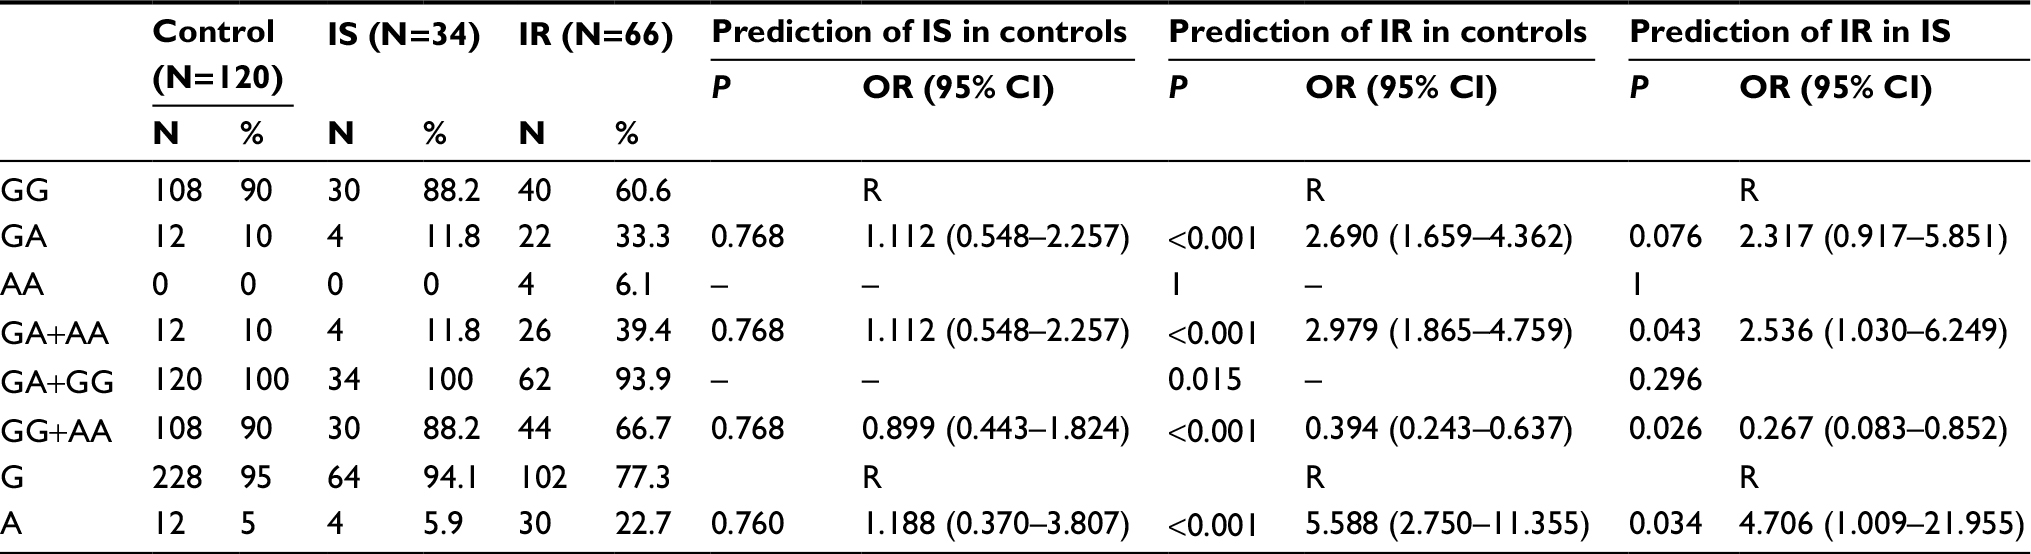 | Table 5 Comparison of rs1801278 (genotypes and alleles) according to IS and IR in all the studied subjects Abbreviations: IR, insulin resistance; IS, insulin-sensitive. |
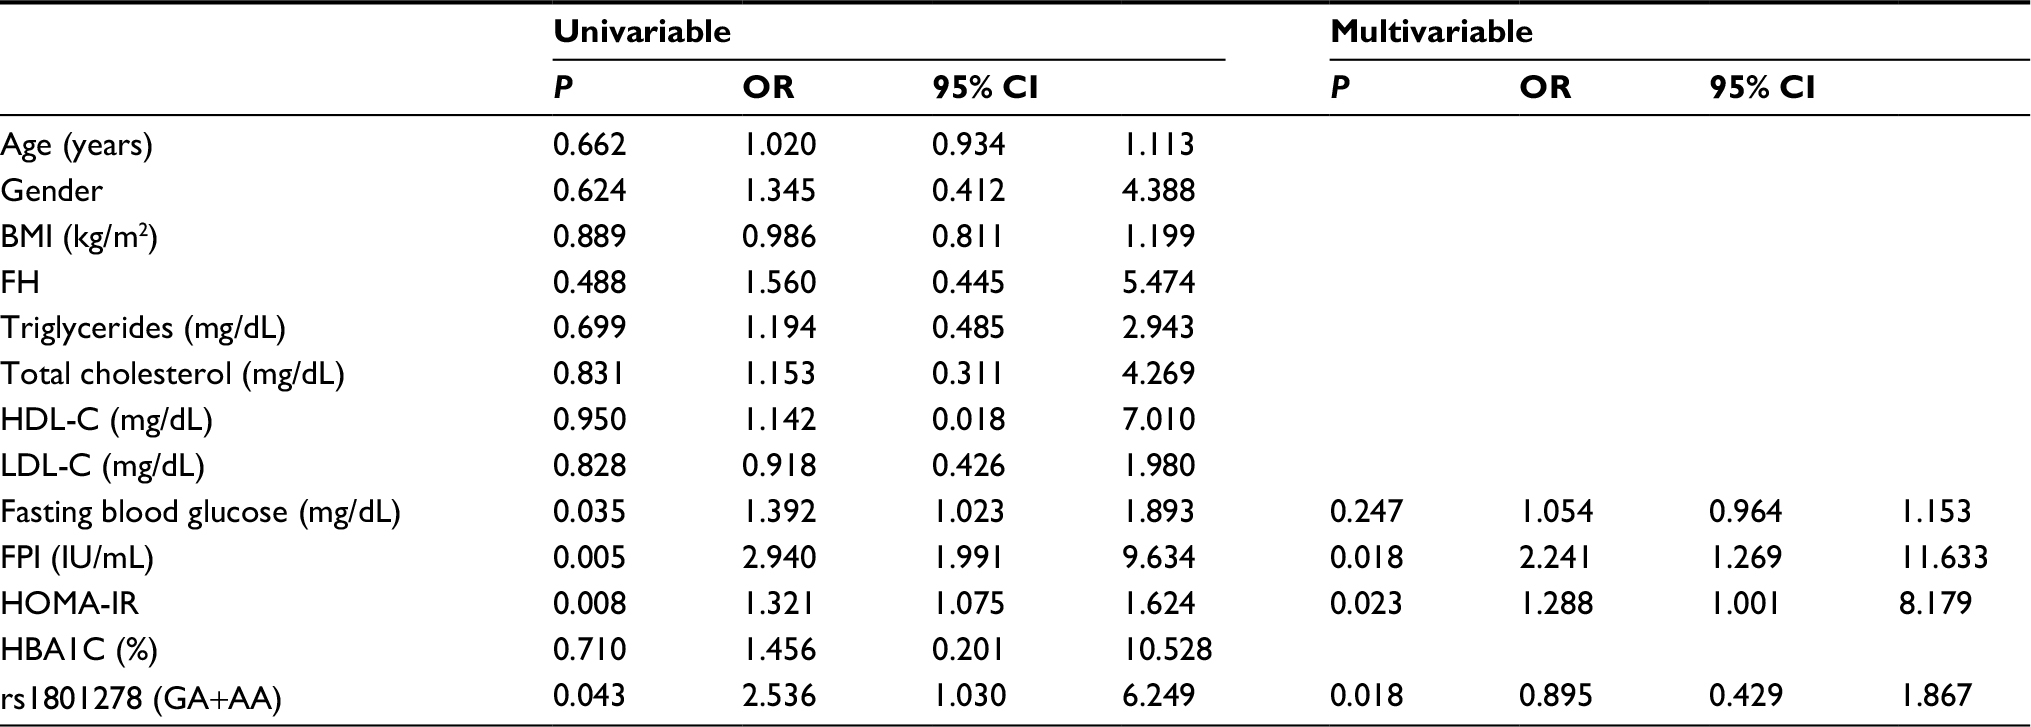 | Table 6 Regression analysis for prediction of insulin resistance within T2DM cases Abbreviations: BMI, body mass index; FH, family history; FPI, fasting plasma insulin; HDL-C, high-density lipoprotein cholesterol; HOMA, homeostatic model assessment; IR, insulin resistance; LDL-C, low-density lipoprotein cholesterol; T2DM, type 2 diabetes mellitus. |
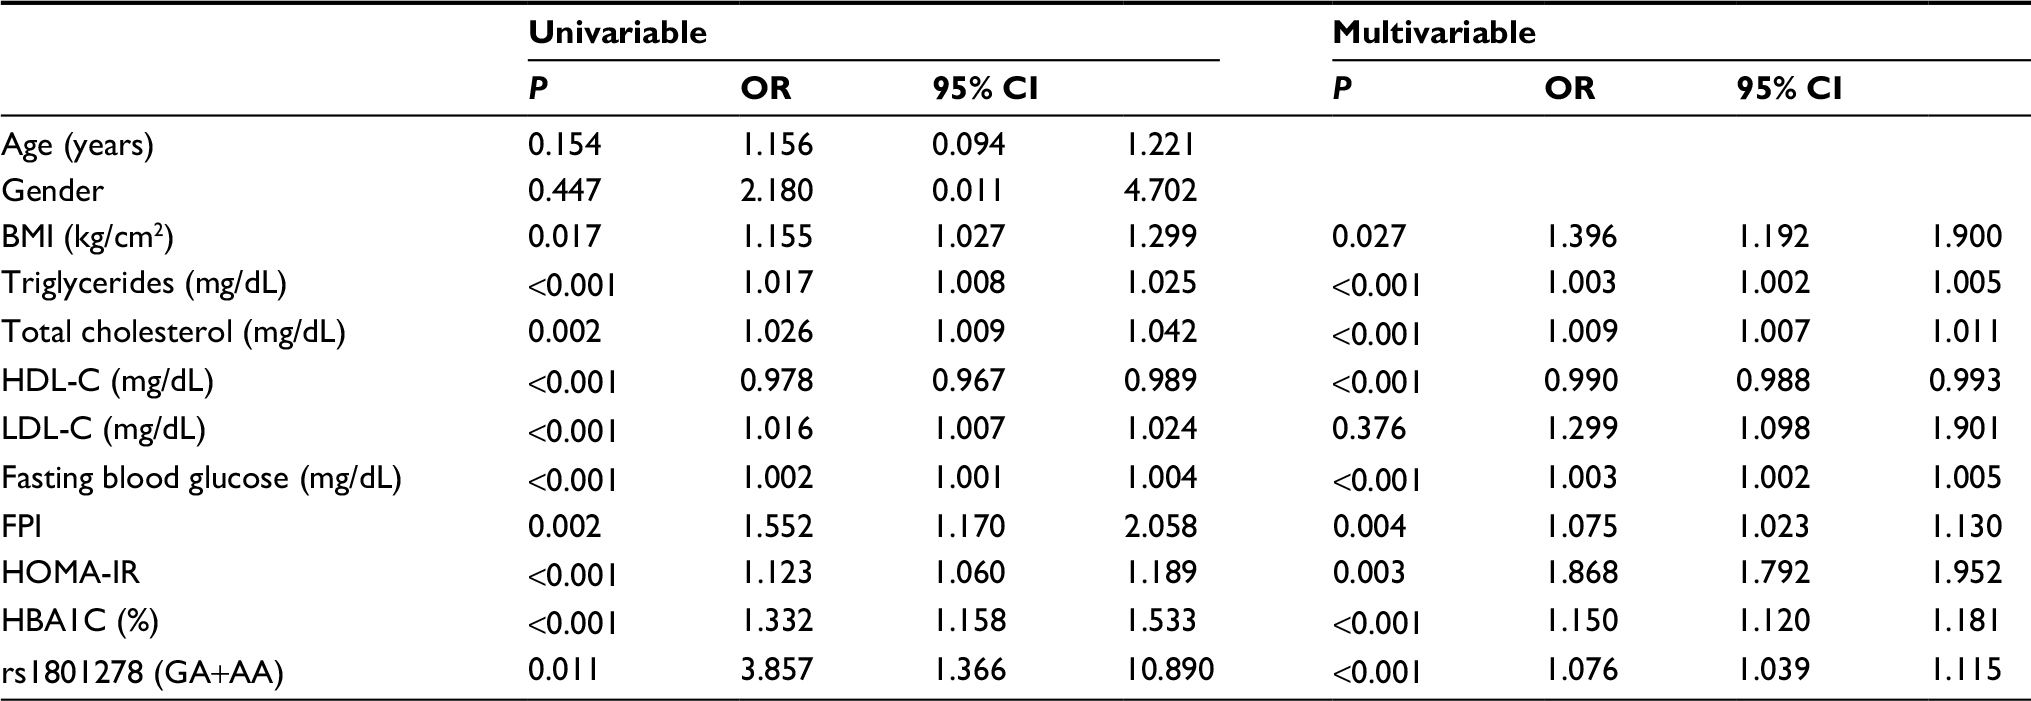 | Table 7 Regression analysis for prediction of T2DM within healthy control subjects Abbreviations: BMI, body mass index; FPI, fasting plasma insulin; HDL-C, high-density lipoprotein cholesterol; HOMA, homeostatic model assessment; IR, insulin resistance; LDL-C, low-density lipoprotein cholesterol; T2DM, type 2 diabetes mellitus. |
Discussion
The results of this study demonstrated that IRS-1 quality G→A (Gly972Arg) SNP genotype frequencies of genotypes, homozygous (AA) and heterozygous (GA), were predominant in T2DM. Arg 972 IRS-1 polymorphism might partake in the improvement of IR and diabetes by inhibiting the capacity of insulin to enact the IRS-1/PI3-kinase/Akt flagging pathway, thus prompting imperfections in glucose transport, glucose transporter translocation and glycogen.9
Other studies at the molecular level revealed that the r.2963 IRS1 polymorphism G>A (p.Gly972Arg) acted as a competitive inhibitor to the IR and IGF-1R autophosphorylation. The IRS1 gene polymorphism allowed the IRS1 gene to act as an inhibitor of IR kinase, causing IR.10
IRS1 polymorphism G>A (p.Gly972Arg) contributed to IR by weakening the ability of insulin to activate the signaling pathway of IRS1/PI3 kinase/Akt/glycogen synthase kinase-3 in IS tissues.2 Taking GG genotype and G allele as references, GA, GA+AA genotypes and A allele showed significantly higher frequency in the T2DM group when compared to the control group, with higher risk to develop T2DM in healthy controls. A study found that IRS1 gene polymorphisms increased IR in T2DM patients with severe hyperglycemia. Only the IRS1 Gly972Arg gene polymorphism affected IR in T2DM patients. This result is similar to the results of the studies by El Mkadem et al,10 Villuendas et al11 and Rung et al12 who found that the r.2963G>A (p.Gly972Arg) IRS1 gene polymorphism occurs in patients with IR, and these polymorphisms also affect IR. The rs2943641 in IRS1 was found to be associated with T2DM, IR and hyperinsulinemia in three European populations comprised more than 14,000 individuals.13 Taking GG as a reference, rs1801278GA+AA genotype and A allele showed significantly higher proportion in IR when compared to IS, with higher risk to develop IR in T2DM cases. Relationship in our study is conceivable because of various distinctive qualities and variations thought to be predictors of developing of IR and type 2 diabetes. Like the IRS1 polymorphism, no contemplates have researched IRS2 polymorphisms in T2DM patients who endure extreme or intense hyperglycemia.
Novelty
Several polymorphisms in the insulin receptor substrate (IRS) genes have been identified, but only the Gly to Arg 972 substitution of IRS-1 seems to have a pathogenic role in the development of type 2 diabetes mellitus (T2DM).
- Taking GG genotype and G allele as references, GA, GA+AA genotypes and A allele showed significantly higher frequency in the T2DM group.
- rs1801278GA+AA genotype and A allele showed significantly higher proportion in insulin-resistance (IR) when compared to insulin sensitive (IS), with higher risk to develop IR.
- Logistic regression analysis showed that higher GA+AA genotypes were associated with higher risk to develop IR in univariable analysis.
Limitations
Study with family members could inflate the frequency of interested allele; replication study in a different cohort could support these results.
Conclusion
The IRS1 genetic polymorphism (r.2963G>A) may be a significant genetic determinant for IR in T2DM patients during acute hyperglycemia and prediction of insulin resistance in healthy subjects.
Acknowledgment
The authors express deep thanks to all the participants.
Disclosure
The authors report no conflicts of interest in this work.
References
Lončar A, Blaslov K, Bulum T, Duvnjak L. The effect of GLP-1 analogues on lipid profile in type 2 diabetic patients–a retrospective observational study. Diabetol Croat. 2015;44(2):59–6. | ||
Erica Oberg ND. Type 2. Diabetes Diet Plan: List of Foods to Eat and Avoid. 2018. | ||
Häring HU, Merker L, Seewaldt-Becker E, et al. Empagliflozin as add-on to metformin in patients with type 2 diabetes: a 24-week, randomized, double-blind, placebo-controlled trial. Diabetes Care. 2014;37(6):1650–1659. | ||
Sesti G, Federici M, Hribal ML, Lauro D, Sbraccia P, Lauro R. Defects of the insulin receptor substrate (IRS) system in human metabolic disorders. Faseb J. 2001;15(12):2099–2111. | ||
Huri HZ, Min YS, Pendek R. Episodes of hypoglycemia and hyperglycemia during the use of sliding scale insulin in hospitalized diabetes patients. Asian Biomed. 2009;1(3):307–311. | ||
Brown GR, Hem V, Katz KS, et al. Gene: a gene-centered information resource at NCBI. Nucleic Acids Res. 2015;43(D1):D36–D42. | ||
Huri HZ, Makmor-Bakry M, Hashim R, Mustafa N, Wan Ngah WZ. Optimisation of glycaemic control during episodes of severe/acute hyperglycaemia in patients with type 2 diabetes mellitus. Int J Clin Pharm. 2012;34(6):863–870. | ||
Idänpään-Heikkilä JE. Ethical principles for the guidance of physicians in medical research--the Declaration of Helsinki. Bull World Health Organ. 2001;79(4):279–279. | ||
Mcgettrick AJ, Feener EP, Kahn CR. Human insulin receptor substrate-1 (IRS-1) polymorphism G972R causes IRS-1 to associate with the insulin receptor and inhibit receptor autophosphorylation. J Biol Chem. 2005;280(8):6441–6446. | ||
El Mkadem SA, Lautier C, Macari F, et al. Role of allelic variants Gly972Arg of IRS-1 and Gly1057Asp of IRS-2 in moderate-to-severe insulin resistance of women with polycystic ovary syndrome. Diabetes. 2001;50(9):2164–2168. | ||
Villuendas G, Botella-Carretero JI, Roldán B, Sancho J, Escobar-Morreale HF, San Millán JL. Polymorphisms in the insulin receptor substrate-1 (IRS-1) gene and the insulin receptor substrate-2 (IRS-2) gene influence glucose homeostasis and body mass index in women with polycystic ovary syndrome and non-hyperandrogenic controls. Hum Reprod. 2005;20(11):3184–3191. | ||
Rung J, Cauchi S, Albrechtsen A, et al. Genetic variant near IRS1 is associated with type 2 diabetes, insulin resistance and hyperinsulinemia. Nat Genet. 2009;41(10):1110–1115. | ||
Shu XO, Long J, Cai Q, et al. Identification of new genetic risk variants for type 2 diabetes. PLoS Genet. 2010;6(9):e1001127. |
 © 2018 The Author(s). This work is published and licensed by Dove Medical Press Limited. The full terms of this license are available at https://www.dovepress.com/terms.php and incorporate the Creative Commons Attribution - Non Commercial (unported, v3.0) License.
By accessing the work you hereby accept the Terms. Non-commercial uses of the work are permitted without any further permission from Dove Medical Press Limited, provided the work is properly attributed. For permission for commercial use of this work, please see paragraphs 4.2 and 5 of our Terms.
© 2018 The Author(s). This work is published and licensed by Dove Medical Press Limited. The full terms of this license are available at https://www.dovepress.com/terms.php and incorporate the Creative Commons Attribution - Non Commercial (unported, v3.0) License.
By accessing the work you hereby accept the Terms. Non-commercial uses of the work are permitted without any further permission from Dove Medical Press Limited, provided the work is properly attributed. For permission for commercial use of this work, please see paragraphs 4.2 and 5 of our Terms.