")
Back to Journals » International Journal of Nanomedicine » Volume 15
Iron(II) phthalocyanine Loaded and AS1411 Aptamer Targeting Nanoparticles: A Nanocomplex for Dual Modal Imaging and Photothermal Therapy of Breast Cancer
Authors He Y , Wang M , Fu M, Yuan X, Luo Y, Qiao B , Cao J, Wang Z , Hao L, Yuan G
Received 16 March 2020
Accepted for publication 9 July 2020
Published 11 August 2020 Volume 2020:15 Pages 5927—5949
DOI https://doi.org/10.2147/IJN.S254108
Checked for plagiarism Yes
Review by Single anonymous peer review
Peer reviewer comments 2
Editor who approved publication: Dr Mian Wang
Yubei He,1 Mengzhu Wang,2 Ming Fu,2 Xun Yuan,3 Yuanli Luo,2 Bin Qiao,2 Jin Cao,2 Zhigang Wang,2 Lan Hao,2,* Gengbiao Yuan1,*
1Department of Nuclear Medicine, The Second Affiliated Hospital of Chongqing Medical University, Chongqing 400010, People’s Republic of China; 2Chongqing Key Laboratory of Ultrasound Molecular Imaging, The Second Affiliated Hospital of Chongqing Medical University, Chongqing 400010, People’s Republic of China; 3Department of Ophthalmology, The Second Affiliated Hospital of Chongqing Medical University, Chongqing 400010, People’s Republic of China
*These authors contributed equally to this work
Correspondence: Lan Hao; Gengbiao Yuan Email [email protected]; [email protected]
Purpose: A multi-functional nanoplatform with diagnostic imaging and targeted treatment functions has aroused much interest in the nanomedical research field and has been paid more attention in the field of tumor diagnosis and treatment. However, some existing nano-contrast agents have encountered difficulties in different aspects during clinical promotion, such as complicated preparation process and low specificity. Therefore, it is urgent to find a nanocomplex with good targeting effect, high biocompatibility and significant therapeutic effect for the integration of diagnosis and treatment and clinical transformation.
Materials and Methods: Nanoparticles (NPs) targeting breast cancer were synthesized by phacoemulsification which had liquid fluorocarbon perfluoropentane(PFP) in the core and were loaded with Iron(II) phthalocyanine (FePc) on the shell. The aptamer (APT) AS1411 was outside the shell used as a molecular probe. Basic characterization and targeting abilities of the NPs were tested, and their cytotoxicity and biological safety in vivo were evaluated through CCK-8 assay and blood bio-chemical analysis. The photoacoustic (PA) and ultrasound (US) imaging system were used to assess the effects of AS1411-PLGA@FePc@PFP (A-FP NPs) as dual modal contrast agent in vitro and in vivo. The effects of photothermal therapy (PTT) in vitro and in vivo were evaluated through MCF-7 cells and tumor-bearing nude mouse models.
Results: A-FP NPs, with good stability, great biocompatibility and low toxicity, were of 201.87 ± 1.60 nm in diameter, and have an active targeting effect on breast cancer cells and tissues. With the help of PA/US imaging, it was proved to be an excellent dual modal contrast agent for diagnosis and guidance of targeted therapy. Meanwhile, it can heat up under near-infrared (NIR) laser irradiation and has achieved obvious antitumor effect both in vitro and in vivo experiments.
Conclusion: As a kind of nanomedicine, A-FP NPs can be used in the integration of diagnosis and treatment. The treatment effects and biocompatibility in vivo may provide new thoughts in the clinical transformation of nanomedicine and early diagnosis and treatment of breast cancer.
Keywords: poly (lactic-co-glycolic) acid, theranostics, phase transition, photoacoustic imaging, ultrasound imaging, near infrared
Introduction
Breast cancer has become a major threat to women’s health.1,2 Various treatments have been raised up over the past few decades, and among which traditional surgery plays the leading part while radiotherapy, chemotherapy, endocrine therapy, and immunotherapy as supporting roles.3,4 However, side effects caused by traditional surgery affect life quality and have caused concern.5 Therefore, the concept of “precise medicine” was proposed which emphasizes “medical visualization”, “integration of diagnosis and treatment” and “low dose and low toxic side effects”. Despite the good results of precise treatment achieved from two representative medications pertuzumab and trastuzumab, mortality and metastasis still remain a high level due to drug resistance or HER2 receptor negative.6 At the same time, some treatments have been developed with the rise of nanomedicine. Phototherapy,7 as one of the nanomedicine treatment methods, including photothermal therapy (PTT) and photodynamic therapy (PDT), has attracted attention because of its low systemic toxicity and no risk of drug resistance. Requirement of high oxygen limits the therapeutic effect of PDT due to hypoxic environment in solid tumors.8 PTT usually uses photothermal-conversion agent (PTCA) under near infrared (NIR) light irradiation to locally ablate tumors, which makes non-invasive treatment possible and reduces the adverse reactions of these treatments. The selection of PTCA generally requires to take biological safety, photothermal conversion ability in the near infrared band and so on into consideration.9 In recent years, researchers have developed a great number of materials with various advantages according to the characteristics of different diseases and tumours. A variety of those materials had been used for PTT, such as Au/MoS2-ICG in PDT/PTT combined therapy,10 Single-walled carbon nanotubes in treatment towards pancreatic carcinoma in situ,11 Heptamethine dyes and indocyanine-green-based agents utilized in imaging and PTT and so on.12,13 It is worth noting that degradation-resistance in vivo and biological toxicity are considered as disadvantages of some inorganic materials (gold, carbon, metal sulfide, etc.), which severely limits further applications. Unlike inorganic materials, organic ones are ideal in the field of phototherapy due to their higher safety, lower molecular weight, and ease of chemical modification.14 However, indocyanine green (ICG), the only approved clinical organic dye, has limitations such as poor optical stability and short blood circulation time, requiring relatively strict conditions of environment and timeliness in usage.13
Iron(II) phthalocyanine (FePc), one of the organic materials, can catalyze radical reactions in photochemical reactions. FePc belongs to porphyrinoid-based photosensitizers, which means that it was similar in structure to hemoglobin in vivo and turns out with great safety and biocompatibility.7,15 Lovell, Jin et al synthesized porphysomes and found that it was found that the liver and kidney functions of mice treated with porphysomes at a dose of 1000 mg/kg were within the normal range.16,17 Besides FePc was biologically safe for its similar structure with porphyrin, its broader absorption band than porphyrin derivatives also increases the depth effect and has better photothermal effects in tissues. While lots of reports about FePc used in PDT have been written, discussions regarding PTT are still limited in these years.18,19 FePc can be used as a good contrast agent for PA imaging owing to strong NIR absorption. However, poor water solubility and stability in vivo limit the application of FePc,18 which motivated researchers developed various carriers for carrying phthalocyanine (PCs), such as bionic system,20 liposome21 and so on.
Poly (lactic-co-glycolic acid) (PLGA) is one of the FDA-approved organic materials. Its biocompatibility and low toxicity can be used to improve the poor water solubility of FePc. In addition, it can increase encapsulation capability and has a potential to help efficiently deliver nanoparticles (NPs) to the target area.22,23 However, according to previous studies, it is still a big challenge to efficiently transfer multifunctional NPs to target lesions.24,25 Some studies simply implement experiments utilizing the enhanced penetration and retention (EPR) effect of NPs, which results in low NP-uptake and poor NP-penetration in tumor site because of phagocytosis of the vascular endothelial network.26,27 Jia et al put FePc into use for PTT for the first time and focused on enhancement of its biocompatibility and water solubility without taking the property of targeting into consideration.28 Hence, full consideration should be given to grant the ability of active targeting and particles enrichment at target area when designing the structure of NPs.
Aptamer (APT) AS1411 is an oligonucleotide sequence which has been confirmed to selectively bind to nucleolin with a high binding affinity. The nucleolin is mainly found in the nucleus and partially exists in the cell membrane and cytoplasm29,30 and has been used as a good molecular targeting probe for NPs.31–34 AS1411, of small molecular weight, belongs to DNA with no antigen-antibody reaction, and is easy to synthesize and generalize.35,36
In addition, the lack of visualization results in uneven distribution of thermal energy, which significantly limits further application of PTT.37 Besides, as a part of the integration of diagnosis and treatment, imaging is also of great significance for early diagnosis. It can not only provide sufficient diagnostic information and real-time monitoring, but also optimize the time window of treatment and assist in selecting the best treatment timing.12 Photoacoustic (PA) imaging has emerged as a successful in vivo imaging method with higher spatial resolution.38,39 Ultrasound (US) imaging can clearly show the tissue structure of tumor, especially the contours and boundaries of the tissue. Furthermore, NPs loaded with liquid fluorocarbon (PFC) can be transferred into microbubbles (MBs) by the optical droplet vaporization (ODV) effect to obtain contrast enhanced ultrasound (CEUS) imaging. The dual modal imaging method is conducive to avoiding the inherent disadvantages of single modal imaging and making full use of the integration of various imaging modalities advantages to provide sufficient comprehensive anatomical and biological information.40 It can also assist in guiding and monitoring the PTT process.41
In this research, we reported the design and preparation process of a liquid-gas phase-changing targeting NPs with FePc on the shell. And perfluoropentane (PFP) was put into the core of the NPs to enhance ultrasound contrast (CEUS) and FePc was to generate PA imaging signals. PA/US imaging was employed for easier tumor tissue localization and deeper penetration.18 An ammonia-modified APT AS1411 was linked onto the NPs as a targeting molecular probe to achieve targeting ability. The NPs, termed A-FP NPs (AS1411-PLGA@FePc@PFP), were designed to function as a contrast agent for theranostics and possess good biocompatibility, high entrapment rate and low toxicity. A-FP NPs performed good PTT treatment under the guidance of PA/US imaging. Significant inhibition of tumor growth and metastasis was obtained from this precise treatment and were objectively evaluated by experiments in vivo and in vitro. Systematic biological and chemical evaluations of the NPs have been conducted. The results demonstrated the prospect of the A-FP NPs as a molecular probe for theranostics and clinical applications.
Materials and Methods
Materials
The poly (lactic-co-glycolic) acid (PLGA) (50:50, MW: 12,000) was obtained from Daigang BIO Engineer Ltd., Co. (Shan Dong, China). Iron(II) phthalocyanine (FePc) was purchased from Tokyo Chemical Industry (Tokyo, Japan). Perfluoropentane (PFP) was purchased from Strem Chemicals (Newburyport, USA). 4,6-diamidino-2-phenylindole(DAPI),1,1-dioctadecyl-3,3,3′,3′-tetramethylindocarbocyanine perchlorate (DiI),1,1′-dioctadecyl-3,3,3′,3′-tetramethylindotricarbocyanine iodide (DiR), Calcein-AM and propidium iodide (PI), poly(vinyl alcohol) (PVA), 2-(N-Morpholino) ethanesulfonic acid hydrate (MES), 1-ethyl-3-(3-dimethylaminopropyl)-carbodiimide (EDC), N-hydroxysuccinimide (NHS) were purchased from Sigma-Aldrich Co. (St Louis, MO, USA). Carboxyfluorescein (FAM) labeled-AS1411 was obtained from Sangon Biotech (Shang Hai, China). A Cell Counting Kit-8 (CCK-8) was purchased from MedChemExpress (USA). All the cell culture materials were purchased from Nest Biotechnology (Wu Xi, China). All the chemicals used in this work are of analytical reagent grade and can be used without further purification.
Synthesis and Characterization of A-FP NPs
FP NPs (PLGA@FePc@PFP, non-targeting NPs) were synthesized by the double-emulsion (water-oil-water) process. A-FP NPs were synthesized from FP NPs and AS1411-NH2 by carbodiimide method.42,43 Both of the above procedures were conducted in dark condition. Details are as follows. First, fully dissolved 8 mg of FePc and 50 mg of PLGA-COOH in 2 mL of chloroform (CHCL3). Second, added 0.2 mL PFP to the above solution under ice bath conditions and emulsify them for the first time with a sonicator (2.5min, 5s on, 5s off). After that, the emulsified solution above was added to 10 mL of PVA solution and the second emulsification (4min, 5s on, 5s off) was conducted. Subsequently, put 10 mL of isopropanol (w/v=2%) solution into it and stirred the mixed liquid with magnetic force for 6 hours. Then, centrifugation (temperature: 4°C) was performed and FP NPs were obtained as the precipitate. AS1411-NH2 was fully dissolved in TE buffer (PH = 8.0) at a ratio of 1OD/40μL (1 OD≈33.3μg). Then took appropriate amount of FP NPs (5.0 mg/mL) and put them into MES buffer solution (pH = 5.0, 0.1 mol/L, 4 mL). Afterward, added 500μL each of 0.1mol NHS and 0.4mol EDC into the mixture, and incubated the above blended substance at 4°C with shaking for 3 hours. And then used low-temperature centrifugal washing way to remove excess NHS/EDC. Add the washed product into MES buffer solution (pH = 8.0, 0.1 mol/L, 5mL); meanwhile, the former dissolved AS1411-NH2 in TE buffer solution was also put into the MES buffer solution. And then the liquid with both AS1411-NH2 and FP NPs was incubated and at 4°C with shaking for 3 hours. Through centrifugal washing at low temperature, targeting A-FP NPs were acquired. The particles were lyophilized and stored at 4°C.
Except for the only difference that FePc was not dissolved at the first step, the preparation process of A-P NPs (targeting NPs without FePc) was basically the same as the above A-FP NPs synthesis.
The preparation steps of A-FP NPs containing DiI or DiR fluorescence were also the same as before, but at the first step, DiI or DiR was dissolved together with PLGA and FePc.
Size and Zeta potential of both FP NPs and A-FP NPs were measured by utilizing dynamic light scattering (DLS, Malvern Instruments, Malvern, UK), respectively. Morphology and structure characterizations of the A-FP NPs were examined and observed by Transmission electron microscopy (TEM, Hitachi H-7600, Japan). During continuous observation of changes of the scattered A-FP NPs in fetal bovine serum (FBS), which focused on the mean size of A-FP NPs in 2 weeks, and digital photographs were captured at day 0, 1, 3, 7, 14. The FePc concentration Standard Absorbance Curve was measured with UV-vis spectrophotometer (UV-2550, Shimadzu, Japan).To be more specific, UV-vis spectrophotometer was used to inspect the absorbances at 660nm at different concentrations (0.02, 0.04, 0.06, 0.08, 0.10 mg/mL). Meanwhile, the absorption spectra of A-FP NPs, A-P NPs and FePc were measured. Then, the absorbance of FePc in 0.5 mg/mL A-FP NPs solution was measured by UV-vis spectrophotometer, the corresponding weight of FePc was calculated via standard curve. The encapsulation efficiency (EE) was calculated as follows:
EE % = weight of FePc in NPs/total weight of FePc × 100%
Conjugation Between AS1411 and FP NPs
In order to facilitate the observation of connection between AS1411-NH2 and FP NPs quantitatively and qualitatively, AS1411-NH2 modified with FAM Fluorescence at the 3ʹ end was customized and Dil dye was attached when preparing FP NPs. A-FP NPs with FAM and DiI fluorescent were synthesized through the same method with same parameters mentioned in the previous synthesis part, wherein FAM was modified at the 3ʹend of AS1411 and DiI was loaded on the shell of PLGA NPs during the synthesis. The whole process was conducted under dark condition using tin foil paper. 10μL of 1.0mg/mL A-FP NPs (FAM and DiI loaded) were taken onto the glass slide, and confocal laser scanning microscopy (CLSM, Nikon A1, Japan) was utilized to observe the successful conjugation of between FP NPs and AS1411 through the fluorescent fusion state. The flow cytometry (FACSV antage, Becton Dickinson and Company, USA) was utilized to examine the connection rate at the same time.
In vitro PA/US Imaging
Firstly, an agar gel model was constructed for in vitro PA/US imaging. The models containing A-FP NPs at a concentration of 5.0 mg/mL were scanned at a full wavelength with a step size of 5 nm to find the most optimal wavelength. The operation was applied to all the models of different concentrations, respectively. Then, A-FP NPs were primarily prepared and configured into different concentration levels (0.5, 1.0, 2.5, 5.0 mg/mL). A-P NPs (AS1411-PLGA@PFP NPs, targeting NPs without FePc) (5.0 mg/mL) were set as the control group. Different concentrations of NPs were separately added into the gel model. All the images were captured and observed by the Vevo LAZR PA imaging system (VEVO 2100; FUJIFILM Visual Sonics, Canada). PA signals of the ROI (Regions of Interest) were measured by the built-in system, and then linear regression analysis was calculated.
For in vitro US/CEUS imaging, A-FP NPs were diluted to different concentrations (0.5, 1.0, 2.5, 5.0 mg/mL). A-P NPs (5.0 mg/mL) were also set to be the control group. NIR laser irradiation (1.5W/cm2, 10 min) was applied to all the NPs, and then the NPs were put into the gel models. The gray values of the US/CEUS imaging were observed by Institute of Ultrasound Imaging ultrasound self-developed system. The relationship between the ultrasonic signal intensity of NPs and the concentration of NPs was analyzed. Simultaneously, the liquid-gas phase transition of A-FP NPs and A-P NPs (AS1411-PLGA@PFP, targeting NPs without FePc) during irradiation was recorded by optical microscope (Nikon A1, Japan). Then the suitable concentration for PA/US imaging in vivo was determined.
Cell Culture
The MCF-7 human breast cancer cell line was purchased from ATCC. Cells were cultured in RPMI-1640 medium with 10% fetal bovine serum and 1% penicillin/streptomycin and preserved in a humidified incubator containing 5% CO2 at a culture temperature of 37°C. All the cells used in the experimental process were in logarithmic growth phase.
In vitro Cytotoxicity and in vitro Cell Targeting
The logarithm-grown phase MCF-7 cells were planted at a density of 1×10⁴/well in 96-well culture plates and incubated under the cell incubator (37°C, 5% CO2) until more than 50% of the cells had adhered. After removing the culture medium, sterilized A-FP NPs were configured to different concentrations (0.2, 0.4, 0.6, 0.8, 1.0 mg/mL) with serum-free cell culture medium and added into the 96-well culture plates, laying out five repeating holes per concentration. Subsequently, all the cells were cultured for 24 h and then washed with PBS. After that, 10% CCK-8 reagent was added into every well at a dose of 100 μL. Cells were cultured for another hour and then the absorbance values of these cells at 450 nm wavelength were detected by the Multifunctional Enzyme Label Instrument (ELI, Thermo Fisher Scientific, USA). The group with only medium but no cells was set as the blank group and the group with only cells and medium but no A-FP NPs was regarded as a control group. Cell survival rate was calculated according to the formula.
The investigation of cell-targeting ability was performed. First, the cells in logarithmic growing phase inoculated in the CLSM-exclusive culture dishes at a density of 1×10⁵/well were incubated for 24 h. Then all these cells were divided into two groups: the Non-targeting group (culture medium containing DiI-labeled FP NPs), and the Targeting group (culture medium containing DiI-labeled A-FP NPs). After processing the two groups according to treatment mentioned above, these groups were put into incubation for 1 h or 4 h. The cells were fixed with 4% paraformaldehyde (15 min), stained by DAPI nuclei stained (10 min). During the mentioned process above, the cells were washed 3 times with PBS per step to remove the untargeted NPs and residual dye. Finally, the binding of NPs to cells was observed under the CLSM.
In vitro Photothermal Effect
Optimal heating conditions were mainly affected by irradiation power and NPs concentration.44 A-FP NPs (5.0 mg/mL) were added to 96-well plates and irradiated at different laser power densities (0,0.5, 1, 1.5 W/cm2). In addition, A-FP NPs at different concentrations were irradiated by the NIR laser at a certain power density. Briefly, 0.2 mL of A-FP NPs at different concentrations (0.5, 1.0, 2.5, 5.0 mg mL−1) and saline (the control group) were added to 96-well plates. NIR laser (1.5 W/cm2, 5 min) irradiation was applied to each group in the 96-well plates. The temperature changes and thermo graphic were recorded by the thermal imager and IR imaging equipment (Fluke Ti32, Fluke Corporation, USA). In order to verify the thermal stability, A-FP NPs were added to a 96-well plate, irradiated with a NIR laser (1.5 W/cm2), and naturally cooled down to room temperature. After a repetition of such a circle for 5 times, and temperature alterations were recorded by a thermal image.
In vitro Photothermal Therapy
The MCF-7 cells were planted in laser confocal culture dishes at a density of 1×10⁶ cells/well, and incubated in the incubator for 24 h. After that, all the cells were divided into 5 groups randomly: the control group (MCF-7 cells only), A-FP NPs group (with A-FP NPs only), Laser group (treated with laser only), FP NPs + Laser group (treated with both FP NPs and laser) and A-FP NPs + Laser group (treated with both A-FP NPs and laser). The original medium was removed and replaced by NPs (FP NPs or A-FP NPs) dispersed in medium (1.0 mg/mL, medium: RM1640). After 4 h of culture, the cell culture dishes were washed with PBS to remove unbound NPs. A NIR laser (1.5 W/cm2, 5 min) was applied to different culture dishes, however, except for the control group and the A-FP NPs group. Then, cells were stained with Calcein-AM (green fluorescence)/PI (red fluorescence) and observed under the CLSM.
Animal Model
All animal experiments were conducted according to the protocol approved by the Animal Ethics Committee of Chongqing Medical University, and all the operations were conducted in accordance with the “Guidelines for the Care and Use of Experimental Animals”. All female BALB/c nude mice (4~6 weeks) were obtained from the Experimental Animal Center of Chongqing Medical University and domesticated in a suitable environment allowing them free to drink and eat. The tumor model was established as the following: each nude mouse was subcutaneously injected in the right flank with 1× 10⁶ MCF-7 cells suspended in 100 μL PBS solution. The volume calculation formula of the tumor is V = π/6 × length × width2.
In vivo Toxicity
Fifteen female mice were divided into five groups (n = 3): Control, 1 d, 3 d, 7 d and 14 d group. The mice were executed at various time points (0 d, 1 d, 3 d, 7 d and 14 d) after intravenously injection with the A-FP NPs (0.2 mL, 5 mg/mL). Blood samples were collected for blood analysis and biochemistry analysis. The main organs (liver, spleen, kidney, heart and lung) of the mice were dissected and fixed with 4% polyoxymethylene for HE staining.
Biodistribution and Tumor-Targeting Ability of NPs
Ten tumor-bearing mice were divided into 2 groups (n = 5): A-FP NPs group (Targeting group) and FP NPs group (Non-targeting group). 1,1ʹ-dioctadecyl-3,3,3ʹ,3ʹ-tetramethylindotricarbocyanine iodide (DiR)-labeled A-FP NPs or FP NPs (0.2 mL, 5 mg/mL) were iv–injected into the mice, and in vivo fluorescence imaging was performed at before injection and 2 h, 4 h, 6 h, 12 h and 24 h after injection to measure the fluorescence signal intensity of the tumor regions. At 24 h after injection, important tissues (heart, liver, spleen, lung, kidney) and tumor tissues were isolated from each group for ex-vivo fluorescence imaging. The NIRF images of mice were obtained by the Xenogen IVIS Spectrum imaging system (PerkinElmer, USA)
In vivo PA/US Imaging
Ten tumor-bearing mice were divided into 2 groups (n = 5): A-FP NPs group (targeting group) and FP NPs group (non-targeting group). Certain concentrations of A-FP NPs or FP NPs (0.2 mL, 5 mg/mL) were injected into the tumor-bearing mice, respectively. PA images and corresponding PA signal value were collected before injection (pre) and at different time points (3 h, 6 h, 12 h, 24 h). The PA signal values of all the above ROI were measured and recorded by the system built-in software, and then linear regression analysis was calculated.
In the US and ultrasonic contrast-enhanced (CEUS) imaging experiments, the tumor-bearing mice were injected with 0.2 mL of A-FP NPs (5.0 mg/mL) and FP NPs (5.0 mg/mL). Based on in vivo fluorescence distribution and PA imaging time points, the tumor was irradiated with a NIR laser (660 nm, 1.5 w/cm2) 6 hours later after being injected. The US and CEUS images were obtained using an ultrasonic diagnostic apparatus.
In vivo Photothermal Therapy
When the tumor volume reached 50–80 mm3, 25 tumor-bearing mice were randomly divided into 5 groups (n=5): the control group (each nude mouse was injected saline via tail vein), A-FP NPs group (each nude mouse was injected A-FP NPs via tail vein), Laser group (each nude mouse was only treated with NIR laser), FP NPs +Laser group (each nude mouse was treated with both FP NPs and NIR laser) and A-FP NPs + Laser group (each nude mouse was treated with both A-FP NPs and NIR laser). All the concentration of the NPs was 5.0 mg/mL. After normal feeding for 6 hours, the tumor-bearing mice were anesthetized with 1% pentobarbital. The tumor areas temperatures were recorded by NIR imager and thermal images were also captured; 24 hours after the end of the treatments, one tumor-bearing mouse was executed in each group. Important organs (heart, liver, spleen, lung and kidney) of the executed mice were dissected and stained with hematoxylin and eosin staining (HE), while the tumor tissues were fluorescently stained HE, terminal deoxynucleotidyl transferase dUTP nick end labeling (TUNEL), proliferating cell nuclear antigen (PCNA) and Heat shock 70 kDa protein (HSP70) staining. The body weight and tumor size of all the mice were photographed and documented every three days with a vernier caliper. Tumor volume was standardized to the relative tumor volume V/V0 (V0 refers to the pre-treatment volume).
Statistical Analysis
Data were analyzed by SPSS 22.0 software and presented as mean± standard deviation, significant difference was calculated by using Student’s T-test: *P < 0.05, **P < 0.01, ***P < 0.001, ****P < 0.0001.
Results and Discussion
Synthesis and Characterization of A-FP NPs
According to the flowchart shown in Figure 1 which illustrated the preparation processes and experimental design, A-FP NPs were synthesized for imaging and PTT treatment via a two-step emulsion method followed with carbodiimide method.45 As shown in Figure 2A, the color of A-FP NPs lyophilized powder changed from white to blue, indicating that FePc was successfully loaded onto PLGA at the macro level, and lyophilized powder was able to be well re-suspended in aqueous solution for biological applications, which makes the production of clinical reagents possible. TEM image (Figure 2B) showed that A-FP NPs possessed good spherical shape, dispersed uniformly and the particle size was small. The average diameters of A-FP NPs were about 201.87 ± 1.60 nm (Figure 2C), and the FP NPs were of 185.13 ± 5.04 nm in diameter (Figure 2D). The size of PLGA NPs could be managed by setting up parameters of sonication (power, interval) or adjusting polymer concentration in organic phase, which has been demonstrated.46 The mean zeta potentials of A-FP NPs and FP NPs were, respectively, −10.67 ± 0.25 mV and −14.30 ± 1.15 mV (Figure 2E). The average particle size of A-FP NPs did not change significantly in FBS within two weeks, which indicates that A-FP NPs were stable under physiological conditions in vitro (Figure 2F). The absorbance of FePc was measured by a UV-vis spectrophotometer. As shown in Figure 2G, the absorbance changed in a positive concentration-dependent manner. The linear regression equation at 660 nm is Y = 19.03 X + 0.1019 (R2 = 0.9971). The absorption wavelength of A-FP NPs was broad in the UV-visible range, and a good linear relationship was deducted between optical density and concentration, according to the standard curve. The Entrapment efficiency (EE%) of FePc is (82.26 ± 2.39) %. The absorption curve of FePc in different concentration solutions showed that its highest absorption peak was at 655 nm (Figure 2H). In addition, compared with A-P NPs (AS1411-PLGA@PFP, targeted NPs without FePc), A-FP NPs showed a stronger absorption peak at 635 nm (Figure 2I). With various data above, FePc loading onto PLGA was proved practical. A-FP NPs were prepared through the above experiments and stable physical and chemical properties of them were confirmed. The successful preparation of A-FP NPs laid the foundation for all subsequent experiments.
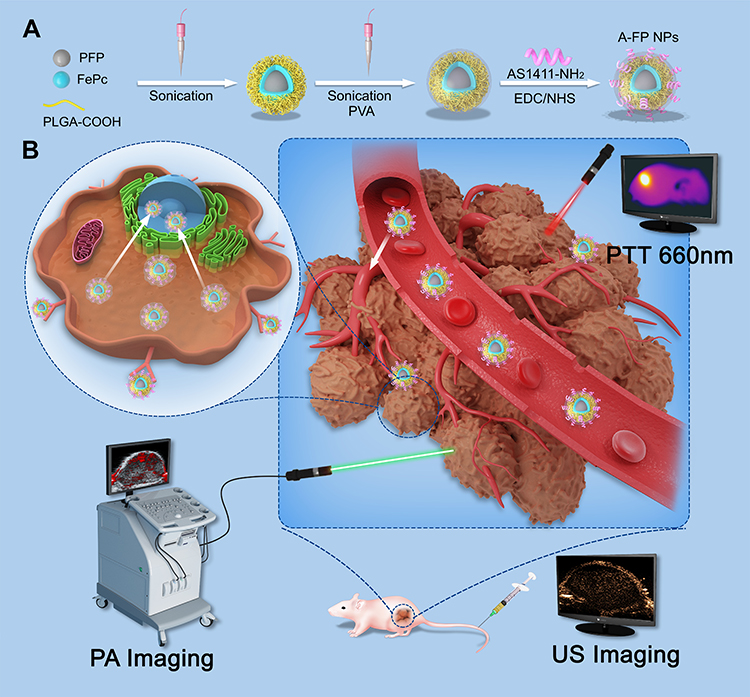 |
Figure 1 (A) Schematic synthetic procedure illustration of synthetic procedure of the multifunctional nanocomplex. AS1411-PLGA@FePc@PFP (A-FP NPs); (B) PA/US imaging-guided PTT for breast tumor cells/tissue. Abbreviations: PLGA, poly(lactic-co-glycolic acid); FePc, iron(II) phthalocyanine; NPs, nanoparticles; PA, photoacoustic; US, ultrasound; PTT, photothermal treatment; PFP, perfluoropentane; PVA, poly(vinyl alcohol); EDC, 1-ethyl-3-(3-dimethylaminopropyl)-carbodiimide; NHS, N-hydroxysuccinimide. |
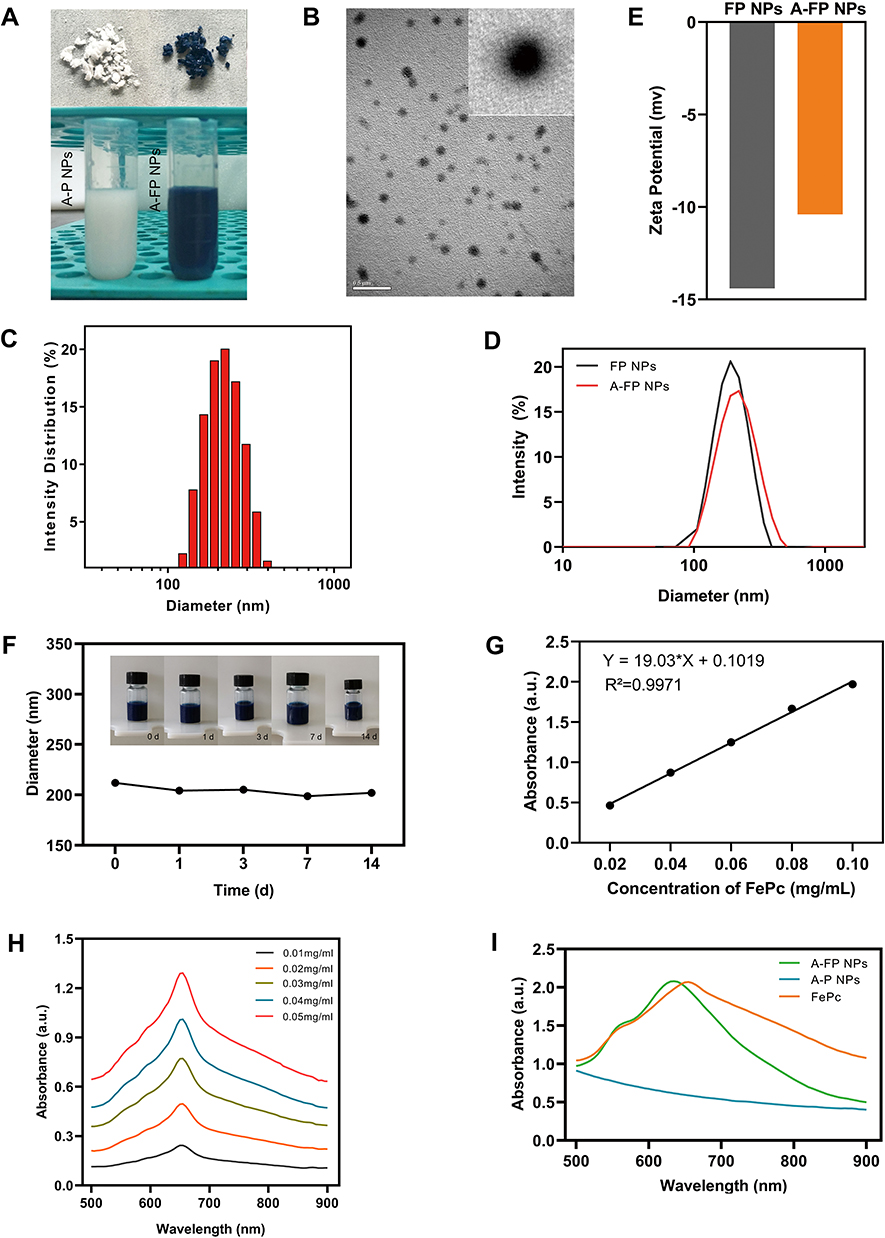 |
Figure 2 (A) The lyophilized powder and aqueous solution of A-P NPs (white) and A-FP NPs (blue). (B) TEM image of A-FP NPs (scale bar:0.5 μm). (C) Size distribution of A-FP NPs and (D) Size of different NPs (A-FP NPs and FP NPs) measured by DLS. (E) The zeta potentials of A-FP NPs and FP NPs. (F) The changes of size distribution for 2-week time period. Inset: digital photos of the A-FP NPs dispersed in FBS (5.0 mg/mL). (G) The relative absorbance intensity of FePc at the wavelength of 660 nm. (H) The absorbance spectra of FePc at different concentration solutions. (I) The absorbance spectra of A-P NPs, A-FP NPs and FePc. Abbreviations: FePc, iron(II) phthalocyanine; NPs, nanoparticles; TEM, transmission electron microscopy; DLS, dynamic light scattering; FBS, fetal calf serum; A-P NPs, AS1411-PLGA@PFP; A-FP NPs, AS1411-PLGA@FePc@PFP; FP NPs, PLGA@FePc@PFP. |
Conjugation Between AS1411 and FP NPs
To confirm the successful conjugation, FP NPs were synthesized with Dil fluorescence and AS1411 was tail modified with FAM fluorescence. The overlap of green fluorescence (FAM) and red fluorescence (DiI) was clearly displayed by CLSM (Figure 3A). Besides, flow cytometry results showed that the combination rate of A-FP NPs (96.20 ± 2.32%) was significantly stronger than that of FP NPs (1.48 ± 1.38%) (Figure 3B and C). These results had fully demonstrated that the aptamer AS1411 was successfully conjugated to FP NPs and provided essential conditions for effective breast tumor tissues targeting. The deficiencies of some studies that relied solely on the EPR effect were compensated.28,47
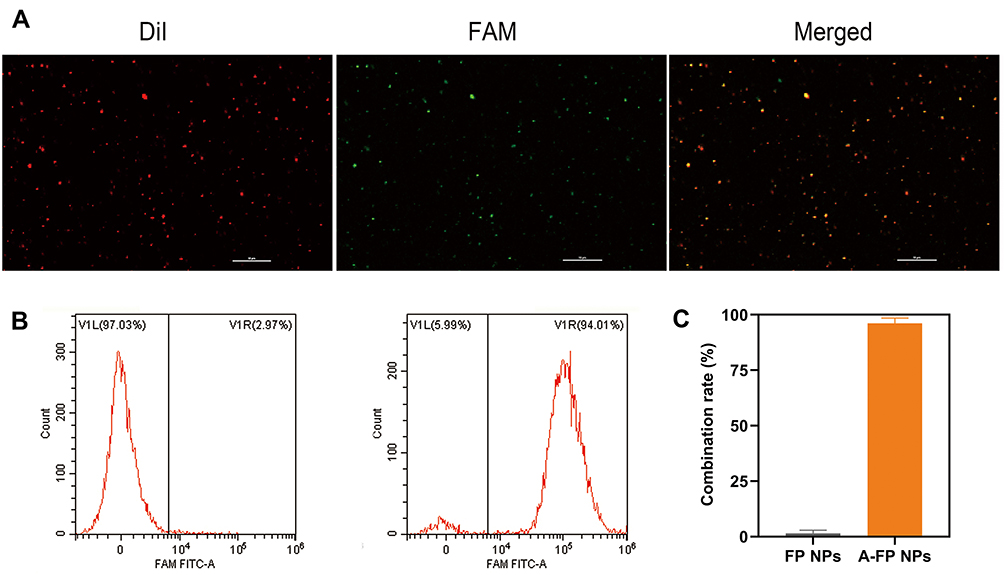 |
Figure 3 (A) The CLSM images of FAM-labeled AS1411 and DiI-labeled NPs. DiI-labeled FP NPs showing red fluorescence, FAM-labeled showing green fluorescence, overlap of the AS1411 with FP NPs presenting as yellow fluorescence in the combined channel (scale bar: 10 μm). (B) Flow cytometry results of binding efficiency (FP NPs and A-FP NPs).(C) Average binding efficiencies of different NPs. Abbreviations: FAM, carboxyfluorescein; DiI, 1,1-dioctadecyl-3,3,3′,3′-tetramethylindocarbocyanine perchlorate; CLSM, confocal laser scanning microscopy; FCM, flow cytometry; A-FP NPs, AS1411-PLGA@FePc@PFP; FP NPs, PLGA@FePc@PFP. |
In vitro PA/US Imaging
PA and US imaging were firstly performed separately with different concentrations of A-FP NPs, A-P NPs (5.0 mg/mL, without FePc) were set as control group. Firstly, 680 nm was proved to be the optimal wavelength for PA imaging by full-wavelength scanning (Supplementary Figure S1). As shown in Figure 4A, FePc was considered as a decisive component of PA signal existence, since PA signals were barely observed in A-P NPs group. Additionally, PA signal of A-FP NPs group performed a positive concentration-dependency (Figure 4B), indicating that the material can be stabilized and sustained as a contrast agent and provide high-quality PA images.28,48 Meanwhile, PFP, the core of the A-FP NPs, caused optical droplet vaporization (ODV) under NIR radiation,49 Liquid-gas phase transitions were recorded in A-FP NPs group: the A-FP NPs became micron-sized bubbles (Figure 4E). Without FePc, A-P NPs were unable to absorb and convert light energy into thermal energy; thus, they were unable to induce PFP to undergo liquid-gas phase transitions, which was proved since no change was observed under optical microscopy. Due to ODV, signals of US and CEUS imaging presented satisfying signal intensity in a concentration-dependent manner after irradiation (Figure 4A, C and D), while no signal intensity change was detected in control group (A-P NPs) under the same condition. Compared with the A-P NPs group, significantly enhanced contrast of US/CEUS imaging demonstrated that generation of heat under laser irradiation and liquid-gas phase transition of PFP were facilitated by ideal photothermal effect of FePc loaded on NPs, which was in accordance with previous reports.50 The results above proved that A-FP NPs can be used as an excellent PA/US contrast agent in vitro, and 5.0 mg/mL should be selected as the appropriate concentration for in vivo imaging.
 |
Figure 4 (A) In vitro PA/US/CEUS contrast images of A-FP NPs or A-P NPs at different concentrations. (B) PA intensity of A-FP NPs at different concentrations. (C and D) Gray values in US (B-mode) and CEUS imaging of A-FP NPs at different concentrations after Irradiation. (E) The phase change of A-FP NPs caused by laser irradiation and A-P NPs with no change (scale bars: 20 μm). Abbreviations: FePc, iron(II) phthalocyanine; PA, photoacoustic; US, ultrasound; CEUS, contrast enhanced ultrasound; A-P NPs, AS1411-PLGA@PFP; A-FP NPs, AS1411-PLGA@FePc@PFP; FP NPs, PLGA@FePc@PFP. |
In vitro Cytotoxicity Assay and in vitro Cell Targeting
Cells treated with A-FP NPs were tested. The A-FP NPs were incubated for 24 hours at different concentrations (0.2, 0.4, 0.6, 0.8, 1.0 mg/mL), and then tested for in vitro toxicity by standard CCK-8 assay. Since A-FP NPs had little impact on the survival of the MCF-7 cells at the concentration under 1.0 mg/mL (Supplementary Figure S2), good biocompatibility and low toxicity were confirmed, indicating that it could be further utilized.
In vitro targeting experiments of MCF-7 cells were performed. Previous experiments have fully demonstrated the successful combination of AS1411 and FP NPs. The new compound was named as A-FP NPs, the targeting ability of DiI-labeled A-FP NPs towards MCF-7 cells was verified by CLSM. As shown in Figure 5, after 1 hour of incubation, a certain quantity of DiI-labeled A-FP NPs emitted red fluorescence and accumulated around the cells, while in the Non-targeting groups (FP NPs group), almost no NPs accumulated around the cells. Further validation experiments showed that A-FP NPs accumulated in MCF-7 cells in a time-dependent manner. In contrast, FP NPs without targeting property showed that only a few FP NPs accumulated in MCF-7 cells after 4 h of incubation due to cells’ phagocytic ability,51 demonstrating that A-FP NPs did have good targeting properties towards MCF-7 cells. The main reason for good targeting ability was that the target of AS1411 was nucleolin which tends to be over expressed in a variety of solid tumors and mainly exists in the nucleus, partly in the cytoplasm and cell membrane. The concentration of A-FP NPs in Figure 5 was concentrated around the nucleus (DAPI blue dye), which was in line with the target distribution area mentioned above. Some studies selected AS1411 as a target probe and gained accurate effect.52,53 This great targeting ability is conducive to the enrichment in vivo and lays the foundation for in vivo imaging and treatment.
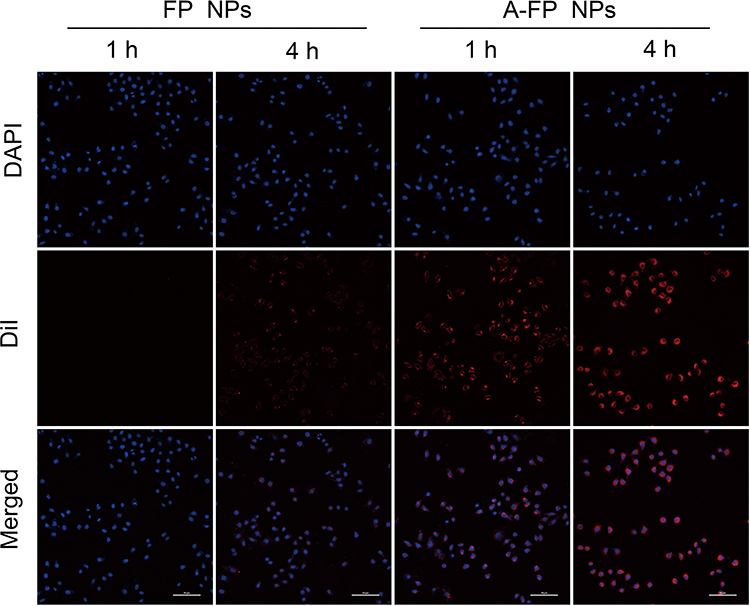 |
Figure 5 CLSM images of MCF-7 cells incubated with FP NPs and A-FP NPs 1h or 4h. From top to bottom: DAPI-labeled nuclei, DiI-labeled NPs and the corresponding merged images. (scale bars: 50 μm). Abbreviations: DAPI, 2-(4-amidinophenyl)-6-indolecarbamidinedihyrochloride; DiI, 1,1-dioctadecyl-3,3,3′,3′-tetramethylindocarbocyanine perchlorate; CLSM, confocal laser scanning microscopy; FCM, flow cytometry; A-FP NPs, AS1411-PLGA@FePc@PFP; FP NPs, PLGA@FePc@PFP. |
In vitro Photothermal Effect
To testify the photothermal performance, A-FP NPs at different concentrations were treated with NIR laser at different power intensities and concentrations, depending on which thermal images were generated. The temperature increased in a power-dependent manner, and a maximum temperature of 66°C was detected within a shorter period of irradiation at the power of 1.5 W/cm2, indicating that a stronger irradiation can reduce irradiation time (Figure 6A and C). Concentration-dependent photothermal effect was proved, since a maximum temperature of 65.7°C was obtained in the group with the highest A-FP NPs concentration (5.0 mg/mL) under the treatment of irradiation for 5 min (1.50 W/cm2) (Figure 6B and D). However, there was no significant increase in the control group (saline) under the same condition, indicating that A-FP NPs effectively converted NIR light energy into heat energy, and the efficiency was positively related to NPs’ concentration. Based on the above conditions, we chose the optimal conditions (concentration: 5.0 mg/mL and power: 1.50 W/cm2) for subsequent treatment in the body. Furthermore, photothermal stability of A-FP NPs was evaluated. A-FP NPs did not show noticeable attenuation in the periodic laser irradiation at power density of 1.50 W/cm2 (Figure 6E), highlighting that A-FP NPs could be used as photothermal conversion materials. It has good photothermal stability and no obvious energy attenuation. If it is transformed into a future clinical application, this advantage will help achieve multiple laser irradiation treatments after a single injection in a short term without repeated injections. The toxicity and side effects of the drug will be further reduced, and the treatment process will be simplified. If FePc is not loaded with NPs, energy decay may occur, which is not beneficial to repeated treatment and sustainably stable treatment effect.28
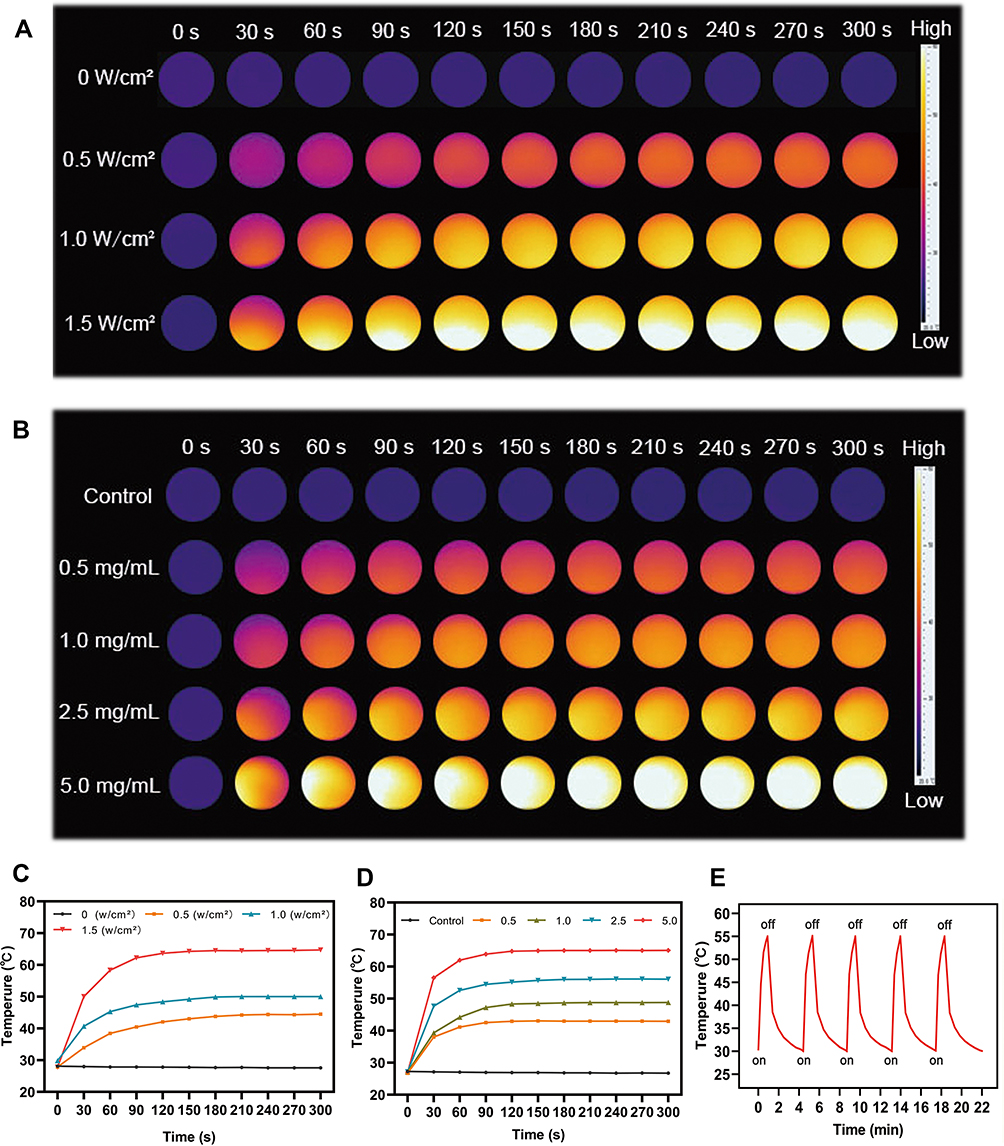 |
Figure 6 (A) The corresponding IR thermal images of A-FP NPs solution (5.0 mg/mL) at different power density of 660 nm laser (0, 0.5, 1.0 and 1.5 W/cm2). (B) The corresponding IR thermal images of saline and different concentrations of A-FP NPs solution (0.5, 1.0, 2.5, 5.0 mg/mL) at stable power density of 660 nm laser (1.5 W/cm2). (C) and (D) were temperature variation curves of A-FP NPs solution. (E) The temperature variation curves of the A-FP NPs solution after five cycles of Irradiation at power density of 1.50 W/cm2 to test the photothermal stability of A-FP NPs. Abbreviations: IR, infrared; A-P NPs, AS1411-PLGA@PFP; A-FP NPs, AS1411-PLGA@FePc@PFP. |
In vitro Photothermal Therapy
After different treatments, Calcein-AM and PI co-stained cells were observed under CLSM (Figure 7), in which green means living cells and red means dead cells. Cell death was barely observed in the control group, A-FP NPs and the Laser group, and the difference of cell death above three groups was not statistically significant. Partial cell death was observed in the FP NPs +Laser group, while the A-FP NPs +Laser treatment group achieved a very high death rate. A-FP NPs +laser group was the most effective group. It has been proven that the two groups of NPs loaded with FePc both have the ability to damage cells after being irradiated with NIR laser, but the targeting group will cause greater damage under the same conditions, because more targeting NPs accumulated than the non-targeted NPs within the same time (Cell targeting ability has been proven in previous experiments). In vitro PTT experiments further represented that A-FP NPs+Laser has excellent therapeutic effect which was evidently better than FP NPs+Laser group without targeting capability.
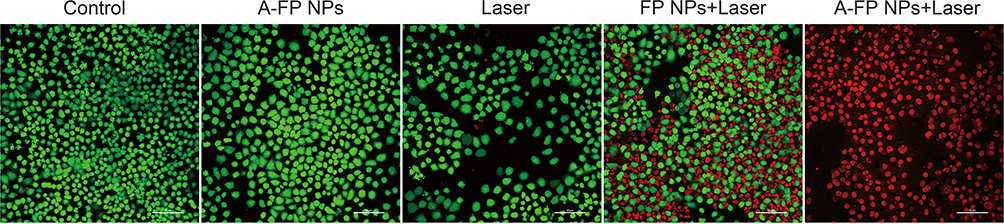 |
Figure 7 CLSM images of Calcein-AM and PI co-stained MCF-7 cells after different treatments. The scale bars are 50 μm. Abbreviations: Calcein-AM, calcein acetoxymethyl ester; PI, propidium iodide; CLSM, confocal laser scanning microscopy; A-FP NPs, AS1411-PLGA@FePc@PFP; FP NPs, PLGA@FePc@PFP. |
In vivo Toxicity
A qualified molecular probe shall possess not only the ability of imaging and guidance, but also good biocompatibility and biodegradability which ensure that it can circulate and be excreted from the body without obviously toxic side effects within a certain time after treatment. The A-FP NPs designed in this research were mainly composed of biocompatible and biodegradable components. Among them, the amino aptamer belongs to a small nucleotide ligand, and has been used as a target material for many times.31–36 The FePc shares the same structure as hematoporphyrin, which has the advantages of less side effects of hematoporphyrin and wider visible light absorption band. Perfluoropentane (PFP), a second generation of perfluorocarbon (PFC), belongs to liquid fluorocarbons, as well as a basic blood substitute with good safety performance.54
Further studies regarding in vivo toxicology were conducted to demonstrate its potential for clinical transformation. Preliminary detection of in vivo toxic side effects was conducted. As shown in Figure 8A, compared with the control group (0.2 mL, saline), no significant change was found in accordance with results (amount, morphology, distribution) of blood cells including white blood cells (WBC), red blood cells (RBC), platelets (PLT) and other index in the A-FP NPs group. Subsequently, the blood biochemical indicators were analyzed as well. According to Figure 8B, the liver function indexes were tested including alanine aminotransferase (ALT), aspartate aminotransferase (AST), alkaline phosphatase (ALP), albumin (ALB). Renal function indicators (urea nitrogen: BUN; and serum creatinine: Scr) in A-FP NPs group at each time point (Control, 1 d, 3 d, 7 d, 14 d) were proved to be normal. As HE staining results demonstrated in Supplementary Figure S3, no obvious lesions and organic injuries were detected in major organs (heart, liver, spleen, lung, kidney), indicating that A-FP NPs have no obvious side effects on mice at each time point (Control, 1 d, 3 d, 7 d, 14 d). These results showed that A-FP NPs have no obvious toxicity in vivo and do have potential value for clinical transformation.
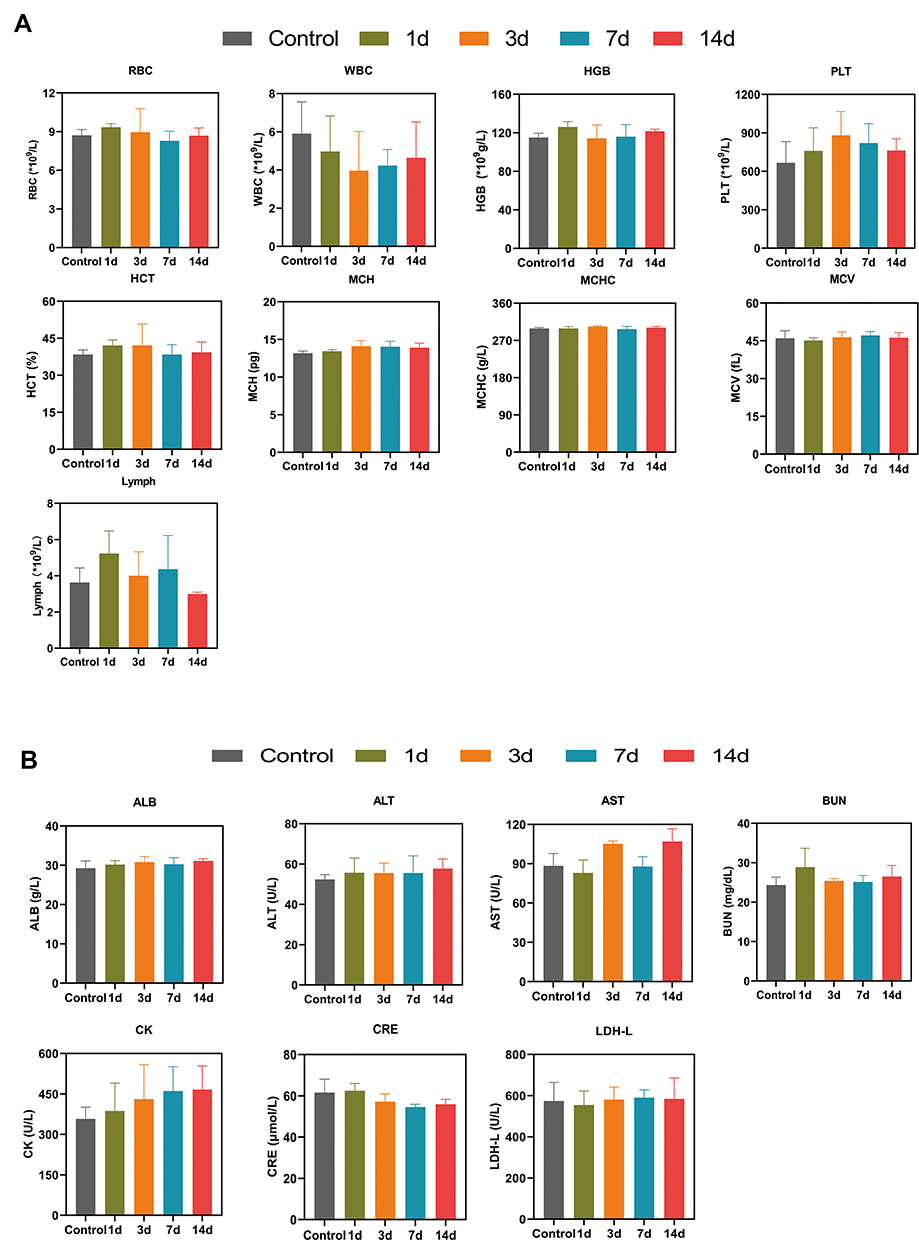 |
Figure 8 (A) Hematological data of the treated-mice at control (pre-injection) and 1, 3, 7, and 14 days after-injection with A-FP NPs via the tail vein, including the RBC, WBC and PLT counts, HGB, MCH, MCV, HCT, MCHC, Lymph level. (B) Blood biochemical analysis of the treated-mice at control (pre-injection) and 1, 3, 7, and 14 days post-injection, including the ALB, ALT, AST, BUN, CK,CRE and LDH-L levels. Abbreviations: WBC, white blood cell; RBC, red blood cell; HGB, hemoglobin; PLT, platelets; HCT, hematocrit; MCH, mean corpuscular hemoglobin; MCHC, mean corpuscular hemoglobin concentration; MCV, erythrocyte mean corpuscular volume; Lymph, lymphocyte; ALB, albumin; AST, aspartate transaminase; ALT, alanine aminotransferase; BUN, blood urea nitrogen; CK, Phosphocreatine kinase; CRE, creatinine; LDH-L, lactate dehydrogenase. |
Biodistribution and Tumor-Targeted of NPs
DiR-labeled FP NPs and A-FP NPs were injected into MCF-7 tumor-bearing mice through the tail vein, and then fluorescence images were captured at different time points. As shown in Figure 9A, 4 hours after the injection of A-FP NPs, the fluorescent signals were detected at tumor sites, and at 6h point, tumor regions exhibited stronger fluorescent signals. However, after the injection of non-targeting FP NPs, the fluorescence signals in the tumor areas were weaker than the former at the same time points, and the time of fluorescence intensity peak was delayed. The non-targeting group had a small amount of uptake. With the active targeting of AS1411, the peak fluorescence intensity of tumor treated with A-FP NPs group reached 7.17 ± 0.47 (a. u.) 6 hours after injection (Figure 9B), while the fluorescence intensity of FP NPs group only 1.89 ± 0.62 (a. u.). Subsequently, in order to determine the biodistribution of NPs in major organs, 24 hours after the injection of NPs, major organs and tumors were collected for in vitro fluorescence imaging (Figure 9C) and the corresponding fluorescence intensities were quantified (Figure 9D). Active targeting effect of A-FP NPs was well proved by in vivo biodistribution experiment, considering the significant statistical difference between the targeting and non-targeting groups. As for the non-targeting group, the fluorescent signals appeared at a relatively late time point, because the NPs in non-targeting group accumulated in tumors on the basis of EPR effect and a large number of NPs were retained in the mononuclear phagocyte system (MPS).12,44,55 In addition, due to the phagocytosis of the reticuloendothelial system (RES), both types of NPs accumulated in the major organs such as liver and spleen and the fluorescent signals in the isolated liver and spleen were observable.55 The metabolism and targeting ability of NPs in vivo could be seen in this experiment and A-FP NPs could reach the tumor tissues in a relatively short time, which laid a good theoretical foundation for the imaging monitoring and selecting the optimal point of time to treat the tumor.
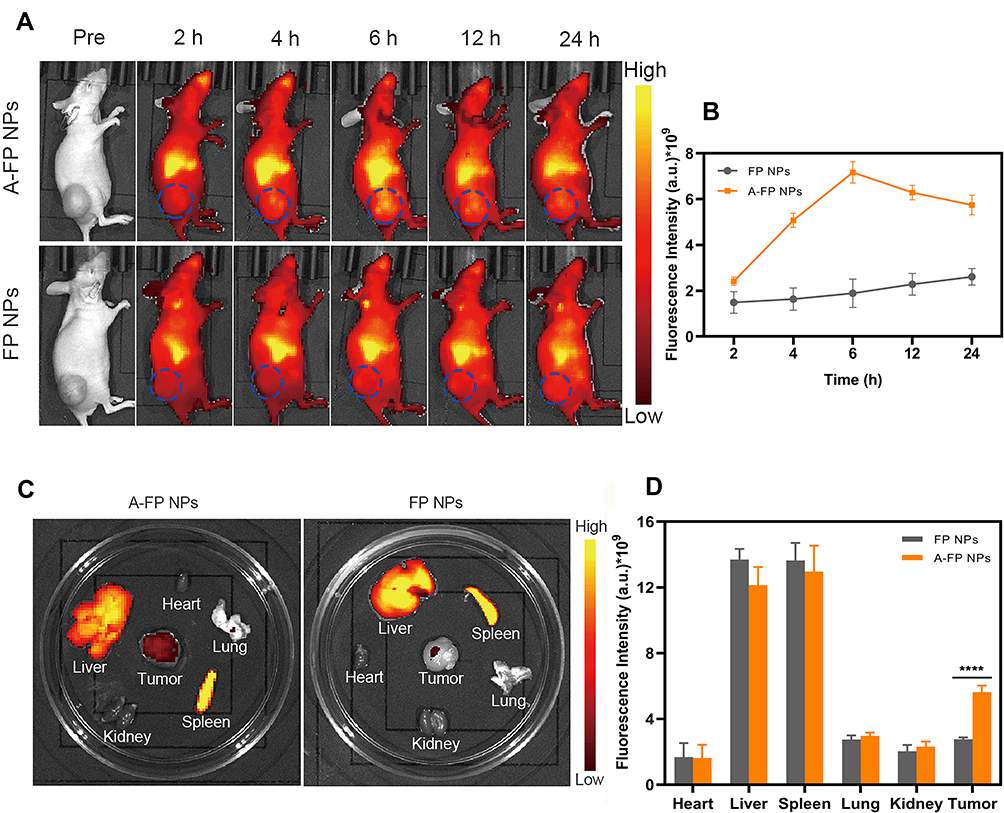 |
Figure 9 The biodistribution of NPs. (A) In vivo FL images after the intravenous injection of NPs (DiR-labeled FP NPs, DiR-labeled A-FP NPs) at different time points. (B) Changes of FL signal intensities within tumor regions at corresponding time points. (C) In vitro FL images of the tumors and major organs dissected from mice 24 h after injection of different NPs. (D) Quantitative biodistribution analysis of different NPs in mice of major organs and tumors. (Values are means ± s.d., n = 5, ****P < 0.0001). Abbreviations: FL, fluorescence; DiR, 1,1ʹ-dioctadecyl-3,3,3ʹ,3ʹtetramethylindotricarbocyanine iodide; A-FP NPs, AS1411-PLGA@FePc@PFP; FP NPs, PLGA@FePc@PFP. |
In vivo PA/US Imaging
Based on the results of previous in vitro experiments, A-FP NPs can be used as a good imaging contrast agent. First, PA imaging and PA value were obtained in vivo pre-injection and at different time points (3 h, 6 h, 12 h, 24 h) after intravenous injection of A-FP NPs or FP NPs (Figure 10A). A corresponding quantitative analysis was performed (Figure 10C). Before injection of the above solution, the tumor showed a weak PA signal, which may be due to endogenous melanin and hemoglobin.56 After injection of A-FP NPs, the PA signal of the targeting group gradually increased, and 6h after injection the signal reached the peak. 24h after injection, the tumor signal intensity decreased slightly, but it was still strong, indicating that NPs could be stable in body for a period of time. Compared with A-FP NPs group, the peak PA signal values of FP NPs based on the EPR effect of NPs were delayed and overall lower than the targeting group.55 These results indicated that A-FP NPs have potential as an ideal target imaging agent for PA imaging and can be used for diagnosis, imaging guidance and monitoring of tumor therapy.
 |
Figure 10 In vivo PA/US imaging. (A) In vivo PA images of tumors in MCF-7 tumor-bearing mice after intravenous injection of different NPs at different time points. (B) US and CEUS images of MCF-7 tumor-bearing mice after intravenous injection with different NPs at 6 h and the whole tumor region irradiation with the 660 nm laser (1.5 W/cm2). (C) Changes of PA-signal intensities within tumor regions at corresponding time points. The gray values in US (D) and CEUS (E) of before and after irradiation. (Values are means ± s.d., n = 5, ****P < 0.0001). Abbreviations: PA, photoacoustic; US, ultrasound; B-mode, brightness modulation; CEUS, contrast enhanced ultrasound; A-FP NPs, AS1411-PLGA@FePc@PFP; FP NPs, PLGA@FePc@PFP. |
In US and CEUS imaging, due to liquid-gas phase change of NPs after ODV, the NPs can hardly penetrate through tumor tissues after laser irradiation because of the vascular embolization.57,58 Therefore, in CEUS imaging, it is not possible to repeatedly observe tumor tissues. Based on the fact that the accumulation peak time point of PA imaging was determined to be at 6 h after injection, 660nm laser (1.50 w/cm2) irradiation was decided to be performed at this time point. The US (B-mode) image presented tumor volume and boundary, and the CEUS mode image showed strongly enhanced contrast of the micro bubbles due to liquid phase gas phase transition of NPs (Figure 10B). Due to the targeting ability of AS1411, the enrichment level of targeting NPs (A-FP NPs) was much higher than that of non-targeting NPs (FP NPs) at the same time, and the gray value of the targeting group US/CEUS images after laser irradiation was greater than that of the non-targeting group (Figure 10D and E), and the difference was statistically significant.
The results of PA and US imaging revealed that NPs in the targeting group reached an enrichment peak at the sixth hour, and the blood circulation time was significantly prolonged based on the advantages of polymer materials. Possible reasons to explain the above phenomenon were that A-FP NPs identified tumors and achieve effective accumulation through synergistic effect of EPR and AS1411 targeted nucleolin. So FP NPs without AS1411 in the not-targeting group solely accumulate through the EPR effect and the accumulation outcome would be significantly impacted.
In summary, the dual-modal imaging fully integrated the advantages of each model and provided more information about tumor morphology, blood supply, and micro environment. Integration of diagnosis and treatment has obvious advantages in the positioning and guidance of PTT treatment and most importantly, imaging in vivo and the former in vivo fluorescence suggested an accurate time window for treatment (6 hours after injection) conducive to attaining an optimal concentration of treatment.
In vivo Photothermal Therapy
Breast cancer is a highly morbid and highly malignant tumor.59 With concern to the considerable in vitro PTT results, anti-tumor treatment was put into practical use in vivo. Motivated by the desirable in vivo targeting ability of the A-FP NPs, the therapeutic efficacy was monitored in MCF-7 tumor-bearing mice. The irradiation (1.5 W/cm2, 10 min) was conducted at 6 h after injection when the accumulation amounts of the NPs peaked out in the tumor regions. In order to monitor the temperature alterations of the tumor during the treatment, the infrared thermal map and temperature of the tumor were documented using an infrared imaging device (Figure 11A). With the enhancement of accumulated NPs in tumors caused by targeting ability, the highest speed and temperature were observed in the group treated with A-FP NPs + Laser. The tumor temperature was as high as 54.4°C (Figure 11B). However, in the non-targeting group, FP NPs combined with laser treatment showed the highest tumor temperature of 45.7°C in this group. The laser-only treatment group increased slightly to 39.9°C due to its energy from light source itself, but the rising temperature was far from effective level. The temperatures of the other two groups (A-FP NPs group and control group) were similar to the body temperature. The subtle decrease might be related to the relative decrease in life activity and metabolism after anesthesia.60 The treatment effect can be seen from Figure 11C, tumors in A-FP NPs combined with laser treatment group (A-FP NPs +Laser) achieved better therapeutic effects after necrosis, scarring and shedding.
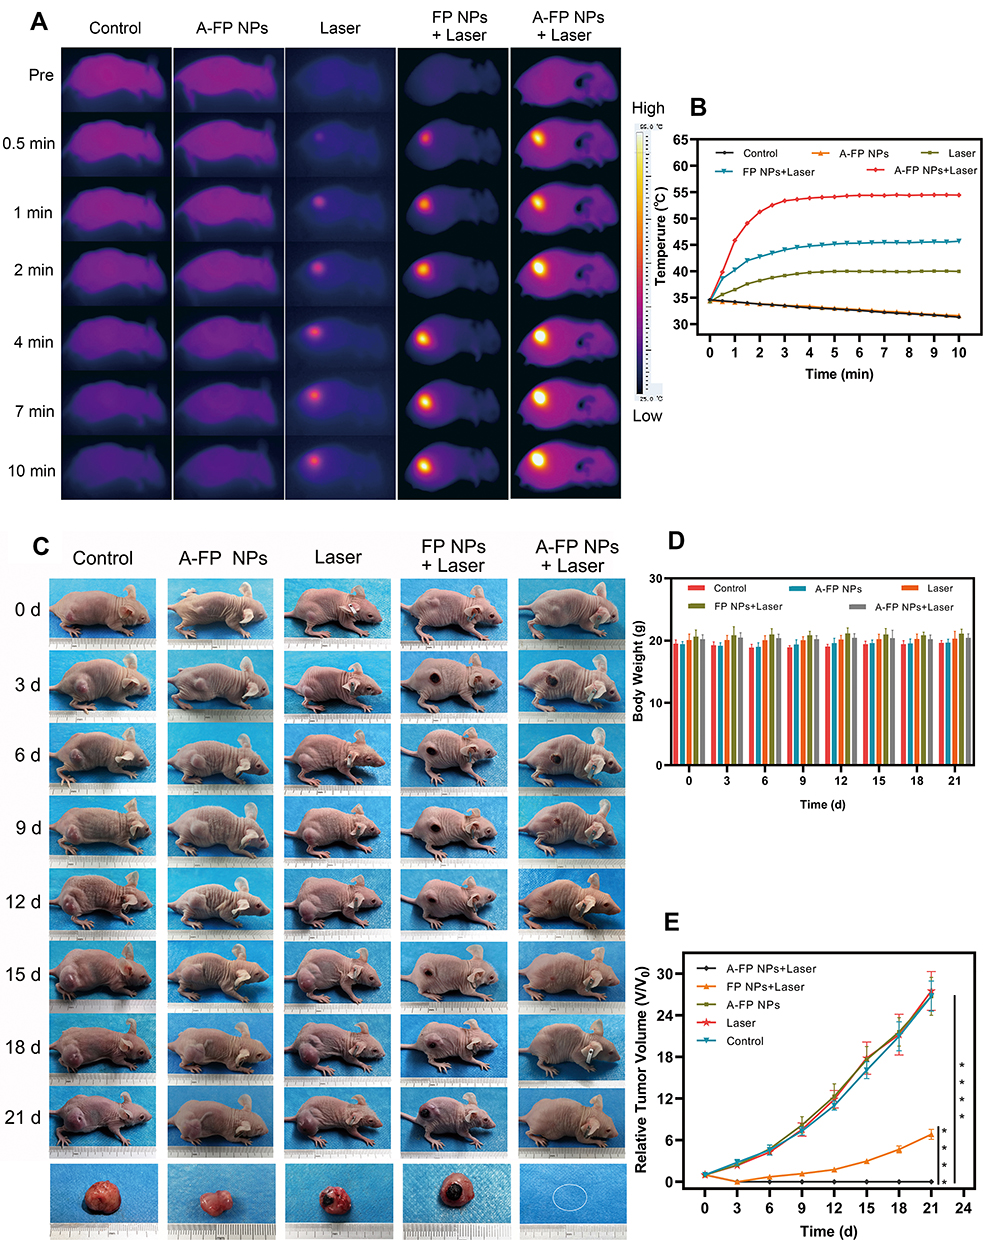 |
Figure 11 In vivo PTT treatment. (A) IR thermal images of MCF-7 tumor-bearing mice with various groups (control, A-FP NPs only, laser only, FP NPs combined with the laser, and A-FP NPs combined with the laser). (B) The temperature time curves of tumor sites in different groups by the thermal imager. (C) Photographs of changes in MCF-7 tumor-bearing mice of different groups were recorded by cameras every three days during the 21 days. (D) The body weight curves of MCF-7 tumor-bearing mice with various treatments during the 21 days. (E) Relative tumor growth curves of five groups after various treatments during the observation period. (Values are means ± s.d., n = 5, ****P < 0.0001). Abbreviations: PTT, photothermal Therapy; A-FP NPs, AS1411-PLGA@FePc@PFP; FP NPs, PLGA@FePc@PFP. |
To further evaluate the PTT effect of A-FP NPs, weight of the mice and size of the tumors were recorded every 3 days after PTT treatment (Figure 11D and E). The A-FP NPs group (A-FP NPs), the control group (Control) and the laser-only group (Laser) all showed no anti-tumor effect. On the contrary, the FP NPs combined with laser treatment group (FP NPs +Laser) and A-FP NPs combined with laser treatment group (A-FP NPs +Laser) showed different levels of inhibition effect. Because of the high-level targeting ability and strong photothermal effect, A-FP NPs combined with laser treatment showed obvious tumor inhibition capability. The tumor site in the A-FP NPs +Laser group was scarred on the third day after treatment and did not recur for 21 days. Contrarily, tumors in the FP NPs +Laser group relapsed after treatment for a period of time. Body weight of every mouse was recorded during the 21-day observation, and no significant differences were observed among the 5 groups of mice.
After 24 hour various treatments, tumor apoptosis and histological evaluation were assessed by HE staining, TUNEL staining, and PCNA staining. And the treatment effect of PTT in tumors was manifested by HSP70 staining (Figure 12). HSP70 is an ATP-dependent molecular chaperone. In general, expression of HSP70 is low in normal tissues, while high expression occurs when cells are exposed to high temperatures.61 HSP70 stain results suggested that A-FP NPs have successfully penetrated into the deep part of tumor tissues and achieved good photothermal conversion and tumor-killing effect under NIR irradiation, which means that PTT could help the treatment of both the surface of tumor and deep infiltration. Compared with the targeting group, the lower proportion of red fluorescence in HSP70 indicated that the treatment effect of non-targeting group was not as strong as the targeting group.
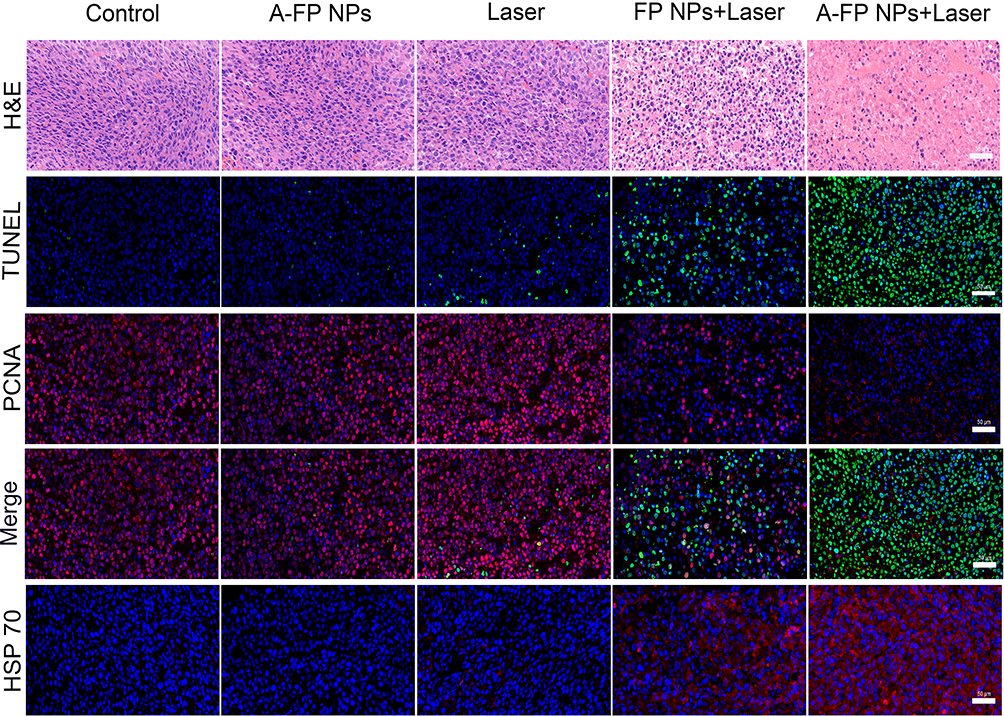 |
Figure 12 HE, TUNEL, PCNA and HSP70 staining of the tumor tissue at 1 day after various treatments. From top to bottom: HE-stained cells, TUNEL-positive cells (green), PCNA-positive cells (red), TUNEL and PCNA merge, HSP70-positive cells (red). The DAPI-labeled nuclei is blue. The scale bars are 50 μm. Abbreviations: HE, hematoxylin and eosin staining; TUNEL, terminal deoxynucleotidyl transferase dUTP nick end labeling; PCNA, proliferating cell nuclear antigen; HSP70, Heat shock 70 kDa protein; DAPI, 4,6-diamidino-2-phenylindole; A-FP NPs, AS1411-PLGA@FePc@PFP; FP NPs, PLGA@FePc@PFP. |
Besides, the HE, TUNEL, and PCNA staining results further confirmed the therapeutic effects of A-FP NPs. The results (Figure 12) showed that the morphology and condition of the control group, A-FP NPs group, and the laser-only group had no significant differences, while FP NPs +Laser group and A-FP NPs +Laser group represented different levels of cell damage. The morphology of cells in the A-FP NPs + Laser group was significantly changed, including karyopyknosis, karyorrhexis, and karyolysis, which indicated that the tumor cells were heavily damaged. PCNA staining (red fluorescence) was applied to determine the proliferative state in vivo. The results were consistent with HE and TUNEL results, indicating that the proliferation index of the treatment group (A-FP NPs + Laser) was significantly decreased. The apoptosis index of the group (A-FP NPs +Laser) was observed by HE and TUNEL staining and further explained different changes in the tumors in each group. In addition, after 24 hour various treatments, HE staining was performed on the main organs, respectively (Figure 13). No obvious lesions and organic injuries were detected in major organs (heart, liver, spleen, lung, kidney), indicating that PTT had no obvious side effects on mice. Overall, the inhibition of cell proliferation with the A-FP NPs + Laser group was the strongest among all groups.
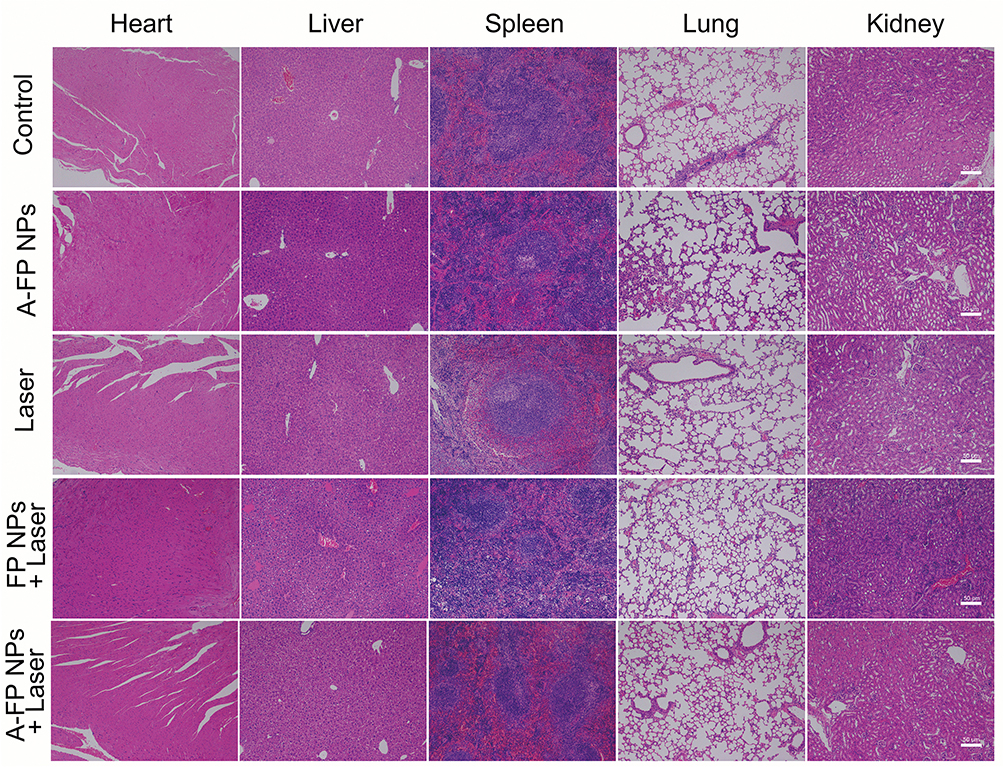 |
Figure 13 HE staining of the major organs (heart, liver, spleen, lung, and kidney) of MCF-7 tumor-bearing mice after different treatments. The scale bars are 50 μm. Abbreviations: HE, hematoxylin and eosin staining; A-FP NPs, AS1411-PLGA@FePc@PFP; FP NPs, PLGA@FePc@PFP. |
Through the treatment, continuous observation on the tumor mice and examination of the representative biological indicators, it was found that A-FP NPs as targeting nanoparticles did have more significant effect than FP NPs in photothermal treatment. The reasons were possibly to be as the following: first, when the tumor tissue temperature is higher than 47°C, hyperthermia can cause irreversible damage to tumor cells. However, NPs in the FP NPs + Laser group accumulation in the tumor site merely relied on the EPR effect and the uptake of NPs was not tumor-specific,25 which resulted in that the NPs enriched in the same time were not as many as the targeting group, after the same conditions of laser irradiation. The temperature did not maintain above 47°C and unable to achieve sustained high temperature damage. Second, hyperthermia (>47°C) killed not only tumor cells directly, but also affected immune responses, leading to heat shock protein (HSP)-induced apoptosis.62 And the HSP70 staining results represented that the red fluorescence distribution of the FP NPs + Laser group was not uniform. It was speculated that the NPs had been unevenly distributed when entering the tumor tissue and led to uneven heating of the tumor tissue, only part of tumor cells on the surface was killed. Whereas cells deep inside were hardly affected, recurrence may occur later.
In general, as a multifunctional theranostic NPs, A-FP NPs were elaborately engineered for targeting property, treatment with PTT and multimodal imaging-guided diagnosis for breast cancer and its multiple advantages have been well verified in experiments. Compared with the previous research of Jia et al in which used HSA to carry FePc for PA imaging and PTT,28 A-FP NPs achieved shorter targeting time and were not limited to a single imaging mode. More importantly, dosage of FePc in A-FP NPs required to cure tumors was obviously smaller than that of HAS-FePc, which plays a vital role in improving the biological safety. In addition, for the current research direction of collaborative treatment with a variety of new materials and methods,63,64 our experimental design was simple but practical, which not only avoids the technical problems of essential consideration of the loading rates of multiple materials, but also is easy to synthesize with remarkable effect.
Conclusion
To sum up, light-responsive multifunctional NPs (A-FP NPs) with good targeting ability were successfully constructed. FePc-loaded NPs are excellent PA contrast agents, as the core of the particle is liquid PFP which can help reach high resolution and deep penetration in US/CEUS imaging. Therefore, A-FP NPs can be used for omnidirectional monitoring of tumors by dual modal imaging, an effective imaging method showing great potential recognition of tumor regions and precise localization as well as guidance of treatment of PTT. FePc itself possesses good light-to-heat conversion ability, and can produce a large amount of thermal energy at a quite low concentration. In addition, APT AS1411’s good targeting property towards human breast cancer MCF-7 cells has been confirmed by in vitro and in vivo experiments. Compared with non-targeting NPs, A-FP NPs accumulated more in human breast cancer tumors, PTT showed significant treatment effect and no significant recurrence and metastasis were observed during the observation period after tumor ablation. More importantly, A-FP NPs have good biocompatibility within the studied concentration ranges, which lays a foundation for clinical transformation. Overall, this study reports not only a novel targeting molecular probe for tumor detection and treatment, but also provides convincing evidence for achieving accurate treatment on breast cancer.
Funding
The authors gratefully acknowledge the financial support from the National natural Science Foundation of China (NSFC) [Grant Nos. 31630026, 81630047, 81873901]; and Basic Research and Frontier Exploration of Chongqing Science and Technology Commission [Grant No.cstc2018jcyjAX0747].
Disclosure
The authors report no conflicts of interest in this work.
References
1. DeSantis CE, Ma J, Gaudet MM, et al. Breast cancer statistics, 2019. CA Cancer J Clin. 2019;69(6):438–51.
2. Siegel RL, Miller KD, Jemal A. Cancer statistics, 2019. CA Cancer J Clin. 2019;69(1):7–34. doi:10.3322/caac.21551
3. Harbeck N, Gnant M. Breast cancer. Lancet. 2017;389(10074):1134–1150. doi:10.1016/S0140-6736(16)31891-8
4. Turner NC, Neven P, Loibl S, Andre F. Advances in the treatment of advanced oestrogen-receptor-positive breast cancer. Lancet. 2017;389(10087):2403–2414. doi:10.1016/S0140-6736(16)32419-9
5. Early Breast Cancer Trialists’ Collaborative Group. Comparisons between different polychemotherapy regimens for early breast cancer: meta-analyses of long-term outcome among 100 000 women in 123 randomised trials. Lancet. 2012;379(9814):432–444. doi:10.1016/S0140-6736(11)61625-5
6. Loibl S, Gianni L. HER2-positive breast cancer. Lancet. 2017;389(10087):2415–2429. doi:10.1016/S0140-6736(16)32417-5
7. Gao D, Guo X, Zhang X, et al. Multifunctional phototheranostic nanomedicine for cancer imaging and treatment. Mater Today Bio. 2020;5:100035. doi:10.1016/j.mtbio.2019.100035
8. Liu JN, Bu W, Shi J. Chemical design and synthesis of functionalized probes for imaging and treating tumor hypoxia. Chem Rev. 2017;117(9):6160–6224. doi:10.1021/acs.chemrev.6b00525
9. Shanmugam V, Selvakumar S, Yeh CS. Near-infrared light-responsive nanomaterials in cancer therapeutics. Chem Soc Rev. 2014;43(17):6254–6287. doi:10.1039/C4CS00011K
10. Younis MR, Wang C, An R, et al. Low power single laser activated synergistic cancer phototherapy using photosensitizer functionalized dual plasmonic photothermal nanoagents. ACS Nano. 2019;13(2):2544–2557. doi:10.1021/acsnano.8b09552
11. Lu GH, Shang WT, Deng H, et al. Targeting carbon nanotubes based on IGF-1R for photothermal therapy of orthotopic pancreatic cancer guided by optical imaging. Biomaterials. 2019;195:13–22. doi:10.1016/j.biomaterials.2018.12.025
12. Wang Q, Sui G, Wu X, et al. A sequential targeting nanoplatform for anaplastic thyroid carcinoma theranostics. Acta Biomater. 2020;102:367–383. doi:10.1016/j.actbio.2019.11.043
13. Yoon HJ, Lee HS, Lim JY, Park JH. Liposomal indocyanine green for enhanced photothermal therapy. ACS Appl Mater Interfaces. 2017;9(7):5683–5691. doi:10.1021/acsami.6b16801
14. Jung HS, Verwilst P, Sharma A, Shin J, Sessler JL, Kim JS. Organic molecule-based photothermal agents: an expanding photothermal therapy universe. Chem Soc Rev. 2018;47(7):2280–2297. doi:10.1039/C7CS00522A
15. Xue X, Lindstrom A, Li Y. Porphyrin-based nanomedicines for cancer treatment. Bioconjug Chem. 2019;30(6):1585–1603. doi:10.1021/acs.bioconjchem.9b00231
16. Lovell JF, Jin CS, Huynh E, et al. Porphysome nanovesicles generated by porphyrin bilayers for use as multimodal biophotonic contrast agents. Nat Mater. 2011;10(4):324–332. doi:10.1038/nmat2986
17. Jin CS, Lovell JF, Zheng G. One minute, sub-one-watt photothermal tumor ablation using porphysomes, intrinsic multifunctional nanovesicles. J Vis Exp. 2013;(79):e50536.
18. Singh S, Aggarwal A, Bhupathiraju NV, Arianna G, Tiwari K, Drain CM. Glycosylated porphyrins, phthalocyanines, and other porphyrinoids for diagnostics and therapeutics. Chem Rev. 2015;115(18):10261–10306. doi:10.1021/acs.chemrev.5b00244
19. Han X, Han Z, Li J, Zhao J, Zhao X. Coordinative integration of copper (II) and iron (II) phthalocyanine into amidoximated PAN fiber for enhanced photocatalytic activity under visible light irradiation. J Colloid Interface Sci. 2019;533:333–343. doi:10.1016/j.jcis.2018.08.076
20. Jin HG, Zhong W, Yin S, et al. Lesson from nature: biomimetic self-assembling phthalocyanines for high-efficient photothermal therapy within the biological transparent window. ACS Appl Mater Interfaces. 2019;11(4):3800–3808. doi:10.1021/acsami.8b21299
21. Abdel Fadeel D, Al-Toukhy GM, Elsharif AM, Al-Jameel SS, Mohamed HH, Youssef TE. Improved photodynamic efficacy of thiophenyl sulfonated zinc phthalocyanine loaded in lipid nano-carriers for hepatocellular carcinoma cancer cells. Photodiagnosis Photodyn Ther. 2018;23:25–31. doi:10.1016/j.pdpdt.2018.06.003
22. Danhier F, Ansorena E, Silva JM, Coco R, Le Breton A, Preat V. PLGA-based nanoparticles: an overview of biomedical applications. J Control Release. 2012;161(2):505–522. doi:10.1016/j.jconrel.2012.01.043
23. Khan I, Gothwal A, Sharma AK, et al. PLGA nanoparticles and their versatile role in anticancer drug delivery. Crit Rev Ther Drug Carrier Syst. 2016;33(2):159–193. doi:10.1615/CritRevTherDrugCarrierSyst.2016015273
24. Sykes EA, Dai Q, Sarsons CD, et al. Tailoring nanoparticle designs to target cancer based on tumor pathophysiology. Proc Natl Acad Sci U S A. 2016;113(9):E1142–1151. doi:10.1073/pnas.1521265113
25. Lammers T, Kiessling F, Ashford M, Hennink W, Crommelin D, Storm G. Cancer nanomedicine: is targeting our target? Nat Rev Mater. 2016;1(9):1–2.
26. Danhier F. To exploit the tumor microenvironment: since the EPR effect fails in the clinic, what is the future of nanomedicine? J Control Release. 2016;244(Pt A):108–121. doi:10.1016/j.jconrel.2016.11.015
27. Fang J, Nakamura H, Maeda H. The EPR effect: unique features of tumor blood vessels for drug delivery, factors involved, and limitations and augmentation of the effect. Adv Drug Deliv Rev. 2011;63(3):136–151. doi:10.1016/j.addr.2010.04.009
28. Jia Q, Ge J, Liu W, et al. Biocompatible iron phthalocyanine-albumin assemblies as photoacoustic and thermal theranostics in living mice. ACS Appl Mater Interfaces. 2017;9(25):21124–21132. doi:10.1021/acsami.7b04360
29. Li X, Yu Y, Ji Q, Qiu L. Targeted delivery of anticancer drugs by aptamer AS1411 mediated pluronic F127/cyclodextrin-linked polymer composite micelles. Nanomedicine. 2015;11(1):175–184. doi:10.1016/j.nano.2014.08.013
30. Bates PJ, Laber DA, Miller DM, Thomas SD, Trent JO. Discovery and development of the G-rich oligonucleotide AS1411 as a novel treatment for cancer. Exp Mol Pathol. 2009;86(3):151–164. doi:10.1016/j.yexmp.2009.01.004
31. Zeng X, Luo M, Liu G, et al. Polydopamine-modified black phosphorous nanocapsule with enhanced stability and photothermal performance for tumor multimodal treatments. Adv Sci (Weinh). 2018;5(10):1800510. doi:10.1002/advs.201800510
32. Tao W, Zeng X, Wu J, et al. Polydopamine-based surface modification of novel nanoparticle-aptamer bioconjugates for in vivo breast cancer targeting and enhanced therapeutic effects. Theranostics. 2016;6(4):470–484. doi:10.7150/thno.14184
33. Liu G, Gao N, Zhou Y, et al. Polydopamine-based “four-in-one” versatile nanoplatforms for targeted dual chemo and photothermal synergistic cancer therapy. Pharmaceutics. 2019;11(10):507. doi:10.3390/pharmaceutics11100507
34. Bahreyni A, Ramezani M, Alibolandi M, Hassanzadeh P, Abnous K, Taghdisi SM. High affinity of AS1411 toward copper; its application in a sensitive aptasensor for copper detection. Anal Biochem. 2019;575:1–9. doi:10.1016/j.ab.2019.03.016
35. Bates PJ, Reyes-Reyes EM, Malik MT, et al. G-quadruplex oligonucleotide AS1411 as a cancer-targeting agent: Uses and mechanisms.Biochim Biophys Acta Gen Subj. 2017;1861(5 Pt B):1414-1428. doi:10.1016/j.bbagen.2016.12.015.
36. Taki S, Ardestani MS. Novel nanosized AS1411-chitosan-BODIPY conjugate for molecular fluorescent imaging. Int J Nanomedicine. 2019;14:3543-3555. doi:10.2147/IJN.S202561.
37. Saneja A, Kumar R, Arora D, Kumar S, Panda AK, Jaglan S. Recent advances in near-infrared light-responsive nanocarriers for cancer therapy. Drug Discov Today. 2018;23(5):1115–1125. doi:10.1016/j.drudis.2018.02.005
38. Wang Y, Yang T, Ke H, et al. Smart albumin-biomineralized nanocomposites for multimodal imaging and photothermal tumor ablation. Adv Mater. 2015;27(26):3874–3882. doi:10.1002/adma.201500229
39. Chen Q, Wen J, Li H, Xu Y, Liu F, Sun S. Recent advances in different modal imaging-guided photothermal therapy. Biomaterials. 2016;106:144–166. doi:10.1016/j.biomaterials.2016.08.022
40. Sheng D, Liu T, Deng L, et al. Perfluorooctyl bromide & indocyanine green co-loaded nanoliposomes for enhanced multimodal imaging-guided phototherapy. Biomaterials. 2018;165:1–13. doi:10.1016/j.biomaterials.2018.02.041
41. Zhang L, Wang D, Yang K, et al. Mitochondria-targeted artificial “nano-RBCs” for amplified synergistic cancer phototherapy by a single NIR irradiation. Adv Sci (Weinh). 2018;5(8):1800049. doi:10.1002/advs.201800049
42. Wu M, Wang Y, Wang Y, et al. Paclitaxel-loaded and A10-3.2 aptamer-targeted poly(lactide-co-glycolic acid) nanobubbles for ultrasound imaging and therapy of prostate cancer. Int J Nanomedicine. 2017;12:5313–5330. doi:10.2147/IJN.S136032
43. Wang Z, Ding J, Luo S, Wang P, Liang Q. Development and evaluation of ultrasound contrast agents with AS1411-conjugated nanoparticles with liquid core. Zhong Nan Da Xue Xue Bao Yi Xue Ban. 2018;43(6):610–618. doi:10.11817/j.issn.1672-7347.2018.06.006
44. Liu M, Zhang P, Deng L, et al. IR780-based light-responsive nanocomplexes combining phase transition for enhancing multimodal imaging-guided photothermal therapy. Biomater Sci. 2019;7(3):1132–1146. doi:10.1039/C8BM01524D
45. McCall RL, Sirianni RW. PLGA nanoparticles formed by single- or double-emulsion with vitamin E-TPGS. J Vis Exp. 2013;(82):51015.
46. Budhian A, Siegel SJ, Winey KI. Haloperidol-loaded PLGA nanoparticles: systematic study of particle size and drug content. Int J Pharm. 2007;336(2):367–375. doi:10.1016/j.ijpharm.2006.11.061
47. Zhang L, Sheng D, Wang D, et al. Bioinspired multifunctional melanin-based nanoliposome for photoacoustic/magnetic resonance imaging-guided efficient photothermal ablation of cancer. Theranostics. 2018;8(6):1591–1606. doi:10.7150/thno.22430
48. Ramacharyulu PV, Muhammad R, Praveen Kumar J, Prasad GK, Mohanty P. Iron phthalocyanine modified mesoporous titania nanoparticles for photocatalytic activity and CO2 capture applications. Phys Chem Chem Phys. 2015;17(39):26456–26462. doi:10.1039/C5CP03576G
49. Chen Q, Yu J, Kim K. Review: optically-triggered phase-transition droplets for photoacoustic imaging. Biomed Eng Lett. 2018;8(2):223–229. doi:10.1007/s13534-018-0069-0
50. Han Z, Han X, Zhao X, Yu J, Xu H. Iron phthalocyanine supported on amidoximated PAN fiber as effective catalyst for controllable hydrogen peroxide activation in oxidizing organic dyes. J Hazard Mater. 2016;320:27–35. doi:10.1016/j.jhazmat.2016.08.004
51. Liu X, Huang N, Li H, Jin Q, Ji J. Surface and size effects on cell interaction of gold nanoparticles with both phagocytic and nonphagocytic cells. Langmuir. 2013;29(29):9138–9148. doi:10.1021/la401556k
52. Zavvar T, Babaei M, Abnous K, et al. Synthesis of multimodal polymersomes for targeted drug delivery and MR/fluorescence imaging in metastatic breast cancer model. Int J Pharm. 2020;578:119091. doi:10.1016/j.ijpharm.2020.119091
53. Zhao J, Liu P, Ma J, et al. Enhancement of radiosensitization by silver nanoparticles functionalized with polyethylene glycol and aptamer as1411 for glioma irradiation therapy. Int J Nanomedicine. 2019;14:9483–9496. doi:10.2147/IJN.S224160
54. Song X, Feng L, Liang C, Yang K, Liu Z. Ultrasound triggered tumor oxygenation with oxygen-shuttle nanoperfluorocarbon to overcome hypoxia-associated resistance in cancer therapies. Nano Lett. 2016;16(10):6145–6153. doi:10.1021/acs.nanolett.6b02365
55. Yang B, Han X, Ji B, Lu R. Competition between tumor and mononuclear phagocyte system causing the low tumor distribution of nanoparticles and strategies to improve tumor accumulation. Curr Drug Deliv. 2016;13(8):1261–1274. doi:10.2174/1567201813666160418105703
56. Weber J, Beard PC, Bohndiek SE. Contrast agents for molecular photoacoustic imaging. Nat Methods. 2016;13(8):639–650. doi:10.1038/nmeth.3929
57. Prabhakar U, Maeda H, Jain RK, et al. Challenges and key considerations of the enhanced permeability and retention effect for nanomedicine drug delivery in oncology. Cancer Res. 2013;73(8):2412–2417. doi:10.1158/0008-5472.CAN-12-4561
58. Maeda H. Toward a full understanding of the EPR effect in primary and metastatic tumors as well as issues related to its heterogeneity. Adv Drug Deliv Rev. 2015;91:3–6. doi:10.1016/j.addr.2015.01.002
59. Solanki M, Visscher D. Pathology of breast cancer in the last half century. Hum Pathol. 2019;95:137–48.
60. Sano Y, Ito S, Yoneda M, et al. Effects of various types of anesthesia on hemodynamics, cardiac function, and glucose and lipid metabolism in rats. Am J Physiol Heart Circ Physiol. 2016;311(6):H1360–H1366. doi:10.1152/ajpheart.00181.2016
61. Shao L, Li Q, Zhao C, et al. Auto-fluorescent polymer nanotheranostics for self-monitoring of cancer therapy via triple-collaborative strategy. Biomaterials. 2019;194:105–116. doi:10.1016/j.biomaterials.2018.12.021
62. Ghaffari H, Beik J, Talebi A, Mahdavi SR, Abdollahi H. New physical approaches to treat cancer stem cells: a review. Clin Transl Oncol. 2018;20(12):1502–1521. doi:10.1007/s12094-018-1896-2
63. Alves CG, de Melo-diogo D, Lima-Sousa R, Correia IJ. IR780 loaded sulfobetaine methacrylate-functionalized albumin nanoparticles aimed for enhanced breast cancer phototherapy. Int J Pharm. 2020;582:119346. doi:10.1016/j.ijpharm.2020.119346
64. Jiang Q, Wang K, Zhang X, et al. Platelet membrane-camouflaged magnetic nanoparticles for ferroptosis-enhanced cancer immunotherapy. Small. 2020;16(22):e2001704. doi:10.1002/smll.202001704
 © 2020 The Author(s). This work is published and licensed by Dove Medical Press Limited. The full terms of this license are available at https://www.dovepress.com/terms.php and incorporate the Creative Commons Attribution - Non Commercial (unported, v3.0) License.
By accessing the work you hereby accept the Terms. Non-commercial uses of the work are permitted without any further permission from Dove Medical Press Limited, provided the work is properly attributed. For permission for commercial use of this work, please see paragraphs 4.2 and 5 of our Terms.
© 2020 The Author(s). This work is published and licensed by Dove Medical Press Limited. The full terms of this license are available at https://www.dovepress.com/terms.php and incorporate the Creative Commons Attribution - Non Commercial (unported, v3.0) License.
By accessing the work you hereby accept the Terms. Non-commercial uses of the work are permitted without any further permission from Dove Medical Press Limited, provided the work is properly attributed. For permission for commercial use of this work, please see paragraphs 4.2 and 5 of our Terms.