")
Back to Journals » International Journal of Nanomedicine » Volume 12
Iron oxide magnetic nanoparticles combined with actein suppress non-small-cell lung cancer growth in a p53-dependent manner
Authors Wang MS, Chen L, Xiong YQ, Xu J, Wang JP, Meng ZL
Received 13 November 2016
Accepted for publication 1 March 2017
Published 17 October 2017 Volume 2017:12 Pages 7627—7651
DOI https://doi.org/10.2147/IJN.S127549
Checked for plagiarism Yes
Review by Single anonymous peer review
Peer reviewer comments 4
Editor who approved publication: Dr Linlin Sun
Ming-Shan Wang,1 Liang Chen,2 Ya-Qiong Xiong,2 Jing Xu,2 Ji-Peng Wang,2 Zi-Li Meng2
1Department of Oncology, Huaiyin Hospital of Huai’an City, Huai’an, China; 2Department of Respiration, Huai’an First People’s Hospital, Nanjing Medical University, Huai’an, China
Abstract: Actein (AT) is a triterpene glycoside isolated from the rhizomes of Cimicifuga foetida that has been investigated for its antitumor effects. AT treatment leads to apoptosis in various cell types, including breast cancer cells, by regulating different signaling pathways. Iron oxide (Fe3O4) magnetic nanoparticles (MNPs) are nanomaterials with biocompatible activity and low toxicity. In the present study, the possible benefits of AT in combination with MNPs on non-small-cell lung cancer (NSCLC) were explored in in vitro and in vivo studies. AT-MNP treatment contributed to apoptosis in NSCLC cells, as evidenced by activation of the caspase 3-signaling pathway, which was accompanied by downregulation of the antiapoptotic proteins Bcl2 and BclXL, and upregulation of the proapoptotic signals Bax and Bad. The death receptors of TRAIL were also elevated following AT-MNP treatment in a p53-dependent manner. Furthermore, a mouse xenograft model in vivo revealed that AT-MNP treatment exhibited no toxicity and suppressed NSCLC growth compared to either AT or MNP monotherapies. In conclusion, this study suggests a novel therapy to induce apoptosis in suppressing NSCLC growth in a p53-dependent manner by combining AT with Fe3O4 MNPs.
Keywords: actein, Fe3O4 magnetic nanoparticles, NSCLC, apoptosis, p53
Introduction
Lung cancer is the most common malignancy worldwide, according to the mortality database from the World Health Organization.1,2 Non-small-cell lung cancer (NSCLC) accounts for about 80% of all lung cancer diseases.3 In recent decades, though diagnosis and therapeutic strategies have advanced, the prognosis of NSLC remains poor, due to high recurrence.4,5 Therefore, finding effective therapies is necessary to ameliorate the incidence of NSCLC in humans worldwide.
Actein (AT) is a tetracyclic triterpenoid compound isolated from the rhizome of Cimicifuga foetida (Figure 1A).6 Cimicifuga spp. have been used for many decades in North America to treat diarrhea, rheumatism, and sore throat.7,8 In China, related Cimicifuga spp. have been widely used in traditional medicine to prevent infectious diseases.9 Recent studies have focused on the role of Cimicifuga spp. in female conditions, especially menopause.10 Studies have reported that extracts from Cimicifuga spp. showed an inhibitory role in breast cancer growth through cell proliferation suppression via cycle arrest modulation.11 AT is reported as the most potent component of Cimicifuga and has been found to reduce the levels of cyclin D1, CDK4, and the phosphorylated form of retinoblastoma, while enhancing the CDK-inhibitory protein p21 in breast cancer cells, thus inhibiting cell proliferation.12 In addition, AT can mediate p53 signal, and alter fatty acid expression levels and cholesterol biosynthetic genes.13,14 Therefore, AT has the potential benefit of treating various diseases, especially in cancers. However, the role of AT in tumor growth, especially lung cancer, remains unknown. We explored the potential role of AT as an effective and safe therapeutic strategy to inhibit NSCLC progression in vitro and in vivo.
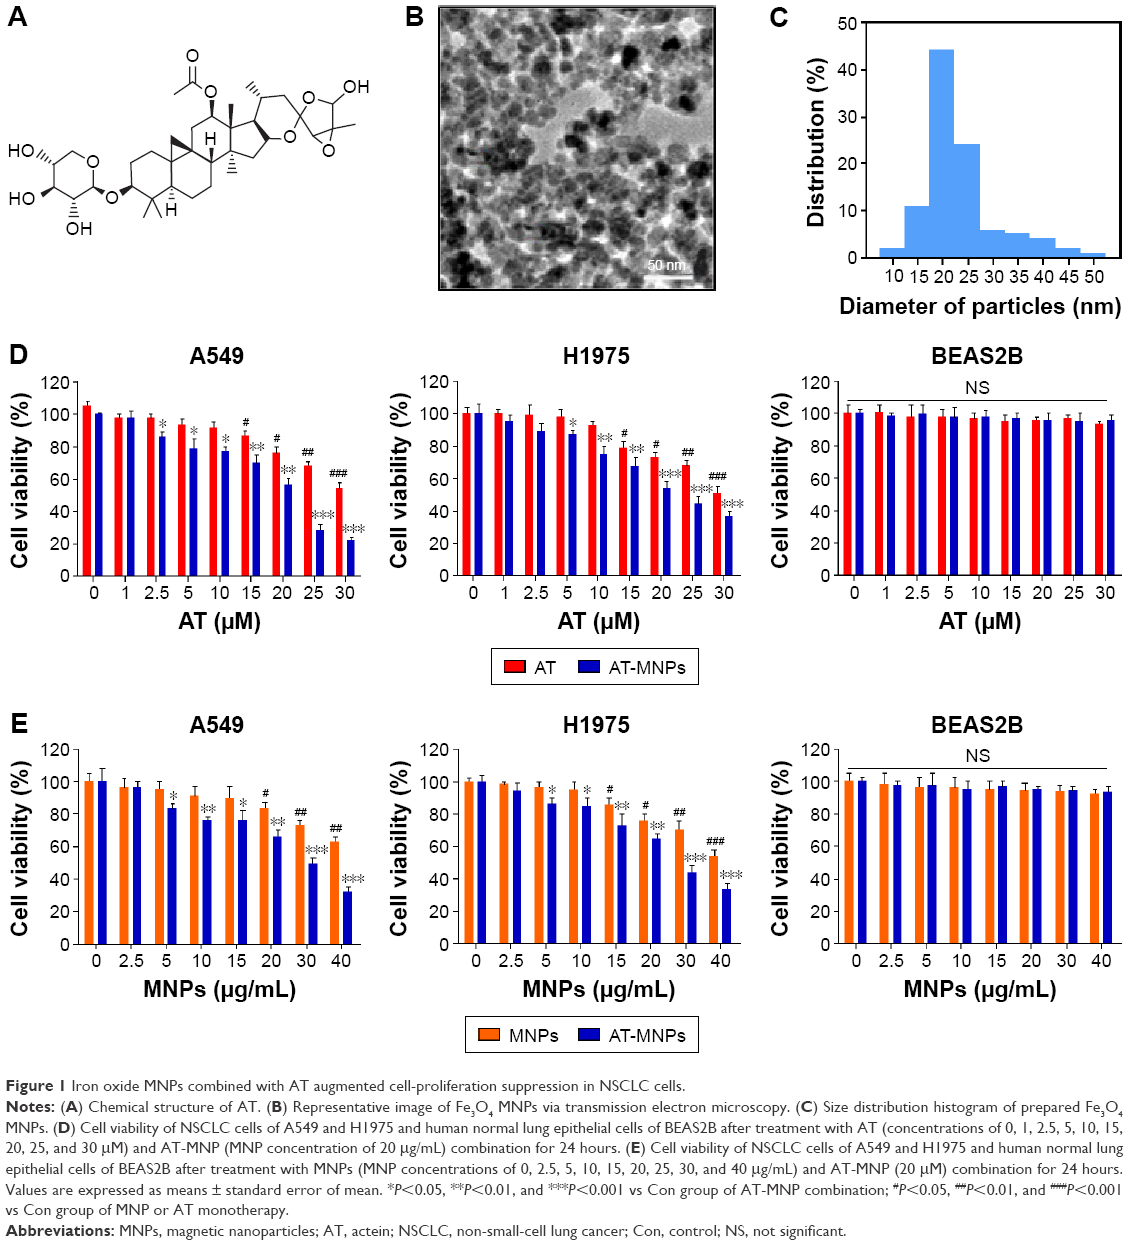 | Figure 1 Iron oxide MNPs combined with AT augmented cell-proliferation suppression in NSCLC cells. |
Iron oxide (Fe3O4) magnetic nanoparticles (MNPs) are biocompatible nanomaterials with low cytotoxicity.15 Until now, MNPs have been widely employed as carriers of targeted drugs for their positioning properties and sustained release function.16 Previous studies have illustrated that MNPs in combination with other drugs show an antitumor role in various tumors, including liver cancer, lung cancer, and breast cancer, suggesting that complex MNPs with other anticancer agents may be an effective therapy for tumor prevention and treatment.17–19 Furthermore, as a triterpene glycoside with various biological effects, AT has been investigated and evidenced in many disease models. However, due to its bioavailability limitation, maximization or enhancement of the biological activity of AT has not been realized yet. Although a previous study reported that NP liposomes increased the growth inhibitory activity of AT to suppress human breast cancer cell progression, further studies are still required.20 To overcome this hurdle, in this study we aimed at evaluating the potential benefit of combination therapy of AT and MNPs for NSCLC, and assess whether MNPs could promote AT-induced apoptosis. The possible molecular mechanism by which the combination therapy performs its role in regulating NSCLC was also investigated. To the best of our knowledge, this is the first report that has employed AT combined with MNPs to treat NSCLC in vitro and in vivo.
Materials and methods
MNP preparation
Fe3O4 MNPs were synthesized through electrochemical deposition under oxidizing conditions. MNPs were compounded and then characterized by the Key Laboratory of Bioelectronics of Southeast University (Nanjing, China). Before use, the MNPs were dissolved in Roswell Park Memorial Institute (RPMI) 1640 medium or Dulbecco’s Modified Eagle’s Medium (DMEM) containing 10% fetal bovine serum (FBS; Thermo Fisher Scientific, Waltham, MA, USA) using ultrasound to obtain a colloidal suspension of Fe3O4 MNPs.21
Cells and culture
Human lung cancer cell lines A549 and H1975, human normal lung epithelial cells (BEAS2B), mouse normal liver cells (AML12), and rat normal liver cells (BRL3A) were purchased from the American Type Culture Collection (Manassas, VA, USA). Human normal liver cells (L02) were purchased from KeyGen Biotech (Nanjing, China). A549 and L02 cells were routinely cultured in RPMI 1640 medium containing 10% FBS and 1% penicillin–streptomycin. The NSCLC H1975 cell line was maintained in RPMI 1640 with L-glutamine containing 10% FBS, 100 U/mL penicillin, and 100 μg/mL streptomycin. AML12, BEAS2B, and BRL3A were cultured in DMEM supplemented with 10% FBS, 100 U/mL penicillin, and 100 μg/mL streptomycin. All cells were cultured in a humidified atmosphere with 5% CO2 and 95% humidity at 37°C in an incubator. AT (>98% purity), purchased from Dayang Chem (Hangzhou, China), used in the treatment of lung cancer, was dissolved in dimethyl sulfoxide (DMSO) and stored at −20°C, and then diluted in DMEM or RPMI 1640 medium for experimental treatment. The final DMSO concentration was no more than 0.1% (v/v) in every treatment. AT conjugated with Fe3O4 MNPs was prepared by mechanical absorption polymerization, as previously reported.22 Before use, the MNPs were well dispersed in RPMI 1640 medium containing 10% (v/v) heat-inactivated FBS using ultrasound to obtain a colloidal suspension. Next, 25 μg/mL MNPs were added under mechanical stirring to a final volume of 200 μL containing a certain concentration of AT. The time taken to polymerize AT-MNPs at 4°C was 24 hours. Briefly, different concentrations of MNPs were added under mechanical stirring to 200 μL of an aqueous medium with a set concentration of AT for the final suspension (pH 7.4). At 4°C, the overall polymerization process lasted for 24 hours.
Cell viability analysis
In order to calculate the growth inhibitory role of AT, MNPs, and the combination thereof in different cell lines, about 103 cells/well were planted in 96-well plates (Corning Incorporated, Corning, NY, USA) with complete growth medium. On the following day, the cells were administered at different concentrations of AT (0–30 μM) in the presence or absence of Fe3O4 MNPs (0–40 μg/mL) and incubated at 37°C for 24 hours.23,24 Then, cell viability was determined with an MTT assay at 570 nm.25
Colony formation analysis
To explore cell proliferation, approximately 65% NSCLC cells were treated with concentrations of AT and MNPs for 24 hours in growth medium. The cells were then harvested in a separate tube after incubation. From each tube, about 600 cells per well were cultured in a six-well plate separately with complete growth medium and allowed to grow for 14 days. A week later, the medium was replaced. During 14 days’ incubation, the cells were washed with phosphate-buffered saline (PBS; HyClone; GE Healthcare, Little Chalfont, UK) once. Then, chilled methanol was used to fix the cells for 15 minutes. Cells were stained with 0.5% crystal violet solution in 25% methanol for 5 minutes at room temperature. The cells were washed with water three times and air dried for counting with inverted microscopy.
Lung cancer cell migration
Cells (105/well) were planted in the top chamber of a 24-well transwell micropore polycarbonate membrane filter with a pore size of 8 μm (EMD Millipore, Billerica, MA, USA). Then, cells were suspended in medium free of serum followed by AT and MNP treatment under different conditions. At 48 hours after this, the cells on the top surface of the membrane were removed carefully by cotton swab. Finally, the migrated cells were counted in five random fields for each treatment.
Scratch wound healing assays
The NSCLC cells were seeded and grown on a six-well plate overnight. The monolayers of cancer cells were wounded through a pipette tip. Cells were then washed with PBS to remove cellular debris and allowed to migrate for 24 hours. Representative images were taken at 0 and 24 hours after the wound with inverted microscopy.
Flow cytometry assays
An annexin V–fluorescein isothiocyanate–propidium iodide apoptosis detection kit was obtained from KeyGen to determine cell apoptosis. Lung cancer cells after different treatments were harvested and washed with chilled PBS twice, then incubated in a darkroom with annexin V–fluorescein isothiocyanate and propidium iodide for 15 minutes. Subsequently, the cells were analyzed with flow cytometry (BD Biosciences, San Jose, CA, USA).
DNA staining
Hoechst 33258 (Yeasen Biotechnology, Shanghai, China) for DAPI staining was used for morphological calculation of nuclei. NSCLC cells were incubated with AT, MNPs, and combinations thereof for 24 hours. A549 and H1975 cells were washed with ice-cold PBS three times in a six-well plate and then stained with 0.5 mL Hoechst 33258 solution for 5 minutes at 37°C in a darkroom. Then, the cells were washed with chilled PBS three times in the plate. The cells were observed with inverted fluorescence microscopy (Olympus, Tokyo, Japan).
Caspase activity determination
Colorimetric activity assay kits (Clontech Laboratories, Mountain View, CA, USA) were used to determine caspase 3 and caspase 9 activities. The analysis focuses on cleavage of the chromogenic substrates DEVD-pNA and LEHD-pNA through caspase 3 and caspase 9, respectively. NSCLC cells were suspended in chilled lysis buffer for 10 minutes and centrifuged at 10,000g for 5 minutes. Caspase substrate solution with specific peptide substrate was then added to the supernatant and cultured at 37°C for 2 hours before enzyme-linked immunosorbent assay at 405 nm.
Western blot analysis
Western blot analysis was performed as previously described.26 Briefly, after treatment under different conditions, cells were harvested and the medium removed. Then, the cells were washed with chilled PBS three times and lysed in ice-cold lysis buffer in the presence of fresh protease inhibitor cocktail. Frozen lung tumor tissue samples were obtained from xenograft nude mice after treatment. About 100 mg tumor tissue sample was lysed with 1 mL lysis buffer. The cell lysates were centrifuged at 15,000g for 15 minutes at 4°C to collect the supernatant bicinchoninic acid protein assay kit was used to detect protein concentrations following the manufacturer’s instructions (Thermo Fisher Scientific). Protein extracts (40 ng) were separated by 10% sodium dodecyl sulfate polyacrylamide gel electrophoresis and then transferred to polyvinylidene fluoride (PVDF) membranes (EMD Millipore). PVDF membranes with proteins were blocked with 5% skim-fat dry milk in 0.1% Tween 20 in Tris-buffered saline for 2 hours to block the aspecific sites on blots. The primary antibodies dissolved in blocking buffer were used to detect the target protein blots at 4°C overnight for incubation. The bands on PVDF were covered by chemiluminescence with Pierce electrochemiluminescence Western blotting substrate reagents (Thermo Fisher Scientific). All experiments were performed in triplicate. The primary antibodies used in our study are listed in Table 1.
 | Table 1 Primary antibodies for Western blot analysis |
Real-time quantitative polymerase chain reaction (PCR) analysis
Total RNA from cells and tumor tissue samples was extracted by Trizol reagent (Thermo Fisher Scientific) following the manufacturer’s instructions.26 Then, it was quantified and subjected to reverse transcription to prepare complementary DNA (cDNA) with a RevertAid first-strand cDNA synthesis kit (Thermo Fisher Scientific). PCR was performed on a CFX96 real-time system (Bio-Rad Laboratories, Hercules, CA, USA). The primers were commercially synthesized, and the sequences are listed in Table 2. Fold changes in messenger RNA (mRNA) levels of target genes relative to the endogenous cyclophilin control were calculated. Briefly, the cycle threshold (Ct) values of each target gene were subtracted from the Ct values of the housekeeping gene cyclophilin (ΔCt). Target gene ΔΔCt was calculated as the ΔCt of the target gene minus the ΔCt of control. The fold change in mRNA expression was calculated as 2−ΔΔCt.
 | Table 2 Primer sequences of RT-PCR test |
Athymic nude model experiment
Forty male athymic nude mice 6–8 weeks old were purchased from Shanghai Experimental Animal Center (Shanghai, China) and kept in a temperature- and humidity-controlled environment (25°C±2°C, 50%±10% humidity) with a standard 12-hour light–dark cycle with food and water in cages under germ-free conditions. The animals received human care following Chinese legal requirements. All procedures were in accordance with the regulations of experimental animal administration issued by the Ministry of Science and Technology of China (http://www.most.gov.cn). The Institutional Animal Care and Use Committee at Huai’an First People’s Hospital, Nanjing Medical University, approved the animal study protocols. Briefly, 5×10⁵ A549 and H1975 cells were subcutaneously injected into the dorsal flanks of nude mice. Tumor volume was measured by calculating the two maximum perpendicular tumor diameters every 2 days. All tumor-bearing nude mice were randomly divided into four groups: 1) control, 2) AT (15 mg/kg), 3) Fe3O4 MNPs (20 mg/kg), and 4) AT-MNPs every day for 35 days.23,27 AT was dissolved in DMSO and then diluted in distilled water. The mice were administered AT orally. The control group was given DMSO diluted in water (0.5% v/v). Body weight and tumor size were measured three times a week. Tumor volume was evaluated by the formula 0.5× (L1 × L2 × H), with L1 being the long diameter, L2 the short diameter, and H the height of the tumor. At the end of our study, the mice were killed. Livers and tumor tissue samples were removed for immunohistochemical (IHC) analysis and molecular mechanism research.
IHC analysis
Tumors and livers were carefully harvested and maintained in 4% neutral formalin liquid. After dehydration, thin sections were strictly calculated for hematoxylin and eosin (H&E) staining. Apoptotic cells in tumor sections were determined by terminal deoxynucleotidyl transferase deoxyuridine triphosphate nick-end labeling (TUNEL) with a fluorescence and colorimetric TUNEL apoptosis assay kit (Majorbio Pharmaceutical Technology, Shanghai, China) following the manufacturer’s instructions, and IHC staining was performed for measurement of p53 and Bcl2 expression as described previously.28 Five fields were randomly chosen for evaluation. The brown target-positive area was quantified using ImageJ software.
Statistical analysis
Data are expressed as means ± standard error of the mean. Statistical analyses were performed using GraphPad Prism (version 6.0; GraphPad Software, La Jolla, CA, USA), with analysis of variance and Dunnett’s least significant difference post hoc tests. P<0.05 was considered significant.
Results
AT-MNPs augmented cell proliferation suppression of NSCLC cells
Transmission electron microscopy indicated that most Fe3O4 MNPs were spherical in shape of size ~20 nm (Figure 1B and C). Before the role of AT-MNPs in NSCLC was confirmed, the possible cytotoxicity of AT, MNPs, and AT-MNPs in NSCLC tumor cells and normal human lung epithelial cells was explored. As shown in Figure 1D, at concentrations of 10 μM or lower, AT showed no significant antitumorigenic role in NSCLC cells of A549 and H1975. At concentrations >15 and 20 μM, AT exhibited remarkable effects in suppressing A549 and H1975 cells, respectively, suggesting that to some degree, AT possesses an inhibitory role in controlling NSCLC cells. However, no significant cytotoxicity was observed from normal lung epithelial BEAS2B cells at even the highest concentration of 30 μM. Of note, after combination with MNPs, a significant antiproliferation ability of MNPs and AT was observed. A significant difference was observed with the 5 μM AT and 20 μg/mL MNP combination, illustrating that Fe3O4 MNPs combined with AT displayed an effective antitumor activity in NSCLC cells. Therefore, 20 μM AT was used in combination with different concentrations of MNPs to investigate the MNP monotherapy and AT-MNPs on NSCLC. As shown in Figure 1E, MNPs alone also reduced NSCLC cell viability in a dose-dependent manner, with significant differences observed >20 and 15 μg/mL in A549 and H1975 cells, respectively. Compared to MNPs alone, AT-MNPs showed stronger antitumor effects on A549 and H1975 proliferation. On the contrary, no cytotoxicity was observed in BEAS2B cells with an increase in MNP treatment. The data here suggest that AT-MNPs play a huge antitumor role in NSCLC proliferation without causing cytotoxicity in normal cells. Concentrations of AT (20 μM) and MNPs (20 μg) were used for combination therapy in subsequent studies.
AT-MNPs inhibited NSCLC cell proliferation
We investigated the effects of AT-MNP treatment on NSCLCcell proliferation and migration. To examine whether AT-MNP treatment influenced the clonogenic growth of A549 and H1975, colony-forming analysis was conducted. Our colony-formating assays showed that AT and MNP monotherapy significantly reduced the colony numbers of cancer cells compared to the untreated controls. Notably, AT-MNPs dramatically decreased the clonogenic growth of NSCLC cells of A549 and H1975 compared to AT and MNPs alone (Figure 2A). In the presence of AT and MNP monotherapies, cell migration in A549 and H1975 was decreased. However, AT-MNPs markedly decreased cell migration in both cell lines (Figure 2B). The relative wound area of A549 and H1975 cells was detected after different treatments. As shown in Figure 2C and D, AT and MNP monotherapies significantly inhibited wound healing in A549 and H1975 cells compared to the untreated controls, an observation that was exacerbated in AT-MNP treatment. These results illustrated that the capability of AT-MNPs to suppress NSCLC cell proliferation and migration was apparently stronger than the effect of AT and MNP monotherapies.
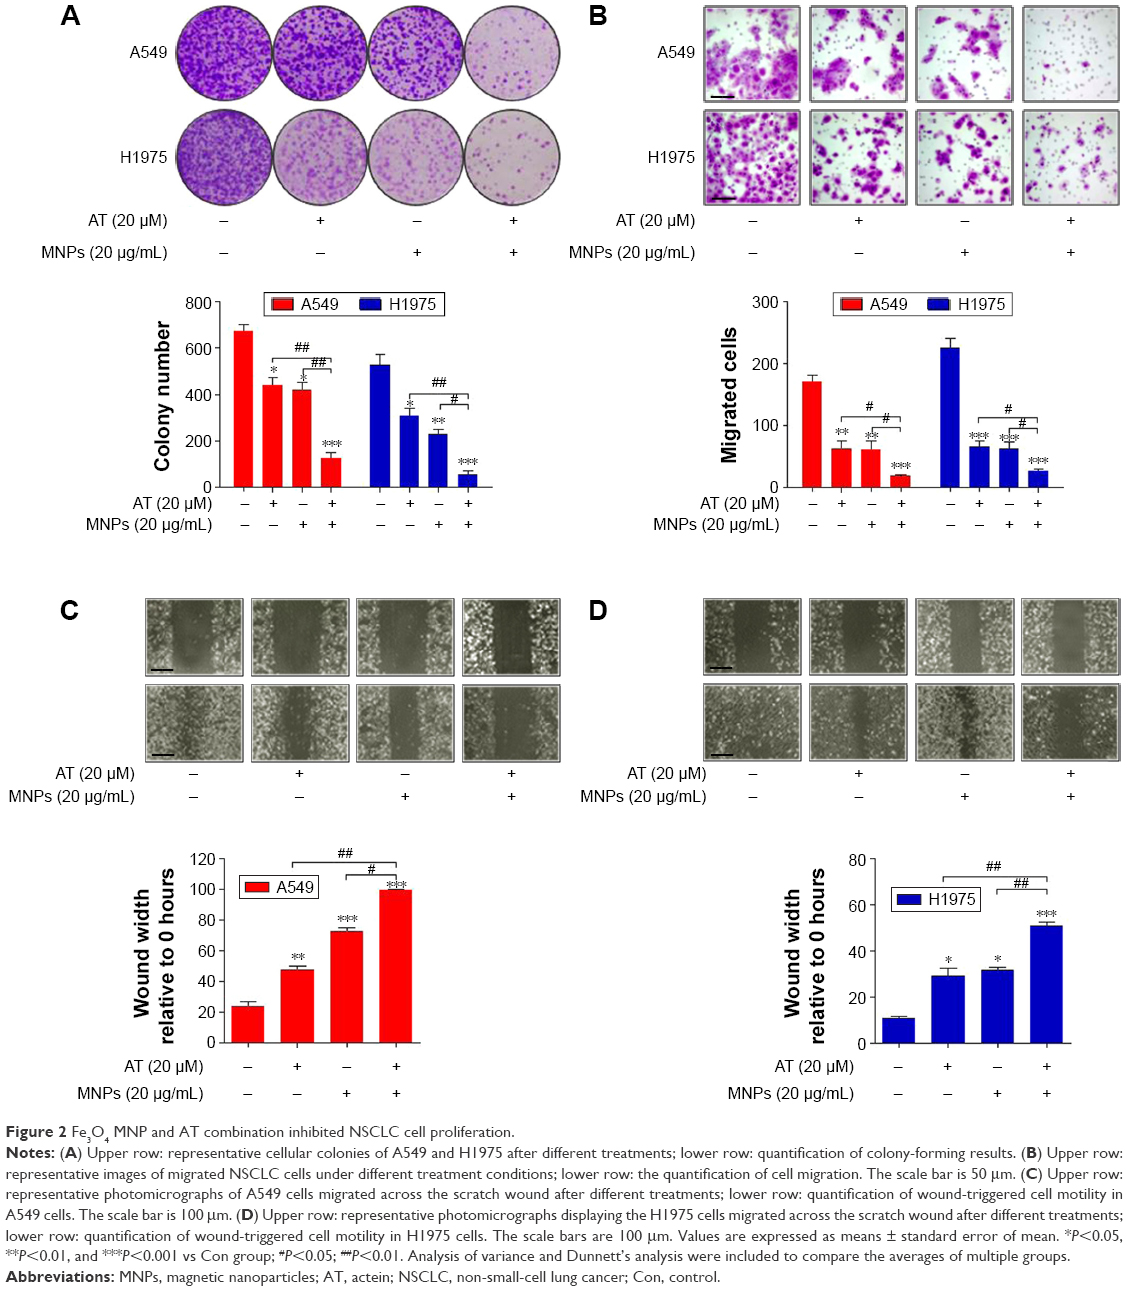 | Figure 2 Fe3O4 MNP and AT combination inhibited NSCLC cell proliferation. |
AT-MNPs significantly induced apoptosis of NSCLC cells
We next investigated whether AT-MNPs had any effect on apoptosis, which may have contributed to the observed reduced cell proliferation. TUNEL assays indicated that AT and MNP single treatments promoted increased apoptosis compared to untreated cells, which was further enhanced with AT-MNPs. Of note, significant differences were observed between the AT-MNP and AT and MNP groups in both A549 and H1975 cells (Figure 3A). As shown in Figure 3B, in comparison with the untreated control group, AT, MNP, and AT-MNP treatments resulted in shrunken nuclei that appeared condensed and brightly stained. Nuclear condensation has been considered as a typical change in morphology for cells experiencing apoptosis.29,30 Moreover, flow cytometry results confirmed that AT-MNPs caused an obvious upregulation in apoptotic cells compared to the untreated control cells, as well as AT and MNP single treatment (Figure 3C). These results suggested that the ability of AT-MNPs to trigger A549 and H1975 cell apoptosis was markedly stronger than that of AT and MNP single therapy.
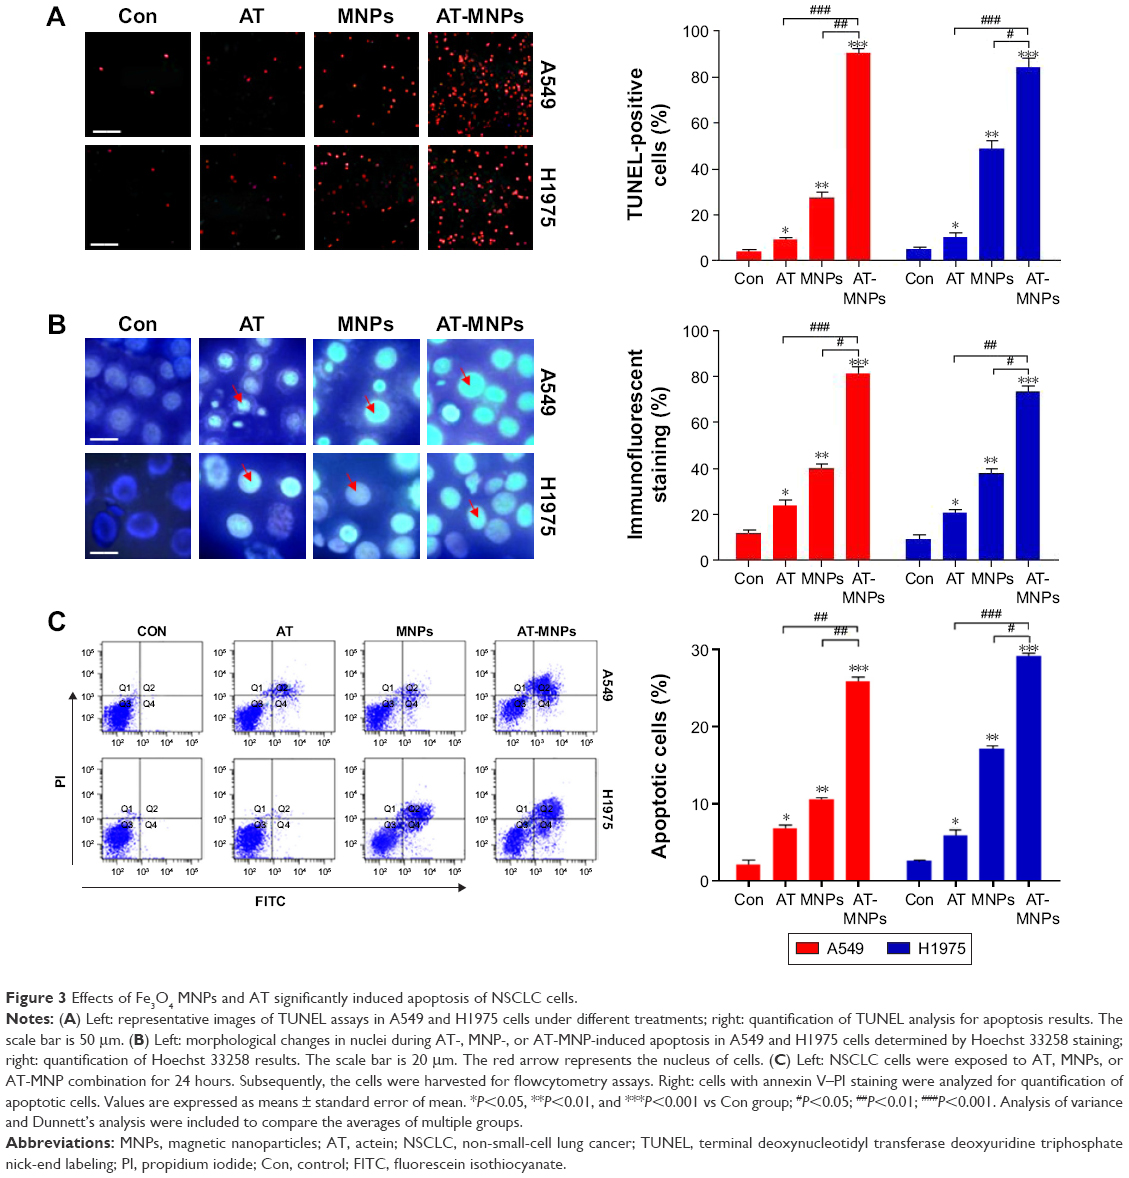 | Figure 3 Effects of Fe3O4 MNPs and AT significantly induced apoptosis of NSCLC cells. |
AT-MNPs induced apoptosis in NSCLC cells through caspase 3 activation
The results indicated that apoptosis could be induced by AT and MNPs and especially AT-MNPs. Therefore, the molecular mechanism was explored. Caspase 8 activation results in downstream activation of caspase 9 and caspase 3.31 We thus determined the extent of caspase activation of cancer cells after AT, MNP, and AT-MNP treatment through Western blot analysis. As shown in Figure 4A, AT and MNPs induced a markedly high cleavage of caspase 8, leading to caspase 9 activation. Consequently, caspase 3 was activated and apoptosis induced. Significantly, AT-MNPs resulted in higher levels of caspase 8, caspase 9, and caspase 3 cleavage in NSCLC cells of A549. Moreover, in H1975 cells, cleaved caspase 8, caspase 9, and caspase 3 were dramatically elevated in the AT-MNP group compared to AT and MNP single treatment (Figure 4B). As shown in Figure 4C, caspase 3 activity was highly elevated in the AT-MNP group, with significant differences compared to AT and MNP single therapy. Moreover, cell treatment with a caspase 3 inhibitor abolished caspase 3 activity triggered by AT-MNPs, and AT-MNP-induced high caspase 9 activation was also suppressed following caspase 9 inhibitor treatment. In addition, H1975 cells after AT-MNP treatment showed dramatically higher activity of caspase 3 and caspase 9 compared to the monotherapy-treated groups. As expected, pretreatment of caspase 3 and caspase 9 inhibitors failed noticeably to induce caspase activation (Figure 4D). These results suggested that caspase signaling pathway activation is involved in AT-MNP-induced apoptosis, and may be the main molecular mechanism by which AT-MNPs exhibit stronger antitumor effects.
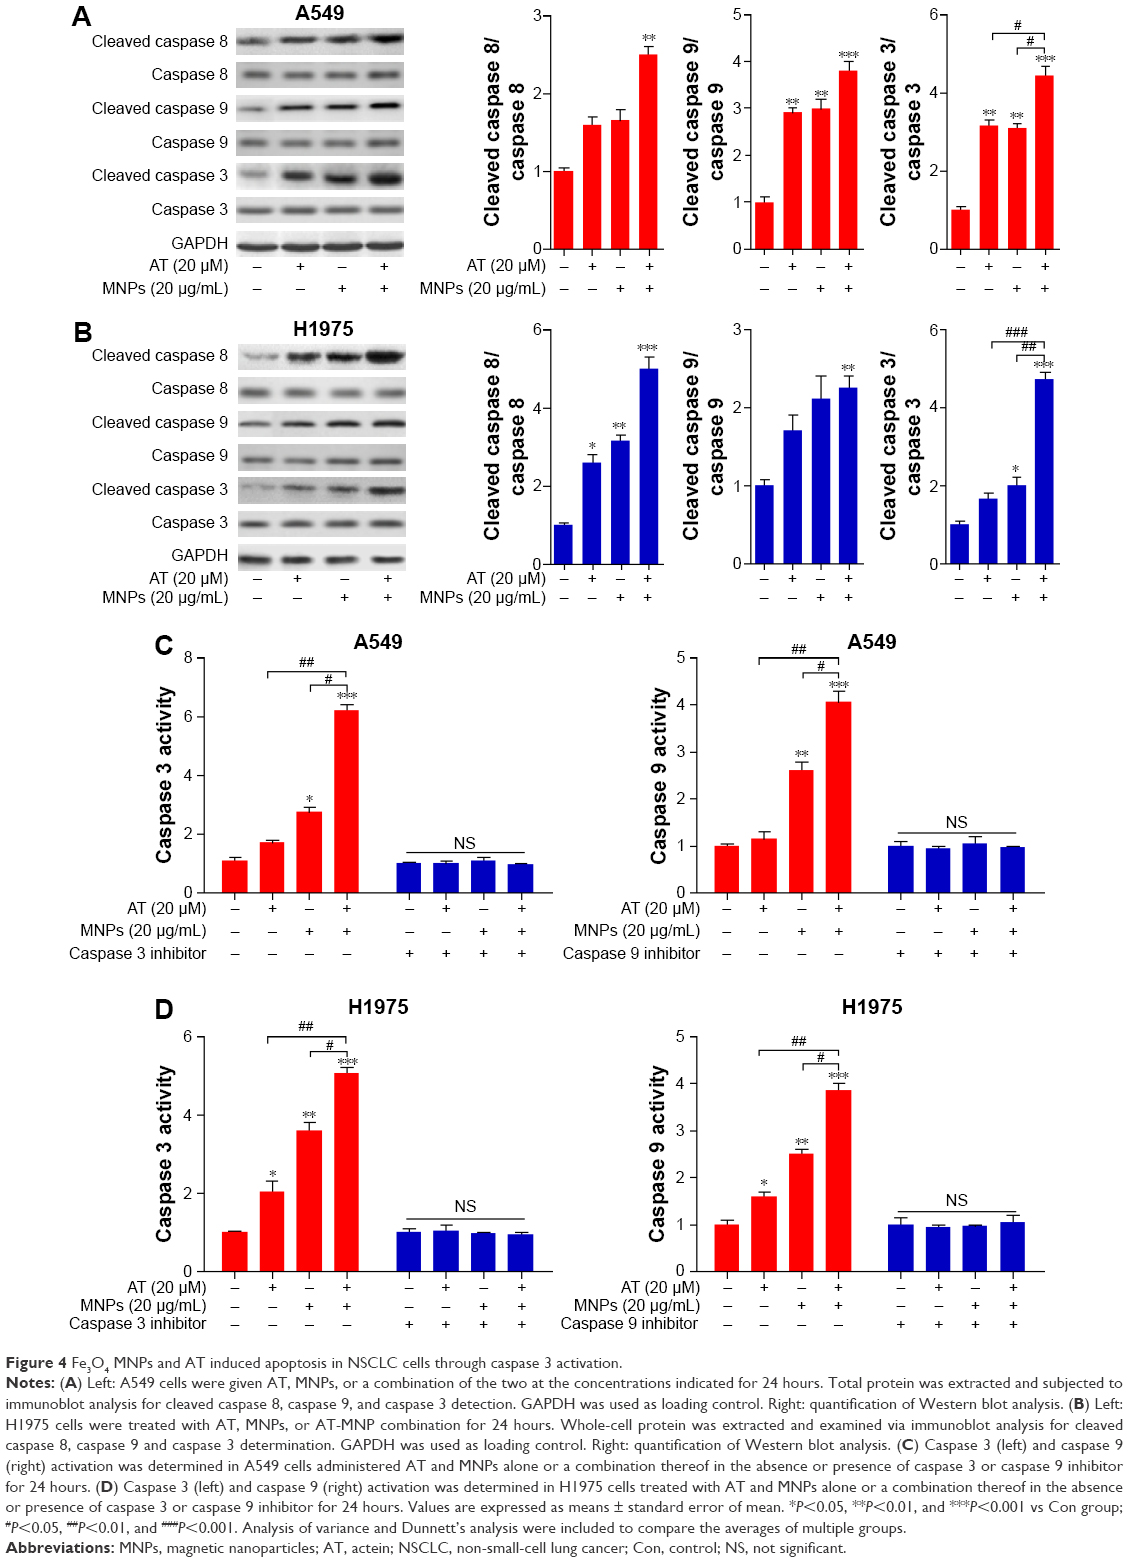 | Figure 4 Fe3O4 MNPs and AT induced apoptosis in NSCLC cells through caspase 3 activation. |
AT-MNPs induced apoptosis associated with mitochondrial pathway
Bcl2 family members can be divided into antiapoptotic proteins, including Bcl2 and BclXL, and proapoptotic signals, such as Bax and Bad.32 We further investigated the role of AT-MNPs in the balance between the proapoptotic and antiapoptotic members. The combination treatment of AT-MNPs on A549 (Figure 5A) and H1975 (Figure 5B) significantly decreased Bcl2 and BclXL, whereas Bax and Bad protein levels were dramatically increased in NSCLC cells after AT-MNP treatment. TRAIL is known to induce rapid apoptosis in vivo and in vitro in various cancers.33 TRAIL-induced apoptosis relies on death receptors (DRs), leading to the formation of the death-inducing signaling complex. FADD is subsequently activated to improve caspase 8 activity.34 Additionally, p53, as previously reported, induces DR gene transcription.35 Therefore, p53 is essential for TRAIL/DR-induced apoptosis in various tumors.36 As shown in Figure 5C and D, immunoblot analysis was carried out to explore how TRAIL, DR4, FADD, and p53 were altered after AT and MNP single treatment or AT-MNPs in A549 and H1975 cells, respectively. The results showed that TRAIL, DR4, FADD, and p53 protein levels were significantly augmented by AT and MNP monotherapy. Notably, AT-MNPs dramatically stimulated TRAIL, DR4, FADD, and p53 levels compared to the single treatment groups. These results indicated that the mitochondrial pathway was involved in AT-MNP-induced apoptosis, which was associated with the p53-regulated TRAIL–DR signaling pathway.
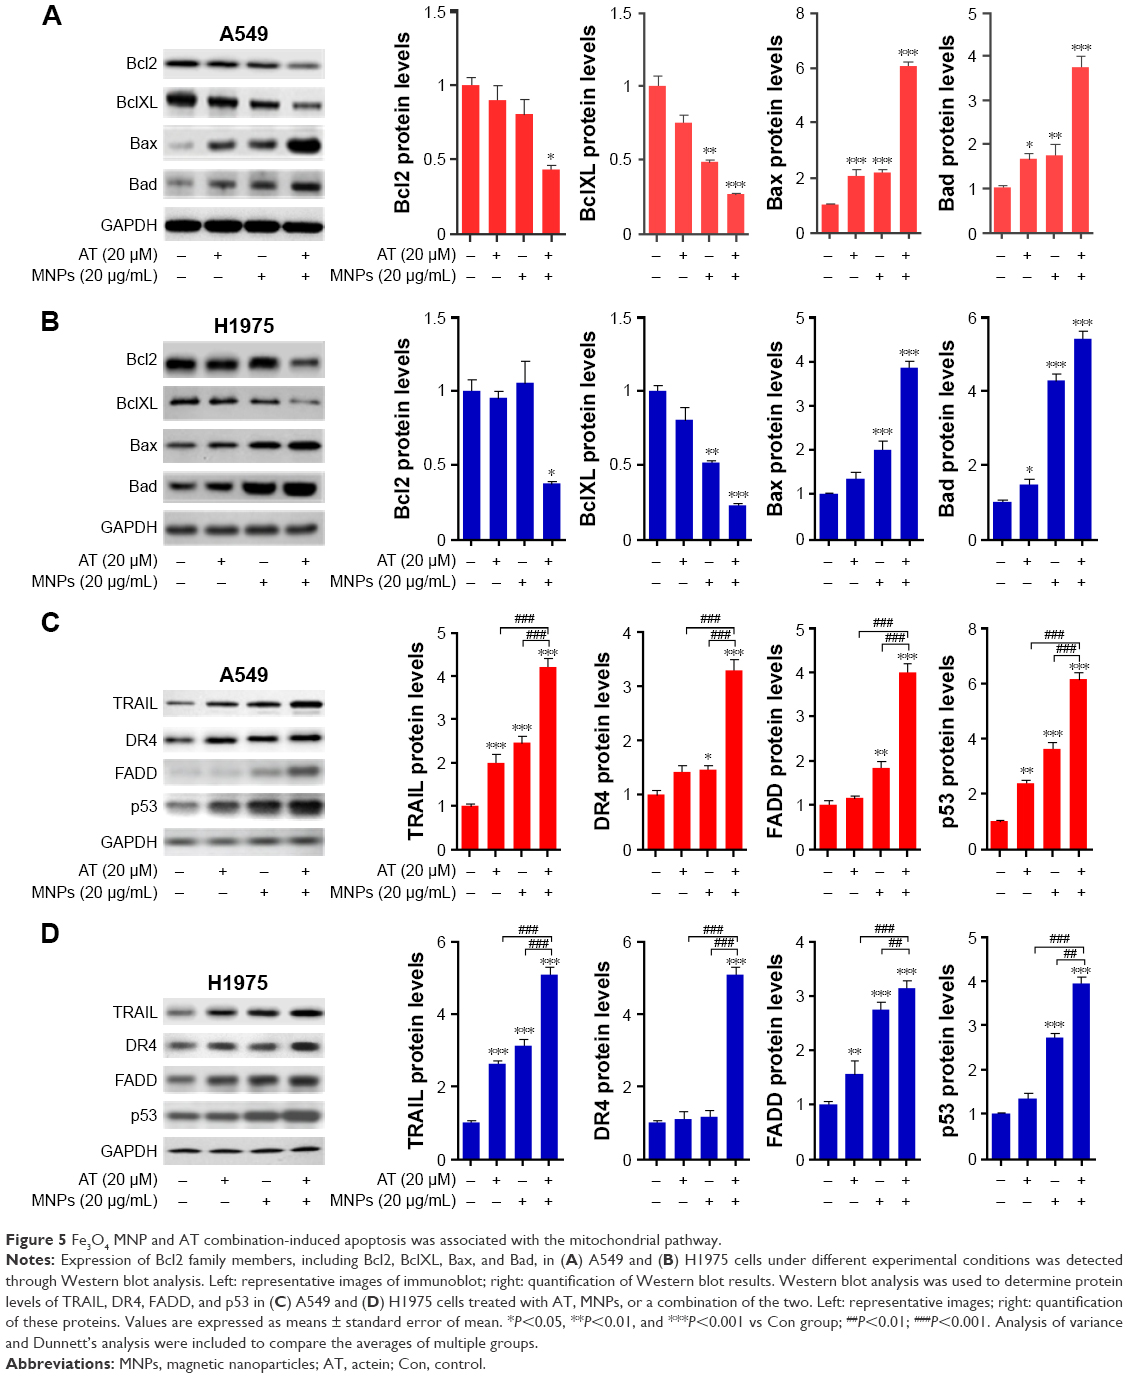 | Figure 5 Fe3O4 MNP and AT combination-induced apoptosis was associated with the mitochondrial pathway. |
In order to confirm the role of p53 in regulating apoptosis from DR modulation, immunoblotting was used to determine p53 levels under different experimental conditions. The results showed that p53 protein expression levels in NSCLC cells of A549 and H1975 were upregulated with AT-MNP treatment in a time-dependent manner (Figure 6A). Similarly, elevated p53 was observed in A549 and H1975 cells at different concentrations of MNPs in the absence of AT. Furthermore, as the concentrations of AT increased, p53 protein expression levels were enhanced in A549 and H1975 cells without MNP administration in a dose-dependent manner (Figure 6B and C). To further determine the effect of AT-MNPs on p53, the p53 inhibitor pifithrin (PFT)-α was subjected to A549 and H1975 in the presence of AT and MNPs. As shown in Figure 6D, enhanced FADD and p53 protein levels in A549 cells treated with AT-MNPs were reduced for PFTα administration, especially at 20 μM. Similarly, in H1975 cells, FADD and p53 were also upregulated for AT-MNP treatment, which was reduced for PFTα pretreatment. A significant difference was observed between the combined group and the single therapy group (Figure 6E). Furthermore, real-time quantitative PCR (RT-qPCR) analysis was carried out to confirm whether AT-MNP-induced apoptosis was dependent on p53. As shown in Figure 6F and G, after AT-MNP treatment in the presence or absence of PFTα, we found that the promoted DR4, DR5, and TRAIL transgenic levels due to AT-MNP treatment were dramatically downregulated for PFTα, with significant differences in A549 and H1975 cells. These data suggested that AT-MNP-induced apoptosis in NSCLC cells relied on the p53-mediated TRAIL–DR signaling pathway.
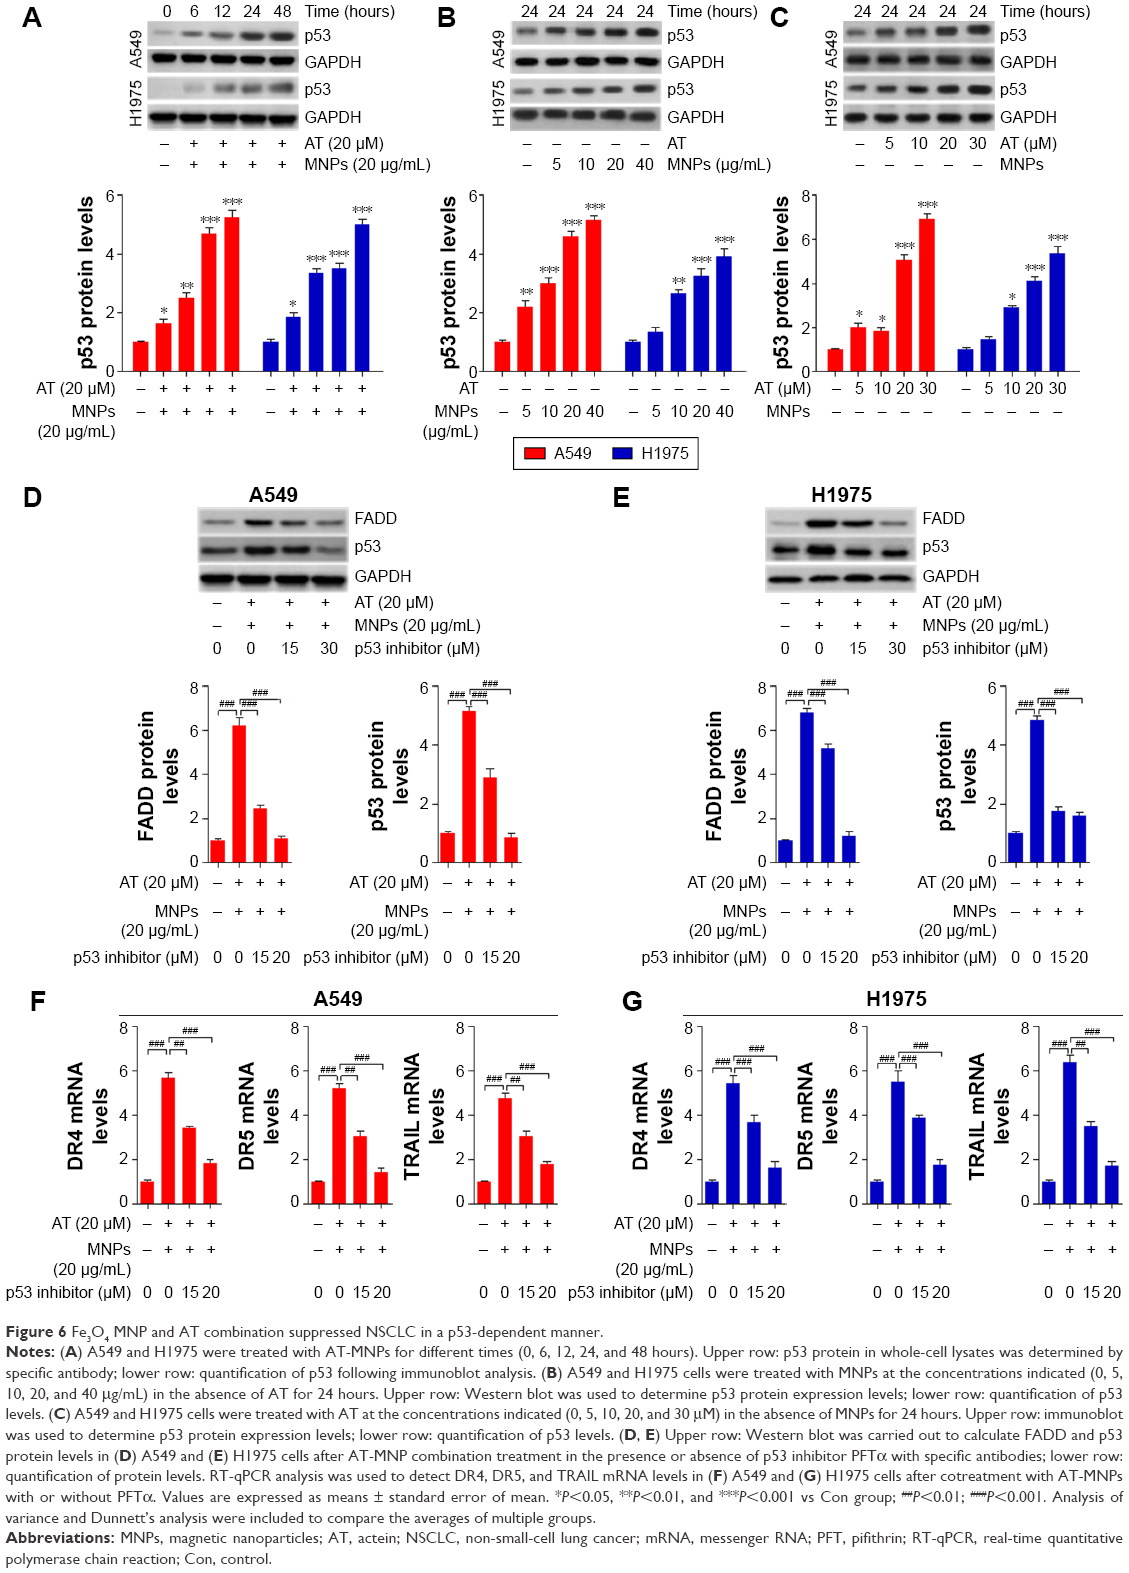 | Figure 6 Fe3O4 MNP and AT combination suppressed NSCLC in a p53-dependent manner. |
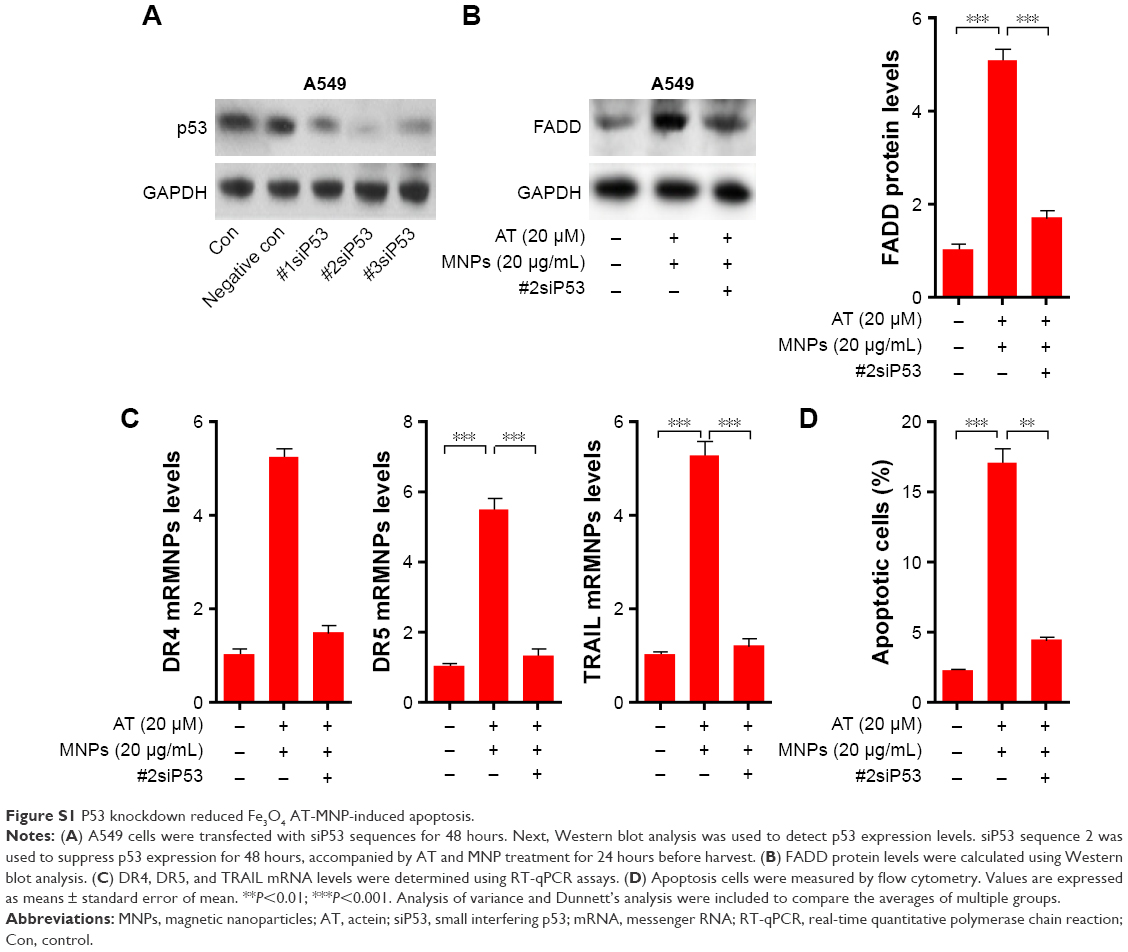
In order to confirm further the role of p53 in NSCLC prevention, the p53 gene was silenced using specific small interfering RNA (siRNA) sequences. We found that in A549 cells, p53 was successfully silenced following transfection with siP53 sequence 2 compared to the untransfected control group (Figure S1A), and this was thus used in the subsequent experiments followed by Western blot analysis of FADD. The data indicated that the AT-MNP treatment-induced high FADD expression was reversed following p53 knockdown (Figure S1B). In addition, RT-qPCR analysis indicated that DR4, DR5, and TRAIL gene levels were highly induced for AT-MNP treatment and were reduced upon silencing p53 (Figure S1C). Furthermore, as shown in Figure S1D, apoptosis cells were highly reduced in the AT-MNP group after p53 knockdown in A549 cells, as determined by flowcytometry analysis.
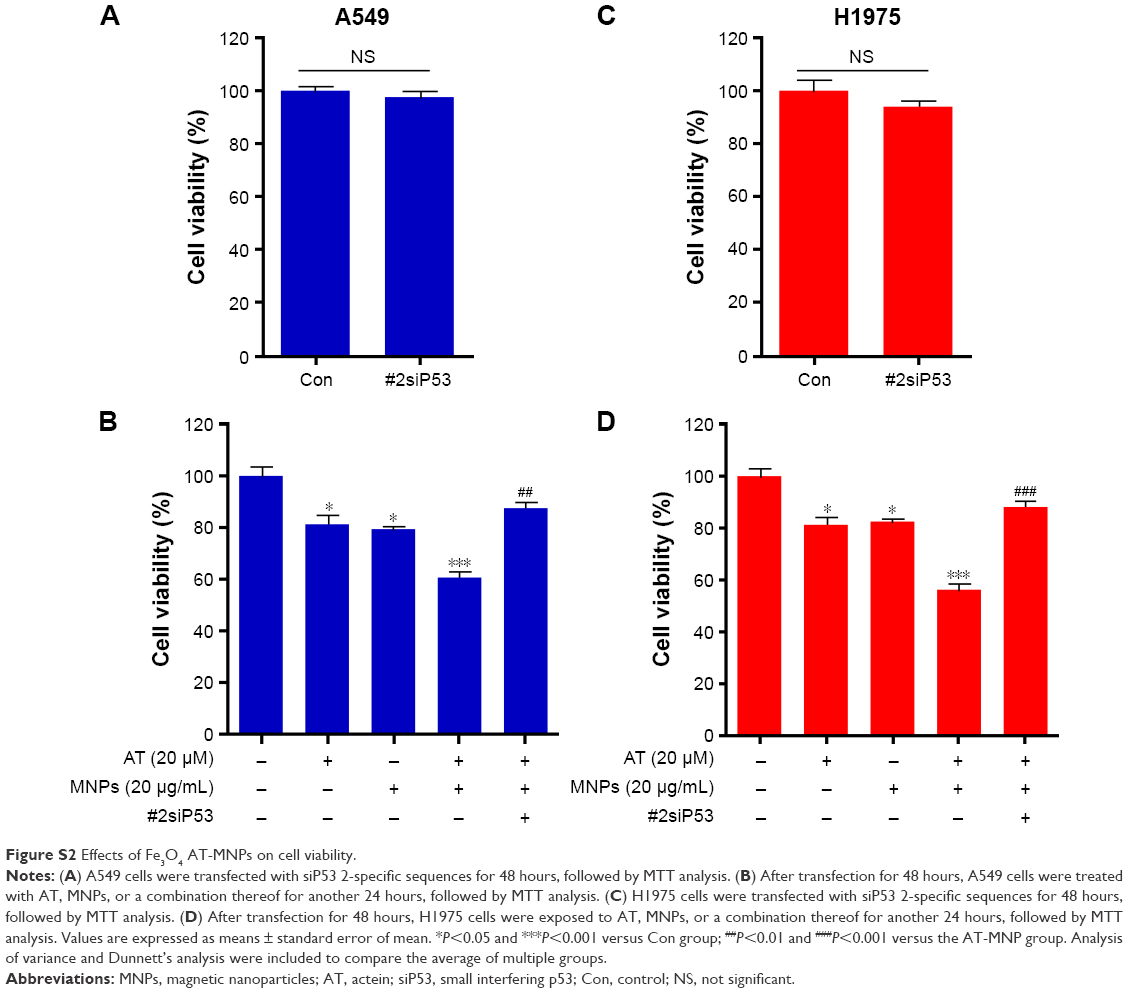
MTT analysis was also conducted to confirm our results. As shown in Figure S2A, after transfection of A549 cells using siP53 sequence 2, no significant difference was observed after transfection for 48 hours. Next, A549 cells were transfected for 48 hours, followed by AT, MNP, or AT-MNP treatment for another 24 hours, followed by cell viability analysis. We found that AT-MNPs significantly reduced cell viability; however, p53 knockdown significantly reversed cell viability (Figure S2B). Similar results were observed in H1975 cells, with no difference between the control and siP53 sequence 2 groups. P53-null H1975 cells showed higher cell viability compared to the AT-MNP group (Figure S2C and D). These data further indicated that p53 was indeed a key point or gene targeted by AT-MNPs to suppress NSCLC progression.
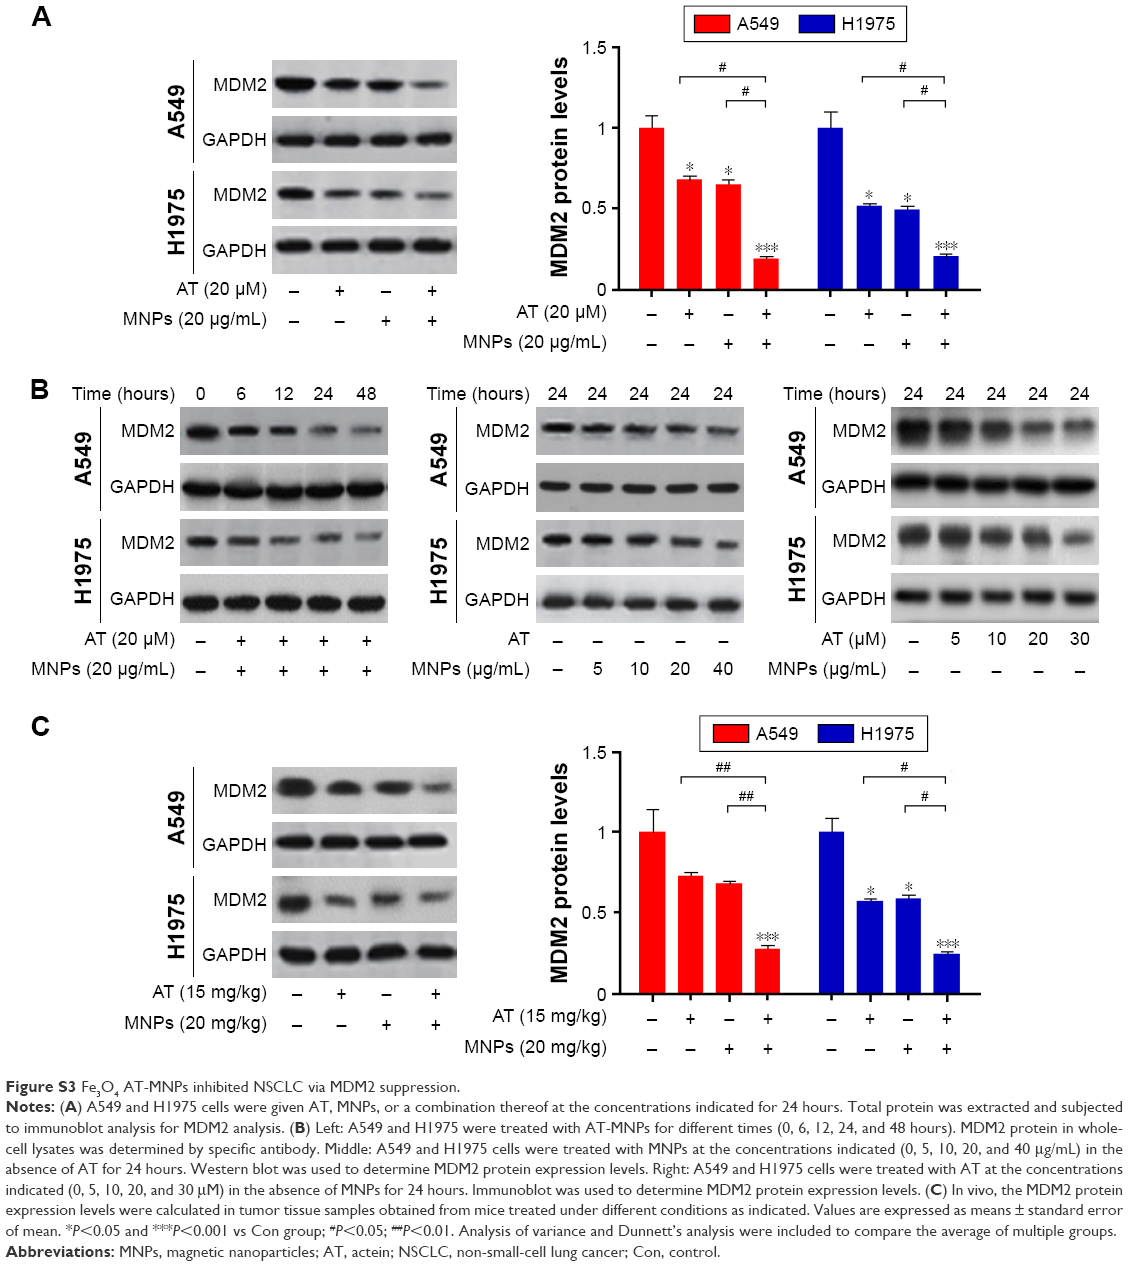
Inactivation of the p53 protein may be caused by a p53 gene mutation or by the p53 protein binding to other proteins, such as MDM2.37 Therefore, MDM2 in A549 and H1975 lung cancer cells was explored, and we found that MDM2 levels were significantly reduced for AT and MNP treatment in both single and combination therapies (Figure S3A). There was a significant difference observed between the monotherapies and combination treatments, indicating the synergistic effects of AT and MNPs in combination. In order to confirm further the role of AT and MNPs in MDM2 expression, cells were treated with AT and MNPs. We found that MDM2 expression levels decreased oBver time, indicating the suppressive effects of AT/MNP function on lung cancer cells (Figure S3, left). Next, A549 and H1975 cells were exposed to MNPs in the absence of AT for 24 hours. The data indicated that the protein expression levels of MDM2 were downregulated with higher concentrations of MNPs (Figure S3B, middle). Following that, cells were treated for 24 hours in the presence of AT only. The results suggested that AT showed inhibitory effects on MDM2 expression, especially at the highest concentration (Figure S3B, right). In vivo, tumor tissue samples obtained from mice suggested that MDM2 levels were reduced in AT and MNP single treatments, especially in H1975 tumor specimens. Of note, AT-MNPs significantly reduced MDM2 expression compared to the control group, and a significant difference was also observed between the single and combination treatments, which was in line with the in vitro results (Figure S3C). These data indicated that in contrast to p53 expression, MDM2 was reduced by AT-MNP treatment, further suggesting that p53 activation was induced by AT-MNPs.
AT-MNPs showed no toxicity in vivo
Our study indicated that AT-MNPs had an inhibitory role in NSCLC cell proliferation in vitro. Therefore, in order to investigate further the role of MNP and AT monotherapy and AT-MNP treatment on tumor growth, athymic nude mice bearing the established A549 and H1975 cells had tumors planted subcutaneously in the presence of 15 mg/kg AT, 20 mg/kg MNPs, or AT-MNPs (Figure 7A). The single treatments of AT and MNPs significantly reduced tumor volume and tumor weight compared to the control group. Interestingly, AT-MNPs showed a stronger antitumor role in controlling tumor volume and weight, and marked differences were observed between the AT-MNP and AT- and MNP-alone groups (Figure 7B). Additionally, no apparent difference of body weight was found among the different groups in A549-transplanted athymic nude mice (Figure 7C). Similarly, in H1975 subcutaneously implanted nude mice, tumor volume and tumor weight were found to be reduced for AT and MNP monotherapy, which was further attenuated for the combination treatment, with a significant difference (Figure 7D). Moreover, no difference was detected for body weight among the mice from different groups (Figure 7E). The data here indicate that AT, MNPs, and, especially, their combination have inhibitory roles in tumor growth in vivo, consistent with the results in vitro.
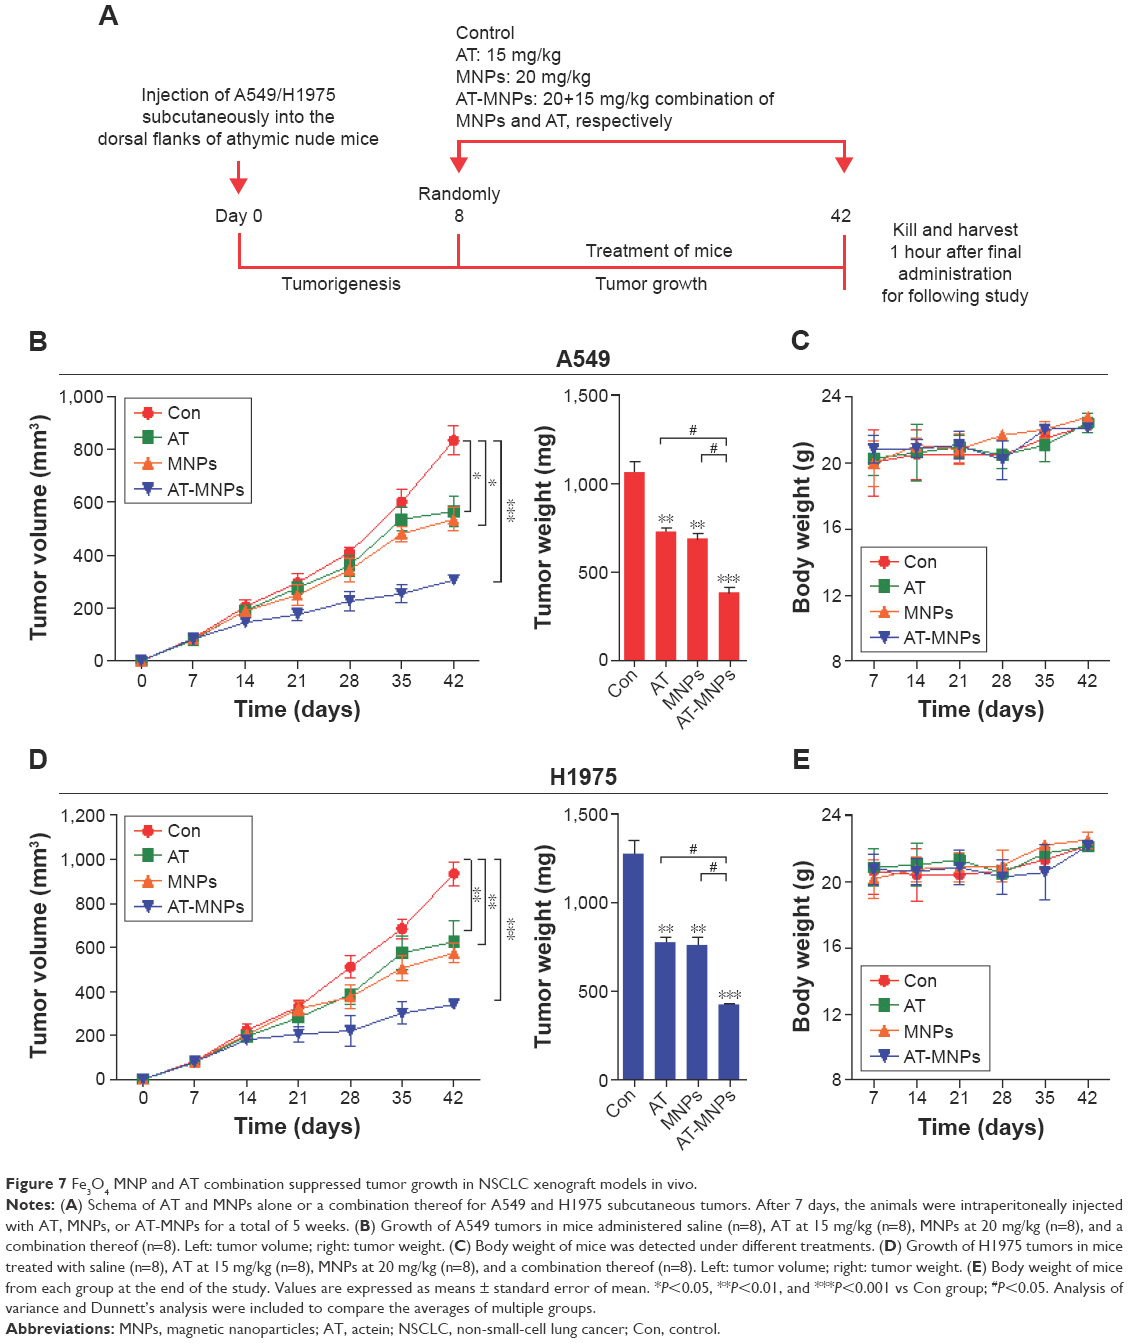 | Figure 7 Fe3O4 MNP and AT combination suppressed tumor growth in NSCLC xenograft models in vivo. |
H&E staining of the liver from each mouse treated with AT, MNPs, or AT-MNPs showed no toxicity, with normal histology in comparison with control tissues, suggesting the absence of toxicity (Figure 8A). In addition, the cell viability of human hepatic L02 cells of normal mouse liver AML12 cells and normal rat liver BRL3A cells was used to explore liver toxicity further. As shown in Figure 8B–D, no significant difference was observed in normal liver cells after AT- and MNP-monotherapy treatments or AT-MNP treatment, indicating lack of toxicity. These data further indicated that AT, MNPs, and particularly AT-MNPs showed inhibitory roles in NSCLC development in vivo without toxicity.
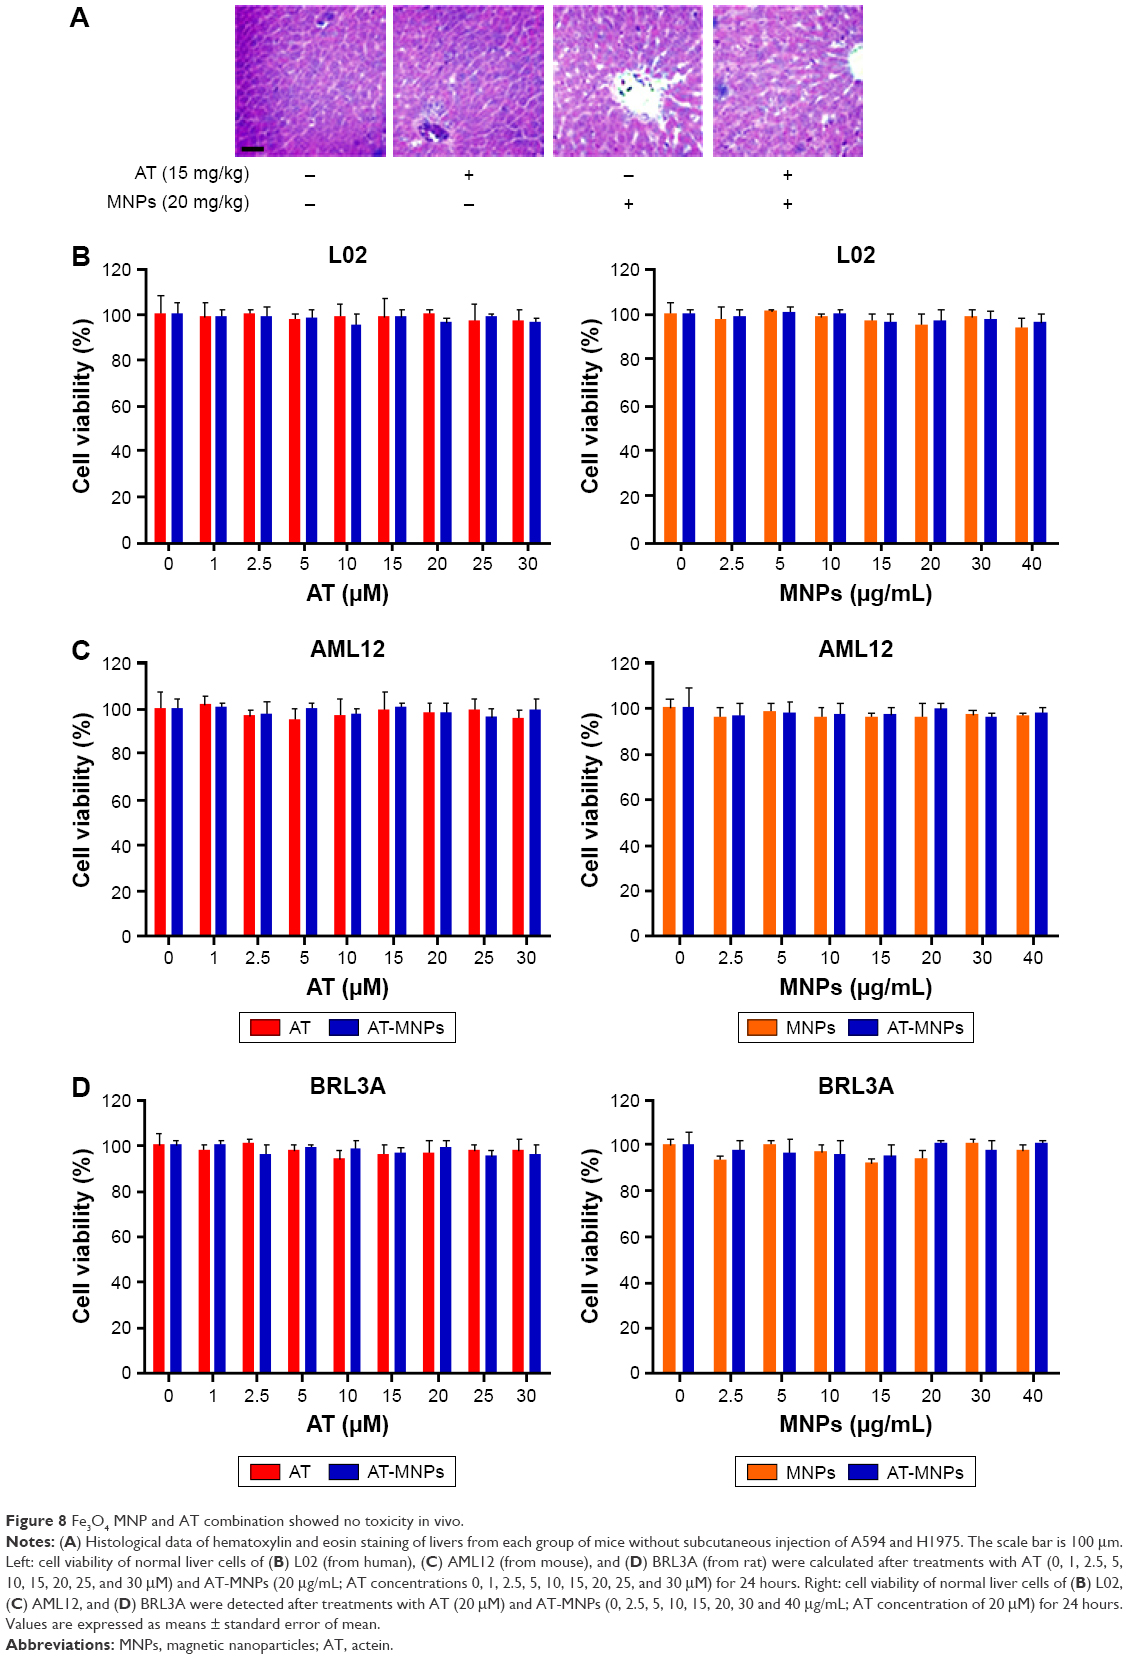 | Figure 8 Fe3O4 MNP and AT combination showed no toxicity in vivo. |
AT-MNPs impeded NSCLC progression through apoptosis induction in vivo
Caspase expression was evaluated to confirm the molecular mechanism through immunoblotting of tumor tissue samples from mice injected with A549 and H1975. As shown in Figure 9A, Western blot analysis showed higher caspase 3 cleavage in the presence of AT-MNP therapy compared to either monotherapy. In addition, p53 and FADD were also upregulated after AT and MNPs alone and further elevated following AT-MNP treatment (Figure 9B). Furthermore, RT-qPCR analysis was carried out to detect pro- and antiapoptotic proteins of Bax and Bcl2. BAX mRNA levels in tumor samples from subcutaneous A549 and H1975 mice were enhanced for AT-MNPs compared to the monotherapy mice. In contrast, BCL2 was downregulated for AT, MNPs, and AT-MNPs, indicating the high Bax:Bcl2 ratio contributed to apoptosis. Additionally, TRAIL and its receptor of DR4 were also observed with higher transgenic gene levels in tumor tissue samples after AT, MNPs, and AT-MNPs than the control group. Of note, AT-MNP treatment showed more intensive effects on stimulating TRAIL and DR4 expression in comparison with the single treatments (Figure 9C and D).
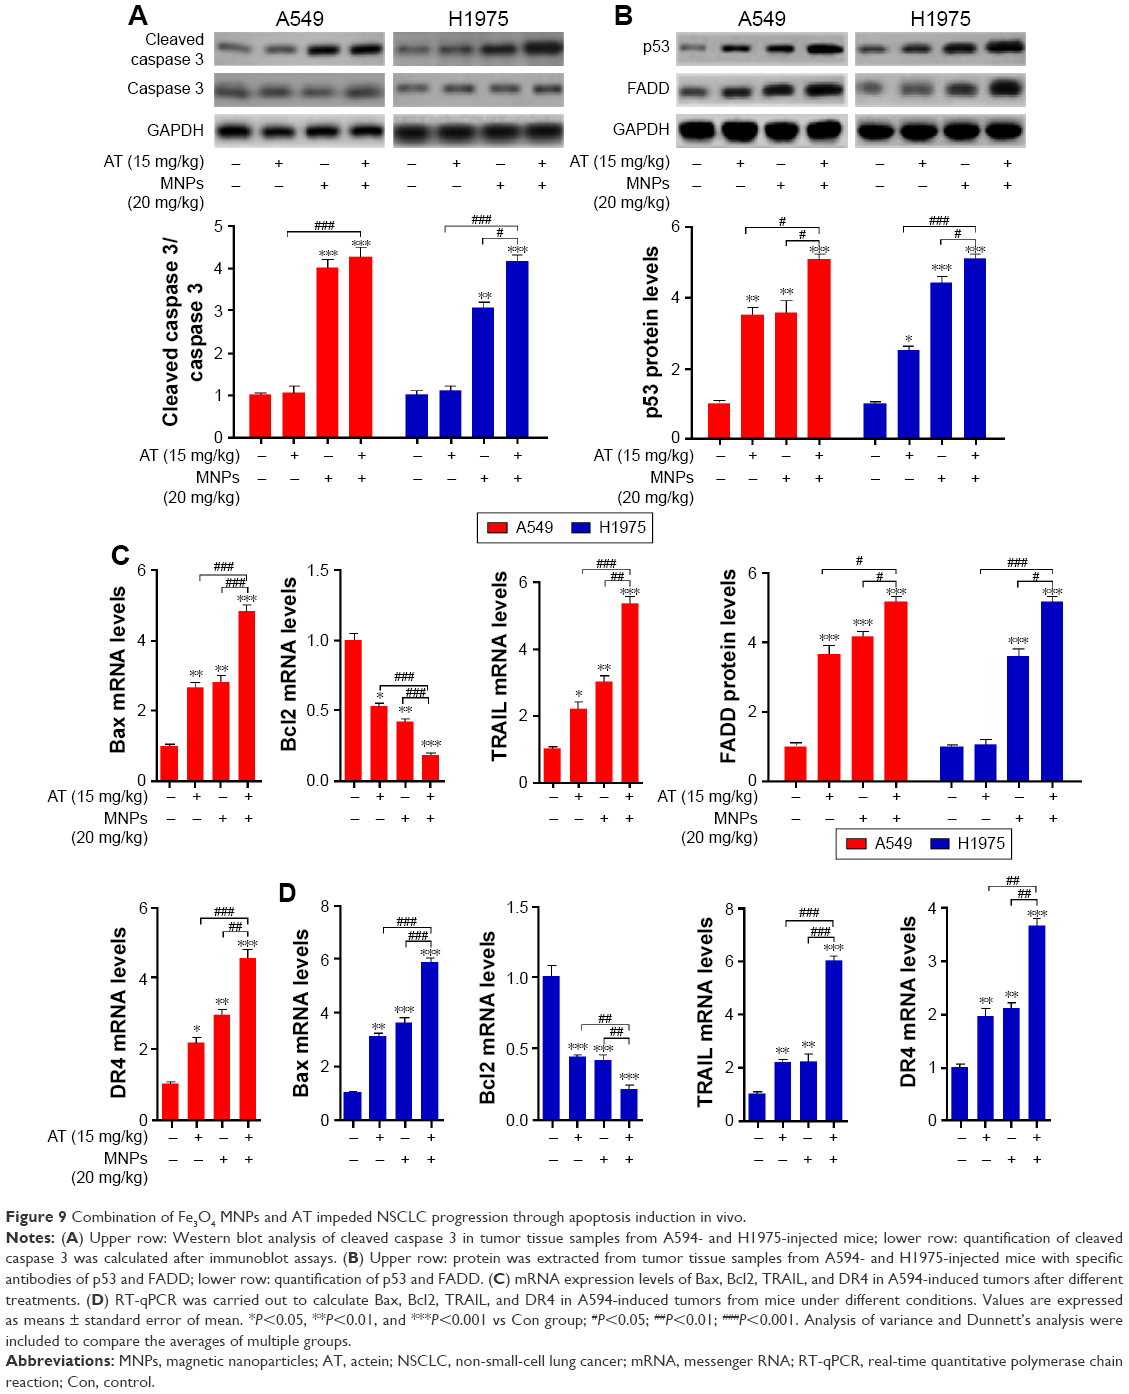 | Figure 9 Combination of Fe3O4 MNPs and AT impeded NSCLC progression through apoptosis induction in vivo. |
To confirm our hypothesis, IHC analysis was performed to evaluate p53, Bcl2, and TUNEL levels in different tumor samples from mice under various conditions. As shown in Figure 10A, AT and MNP single treatments improved the number of p53-positive cells, which was further enhanced following AT-MNP therapy. On the contrary, Bcl2 was highly expressed in the absence of AT or MNPs, and downregulated levels were observed for AT and MNPs alone. AT-MNPs showed a dramatic role in impeding Bcl2 expression levels in tumor tissue samples (Figure 10B). TUNEL assays further indicated that AT-MNPs suppressed A549 tumors through cell death induction in vivo (Figure 10C). Similarly, in H1975 tumors, p53 was highly potentiated for AT-MNPs, whereas Bcl2 was considerably reduced in AT-MNP treatment (Figure 10D and E). Moreover, TUNEL analysis revealed that the tumor tissue samples in mice receiving AT-MNPs had higher numbers of TUNEL-positive cells than the control or AT- or MNP-monotherapy groups (Figure 10F). These results illustrate that AT-MNP treatment suppresses lung tumor growth through apoptosis induction in vivo, which is consistent with the results in vitro.
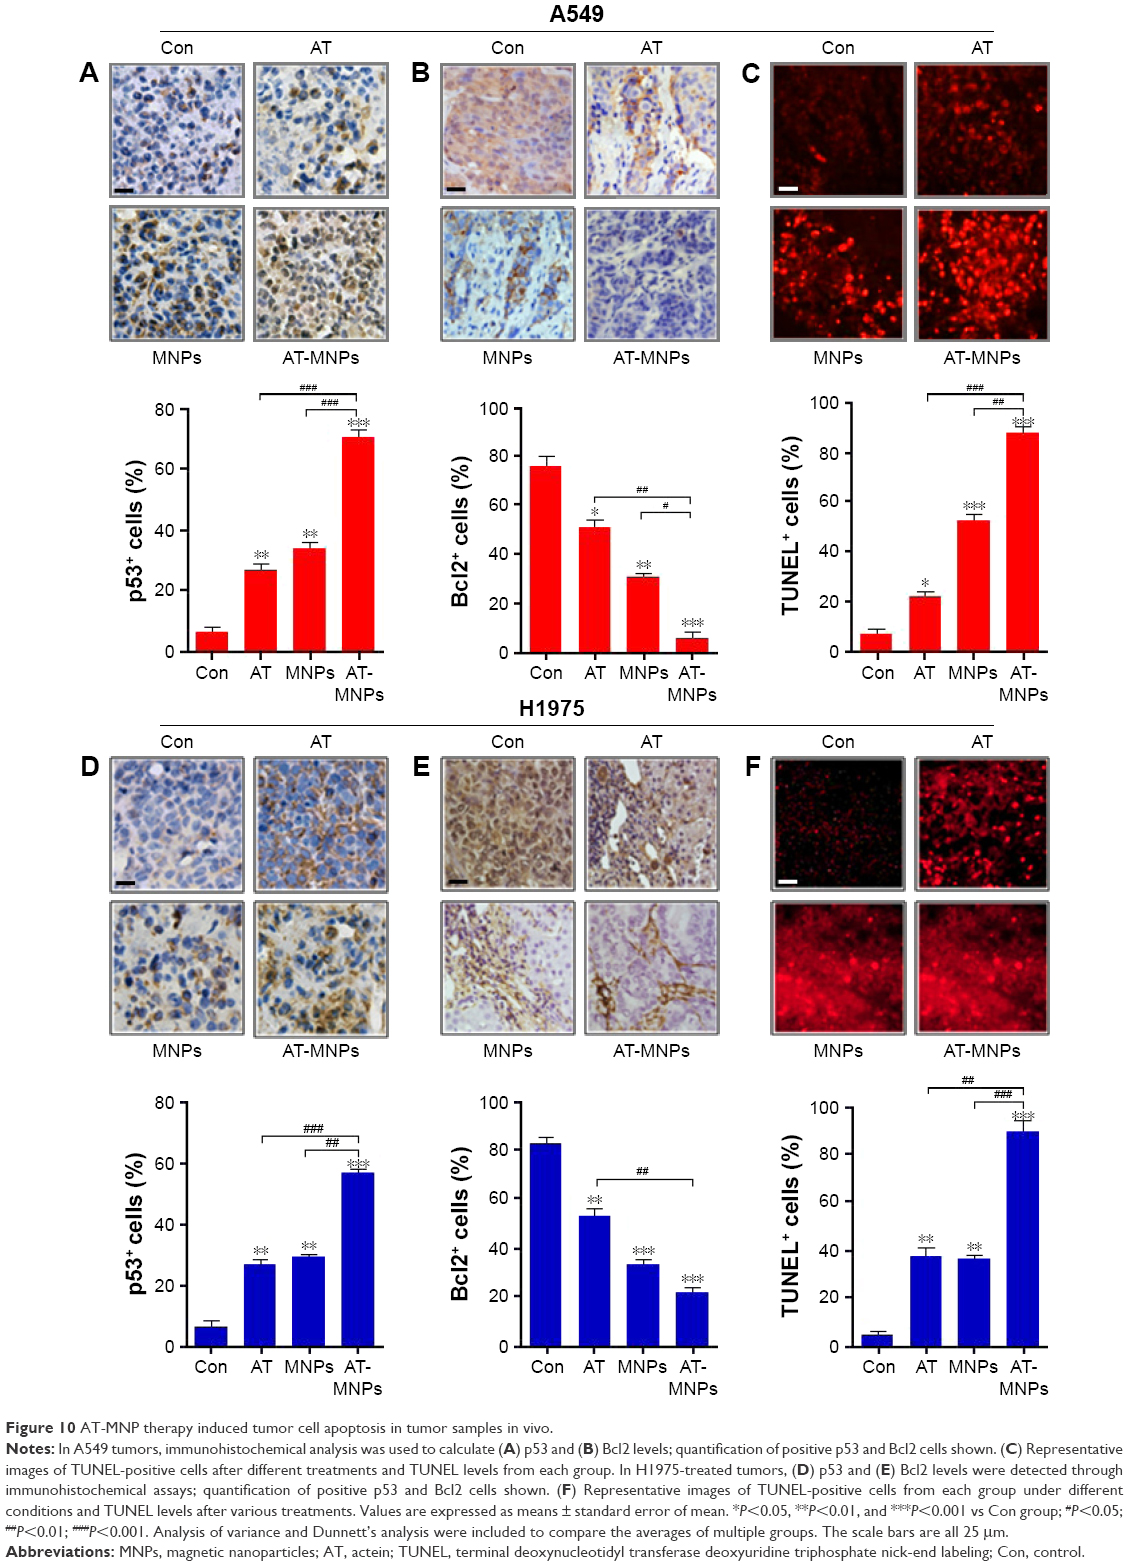 | Figure 10 AT-MNP therapy induced tumor cell apoptosis in tumor samples in vivo. |
Finally, mice were also treated with AT or AT-MNPs via intraperitoneally to determine the concentration of AT in the plasma. As shown in Figure S4, the concentrations of AT in the plasma of mice demonstrated the sustained release properties of AT-MNPs. Time to maximum concentration for AT-MNP-treated mice (3 hours) was six times higher than that of mice that received AT alone at 0.5 hour. Further, the maximum concentration (805.48±31.18 ng/mL) for AT-MNP-treated mice was fourfold higher than those that received AT alone (189.54±12.39 ng/mL). The pharmacokinetic parameters obtained revealed that AT-MNPs enhanced the maximum AT concentration and prolonged the half-life of AT, resulting in a sustained release effect.
Discussion
Lung cancer is the leading cause of cancer-related death in humans, and its incidence and mortality continue to increase across the world.1,38 NSCLC is the most common type of lung cancer, accounting for 80% of the disease.2,39 Recently, though advanced progress has been made for experimental and clinical oncology, NSCLC prognosis remains unsatisfactory, and the 5-year survival rate remains at 15%.40 Therefore, identification of effective therapeutic strategies and understanding the molecular mechanism of NSCLC for progression are still urgently required for generating better treatments. AT is an active component isolated from plants, which has been reported to suppress human breast cancer-cell proliferation through endoplasmic reticulum (ER) stress modulation.20,41 However, until now, little has been known on whether AT could be worthwhile in treating NSCLC.
The magnetism feature of MNPs is usually from the metallic compounds of the NPs, which are easy to aggregate.17,18,42 MNPs with controllable size and magnetic properties may be used in drug delivery, detection of proteins, and biological labels.43,44 Furthermore, the metallic elements are reactive in biological processes and are prone to degradation. As such, organic or inorganic protective coatings, such as micelles, silica, and lipid layers, have attracted attention for research and development.18,45 Fe3O4 MNPs have been reported to induce apoptosis in HCC cells via combination with an active component of gamboge.46 Herein, we attempted to develop a new method for treating NSCLC through the combination of a bioactive component, AT, with Fe3O4 MNPs. The findings in our study might supply deep insights into the application of AT and NP combination for lung cancer therapy. We found that both AT and MNP single therapies, as well the combination therapy, showed antitumor effects in lung cancer in vitro and in vivo. However, the inhibitory degree of AT and MNPs to lung cancer in vitro was different from that in vivo, which is likely due to the inherent differences of sample in vitro systems vs complex in vivo systems. The sensitivity of AT and MNPs to specimens is different, contributing to significantly different values between them.
In this study, AT and Fe3O4 MNPs alone suppressed NSCLC cell proliferation in A549 and H1975 without cytotoxicity in normal lung epithelial cells. AT-MNPs showed a considerably stronger role in inhibiting NSCLC proliferation. Our mechanistic study indicated that caspase 8, caspase 9, caspase 3, Bax, TRAIL, p53, DRs, and FADD were upregulated, whereas Bcl2 and BclXL were downregulated following AT-MNP therapy, suggesting that this signaling pathway was involved in AT-MNP-regulated NSCLC development. In addition, the ability of AT-MNPs in suppressing NSCLC was further confirmed by an in vivo study in nude mice, wherein AT-MNPs inhibited tumor growth at a higher rate than either monotherapy. In addition, H&E staining of livers showed that noticeable signals of injury or damage were observed in mice from each group, indicating no evident toxicity induction by AT-MNPs. Furthermore, MTT assays showed no significant cell death was exhibited after AT, MNP, or AT-MNP treatment in normal liver cells from human, mouse, and rat. Therefore, AT-MNPs may be a novel option for NSCLC treatment.
We found that AT and MNP single treatments suppressed A549 and H1975 cell proliferation, and MNP monotherapy showed better antitumor effects on lung cancer cells. Recently, Wang et al showed that Fe3O4 MNPs exhibit an intrinsic enzyme-mimetic activity similar to that found in natural peroxidases, though MNPs are usually thought to be biologically and chemically inert. According to previous study, Fe3O4 promotes enzymatic oxidation by H2O2 generation.47,48 H2O2 is a typical oxidant, contributing to reactive oxygen species (ROS) generation. ROS are chemically reactive radicals, ions, or molecules containing free oxygen radicals and a by-product of normal metabolism. Basal levels of ROS activate numerous signaling cascades to promote cell proliferation under normal physiological conditions.49–51 However, excessive ROS levels induce oxidative stress and directly attack DNA, protein, lipids, and other cellular components, ultimately contributing to cell senescence and apoptosis.52,53 Therefore, inducing ROS generation is an effective therapeutic strategy for various tumor treatments. H2O2 levels in our study were detected. The results indicated that Fe3O4 MNPs (20 μg/mL) significantly upregulated H2O2activity, supporting ROS generation (Figure S5). Therefore, the antitumor effects of Fe3O4 in lung cancer might be associated with ROS production. However, additional studies are required to clarify the comprehensive molecular mechanism by which Fe3O4 performed its antitumor role in regulating ROS production. In comparison with AT and MNP single treatments, the combination therapy at lower concentrations showed a stronger inhibitory role in cancer cell proliferation, triggering considerable apoptosis in lung cancer cells. Caspases are well known to play an important role in apoptosis induction via TRAIL receptors, as well as mitochondrial signaling pathways.39,54,55 In order to explore the molecular mechanism by which AT-MNPs suppressed lung cancer proliferation, the activity of caspase 8, caspase 9, and caspase 3 was detected through Western blot analysis. The results illustrated that AT-MNP-induced apoptosis was dependent on caspase 8, caspase 9, and caspase 3 activation. Subsequently, nuclear condensation was induced for caspase 3 activity, resulting in apoptosis in NSCLC cells. Caspase 8 is crucial in mediating apoptosis through the mitochondrial pathway. The Bax:Bcl2 ratio is also crucial in mediating apoptosis via proapoptotic and antiapoptotic signals released from the mitochondria.32,56 Increased proapoptotic molecules, including Bax and Bad, induce apoptosis, whereas promotion of antiapoptotic signals, eg, Bcl2 and BclXL, protects the cell from death.32,56,57 Herein, AT-MNPs downregulated Bcl2- and BclXL-expression levels, whereas Bax and Bad were significantly upregulated, increasing the ratio of Bax:Bcl2 and thus contributing to apoptosis, which was in line with TUNEL and flow cytometry results in NSCLC cells.
P53, an essential tumor inhibitor, suppresses cancer cell proliferation through cell cycle arrest modulation and apoptosis mediation responding to various cellular stresses, such as DNA damage and genomic aberrations.58–60 TRAIL, a member of the TNF superfamily, induces rapid apoptosis via interaction with DRs, including DR4 and DR5. TRAIL preferentially inhibits cancer cells over other normal cells, suggesting its possible role in antitumor treatment.35,36,61,62 DR4 and DR5 activation could recruit FADD as well as caspase 8, leading to caspase 3 activation and eventually apoptosis (Figure 11).34,63,64 Our study suggested that AT-MNPs significantly upregulated p53 levels in a dose- and time-dependent manner. In agreement with this, our in vivo study also showed that p53 was apparently upregulated, as shown in the Western blot and IHC analyses. Consistently, TRAIL, DR4, and FADD protein levels were significantly increased with AT-Fe3O4 MNP treatment. Similar results were observed in in vivo experiments, where TRAIL and FADD mRNA levels were substantially enhanced. In order to confirm whether p53 was the key point in AT-MNP-induced apoptosis, NSCLC cells were treated with the p53 inhibitor PFTα in the presence of AT-MNP therapy. The data illustrated that PFTα significantly reversed the high expression of p53 induced by AT-MNP treatment. Additionally, mRNA levels of DR4, DR5, and TRAIL were in line with p53 alterations, showing reduced levels after PFTα treatment in vitro. Additionally, p53 knockdown showed similar results with PFTα treatment. Finally, the status of MDM2, an oncogene, was investigated to confirm the alteration of p53 after AT and MNP treatment in single or combination therapy. MDM2 is an E3 ubiquitin ligase that binds to p53 to promote degradation of the protein.37,65 Overexpression of MDM2 is often found in certain types of cancers, indicating that MDM2 has an important role in tumorigenesis.66 It has been reported that inhibition of MDM2 expression in cancer cells can reactivate p53, leading to apoptosis.67 Consistent with previous studies, in our study the expression of MDM2 was reduced after AT-MNP treatment in vitro and in vivo, an alteration that was opposite to p53 expression in our study. The results obviously show that p53 is of great importance in AT-MNP treatment.
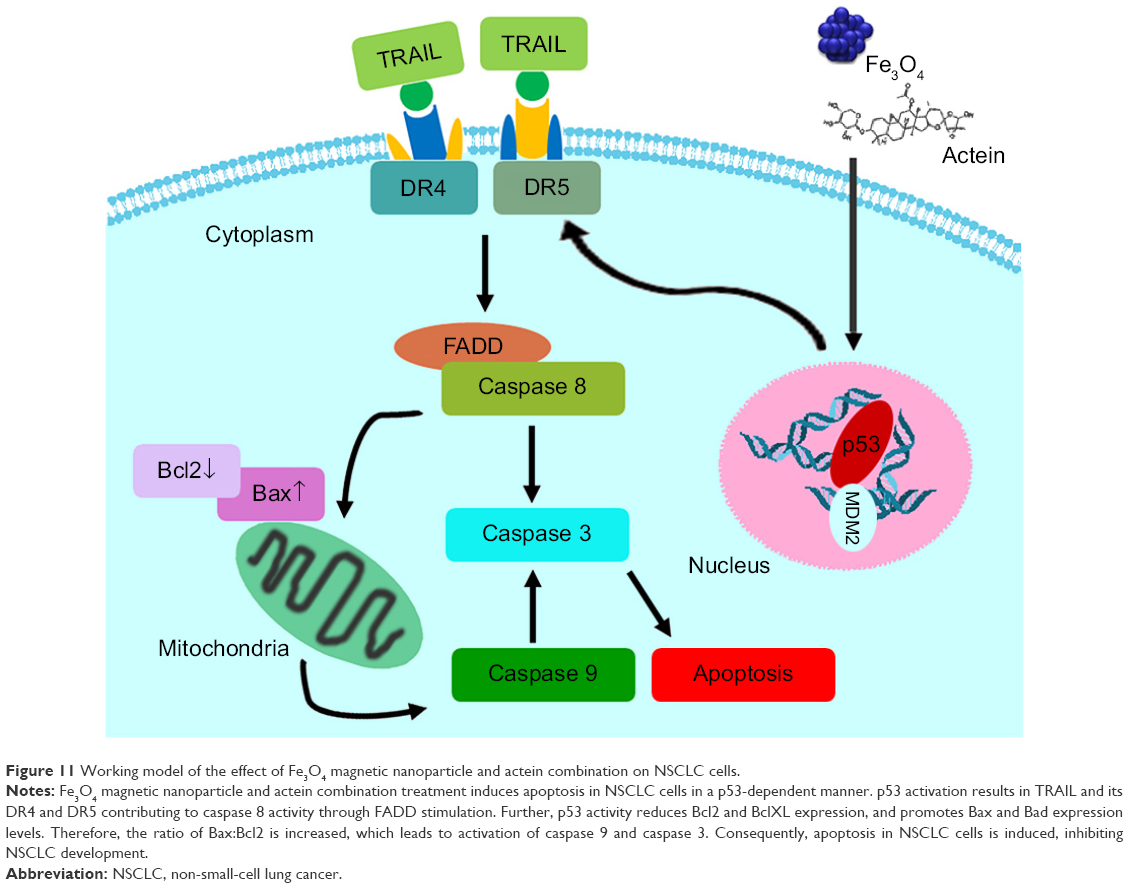 | Figure 11 Working model of the effect of Fe3O4 magnetic nanoparticle and actein combination on NSCLC cells. |
Taken together, our findings indicated that AT-MNP treatment inhibited NSCLC progression in vitro and in vivo, and was dependent on the p53-signaling pathway, promoting apoptosis in NSCLC cells without toxicity in normal cells or organs. Furthermore, the sustained release effects of AT-MNPs were demonstrated directly in vivo. AT-MNPs displayed a prolonged retention time and higher maximum concentration in plasma compared to AT treatment alone. In all, our study provides evidence that the use of AT in combination with Fe3O4 MNPs has a potential clinical value in suppressing NSCLC progression.
Acknowledgment
We thank LetPub (www.letpub.com) for its linguistic assistance during the preparation of this manuscript.
Disclosure
The authors report no conflicts of interest in this work.
References
Iachina M, Green A, Jakobsen E. The direct and indirect impact of comorbidity on the survival of patients with non-small cell lung cancer: a combination of survival, staging and resection models with missing measurements in covariates. BMJ Open. 2014;4(2):e003846. | ||
Lüchtenborg M, Jakobsen E, Krasnik M, Linklater KM, Mellemgaard A, Møller H. The effect of comorbidity on stage-specific survival in resected non-small cell lung cancer patients. Eur J Cancer. 2012;48(18):3386–3395. | ||
Cheng TYD, Cramb SM, Baade PD, et al. The international epidemiology of lung cancer: latest trends, disparities, and tumor characteristics. J Thorac Oncol. 2016;11:1653–1671. | ||
Mazieres J, Peters S, Lepage B, et al. Lung cancer that harbors an HER2 mutation: epidemiologic characteristics and therapeutic perspectives. J Clin Oncol. 2013;31:1997–2003. | ||
Jakobsen E, Green A, Oesterlind K, Rasmussen TR, Iachina M, Palshof T. Nationwide quality improvement in lung cancer care: the Danish Lung Cancer Registry. J Thorac Oncol. 2013;8(10):1238–1247. | ||
Li JX, Yu ZY. Cimicifugae rhizoma: from origins, bioactive constituents to clinical outcomes. Curr Med Chem. 2006;13(24):2927–2951. | ||
Sakurai N, Kozuka M, Tokuda H, et al. Cancer preventive agents – part 1: chemopreventive potential of cimigenol, cimigenol-3, 15-dione, and related compounds. Bioorg Med Chem. 2005;13(4):1403–1408. | ||
Lee YS, Choi EM. Actein isolated from black cohosh promotes the function of osteoblastic MC3T3-E1 cells. J Med Food. 2014;17(4):414–423. | ||
Einbond LS, Shimizu M, Xiao D, et al. Growth inhibitory activity of extracts and purified components of black cohosh on human breast cancer cells. Breast Cancer Res Treat. 2004;83(3):221–231. | ||
Enbom ET, Le MD, Oesterich L, Rutgers J, French SW. Mechanism of hepatotoxicity due to black cohosh (Cimicifuga racemosa): histological, immunohistochemical and electron microscopy analysis of two liver biopsies with clinical correlation. Exp Mol Pathol. 2014;96(3):279–283. | ||
Fang ZZ, Nian Y, Li W, et al. Cycloartane triterpenoids from Cimicifuga yunnanensis induce apoptosis of breast cancer cells (MCF7) via p53-dependent mitochondrial signaling pathway. Phytother Res. 2011;25(1):17–24. | ||
Einbond LS, Shimizu M, Ma H, et al. Actein inhibits the Na+-K+-ATPase and enhances the growth inhibitory effect of digitoxin on human breast cancer cells. Biochem Biophys Res Commun. 2008;375(4):608–613. | ||
Minciullo PL, Saija A, Patafi M, Marotta G, Ferlazzo B, Gangemi S. Muscle damage induced by black cohosh (Cimicifuga racemosa). Phytomedicine. 2006;13(1):115–118. | ||
Einbond LS, Soffritti M, Degli Esposti D, et al. Pharmacological mechanisms of black cohosh in Sprague-Dawley rats. Fitoterapia. 2012;83(3):461–468. | ||
Hu Y, Meng L, Niu L, Lu QH. Highly cross-linked and biocompatible polyphosphazene-coated superparamagnetic Fe3O4 nanoparticles for magnetic resonance imaging. Langmuir. 2013;29(29):9156–9163. | ||
Leach MJ, Moore V. Black cohosh (Cimicifuga spp.) for menopausal symptoms. Cochrane Database Syst Rev. 2012;(9):CD007244. | ||
Nejati-Koshki K, Mesgari M, Ebrahimi E, et al. Synthesis and in vitro study of cisplatin-loaded Fe3O4 nanoparticles modified with PLGA-PEG6000 copolymers in treatment of lung cancer. J Microencapsul. 2014;31(8):815–823. | ||
An Q, Sun C, Li D, Xu K, Guo J, Wang CC. Peroxidase-like activity of Fe3O4@carbon nanoparticles enhances ascorbic acid-induced oxidative stress and selective damage to PC-3 prostate cancer cells. ACS Appl Mater Interfaces. 2013;5(24):13248–13257. | ||
Kitture R, Ghosh S, Kulkarni P, et al. Fe3O4-citrate-curcumin: promising conjugates for superoxide scavenging, tumor suppression and cancer hyperthermia. J Appl Phys. 2012;111(6):064702. | ||
Einbond LS, Mighty J, Redenti S, Wu HA. Actein induces calcium release in human breast cancer cells. Fitoterapia. 2013;91:28–38. | ||
Tian L, Chen B, Cheng J, Guo QL. Effects of magnetic nanoparticles of Fe3O4 combinated [sic] with gambogic acid on apoptosis of SMMC-7721 cells. Onco Targets Ther. 2015;8:2285–2290. | ||
Gao H, Wang JY, Shen XZ, Deng YH, Zhang W. Preparation of magnetic polybutylcyanoacrylate nanospheres encapsulated with aclacinomycin A and its effect on gastric tumor. World J Gastroenterol. 2004;10(14):2010–2013. | ||
Yue GG, Xie S, Lee JK, et al. New potential beneficial effects of actein, a triterpene glycoside isolated from Cimicifuga species, in breast cancer treatment. Sci Rep. 2016;6:35263. | ||
Ankamwar B, Lai TC, Huang JH, et al. Biocompatibility of Fe3O4 nanoparticles evaluated by in vitro cytotoxicity assays using normal, glia and breast cancer cells. Nanotechnology. 2010;21(7):075102. | ||
Shirali S, Aghaei M, Shabani M, Fathi M, Sohrabi M, Moeinifard M. Adenosine induces cell cycle arrest and apoptosis via cyclin D1/Cdk4 and Bcl-2/Bax pathways in human ovarian cancer cell line OVCAR-3. Tumour Biol. 2013;34(2):1085–1095. | ||
Wang W, Wang C, Ding XQ, et al. Quercetin and allopurinol reduce liver thioredoxin-interacting protein to alleviate inflammation and lipid accumulation in diabetic rats. Br J Pharmacol. 2013;169(6):1352–1371. | ||
Ma P, Luo Q, Chen J, et al. Intraperitoneal injection of magnetic Fe3O4-nanoparticle induces hepatic and renal tissue injury via oxidative stress in mice. Int J Nanomedicine. 2012;7:4809–4818. | ||
Bruna J, Udina E, Alé A, et al. Neurophysiological, histological and immunohistochemical characterization of bortezomib-induced neuropathy in mice. Exp Neurol. 2010;223(2):599–608. | ||
Filippi-Chiela EC, Oliveira MM, Jurkovski B, Callegari-Jacques SM, da Silva VD, Lenz G. Nuclear morphometric analysis (NMA): screening of senescence, apoptosis and nuclear irregularities. PLoS One. 2012;7(8):e42522. | ||
Takaki K, Higuchi Y, Hashii M, Ogino C, Shimizu N. Induction of apoptosis associated with chromosomal DNA fragmentation and caspase-3 activation in leukemia L1210 cells by TiO2 nanoparticles. J Biosci Bioeng. 2014;117(1):129–133. | ||
Gringhuis SI, Kaptein TM, Wevers BA, et al. Dectin-1 is an extracellular pathogen sensor for the induction and processing of IL-1β via a noncanonical caspase-8 inflammasome. Nat Immunol. 2012;13(3):246–254. | ||
Leverson JD, Phillips DC, Mitten MJ, et al. Exploiting selective BCL-2 family inhibitors to dissect cell survival dependencies and define improved strategies for cancer therapy. Sci Transl Med. 2015;7(279):279ra40. | ||
Galski H, Oved-Gelber T, Simanovsky M, Lazarovici P, Gottesman MM, Nagler A. P-glycoprotein-dependent resistance of cancer cells toward the extrinsic trail apoptosis signaling pathway. Biochem Pharmacol. 2013;86(5):584–596. | ||
Dillon CP, Oberst A, Weinlich R, et al. Survival function of the FADD-caspase-8-cFLIPL complex. Cell Rep. 2012;1(5):401–407. | ||
Lee CF, Yang JS, Tsai FJ, et al. Kaempferol induces ATM/p53-mediated death receptor and mitochondrial apoptosis in human umbilical vein endothelial cells. Int J Oncol. 2016;48(5):2007–2014. | ||
Azijli K, Weyhenmeyer B, Peters GJ, Jong SD, Kruyt FA. Non-canonical kinase signaling by the death ligand TRAIL in cancer cells: discord in the death receptor family. Cell Death Differ. 2013;20(7):858–868. | ||
Zhang J, Sun Q, Zhang Z, Ge S, Han ZG, Chen WT. Loss of microRNA-143/145 disturbs cellular growth and apoptosis of human epithelial cancers by impairing the MDM2-p53 feedback loop. Oncogene. 2013;32(1):61–69. | ||
Mellemgaard A, Lüchtenborg M, Iachina M, et al. Role of comorbidity on survival after radio- and chemotherapy for non-surgically treated lung cancer. J Thorac Oncol. 2015;10(2):272–279. | ||
Pallis AG, Syrigos KN. Epidermal growth factor receptor tyrosine kinase inhibitors in the treatment of NSCLC. Lung Cancer. 2013;80(2):120–130. | ||
Yang L, Ren B, Li H, et al. Enhanced antitumor effects of DC-activated CIKs to chemotherapy treatment in a single cohort of advanced non-small-cell lung cancer patients. Cancer Immunol Immunother. 2013;62(1):65–73. | ||
Einbond LS, Shimizu M, Nuntanakorn P, et al. Actein and a fraction of black cohosh potentiate antiproliferative effects of chemotherapy agents on human breast cancer cells. Planta Med. 2006;72:1200–1206. | ||
Abellán G, Carrasco JA, Coronado E. Room temperature magnetism in layered double hydroxides due to magnetic nanoparticles. Inorg Chem. 2013;52(14):7828–7830. | ||
Mody VV, Cox A, Shah S, Singh A, Bevins W, Parihar H. Magnetic nanoparticle drug delivery systems for targeting tumor. Appl Nanosci. 2014;4(4):385–392. | ||
Mura S, Nicolas J, Couvreur P. Stimuli-responsive nanocarriers for drug delivery. Nat Mater. 2013;12(11):991–1003. | ||
Kainz QM, Reiser O. Polymer-and dendrimer-coated magnetic nanoparticles as versatile supports for catalysts, scavengers, and reagents. Acc Chem Res. 2014;47(2):667–677. | ||
Doğaç YI, Çinar M, Teke M. Improving of catalase stability properties by encapsulation in alginate/Fe3O4 magnetic composite beads for enzymatic removal of H2O2. Prep Biochem Biotechnol. 2015;45(2):144–157. | ||
Wang N, Zhu L, Wang M, Wang D, Tang H. Sono-enhanced degradation of dye pollutants with the use of H2O2 activated by Fe3O4 magnetic nanoparticles as peroxidase mimetic. Ultrason Sonochem. 2010;17(1):78–83. | ||
Sadri F, Ramazani A, Massoudi A, et al. Green oxidation of alcohols by using hydrogen peroxide in water in the presence of magnetic Fe3O4 nanoparticles as recoverable catalyst. Green Chem Lett Rev. 2014;7(3):257–264. | ||
Khan MI, Mohammad A, Patil G, Naqvi SA, Chauhan LK, Ahmad I. Induction of ROS, mitochondrial damage and autophagy in lung epithelial cancer cells by iron oxide nanoparticles. Biomaterials. 2012;33(5):1477–1488. | ||
Swalwell H, Latimer J, Haywood RM, Haywood RM, Birch-Machin MA. Investigating the role of melanin in UVA/UVB-and hydrogen peroxide-induced cellular and mitochondrial ROS production and mitochondrial DNA damage in human melanoma cells. Free Radic Biol Med. 2012;52(3):626–634. | ||
Cao S, Wang Y, Peng X. ROS-inducible DNA cross-linking agent as a new anticancer prodrug building block. Chemistry. 2012;18(13):3850–3854. | ||
Pan X, Zhang X, Sun H, Zhang J, Yan M, Zhang H. Autophagy inhibition promotes 5-fluorouraci[sic]-induced apoptosis by stimulating ROS formation in human non-small cell lung cancer A549 cells. PloS One. 2013;8(2):e56679. | ||
Shin S, Jing K, Jeong S, et al. The omega-3 polyunsaturated fatty acid DHA induces simultaneous apoptosis and autophagy via mitochondrial ROS-mediated Akt-mTOR signaling in prostate cancer cells expressing mutant p53. Biomed Res Int. 2013;2013:568671. | ||
Zhang M, Harashima N, Moritani T, Huang WD, Harada M. The roles of ROS and caspases in TRAIL-induced apoptosis and necroptosis in human pancreatic cancer cells. PloS One. 2015;10(5):e0127386. | ||
Lee DH, Kim DW, Lee HC, Lee JH, Lee TH. Phenethyl isothiocyanate sensitizes glioma cells to TRAIL-induced apoptosis. Biochem Biophys Res Commun. 2014;446(4):815–821. | ||
Hoshyar R, Bathaie SZ, Sadeghizadeh M. Crocin triggers the apoptosis through increasing the Bax/Bcl-2 ratio and caspase activation in human gastric adenocarcinoma, AGS, cells. DNA Cell Biol. 2013;32(2):50–57. | ||
Jiang H, Zhao PJ, Su D, Feng JG, Ma SL. Paris saponin I induces apoptosis via increasing the Bax/Bcl-2 ratio and caspase-3 expression in gefitinib-resistant non-small cell lung cancer in vitro and in vivo. Mol Med Rep. 2014;9(6):2265–2272. | ||
Zhang EB, Yin DD, Sun M, et al. P53-regulated long non-coding RNA TUG1 affects cell proliferation in human non-small cell lung cancer, partly through epigenetically regulating HOXB7 expression. Cell Death Dis. 2014;5(5):e1243. | ||
Loayza-Puch F, Drost J, Rooijers K, Lopes R, Elkon R, Agami R. P53 induces transcriptional and translational programs to suppress cell proliferation and growth. Genome Biol. 2013;14(4):R32. | ||
Lu K, Li W, Liu X, et al. Long non-coding RNA MEG3 inhibits NSCLC cells proliferation and induces apoptosis by affecting p53 expression. BMC Cancer. 2013;13:461. | ||
Razumilava N, Bronk SF, Smoot RL, et al. miR-25 targets TNF-related apoptosis inducing ligand (TRAIL) death receptor-4 and promotes apoptosis resistance in cholangiocarcinoma. Hepatology. 2012;55(2):465–475. | ||
Akram KM, Lomas NJ, Forsyth NR, Spiteri M. Alveolar epithelial cells in idiopathic pulmonary fibrosis display upregulation of TRAIL, DR4 and DR5 expression with simultaneous preferential over-expression of pro-apoptotic marker p53. Int J Clin Exp Pathol. 2014;7(2):552–564. | ||
Hu Q, Cui X, Tao L, Xiu L, Wang T, Wang X. Staphylococcus aureus induces apoptosis in primary bovine mammary epithelial cells through Fas-FADD death receptor-linked caspase-8 signaling. DNA Cell Biol. 2014;33(6):388–397. | ||
Lu M, Lawrence DA, Marsters S, Alvear DA, Kimmig P. Opposing unfolded-protein-response signals converge on death receptor 5 to control apoptosis. Science. 2014;345(6192):98–101. | ||
Shangary S, Wang S. Targeting the MDM2-p53 interaction for cancer therapy. Clin Cancer Res. 2008;14(17):5318–5324. | ||
Liu Y, Chen Y, Lu X, Duan Y, Cheng C, Shen A. SCYL1BP1 modulates neurite outgrowth and regeneration by regulating the Mdm2/p53 pathway. Mol Biol Cell. 2012;23(23):4506–4514. | ||
Nag S, Zhang X, Srivenugopal KS, Wang MH, Wang W, Zhang R. Targeting MDM2-p53 interaction for cancer therapy: are we there yet? Curr Med Chem. 2014;21(5):553–574. |
Supplementary materials
Small interfering RNAs
siRNA sequences against human p53 and negative silencing were chemically synthesized by GenePharma (Shanghai, China). siRNA sequences were as follows: 1, p53 siRNA, UUC UAA GAG UCC UGC CCA G; 2, p53 siRNA, UCC UCA GAU CAU GAG CUG CAG; 3, p53 siRNA, UCA UGA GUC GCC UAC ACU UCG G; and negative control siRNA, TCA AGC ACG TCT CCA AGT C. A549 cells were plated on six-well plates at 3×10⁵ cells per well and transfected with 100 pmol siRNA duplex per well using Lipofectamine 2000 (Thermo Fisher Scientific, Waltham, MA, USA) following the manufacturer’s instructions. Cells were harvested 48 hours after transfection.
Pharmacokinetic parameter assessment
To study the release properties of AT-MNPs in vivo, 150 male C57BL/6 mice 6–8 weeks old were divided into two groups: Group 1 received AT (15 mg/kg) intraperitoneally, whereas group 2 received AT-MNPs (15 and 20 mg/kg). Blood was extracted at various time points (0.5, 1, 2, 2.5, 3, 3.5, 4, 4.5, 5, 5.5, 6, 6.5, 7, 7.5, 8, 8.5, 9, 9.5, 10, 10.5, 11, 11.5, 12, and 12.5 hours) after feeding and frozen at −80°C. All measurements were made by high-performance liquid chromatography.
H2O2 detection
A549 and H1975 cells were seeded in 96-well plates and incubated for 24 hours in complete medium in the presence or absence of MNPs (20 μg/mL). Cells were washed in PBS and incubated with 100 μL/well of 5 μM 2′,7′-dichlorodihydrofluorescein diacetate diluted in PBS (Thermo Fisher Scientific). H2O2 levels were assayed by spectrofluorometry on a fusion spectrofluorometer (Packard Bell, Nijmegen, the Netherlands). Fluorescence intensity was recorded every hour over a period of 5 hours. Excitation and emission wavelengths used for H2O2 were 485 and 530 nm. The number of cells was evaluated by crystal violet assay. Cells were stained in 0.05% crystal violet and 2% ethanol in PBS for 30 minutes at room temperature. After four washes in PBS, the stain was dissolved in methanol and measured at 550 nm by spectrofluorometry. The level of H2O2 was calculated in each sample as follows: reactive oxygen species rate (arbitrary units/min per 105 cells) = (fluorescence intensity [arbitrary units] at 300 minutes – fluorescence intensity [arbitrary units] at 0 minutes) per 60 minutes per number of cells, as measured by the crystal violet assay.
 | Figure S1 P53 knockdown reduced Fe3O4 AT-MNP-induced apoptosis. |
 | Figure S2 Effects of Fe3O4 AT-MNPs on cell viability. |
 | Figure S3 Fe3O4 AT-MNPs inhibited NSCLC via MDM2 suppression. |
 | Figure S4 Concentration of AT in plasma versus time. |
 | Figure S5 Fe3O4 MNP administration enhanced H2O2 levels in lung cancer cells. |
 © 2017 The Author(s). This work is published and licensed by Dove Medical Press Limited. The full terms of this license are available at https://www.dovepress.com/terms.php and incorporate the Creative Commons Attribution - Non Commercial (unported, v3.0) License.
By accessing the work you hereby accept the Terms. Non-commercial uses of the work are permitted without any further permission from Dove Medical Press Limited, provided the work is properly attributed. For permission for commercial use of this work, please see paragraphs 4.2 and 5 of our Terms.
© 2017 The Author(s). This work is published and licensed by Dove Medical Press Limited. The full terms of this license are available at https://www.dovepress.com/terms.php and incorporate the Creative Commons Attribution - Non Commercial (unported, v3.0) License.
By accessing the work you hereby accept the Terms. Non-commercial uses of the work are permitted without any further permission from Dove Medical Press Limited, provided the work is properly attributed. For permission for commercial use of this work, please see paragraphs 4.2 and 5 of our Terms.