")
Back to Journals » International Journal of General Medicine » Volume 14
IQGAP3 May Serve as a Promising Biomarker in Clear Cell Renal Cell Carcinoma
Authors Meng Q, Li CX, Long D, Lin X
Received 17 April 2021
Accepted for publication 1 July 2021
Published 14 July 2021 Volume 2021:14 Pages 3469—3484
DOI https://doi.org/10.2147/IJGM.S316280
Checked for plagiarism Yes
Review by Single anonymous peer review
Peer reviewer comments 2
Editor who approved publication: Dr Scott Fraser
Quan Meng,1,* Can-Xuan Li,2,* Dan Long,3 Xiaobin Lin4
1Department of Clinical Laboratory, Shenzhen Traditional Chinese Medical Hospital, Shenzhen, Guangdong, People’s Republic of China; 2Department of urology, Shenshan Central Hospital, Sun Yat-Sen Memorial Hospital, Sun Yat-Sen University, Shanwei, Guangdong, People’s Republic of China; 3Respiratory Medicine, Shenshan Central Hospital, Sun Yat-Sen Memorial Hospital, Sun Yat-Sen University, Shanwei, Guangdong, People’s Republic of China; 4Department of Breast Surgery and General Surgery, Guangzhou Women and Children’s Medical Center, Guangzhou Medical University, Guangzhou, Guangdong, People’s Republic of China
*These authors contributed equally to this work
Correspondence: Xiaobin Lin
Department of Breast Surgery and General Surgery, Guangzhou Women and Children’s Medical Center, Guangzhou Medical University, Guangzhou, Guangdong, People’s Republic of China
Email [email protected]
Aim: The study was designed to mine the expression and roles of IQGAP3 in clear cell renal cell carcinoma (ccRCC).
Methods: Expression profiles and clinical information were obtained from the Cancer Genome Atlas (TCGA) to estimate IQGAP3 expression in ccRCC, its relationship with patients’ clinicopathological variables and prognosis, and the potential biological mechanisms.
Results: IQGAP3 was highly expressed in ccRCC and indicated advanced clinical outcome and poor prognosis. IQGAP3 affected the progression of ccRCC through several cancer-related pathways. IQGAP3 might play a vital role in the ccRCC tumor microenvironment.
Conclusion: IQGAP3 could serve as a promising prognostic biomarker and therapeutic target.
Keywords: IQGAP3, clear cell renal cell carcinoma, prognosis
Introduction
Clear cell renal cell carcinoma (ccRCC) accounts for 80% of renal malignancies and is one of the most common malignancies worldwide.1 Despite advances in diagnosis and treatment, the prognosis of advanced and metastatic ccRCC remains a challenge due to limited treatment options.2 Unlike most cancers, advanced ccRCC is resistant to chemotherapy and radiotherapy.3 Targeted therapy is a promising approach for these patients. Additionally, the use of immune checkpoint inhibitors has improved the prognosis of some patients. Nevertheless, the prognosis of these patients is poor.4 The exploration of new targeted molecular marker is still very urgent.
IQGAP3, a member of the IQGAP gene family, was reported to be responsible for modulating various cellular processes, including neuronal morphogenesis, cell proliferation and motility, and epithelial–mesenchymal transition.5,6 Emerging studies indicate that IQGAP3 has unfavorable effects in various tumors. For instance, IQGAP3 overexpression in gastric cancer cells led to morphological change with multiple dendritic-like protrusions and enhanced migration.7 IQGAP3 was highly expressed in lung cancer patients and associated with poor clinical outcomes, loss of IQGAP3 inhibited tumorigenesis in lung cancer and overcome radiation resistance in vivo and vitro.8 Additionally, IQGAP3 was highly expressed in pancreatic cancer and Hepatocellular carcinoma, and overexpression of IQGAP3 promoted the malignant phenotype of tumor cells.5,9 Although the crucial role of IQGAP3 in tumor occurrence and development, its expression level, prognostic role and potential mechanism in ccRCC still remains elusive.
With the development of high-throughput sequencing technology, a large number of tumor data are stored in publicly available well-known databases, such as the Cancer Genome Atlas (TCGA), International Cancer Genome Consortium (ICGC) and Gene Expression Omnibus (GEO). Researchers could mine these tumor data through bioinformatics technology to provide a theoretical basis for further experiments. Hence, we performed a comprehensive study to investigate the relationship between IQGAP3 and ccRCC.
Materials and Methods
Data Collection
RNA-seq data (HTSeq-FPKM data) was obtained from the TCGA database (https://portal.gdc.cancer.gov/).10 The patients with incomplete clinicopathological features were excluded, and finally 530 ccRCC samples and 72 normal samples were included in our present study. Corresponding clinical information of ccRCC patients is listed in Table 1. Additionally, gene expression data from the ICGC database, GSE53757 and GSE36895 was downloaded for further exploration. The ICGC database collects tumor data for 50 different cancer types (or subtypes), including abnormal gene expression, somatic mutations, epigenetic modifications, and clinical data.11 GSE53757 and GSE36895 were form the Gene Expression Omnibus, a public functional genomics data repository. GSE53757 and GSE36895 datasets were from the GPL570 platform ([HG-U133_Plus_2] Affymetrix Human Genome U133 Plus 2.0 Array), the former included 72 normal samples and 72 ccRCC samples,12 and 23 normal renal specimens and 32 ccRCC specimens.13,14
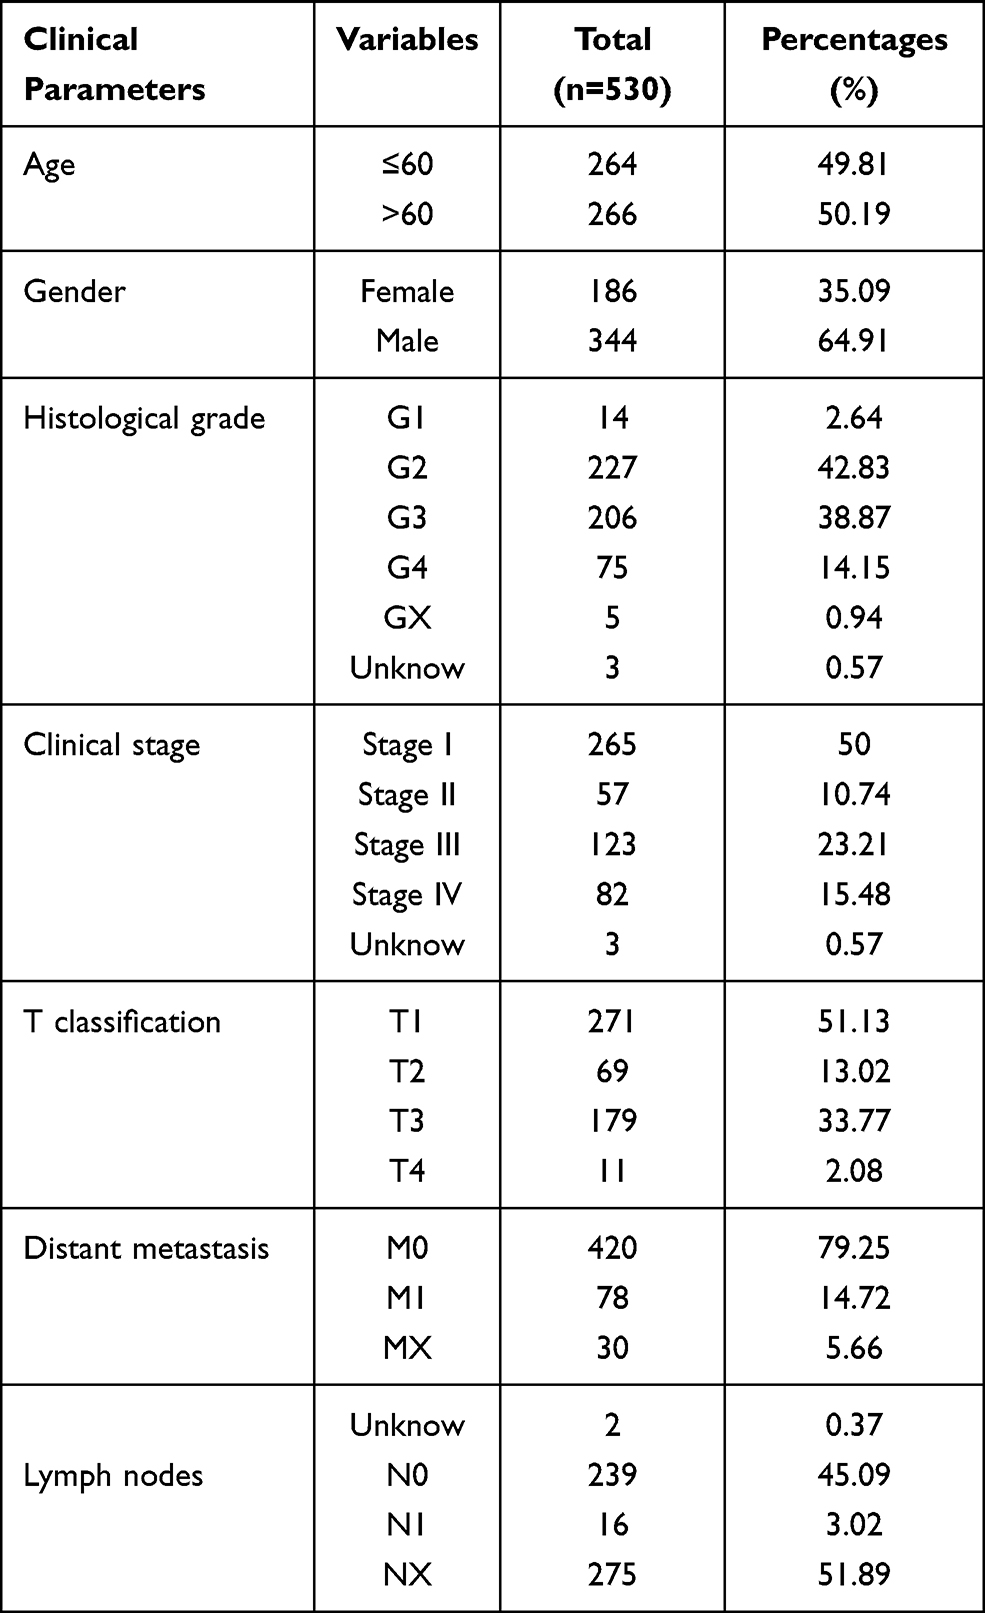 |
Table 1 Characteristics of Clear Cell Renal Cell Carcinoma Patients in the TCGA Database. TCGA, The Cancer Genome Atlas |
Database Analyses
TIMER (https://cistrome.shinyapps.io/timer/) is a web server for comprehensive analysis of tumor-infiltrating immune cells.15 “DiffExp” module allows users to study the differential expression between tumor and adjacent normal tissues for any gene of interest across all TCGA tumors. In the present study, we used the “DiffExp” module to determine differences IQGAP3 of expression in tumor and normal samples. UALCAN (http://ualcan.path.uab.edu/index.html) is a comprehensive, user-friendly, and interactive web resource. It now provides protein expression analysis option using data from Clinical Proteomic Tumor Analysis Consortium (CPTAC).16,17 The protein expression levels of IQGAP3 in ccRCC were estimated using UALCAN database. What is more, the representative IQGAP3 immunohistochemistry images were obtained from the Human Protein Atlas (HPA, https://www.proteinatlas.org/).18 The cBioPortal for cancer genomics (http://www.cbioportal.org/) is a powerful open-source database, which can provide multidimensional cancer genomics and clinical data retrieved from the TCGA database.11 Here, the kidney renal clear cell carcinoma ((TCGA, Firehose Legacy)) dataset, including data from 538 samples with pathology reports, was selected for further analyses of IQGAP3 using cBioPortal database. Metascape (https://metascape.org/gp/maintenance.html#/main/step1), a robust online database, integrates GO, KEGG, UniProt and Drugbank to complete not only pathway enrichment and biological process annotation, but also gene-related protein network analysis and drug analysis.19 In the study, we used the Metascape database to perform functional enrichment analysis to mine the potential mechanisms of IQGAP3 in ccRCC.
Association of IQGAP3 Expression with Tumor Immune Infiltrating Cells (TIICs) and Immunosuppressive Molecules
CIBERSORT is an analytical tool that could quantify immune infiltrating cell proportions based on normalized gene expression profiles.20 In the study, CIBERSORT computational method was employed to estimate the TIIC abundance profile in all ccRCC specimens. To improve the accuracy of the algorithm, only samples with CIBERSORT p < 0.05 in CIBERSORT analysis were considered eligible for analysis. Moreover, we estimated the association between IQGAP3 expression with several common immunosuppressive molecules.
Construction and Validation a Nomogram
Herein, all independent prognostic parameters generated through univariate Cox regression and multivariate Cox regression analysis were employed for building a predictive nomogram, which could predict 1-, 3-, and 5-year overall survival of patients with ccRCC in the TCGA dataset. Then, calibration curves were used to evaluate the consistency between the actual survival rate and the predicted survival rate.
Statistical Analysis
The Wilcoxon signed-rank test was employed to compare the expression levels of IQGAP3 in ccRCC samples with that in normal renal samples. The Wilcoxon signed-rank test, Kruskal–Wallis test, logistic regression and Fisher exact test or chi-square test were used to explore the association between clinicopathological features and IQGAP3. All patients were divided into high and low expression subgroups based on the median value of gene expression, Kaplan–Meier survival analysis with log rank test was utilized to assess the influence of IQGAP3 on overall survival of ccRCC patients. Univariate Cox regression and multivariate Cox analyses were carried out to identify the independent prognostic factors. Genes IQGAP3 were obtained by calculating Pearson correlation coefficient, genes that meet the criteria Pearson correlation coefficients >0.4 and p <0.001 were applied for further investigation. Wilcoxon signed-rank test was utilized to compare differences in immune cell subtypes in the high- and low IQGAP3 subgroups. Pearson correlation analysis was utilized to assess the association between IQGAP3 and immune checkpoints. P < 0.05 was considered to be statistically significant. All statistical analyses were carried out using R 3.6.1 software.
Results
IQGAP3 Was Highly Expressed in ccRCC
Using the TIMER database, we found that IQGAP3 was highly expressed in most malignancies, including ccRCC (Figure 1A). Transcriptome data from TCGA, ICGC, GSE53757 and GSE36895 demonstrated that IQGAP3 was significantly higher in ccRCC tissues than in adjacent normal tissues (Figure 1B–E). Additionally, the protein expression data from the UALCAN database showed that IQGAP3 was also highly expressed in ccRCC samples at the protein level in comparison with that in normal controls (Figure 1F). What is more, we obtained three representative IQGAP3 immunohistochemical images in ccRCC. The results showed that the IQGAP3 immunohistochemical staining in ccRCC tissues was “High” (Figure 1G–I); however, the IQGAP3 protein expression data in normal tissues could not be found in this database.
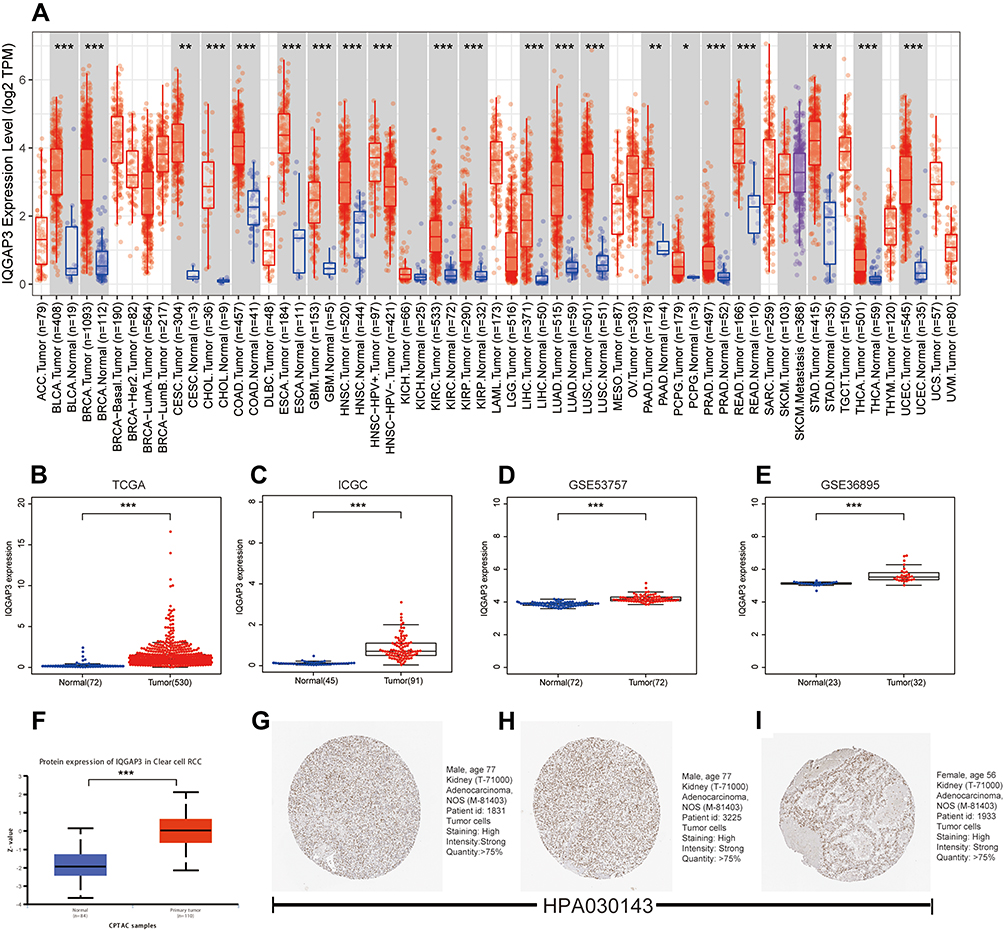 |
Figure 1 IQGAP3 were highly expressed in ccRCC samples. (A) IQGAP3 expression levels in different tumor types from TCGA database were determined by TIMER; (B–E) Data from TCGA, ICGC, GSE53757 and GSE36895 showed that IQGAP3 were highly expressed in ccRCC samples; (F) Based on the UALCAN database, we found that the expression levels of IQGAP3 protein were higher in ccRCC samples than that in normal renal tissues; (G–I) Representative immunohistochemical images derived from the HPA database showed that IQGAP3 protein was “high” immunohistochemical staining in ccRCC samples. Notes: *p < 0.05, **p < 0.01, ***p < 0.001. |
IQGAP3 Overexpression Was Significantly Correlated with Advanced Clinicopathological Features
Using the Wilcoxon signed-rank test and Kruskal–Wallis test methods, we found no statistically significant differences in IQGAP3 expression by age and gender (Figure 2A and B), whereas IQGAP3 was overexpressed in ccRCC patients of high clinical stage, histologic grade, and TNM classifications (Figure 2C–G). The logistic regression analysis results showed that IQGAP3 Overexpression was significantly associated with stage (OR = 1.773 for stage III vs I, p<0.01; OR = 3.784 for stage IV vs I, p<0.001); grade (OR = 4.369 for grade 3 vs 1, p<0.05; OR = 8.833 for grade 4 vs 1, p<0.01); T classification (OR = 2.394 for T3 vs T1, p<0.001; OR = 13.982 for T4 vs T1, p = p<0.05); N classification (OR = 7.805 for N1 vs N0, p<0.01); and M classification (OR =3.477 for M1 vs M0, p<0.001) (Table 2). The Fisher exact test or chi-square test analysis showed that the high expression of IQGAP3 was correlated with histological grade (p<0.01) and T stage (p<0.01) (Table 3).
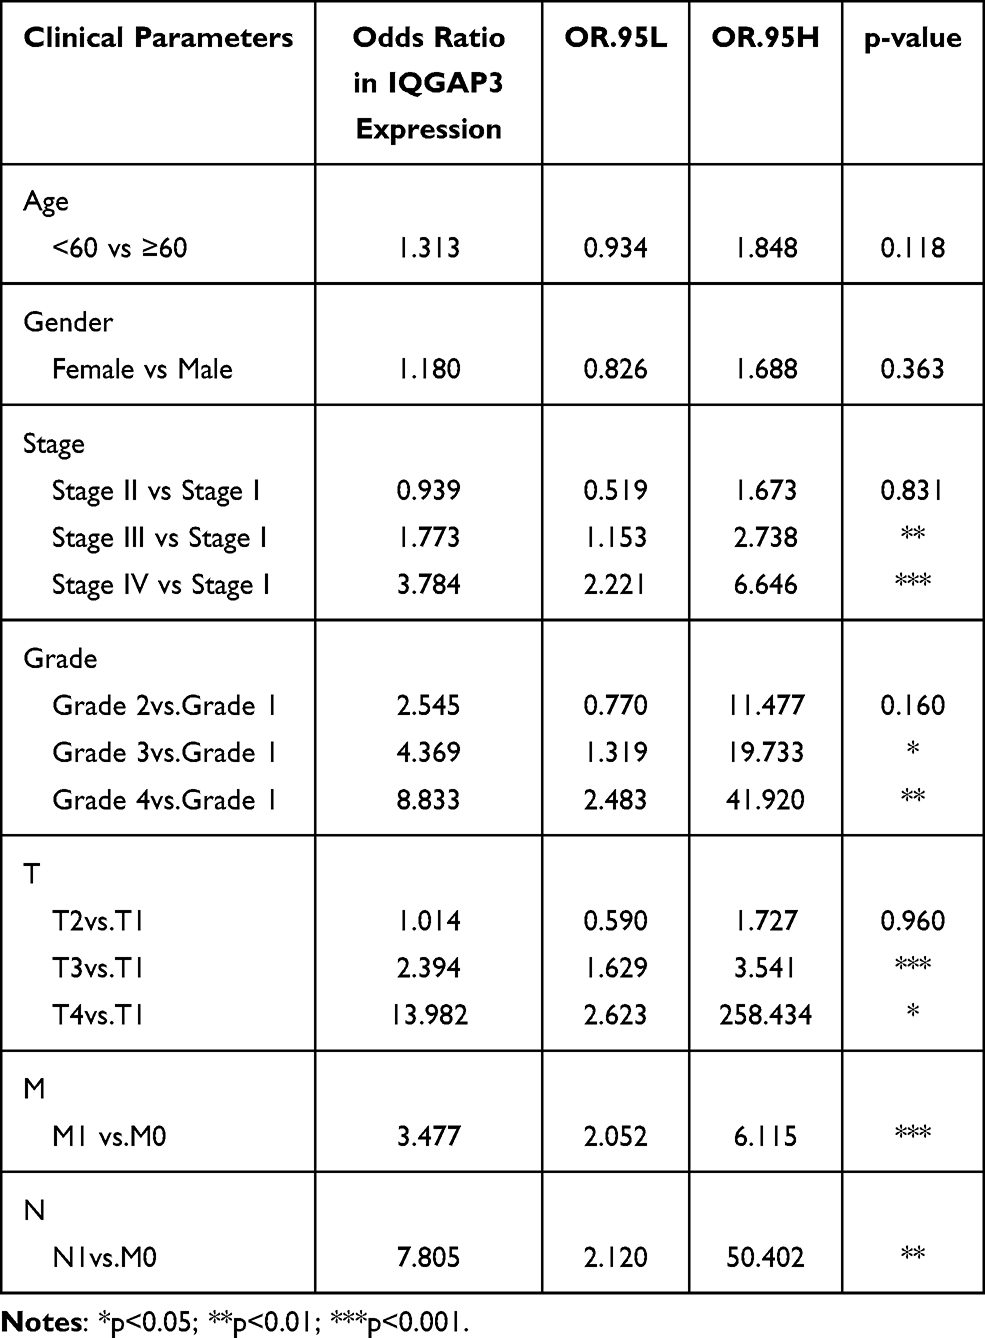 |
Table 2 Association of IQGAP3 Expression with Clinicopathological Characteristics (Logistic Regression Analysis) |
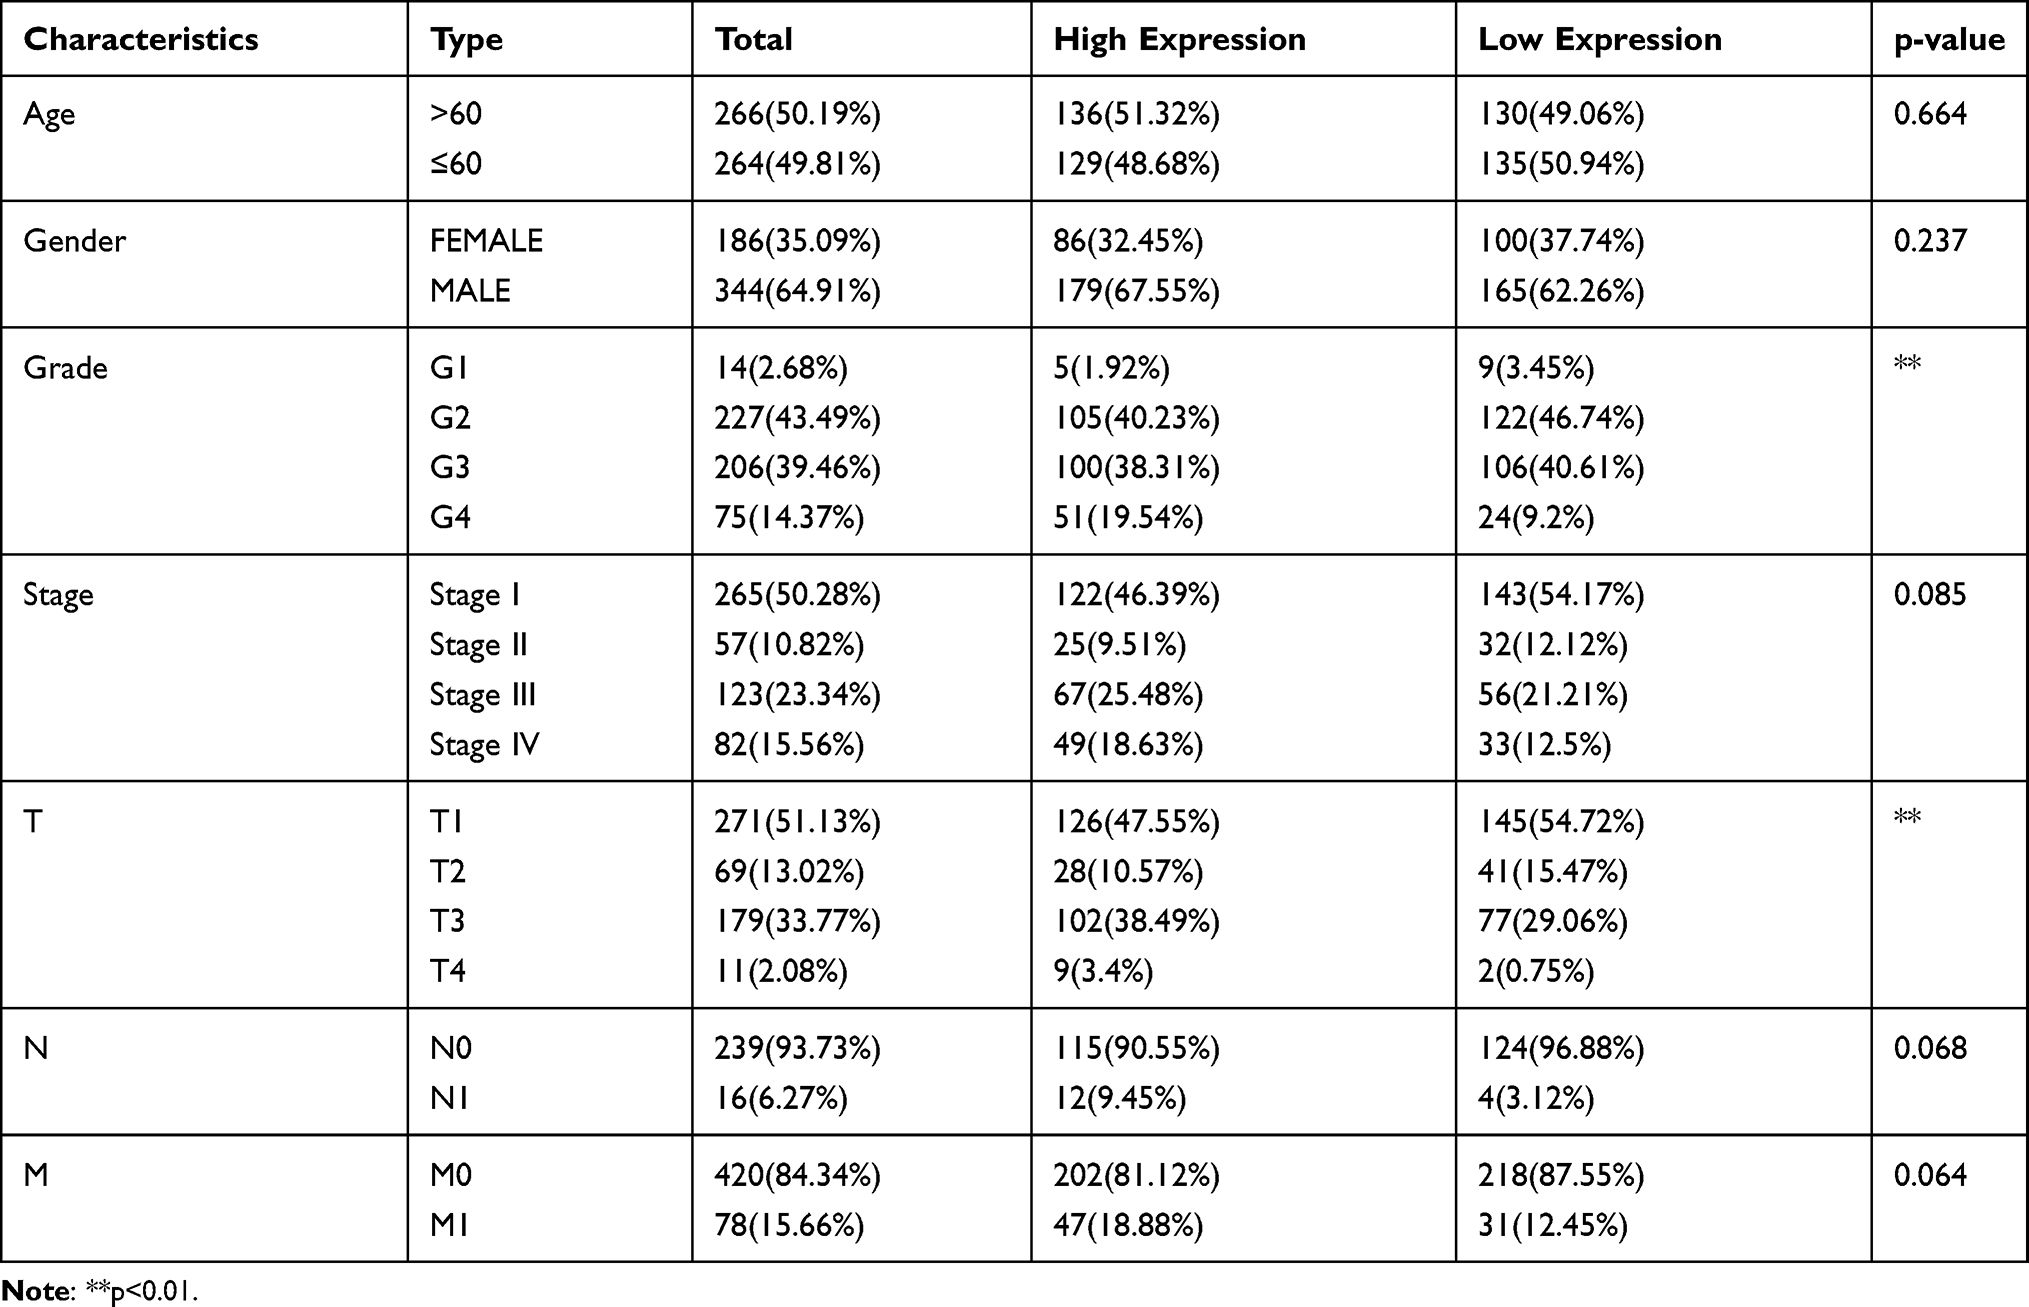 |
Table 3 Association of IQGAP3 Expression with Clinicopathological Characteristics (Fisher's Exact Test or Chi-Square Test) |
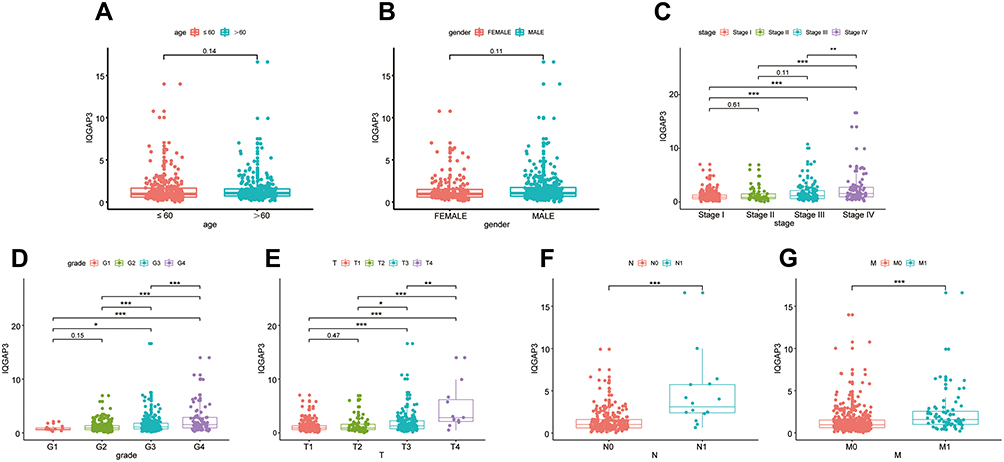 |
Figure 2 The relationship between IQGAP3 expression levels with clinical features of ccRCC. (A) Age; (B) Gender; (C) Stage; (D) Grade; (E) T stage; (F) N stage; (G) M stage. Notes: *p < 0.05, **p < 0.01, ***p < 0.001. |
Survival Outcomes and Cox Regression Analyses
Based on the median expression value of IQGAP3, all patients were divided into low- and high subgroups, Kaplan–Meier survival analysis was used to assess the prognosis value of IQGAP3 in ccRCC patients. Results revealed that compared with the low expression subgroup, patients of the high-IQGAP3 expression subgroup had a worse overall survival rate (p < 0.001) (Figure 3A). The univariate Cox regression analysis results indicated that upregulation of IQGAP3 was significantly associated with poor prognosis (HR = 2.027, p<0.001). Other clinical features, such as age, histologic grade, clinical stage, T stage, and M stage, were also found to have an unfavorable impact on OS (all p values < 0.001). Multivariate Cox regression analysis demonstrated that increased IQGAP3 expression was an independent prognosis factor for poor OS (p < 0.001), as well as age (p<0.01), histologic grade (p<0.01), and clinical stage (p<0.05) (Table 4 and Figure 3B).
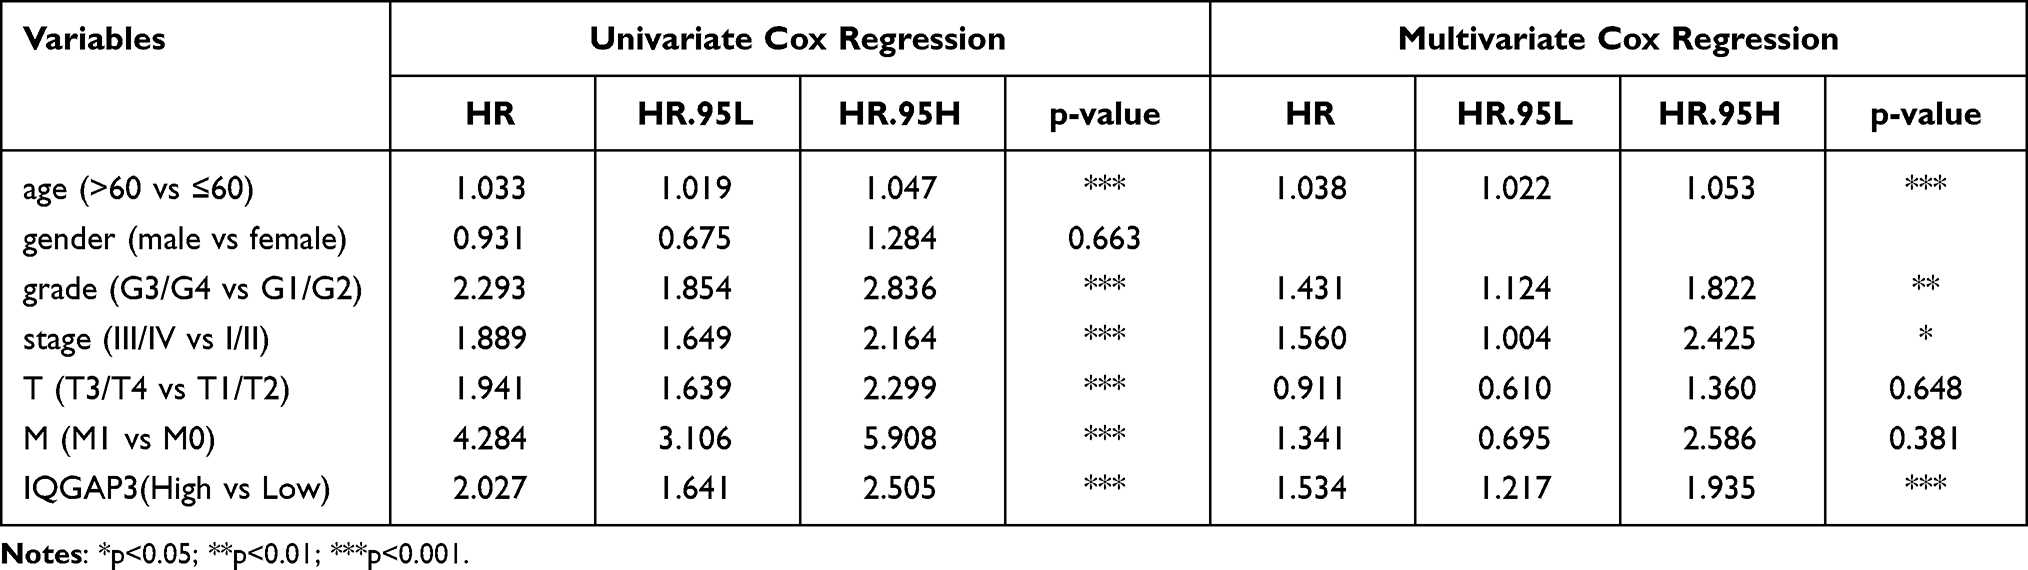 |
Table 4 Association with Overall Survival and Clinicopathological Characteristics in Patients from the TCGA Database Using Cox Regression. TCGA, The Cancer Genome Atlas |
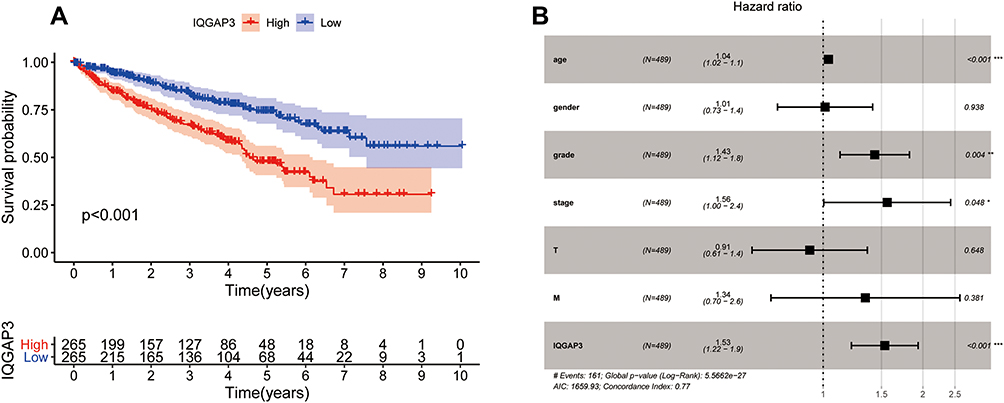 |
Figure 3 Survival analysis and Cox regression analysis (A) Kaplan–Meier survival analysis showed that patients of the high-IQGAP3 expression subgroup had a worse overall survival rate; (B) Independent prognostic factors identified by multivariate Cox regression analysis. Notes: *p < 0.05, **p < 0.01, ***p < 0.001. |
IQGAP3 Genetic Alteration Analysis
Alteration frequency of IQGAP3 mutations in ccRCC was analyzed using cBioPortal database. A total of 537 cases from KIRC datasets were analyzed. IQGAP3 altered in 40/537 (7.45%) of ccRCC patient samples. These alterations were mRNA high in 33 cases (6.15%), amplification in 3 cases (0.56%), and mutation in 4 cases (0.74%) (Figure 4A). Figure 4B shows the OncoPrint visual summary of alteration on a query of IQGAP3. Furthermore, Kaplan–Meier curves indicated that the cases with alterations in one of the query genes have worse overall survival and disease-free survival than those without alterations in any query genes (all p values < 0.001) (Figure 4C and D).
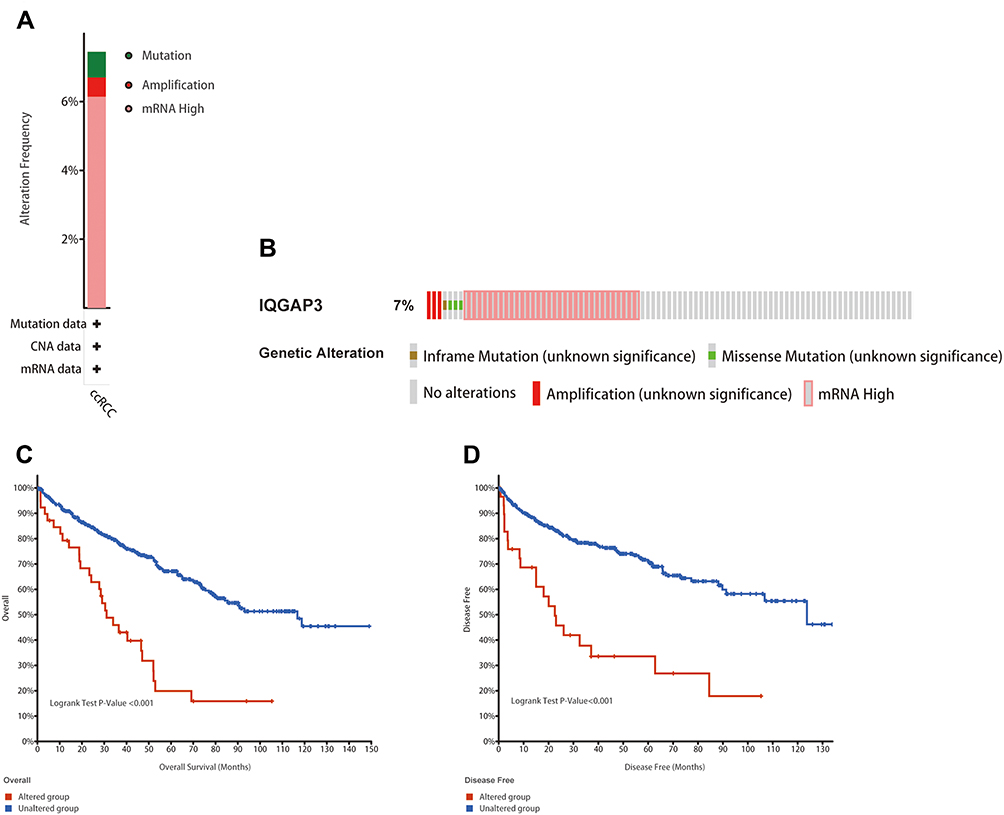 |
Figure 4 Genetic mutation analyses of IQGAP3 in clear cell renal cell carcinoma (ccRCC) (cBioPortal database). (A) IQGAP3 are altered in 40/537 (7.45%) of 537 cases; (B) The OncoPrint visual summary of alteration on a query of IQGAP3; (C and D) The Kaplan–Meier curves between IQGAP3 altered group and unaltered group. |
Co-Expression Analysis
To search for functional partners with IQGAP3, the Pearson correlation coefficients were calculated to select genes related with IQGAP3, genes that meet the criteria Pearson correlation coefficients >0.4 and p <0.001 were considered as hub-related genes. Results showed that 726 genes were significantly correlated with IQGAP3, including 623 positively related genes and 103 negatively related genes (Table S1). Figure 5A shows the top 20 positively and negatively related genes. Among them, KIF18B, HJURP and TROAP were strongly associated with IQGAP3. The Pearson correlation coefficients were 0.878, 0.877, and 0.871 (all p values < 0.001) (Figure 5B–D). RNA-seq data from TCGA database showed that KIF18B, HJURP and TROAP were significantly upregulated in ccRCC tissues by comparison with noncancerous tissues (all p values < 0.001) (Figure 5E–G). Survival analysis results showed that higher expression level of KIF18B, HJURP and TROAP indicated a worse OS for patients with ccRCC (all p values < 0.001) (Figures 5H–J).
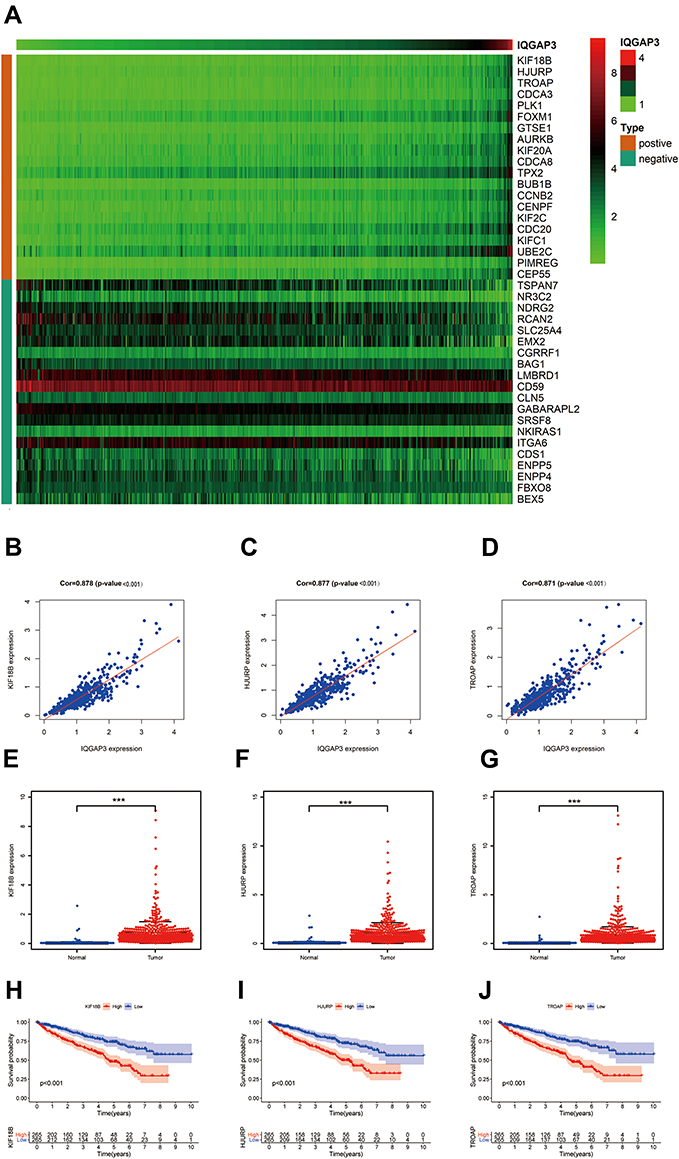 |
Figure 5 Co-expression analysis. (A) The top 20 positively and negatively genes associated with IQGAP3; (B–D) KIF18B, HJURP and TROAP were strongly associated with IQGAP3; (E–G) KIF18B, HJURP and TROAP were highly expressed in ccRCC tissues; (H–J) Survival analysis results showed that higher expression level of KIF18B, HJURP and TROAP indicated a worse OS for patients with ccRCC. Note: ***p < 0.001. |
Functional Enrichment Analysis
To explore the potential mechanisms of IQGAP3, we perform functional enrichment analysis of IQGAP3 and its functional partners through Metascape database to mine its biological processed and signaling pathways. GO_BP analysis indicated that IQGAP3 and its functional partners were mainly enriched in biological processes associated with cell proliferation, such as the nuclear division, cell cycle phase transition, DNA replication, and DNA repair (Figure 6). KEGG pathway analysis demonstrated that IQGAP3 and its functional partners were significantly enriched in several tumor-related signaling pathways, such as cell cycle, DNA replication, p53 signaling pathway, and MicroRNAs in cancer (Figure 7).
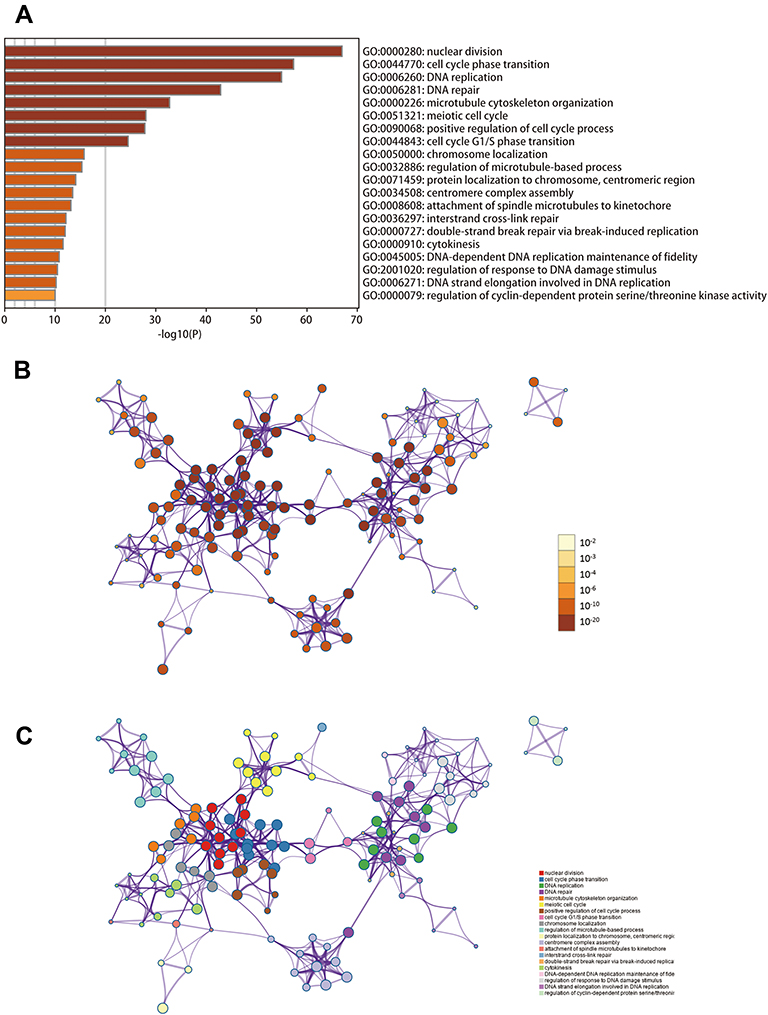 |
Figure 6 Biological processes enrichment analysis of IQGAP3 and its functional partners (Metascape database). (A) Heatmap of the biological processes enriched terms colored by P-values; (B) Network of biological processes enriched terms colored by P-value; (C) Network of biological processes enriched terms colored by clusters. |
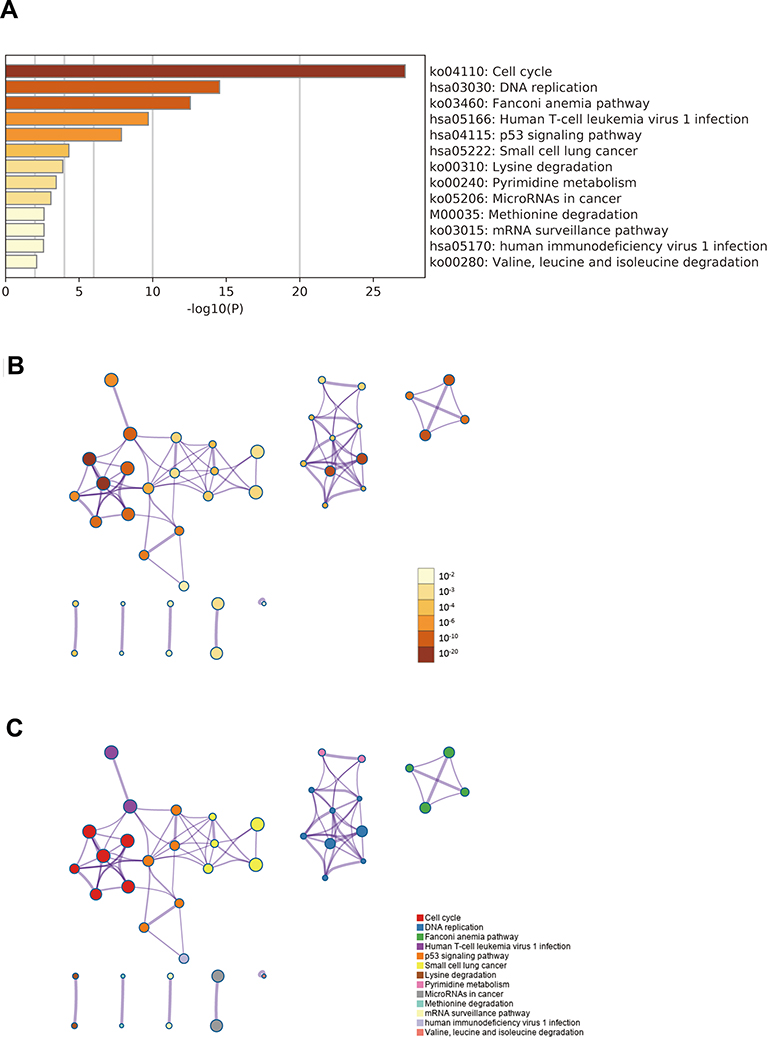 |
Figure 7 Signaling pathways enrichment analysis of IQGAP3 and its functional partners (Metascape database). (A) Heatmap of the pathways enriched terms colored by P-values; (B) Network of pathways enriched terms colored by P-value; (C) Network of pathways enriched terms colored by clusters. |
Association Between IQGAP3 and TIICs
Tumor-infiltrating immune cells are a portion of the tumor microenvironment that could modulate the progression of tumor. In this study, we performed 21 kinds of immune cell profiles in ccRCC samples using the CIBERSORT algorithm, Figure 8A shows the proportion of 21 kinds of TIICs in ccRCC tumor samples. Column names of plot were sample ID. Figure 8B shows the correlation between two kinds of cells, and Pearson coefficient was used for significance test. For further exploration, we found that five kinds of TIICs were positively correlated with IQGAP3 expression, including CD8+ T cells ((p < 0.01)), CD4+ memory activated T cells (p < 0.01), follicular helper T cells (p < 0.001), regulatory T cells (Tregs) (p < 0.001), and M0 Macrophages (p < 0.01); and six kinds of TIICs were negatively correlated with IQGAP3 expression, including naive B cells (p < 0.05), memory B cells (p < 0.05), CD4 memory resting T cells (p < 0.05), Monocytes (p < 0.01), activated Dendritic cells (p < 0.001) and Mast cells resting (p < 0.001) (Figure 8C).
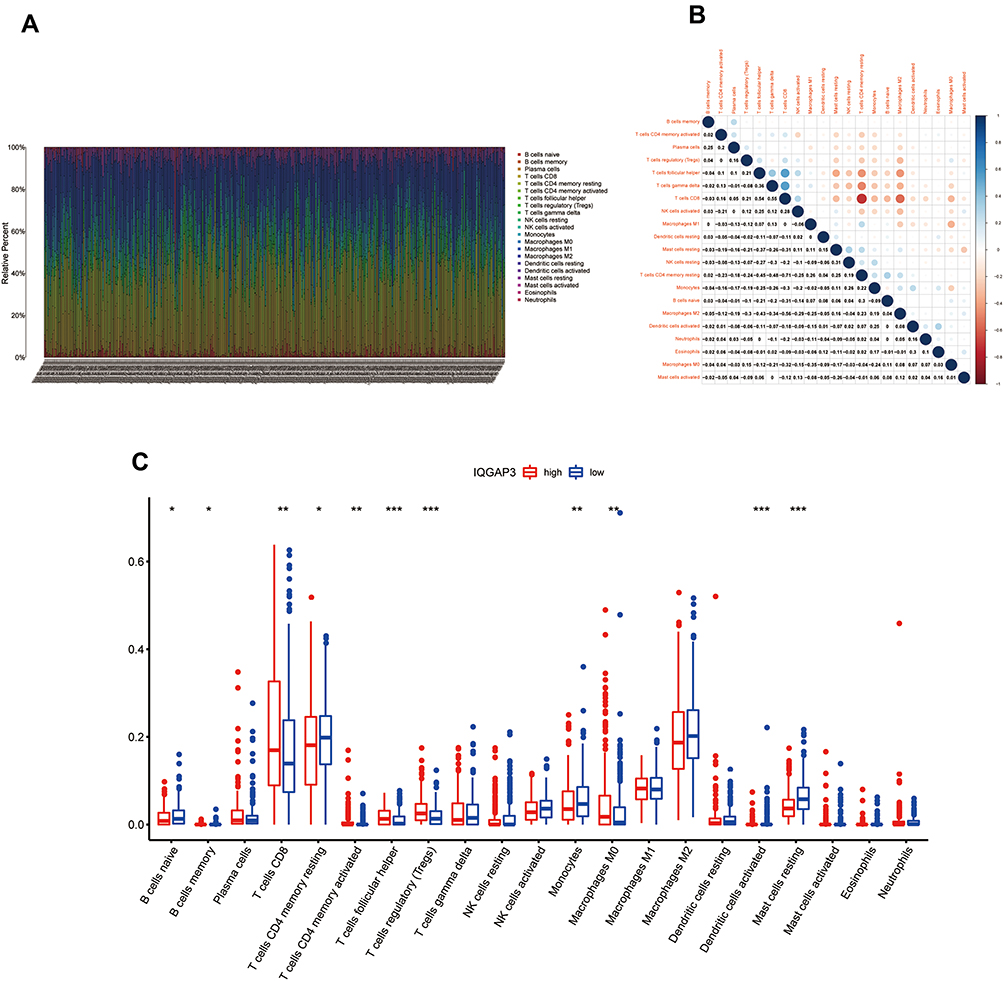 |
Figure 8 Correlation of TIICs proportion with IQGAP3 expression. (A) Barplot showing the proportion of 21 kinds of TIICs in ccRCC tumor samples; (B) Heatmap showing the correlation between 21 kinds of TIICs and numeric in each tiny box indicating the p value of correlation between two kinds of cells. The shade of each tiny color box represented corresponding correlation value between two cells, and Pearson coefficient was used for significance test; (C) Barplot showed the ratio differentiation of 21 kinds of immune cells between ccRCC tumor samples with low or high IQGAP3 expression relative to the median of IQGAP3 expression level, and Wilcoxon rank sum was used for the significance test. Notes: *p < 0.05, **p < 0.01, ***p < 0.001. |
Relationship Between IQGAP3 and Immunosuppressive Molecules
Tumor growth and progression are significantly correlated with immune suppression, immunosuppressive molecules are the culprit in the process, such as cytotoxic T-lymphocyte–associated protein-4 (CTLA4), programmed cell death-1 (PD-1) and Lymphocyte activation gene-3 (LAG3). Hence, in the current study, we estimate the association between IQGAP3 and several common immunosuppressive molecules (Figure 9A), and results showed that IQGAP3 was positively associated with PD-1 (p < 0.001), LAG3 (p < 0.001), CTLA4 (p < 0.001), TIGIT (p < 0.001), CD276 (p < 0.001), and HAVCR2 (p < 0.01) (Figure 9B–G); whereas negatively associated with VSIR (p < 0.05) (Figure 9H). However, no correlation between IQGAP3 and CD274 was found (Figure 9I).
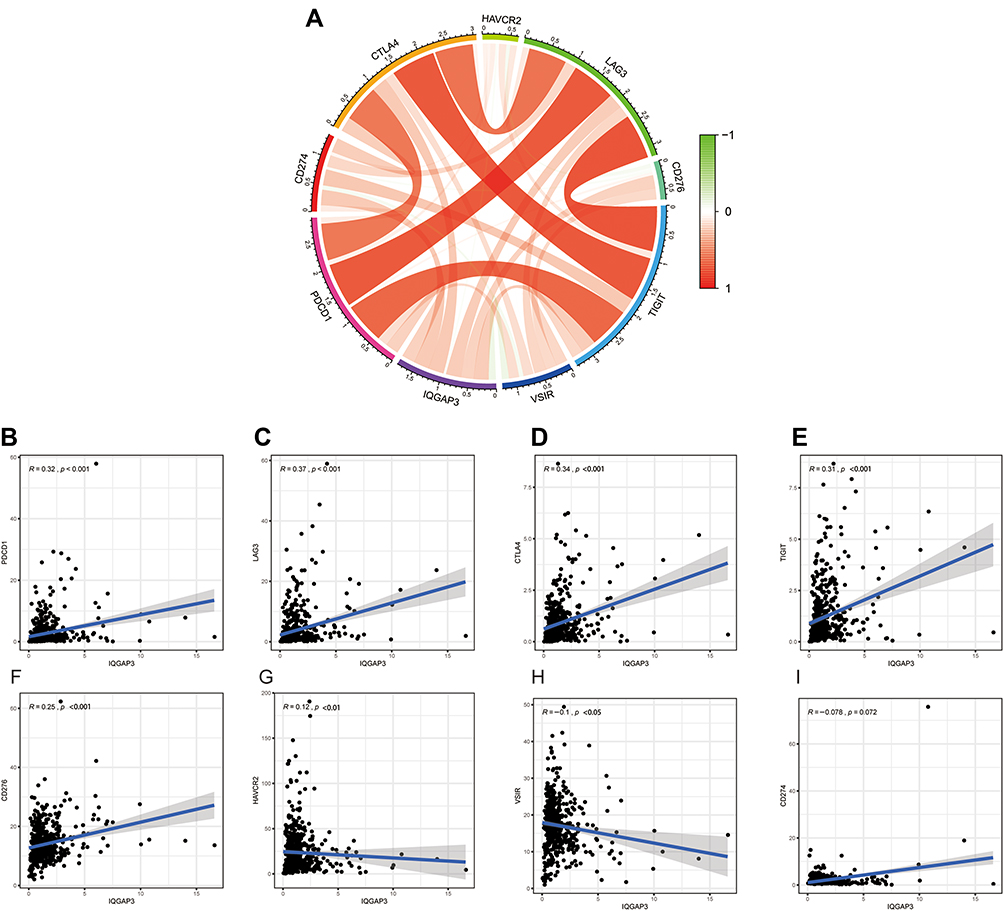 |
Figure 9 Correlation of immunosuppressive molecules expression with IQGAP3 expression. (A) Circle diagram of correlation between immunosuppressive molecules expression and IQGAP3 expression; (B–E) Correlation analysis results showed that IQGAP3 was positively associated with PD-1, LAG3, CTLA4, and TIGIT; (F–H) Correlation analysis results showed that IQGAP3 was negatively associated with B7H3, TIM3 and VSIR (I) No correlation between IQGAP3 and PD-L1 was found. |
Construction and Validation a Nomogram for Predicting OS of ccRCC
A nomogram is a robust tool, which was widely utilized to predict tumor prognosis. Herein, we employed the independent prognostic factors based on multivariate Cox regression analysis to construct a predictive nomogram. Age, grade, stage and IQGAP3 were included in the nomogram (Figure 10A). Additionally, calibration curves indicated that actual and predicted survival matched very well in terms of 1-year (Figure 10B), 3-year (Figure 10C) and 5-year OS (Figure 10D). Taken together, the nomogram-based results confirmed a very effective accuracy for predicting the 1-, 3- and 5-year survival of ccRCC patients.
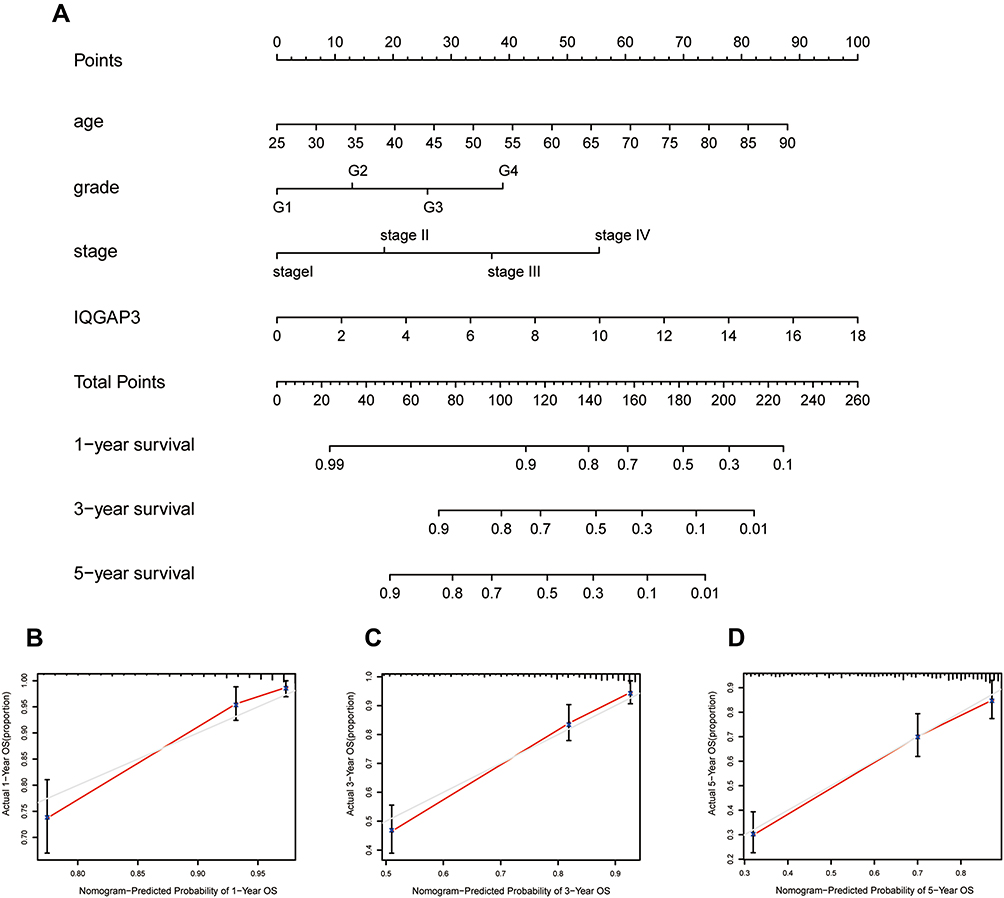 |
Figure 10 A nomogram consisting of independent clinical features for predicting 1-, 3-, and 5-year OS of ccRCC. (A) Construction of a predictive nomogram; (B–D) Calibration curves revealed that actual and predicted survival matched very well in terms of 1-year, 3-year and 5-year OS of ccRCC. |
Discussion
Renal clear cell carcinoma is one of the lethal cancers and its treatment faces enormous challenges, especially for patients with advanced and metastatic. IQGAP3 is a member of the IQGAP gene family, which was reported to participate in different cellular processes. Accumulating evidence confirmed its carcinogenic role in the cancer process. However, there are few reports on the role of IQGAP in ccRCC.
Herein, we comprehensively discussed the roles IQGAP3 in ccRCC. Firstly, we demonstrated that IQGAP3 was highly expressed in ccRCC specimens, and overexpression IQGAP3 phenotype was significantly associated with high histological grade, advanced clinical stage, TNM classification and poor prognosis. Moreover, univariate Cox regression and multivariate Cox regression analyses confirmed that IQGAP3 was an independent risk factor for ccRCC patients. All results indicated that IQGAP3 might serve as an oncogene in ccRCC. Abnormal genetic alteration might affect the expression of genes,21 so we explored the potential genetic alteration of IQGAP3 in ccRCC. We found that 40 of the 537 patients had genetic mutations in IQGAP3, with the most common type of mutation being mRNA high, and patients in the mutated group showed a worse prognosis. The results indicated that IQGAP3 genetic alteration might be responsible for their overexpression in ccRCC and the unfavorable influence on the prognosis of ccRCC patients. Co-expressed genes might have the similar function in the cancer’s progression.22 We obtained the most important co-expressed genes by calculating the correlation coefficient. Among them, KIF18B, HJURP and TROAP were strongly associated with IQGAP3. Further analysis showed that KIF18B, HJURP and TROAP were also highly expressed in ccRCC tissues, and higher expression level of them indicated a poorer prognosis for ccRCC patients.
KIF18B, a member of kinesin superfamily, has a long-reported significant effect on the onset and progression of cancer.23,24 Wang et al25 have identified KIF18B as a risk gene in the metastasis of ccRCC. HJURP, a histone H3 chaperone, was identified as a crucial factor in DNA binding and phosphorylation, which promotes chromosome segregation and cell mitosis.26 HJURP has been demonstrated to be significantly overexpressed in several tumors, such as hepatocellular carcinoma, breast cancer, lung cancer, bladder cancer and glioma.27 TROAP, a cytoplasmic protein required for microtubular cytoskeleton regulation and spindle assembly, has been reported to play an important role in various cancers.28 Although there was no direct evidence of a link between IQGAP3 and KIF18B, HJURP, and TROAP. Given the role of the latter three genes in other cancers, their association was worthy of further investigation.
Next, we perform functional enrichment analysis to explore the potential mechanisms of IQGAP3 and its co-expressed genes. Results showed that these genes were significantly several cancer-related biological processes and pathways, such as cell cycle, DNA replication, DNA repair. These processes and pathways are significantly critical in the development of cancer. For example, cell cycle was the one of the most important signaling pathways and abnormal cell cycle regulation would lead to the onset and development of cancers.29 DNA replication and DNA repair were at the heart of the cancer process.30 Dysregulation of DNA replication and DNA repair would promote the development of cancer, and inhibition of DNA replication or DNA repair would prevent cancer cells from replicating, leading to cell death.31
Tumour immune infiltrating cells, the key component of the tumor microenvironment, played a crucial role in the cancer’s progression.32 However, the interaction between TIICs and IQGAP3 in ccRCC is still unknown. In this study, we calculated the content of 21 immune cells in each sample by the CIBERSORT algorithm. Then, we further analyzed the differences in tumour immune infiltrating cells between high and low-IQGAP3 expression groups. High expression group showed high level immune infiltrates of CD8+ T cells, CD4+ memory activated T cells, follicular helper T cells, regulatory (Tregs) T cells and M0 Macrophages. Regulatory (Treg) T cells were the main mediators of immunosuppression and an increase in regulatory (Treg) T cells was strongly correlated with poor prognosis in a variety of malignancies.33 Additionally, elevated immune infiltrate level of M0 macrophages has been reported to be associated with poor clinical prognosis in cancer.34 Immune checkpoints can help tumor cells evade immune surveillance and the use of immune checkpoint inhibitors (ICIs) has proved to be one of the most promising approaches in the field of cancer treatment.35 Here, we assessed the relationship between IQGAP3 and PD-1, LAG3, CTLA4, TIGIT, CD276, HAVCR2, VSIR and PD-L1. Results showed that IQGAP3 was positively correlated with PD-1, LAG3, CTLA4, TIGIT, CD276, and HAVCR2. Of all the immunosuppressive molecules, PD-1, CTLA-4 were two of the first and most promising targets to be identified. PD-1 could inhibit CD8 T cell activation and promote depletion.36 CTLA-4, expressed in activated CD 4 and CD 8 T cells, suppresses the activated T cell response and mediates the immunosuppressive function of Tregs.37 Recently, research found that blocking LAG-3 resulted in higher T cell activation by comparison with PD-1/PD-L1.38 TIGIT can inhibit immune cell function at multiple steps in the tumor immune cycle.39 All the above analyses suggested that CCRCC patients with high IQGAP3 expression had a strong immunosuppressive effect, which may be an important reason for their poor prognosis, and also suggested that patients with high IQGAP3 expression subgroup might benefit more from ICIs.
In the current study, we found that IQGAP3 may serve as a key oncogene and potential therapeutic target in ccRCC. Nomogram based on IQGAP3 expression, age, grade, and stage could well predict the prognosis of ccRCC patients. However, some limitations should not be ignored. This is a retrospective study based on several public databases, and the precise mechanism of IQGAP3 impact ccRCC patient prognosis has not been fully illustrated. Further substantial proofs, such as cell-based protein expression assays and other basic medical experiments should be carried out to confirm our conclusions.
Data Sharing Statement
The RNA-seq and clinical data of the 530 ccRCC patients from TCGA database were downloaded from https://portal.gdc.cancer.gov/
Ethical Approval and Consent to Participate
The public database mentioned in this study is publicly available for re-analyzing, and no ethical approval was required by the local ethics committees, so that this study does not require the ethics approval.
Acknowledgments
We thank the reviewers for their constructive comments.
Author Contributions
All authors made a significant contribution to the work reported, whether that is in the conception, study design, execution, acquisition of data, analysis and interpretation, or in all these areas; took part in drafting, revising or critically reviewing the article; gave final approval of the version to be published; have agreed on the journal to which the article has been submitted; and agree to be accountable for all aspects of the work.
Funding
This project is supported by the doctoral start-up fund of Guangzhou Women and Children’s Medical Center. Fund NO. 1600042-04.
Disclosure
The authors report no competing interests in this work.
References
1. Grignon DJ, Che M. Clear cell renal cell carcinoma. Clin Lab Med. 2005;25(2):305–316. doi:10.1016/j.cll.2005.01.012
2. Hsieh JJ, Purdue MP, Signoretti S, et al. Renal cell carcinoma. Nat Rev Dis Primers. 2017;3:17009. doi:10.1038/nrdp.2017.9
3. Escudier B, Porta C, Schmidinger M, et al. Renal cell carcinoma: ESMO clinical practice guidelines for diagnosis, treatment and follow-up. Ann Oncol. 2016;27(suppl 5):v58–v68. doi:10.1093/annonc/mdw328
4. Barata PC, Rini BI. Treatment of renal cell carcinoma: current status and future directions. CA Cancer J Clin. 2017;67(6):507–524. doi:10.3322/caac.21411
5. Shi Y, Qin N, Zhou Q, et al. Role of IQGAP3 in metastasis and epithelial-mesenchymal transition in human hepatocellular carcinoma. J Transl Med. 2017;15(1):176. doi:10.1186/s12967-017-1275-8
6. Fang X, Zhang B, Thisse B, Bloom GS, Thisse C. IQGAP3 is essential for cell proliferation and motility during zebrafish embryonic development. Cytoskeleton. 2015;72(8):422–433. doi:10.1002/cm.21237
7. Jinawath N, Shiao MS, Chanpanitkitchote P, Svasti J. Enhancement of migration and invasion of gastric cancer cells by IQGAP3. Biomolecules. 2020;10(8):1194.
8. Zeng Y, Jie X, Wu B, Wu G, Liu L, Xu S. IQGAP3 interacts with Rad17 to recruit the Mre11-Rad50-Nbs1 complex and contributes to radioresistance in lung cancer. Cancer Lett. 2020;493:254–265. doi:10.1016/j.canlet.2020.08.042
9. Xu W, Xu B, Yao Y, et al. Overexpression and biological function of IQGAP3 in human pancreatic cancer. Am J Transl Res. 2016;8(12):5421–5432.
10. Hutter C, Zenklusen JC. The cancer genome atlas: creating lasting value beyond its data. Cell. 2018;173(2):283–285. doi:10.1016/j.cell.2018.03.042
11. Zhang J, Bajari R, Andric D. The international cancer genome consortium data portal. Nat Biotechnol. 2019;37(4):367–369. doi:10.1038/s41587-019-0055-9
12. von Roemeling CA, Radisky DC, Marlow LA, et al. Neuronal pentraxin 2 supports clear cell renal cell carcinoma by activating the AMPA-selective glutamate receptor-4. Cancer Res. 2014;74(17):4796–4810. doi:10.1158/0008-5472.CAN-14-0210
13. Peña-Llopis S, Vega-rubín-de-celis S, Liao A, et al. BAP1 loss defines a new class of renal cell carcinoma. Nat Genet. 2012;44(7):751–759. doi:10.1038/ng.2323
14. Peña-Llopis S, Brugarolas J. Simultaneous isolation of high-quality DNA, RNA, miRNA and proteins from tissues for genomic applications. Nat Protoc. 2013;8(11):2240–2255. doi:10.1038/nprot.2013.141
15. Li T, Fan J, Wang B, et al. TIMER: a web server for comprehensive analysis of tumor-infiltrating immune cells. Cancer Res. 2017;77(21):e108–e110. doi:10.1158/0008-5472.CAN-17-0307
16. Chandrashekar DS, Bashel B, Balasubramanya SAH, et al. UALCAN: a portal for facilitating tumor subgroup gene expression and survival analyses. Neoplasia. 2017;19(8):649–658. doi:10.1016/j.neo.2017.05.002
17. Chen F, Chandrashekar DS, Varambally S, Creighton CJ. Pan-cancer molecular subtypes revealed by mass-spectrometry-based proteomic characterization of more than 500 human cancers. Nat Commun. 2019;10(1):1–15.
18. Colwill K, Gräslund S. A roadmap to generate renewable protein binders to the human proteome. Nat Methods. 2011;8(7):551–558. doi:10.1038/nmeth.1607
19. Zhou Y, Zhou B, Pache L, et al. Metascape provides a biologist-oriented resource for the analysis of systems-level datasets. Nat Commun. 2019;10(1):1–10.
20. Newman AM, Liu CL, Green MR. Robust enumeration of cell subsets from tissue expression profiles. Nat Methods. 2015;12(5):453–457. doi:10.1038/nmeth.3337
21. Martincorena I, Raine KM, Gerstung M, et al. Universal patterns of selection in cancer and somatic tissues. Cell. 2017;171(5):1029–1041. doi:10.1016/j.cell.2017.09.042
22. Bortoluzzi S, Coppe A, Bisognin A, Pizzi C, Danieli GA. A multistep bioinformatic approach detects putative regulatory elements in gene promoters. BMC Bioinform. 2005;6:121. doi:10.1186/1471-2105-6-121
23. Gao T, Yu L, Fang Z, et al. KIF18B promotes tumor progression in osteosarcoma by activating β-catenin. Cancer Biol Med. 2020;17(2):371–386. doi:10.20892/j.issn.2095-3941.2019.0452
24. Yang B, Wang S, Xie H, et al. KIF18B promotes hepatocellular carcinoma progression through activating Wnt/β-catenin-signaling pathway. J Cell Physiol. 2020;235(10):6507–6514. doi:10.1002/jcp.29444
25. Yang H, Wang Y, Zhang Z, Li H. Identification of KIF18B as a hub candidate gene in the metastasis of clear cell renal cell carcinoma by weighted gene co-expression network analysis. Front Genet. 2020;11:905. doi:10.3389/fgene.2020.00905
26. Pan D, Walstein K, Take A, et al. Mechanism of centromere recruitment of the CENP-A chaperone HJURP and its implications for centromere licensing. Nat Commun. 2019;10(1):1–18.
27. Chen T, Huang H, Zhou Y, et al. HJURP promotes hepatocellular carcinoma proliferation by destabilizing p21 via the MAPK/ERK1/2 and AKT/GSK3β signaling pathways. J Exp Clin Cancer Res. 2018;37(1):193. doi:10.1186/s13046-018-0866-4
28. Li L, Wei JR, Song Y, et al. TROAP switches DYRK1 activity to drive hepatocellular carcinoma progression. Cell Death Dis. 2021;12(1):125.
29. Kastan MB, Bartek J. Cell-cycle checkpoints and cancer. Nature. 2004;432(7015):316–323. doi:10.1038/nature03097
30. Sancar A, Lindsey-Boltz LA, Unsal-Kaçmaz K, Linn S. Molecular mechanisms of mammalian DNA repair and the DNA damage checkpoints. Annu Rev Biochem. 2004;73:39–85. doi:10.1146/annurev.biochem.73.011303.073723
31. Cortez D. Replication-coupled DNA repair. Mol Cell. 2019;74(5):866–876. doi:10.1016/j.molcel.2019.04.027
32. Gajewski TF, Schreiber H, Fu YX. Innate and adaptive immune cells in the tumor microenvironment. Nat Immunol. 2013;14(10):1014–1022. doi:10.1038/ni.2703
33. Takeuchi Y, Nishikawa H. Roles of regulatory T cells in cancer immunity. Int Immunol. 2016;28(8):401–409. doi:10.1093/intimm/dxw025
34. Kurahara H, Takao S, Maemura K, et al. M2-polarized tumor-associated macrophage infiltration of regional lymph nodes is associated with nodal lymphangiogenesis and occult nodal involvement in pN0 pancreatic cancer. Pancreas. 2013;42(1):155–159. doi:10.1097/MPA.0b013e318254f2d1
35. Topalian SL, Taube JM, Anders RA, Pardoll DM. Mechanism-driven biomarkers to guide immune checkpoint blockade in cancer therapy. Nat Rev Cancer. 2016;16(5):275–287. doi:10.1038/nrc.2016.36
36. Paré L, Pascual T, Seguí E, et al. Association between PD1 mRNA and response to anti-PD1 monotherapy across multiple cancer types. Ann Oncol. 2018;29(10):2121–2128. doi:10.1093/annonc/mdy335
37. Rowshanravan B, Halliday N. CTLA-4: a moving target in immunotherapy. Blood J Am Soc Hematol. 2018;131(1):58–67.
38. Lichtenegger FS, Rothe M, Schnorfeil FM, et al. Targeting LAG-3 and PD-1 to enhance T cell activation by antigen-presenting cells. Front Immunol. 2018;9:385. doi:10.3389/fimmu.2018.00385
39. Anderson AC, Joller N, Kuchroo VK. Lag-3, Tim-3, and TIGIT: co-inhibitory receptors with specialized functions in immune regulation. Immunity. 2016;44(5):989–1004. doi:10.1016/j.immuni.2016.05.001
 © 2021 The Author(s). This work is published and licensed by Dove Medical Press Limited. The full terms of this license are available at https://www.dovepress.com/terms.php and incorporate the Creative Commons Attribution - Non Commercial (unported, v3.0) License.
By accessing the work you hereby accept the Terms. Non-commercial uses of the work are permitted without any further permission from Dove Medical Press Limited, provided the work is properly attributed. For permission for commercial use of this work, please see paragraphs 4.2 and 5 of our Terms.
© 2021 The Author(s). This work is published and licensed by Dove Medical Press Limited. The full terms of this license are available at https://www.dovepress.com/terms.php and incorporate the Creative Commons Attribution - Non Commercial (unported, v3.0) License.
By accessing the work you hereby accept the Terms. Non-commercial uses of the work are permitted without any further permission from Dove Medical Press Limited, provided the work is properly attributed. For permission for commercial use of this work, please see paragraphs 4.2 and 5 of our Terms.