")
Back to Journals » Clinical Ophthalmology » Volume 13
Investigation of intraocular pressure fluctuation as a risk factor of glaucoma progression
Authors Matlach J, Bender S, König J , Binder H, Pfeiffer N , Hoffmann EM
Received 5 September 2018
Accepted for publication 12 November 2018
Published 18 December 2018 Volume 2019:13 Pages 9—16
DOI https://doi.org/10.2147/OPTH.S186526
Checked for plagiarism Yes
Review by Single anonymous peer review
Peer reviewer comments 2
Editor who approved publication: Dr Scott Fraser
Juliane Matlach,1 Sandra Bender,2 Jochem König,2 Harald Binder,2,3 Norbert Pfeiffer,1 Esther M Hoffmann1
1Department of Ophthalmology, University Medical Center Mainz, Mainz, Germany; 2Institute of Medical Biostatistics, Epidemiology and Informatics, University Medical Center Mainz, Mainz, Germany; 3Institute of Medical Biometry and Statistics, Medical Center – University of Freiburg, Freiburg, Germany
Purpose: Since the role of short- and long-term intraocular pressure (IOP) fluctuation as a predictor of glaucoma progression is still controversial, the purpose of this study was to investigate the role of IOP fluctuation in a non-selected patient cohort.
Materials and methods: Two-hundred and forty eyes of 120 glaucoma patients (51% female) with a mean age of 64.5 years were included. Inclusion criteria were at least a visual field (VF) and a 48-hour diurnal phasing of IOP including nocturnal measurement. Glaucoma progression was defined as – if available – confirmed progression of reproducible VF defects in at least three VF examinations or increase of cup area on optic nerve imaging (Heidelberg Retina Tomograph [HRT]) with at least two images after baseline. If results were stable or less than previously mentioned VF or HRT examinations were available, it was classified as “no progression”.
Results: Glaucoma progression was seen in seven of 240 eyes in the VF analysis and ten of 240 eyes on HRT. Of all 240 eyes, 92 and 41 eyes fulfilled the criteria to be included for progression evaluation on VF and HRT analysis, respectively. Mean time to progression ± standard error was 3.6±0.2 years on VF and 4.5±0.3 years on HRT. Univariate and multivariate Cox regression analyses revealed short-term IOP fluctuation (P<0.0001) and maximum IOP (P<0.001) as risk factors for glaucoma progression on VF. There was no significant influence of demographic characteristics, ocular or general health on glaucoma progression.
Conclusion: Short-term IOP fluctuation was associated with the progression of glaucoma in this non-selected cohort of glaucoma patients receiving phasing of IOP.
Keywords: glaucoma progression, short-term IOP fluctuation, long-term IOP fluctuation, glaucoma imaging, visual field
Introduction
The detection of glaucoma progression is still of crucial importance for the treatment of glaucoma patients but remains challenging despite new and advanced diagnostic technologies. Assessing the function and structure in glaucoma is essential for detecting glaucomatous deterioration.1 For function, visual field (VF) testing with standard automated perimetry (SAP) is used for diagnosing, follow-up, and management of glaucoma. True VF progression is confirmed by computer-assisted analyses such as event- (progression or no progression)2 and trend-analysis (rate of progression).1 For structure, imaging devices such as the Heidelberg Retina Tomograph (HRT) can quantify glaucomatous progression of the optic nerve head by comparing baseline with follow-up images of the same patient.1,3,4
One of the most important risk factors for development and progression of glaucoma is a high intraocular pressure (IOP) and lowering the IOP is known to slow vision loss.5–11 However, it is difficult to define the impact of IOP fluctuation on glaucoma progression due to the variable definition of IOP fluctuation, timing of IOP measurements, and lack of standardization of the IOP measurement itself.12–14
A common definition of short-term IOP fluctuation is the IOP difference between the highest and lowest IOP over the course of 24 hours or less.12 In general, IOP has a tendency to fluctuate throughout the day reaching its peak in the early morning or in supine position as well as over periods of time in healthy subjects or glaucoma patients.14–19 Numerous studies have demonstrated a correlation between short-term IOP fluctuation and glaucoma progression,19–23 whereas other studies reported no significant association.16,24–27
In contrast to short-term, long-term IOP fluctuation is less well-defined but it is often described as IOP difference or deviation over a period (weeks, months) measured on several occasions throughout the day and on different days.6,7,13,28–33 Similar to studies on short-term IOP fluctuation and glaucoma progression, long-term IOP variation is also controversial in the literature.6,7,28–35 A large study on the significant influence of long-term IOP fluctuation was the Advanced Glaucoma Intervention Study (AGIS), which included refractory open-angle glaucoma (OAG) patients who were not controlled by medication and found for each mmHg increase in IOP fluctuation the risk of VF progression increased by 30% in the course of the disease.32 However, the inclusion criteria to calculate VF progression were criticized and a follow-up study was published addressing this limitation by limiting the inclusion of IOP levels to the first VF deterioration.13 This significant effect of long-term IOP fluctuation on glaucoma progression could however not be confirmed by other studies.6,9,28,31,34 Nevertheless, IOP remains a proven, modifiable risk factor which could potentially decrease the risk of progression. It is therefore important to focus on IOP and IOP fluctuation and its role on glaucoma progression in future studies. Several reviews have been published so far and addressed the controversy of the role of IOP fluctuation in the development and progression of glaucoma.36–39
The accurate measurement of IOP fluctuation requires phasing of IOP measured several times during the day, on different days, and over a long period. Such IOP profiles were taken routinely and regularly in glaucoma patients since the early 1990s at the Department of Ophthalmology, University Medical Center in Mainz. In order to investigate the role of IOP fluctuation on glaucoma progression, a certain number of IOP profiles were required. The aim of this retrospective study was therefore to investigate short-term and long-term fluctuation of IOP, as well as general and ocular characteristics as risk factors for glaucoma progression in a non-selected patient cohort. By including all available patient data without strict inclusion and exclusion criteria in evaluating glaucoma progression, we wish to predict the risk of progression based on baseline characteristics in a clinical setting rather than the number of VF or imaging examinations in a well-controlled study setting. This approach may better reflect everyday practice with heterogeneous patient information for early detection of glaucoma progression enabling earlier treatment for patients with progression, but also saving many suspected glaucoma patients years of needless follow-up.
Materials and methods
The study was approved by the local ethics committee of the Landesärztekammer Rheinland-Pfalz in Mainz, Germany. The research followed the tenets of the Declaration of Helsinki. No patient consent was necessary for this retrospective study. All data were collected and stored in accordance with the legislation on data confidentiality.
Two-hundred and forty eyes of 120 glaucoma patients from a random list of glaucoma patients treated at the Department of Ophthalmology, University Medical Center Mainz, Germany between 2004 and 2009 were enrolled in this longitudinal retrospective cohort study. Inclusion criteria were glaucoma patients with at least 48 hours phasing of IOP during the day and an IOP measurement at night in supine position and a VF on SAP using Humphrey Visual Field Analyzer (HFAII; Carl Zeiss Meditec AG, Jena, Germany) 24-2 and 30-2 strategy or Octopus 900 perimeter (Haag-Streit Holding AG, Köniz, Switzerland).
IOP
Goldmann applanation tonometry was routinely used during diurnal and the handheld Perkins tonometer (both Haag-Streit Holding AG) for nighttime IOP measurements in supine position. Approximately four IOP measurements during the day (at 8 am, 2 pm, 6 pm, and 9 pm) and one at night (at 12 am) were available for every patient (total of approximately ten measurements over 48 hours). Baseline IOP was defined by calculating the mean value of IOP measured during the first 48 hours phasing. Mean and SD values were calculated, as well as highest IOP defined as maximum IOP during phasing. Short-term IOP was defined as IOP within 48 hours phasing and long-term IOP over a period of months and years.
Definition of progression
Progression was defined as the first detected change on either VF or HRT. A confirmed progression required repeatable VF defects on perimetry or thinning of the rim on HRT in subsequent examinations. Reproducible VF defects in at least three VF examinations or increase of cup area on HRT analysis with at least two optic disc images after the baseline examination was seen as glaucoma progression. Evaluation of progression as reproducible change of VF defects and significant thinning of the optic disc rim was performed by an experienced glaucoma surgeon and consultant (EMH).
VF
SAP with HFAII or Octopus perimeter was evaluated for progression of VF defects. Progression of VF was defined as a reduction in sensitivity in three or more contiguous points with P<0.01 or one point with P<0.05 on the pattern deviation plot. Progression was distinguished between “possible progression” (first detected progression), “likely progression” (progression in two VFs), and “confirmed progression” (progression in all three VFs).
Optic disc imaging
Topographic change analysis (TCA) of the HRT (HRTII and III, Heidelberg Engineering GmbH, Heidelberg, Germany) was used to evaluate structural progression of rim thinning. Significant cluster building in the super pixel analysis was used for progression definition. Progression was defined as “possible progression” (first detected progression) to “confirmed progression” (significant cluster existence in the TCA analysis). More short- and long-term follow-up data of optic disc morphology from HRT were available than imaging on optical coherence tomography and were therefore used for this study.
Statistical analyses
Statistical analyses were performed with SPSS for Windows 22 (IBM Corporation, Armonk, NY, USA). Baseline patient characteristics were given as mean and SDs for continuous variables, absolute and relative frequencies for categorical variables, and were tested for association with glaucoma progression by using a logistic model with the generalized estimation equation method for each explanatory variable. Univariate Cox regression analyses were used to evaluate the association between short- and long-term IOP fluctuation and glaucoma progression. Survival analyses were performed to identify progression-free survival time using VF and HRT analysis for the detection of glaucoma progression with IOP as the time-dependent covariable. Cox models with time-dependent covariates were used to evaluate predictor variables at each observed progression time. In Cox model analyses, we adjusted for dependency between eyes of a patient using the method of Lee et al.40 Multivariable models were adjusted for age, gender, short- and long-term IOP measurements. For all analyses listed, a P-value of <0.05 was considered statistically significant.
Results
Data of 240 eyes of 120 patients (51% female) with a mean age of 64.5±13.2 years (range 20–89 range) were screened. Mean baseline IOP was 15.8±2.8 mmHg for all patients with the majority having primary OAG; 64%. Patients’ characteristics are illustrated in Table 1. Of the 240 eyes, 92 and 41 eyes fulfilled the criteria to be included for progression evaluation with at least four VF or three HRT examinations, respectively. Glaucoma progression was seen in seven of 240 eyes in the VF analysis and ten of 240 eyes on HRT.
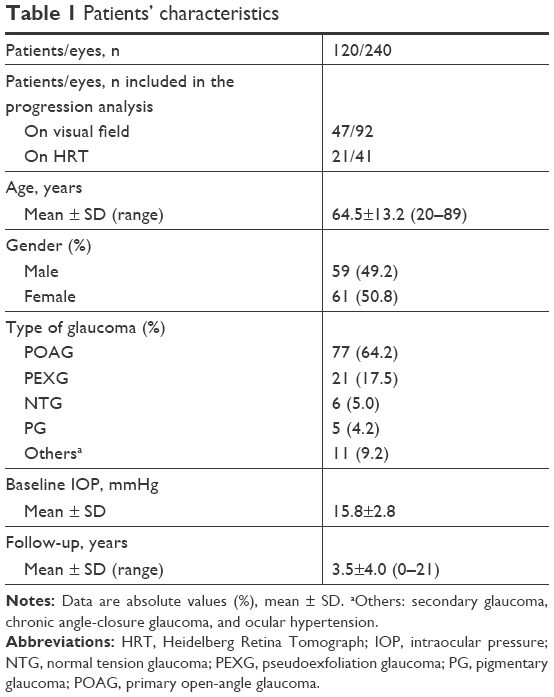 | Table 1 Patients’ characteristics |
Regression analysis of IOP parameters and glaucoma progression
Univariate Cox regression analysis showed a significant association between short-term SD of IOP (HR 1.15, 95% CI 1.07–1.23, P<0.0001), short-term maximum IOP (HR 1.05, 95% CI 1.02–1.07, P<0.0001, per mmHg), long-term maximum IOP (HR 1.04, 95% CI 1.02–1.07, P<0.0001), and glaucoma progression on VF (Table 2), but we failed to detect significant association between short- and long-term mean IOP and VF progression.
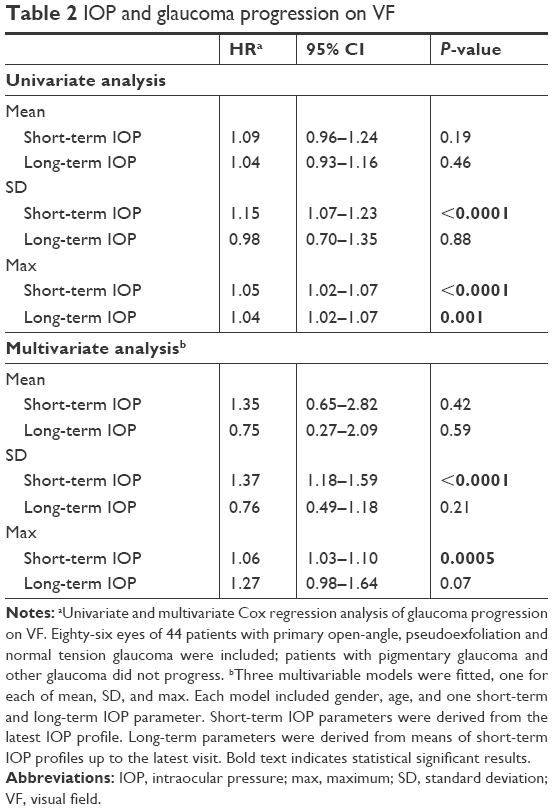 | Table 2 IOP and glaucoma progression on VF |
In the time-dependent multivariate Cox regression analysis short-term SD of IOP (HR 1.37, 95% CI 1.18–1.59, P<0.0001) and short-term maximum IOP (HR 1.06, 95% CI 1.03–1.10, P=0.0005) were also significant predictive factors for glaucoma progression on VF (Table 2). There was no significant association found between long-term IOP parameters and glaucoma progression.
Risk factors of glaucoma progression
General characteristics (age, gender, and family history of glaucoma), myopia (spherical error of more than −3.00 diopters), central corneal thickness (less than 520 μm), and general health (migraine, arterial hypertension and hypotension, peripheral vascular diseases, autoimmune disease, diabetes, and coronary heart disease) did not significantly influence glaucoma progression on VF or HRT.
Progression-free time
Overall mean progression-free time was 2.4±0.9 years on VF and 3.1±0.6 years on HRT including all patients. Mean progression-free time was 3.6±0.2 years on VF and 4.5±0.3 years on HRT when considering patients who met the criteria for evaluating glaucoma progression (92 eyes on VF and 41 eyes on HRT).
Survival analysis revealed a cumulative progression-free survival ratio of 75% after 6.9 years on VF in patients with data available for progression analysis (Figure 1). Mean progression-free time was 6.6 years on HRT with a survival ratio of 50% (Figure 2).
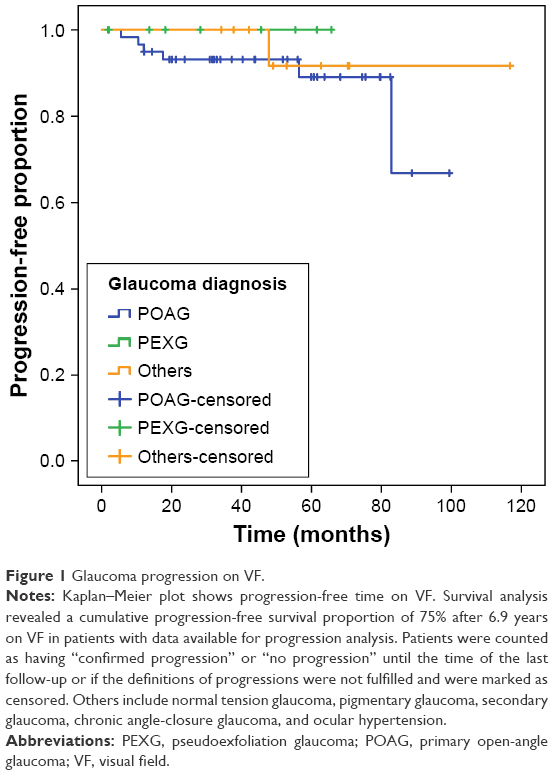 | Figure 1 Glaucoma progression on VF. |
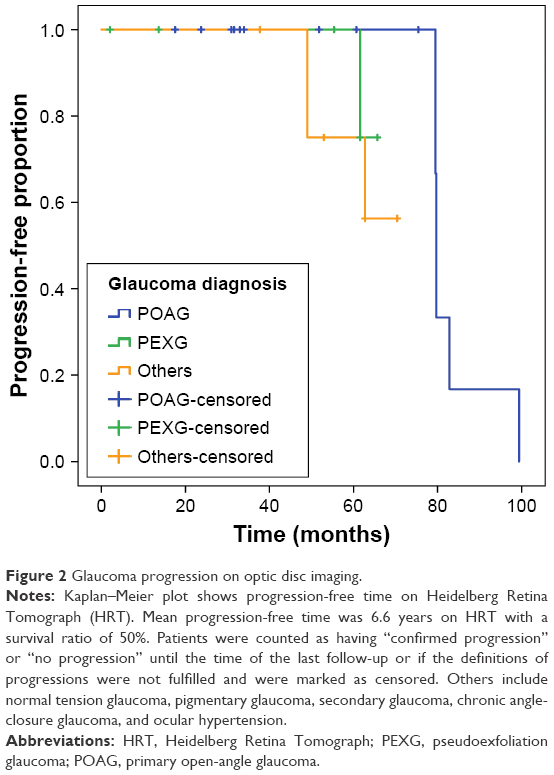 | Figure 2 Glaucoma progression on optic disc imaging. |
Discussion
Short-term and long-term IOP fluctuations are worth considering as a risk factor for glaucoma progression. However, the definition and measurement of IOP fluctuation are inconsistent among studies. Moreover, inclusion and exclusion criteria widely differ between studies. We have included all available data to evaluate short-term and long-term fluctuation of IOP as a risk factor for glaucoma progression. This may reflect more heterogeneous patients’ information of everyday practice rather than a study with many inclusion and exclusion criteria. We found a progression rate of 7/240 eyes on VF and 10/240 eyes on HRT. Analysis of risk factors did not reveal any significant influence of demographic characteristics, ocular or general health on glaucoma progression. Mean progression-free time was 2.4±0.9 years on VF and 3.1±0.6 years on HRT including all patients. We have shown a significant association between short-term IOP, however not long-term IOP fluctuation, and glaucoma progression. Interestingly, only the deviation and maximum short-term but not the mean IOP fluctuation were significantly associated with glaucoma progression. IOP spikes appear to be more harmful and may be missed when studying mean IOP fluctuation rather than the SD or highest IOP values. However, the question still remains why diurnal short-term IOP fluctuation over the course of a day or two contributes more to glaucoma progression than long-term fluctuation. The findings in previous studies are also somewhat controversial. Studies on short-term IOP fluctuation have demonstrated an association with glaucoma progression19–23 whereas others did not.16,24–27 Of those with significant IOP variation, Grippo et al20 showed that 30% of patients with untreated ocular hypertension (OHT) have a similar 24-hour IOP pattern to those with glaucoma, such as diurnal and nocturnal IOP variation and IOP changes in sitting and supine positions. Especially diurnal IOP fluctuation was greater in OHT and glaucoma patients compared to healthy participants.20 In a population-based study sample, Thomas et al23 found a 5-year incidence of glaucoma in patients with OHT of 17.4%. Short-term mean and peak IOP were higher and a diurnal IOP variation of more than 8 mmHg often occurred in patients who progressed.23 A large study by Jonas et al21 analyzing over 3,500 IOP profiles from 720 patients (majority with different types of OAG including normal tension glaucoma [NTG] compared to healthy participants) found a significant IOP fluctuation in patients with secondary OAG compared to healthy eyes or NTG patients.21 The same study group published a report of 458 patients (174 eyes with OHT, 681 eyes with POAG) 3 years earlier and found an association of mean, peak, and trough IOP with glaucoma progression but no significant correlation of IOP amplitude and glaucoma progression.24 A sub-analysis even showed a negative association of IOP variation and progression in NTG. Likewise, Sung et al26 reported on 101 NTG patients over 6 years, of whom almost one-third progressed and found that ocular perfusion pressure but not IOP, was significantly associated with progression.
Similar controversial results can be found for long-term IOP fluctuation and glaucoma progression.6,7,28–35 The AGIS study,32 a large prospective, multicenter and randomized clinical trial including 509 eyes of 401 patients, investigated risk factors associated with VF progression and found older age (OR 1.30, 95% CI 1.11–1.50), larger long-term IOP fluctuation (OR 1.31, 95% CI 1.12–1.54), increasing number of glaucoma interventions (OR 1.74, 95% CI 1.14–2.64), and longer follow-up (OR 1.19, 95% CI 1.03–1.38) to be significantly associated with VF progression. The odds of VF progression increased by 30% for each 5-year increment in age and 1 mmHg increase in IOP fluctuation.32 However, a limitation of this first analysis was that prognostic factors used to predict progression were measured before and after VF progression. This would have meant an increased IOP fluctuation as patients progressed and treatment was escalated. Therefore, a follow-up study was published using the same data from the AGIS with the inclusion of only IOP data of patients (with only one surgical intervention, if any) until the first evidence of VF progression to evaluate the risk of IOP fluctuation in glaucoma progression.13 Further to this, Hong et al studied glaucoma patients after combined cataract surgery and trabeculectomy and showed over 3 years that one-third of patients with IOP fluctuation of more than 2 mmHg progressed compared to only 10% with SD of IOP of less than 2 mmHg.29 This is in contrast to a randomized cohort from the Early Manifest Glaucoma Trial6 with 129 treated glaucoma patients and 126 controls which found that long-term IOP fluctuation was not related to progression (HR 1.00, 95% CI 0.81–1.24, P=0.999). In addition, Bengtsson and Heijl also examined 90 high-risk OHT patients in the Malmö Ocular Hypertension Study34 every 3 months with office-hours diurnal IOP phasing and perimetry. Patients were prospectively followed-up for 10 years or until glaucomatous VF loss was seen. Forty-one percent developed glaucoma with VF defects. IOP level (95% CI 1.09–1.38), but not IOP fluctuation (95% CI 0.80–1.60) was as a significant risk factor for developing glaucoma. They concluded that IOP fluctuation was not an independent risk factor for glaucoma progression on VF in patients with high-risk OHT.34 A selection of relevant literature on IOP fluctuation and glaucoma progression is summarized in Table 3.
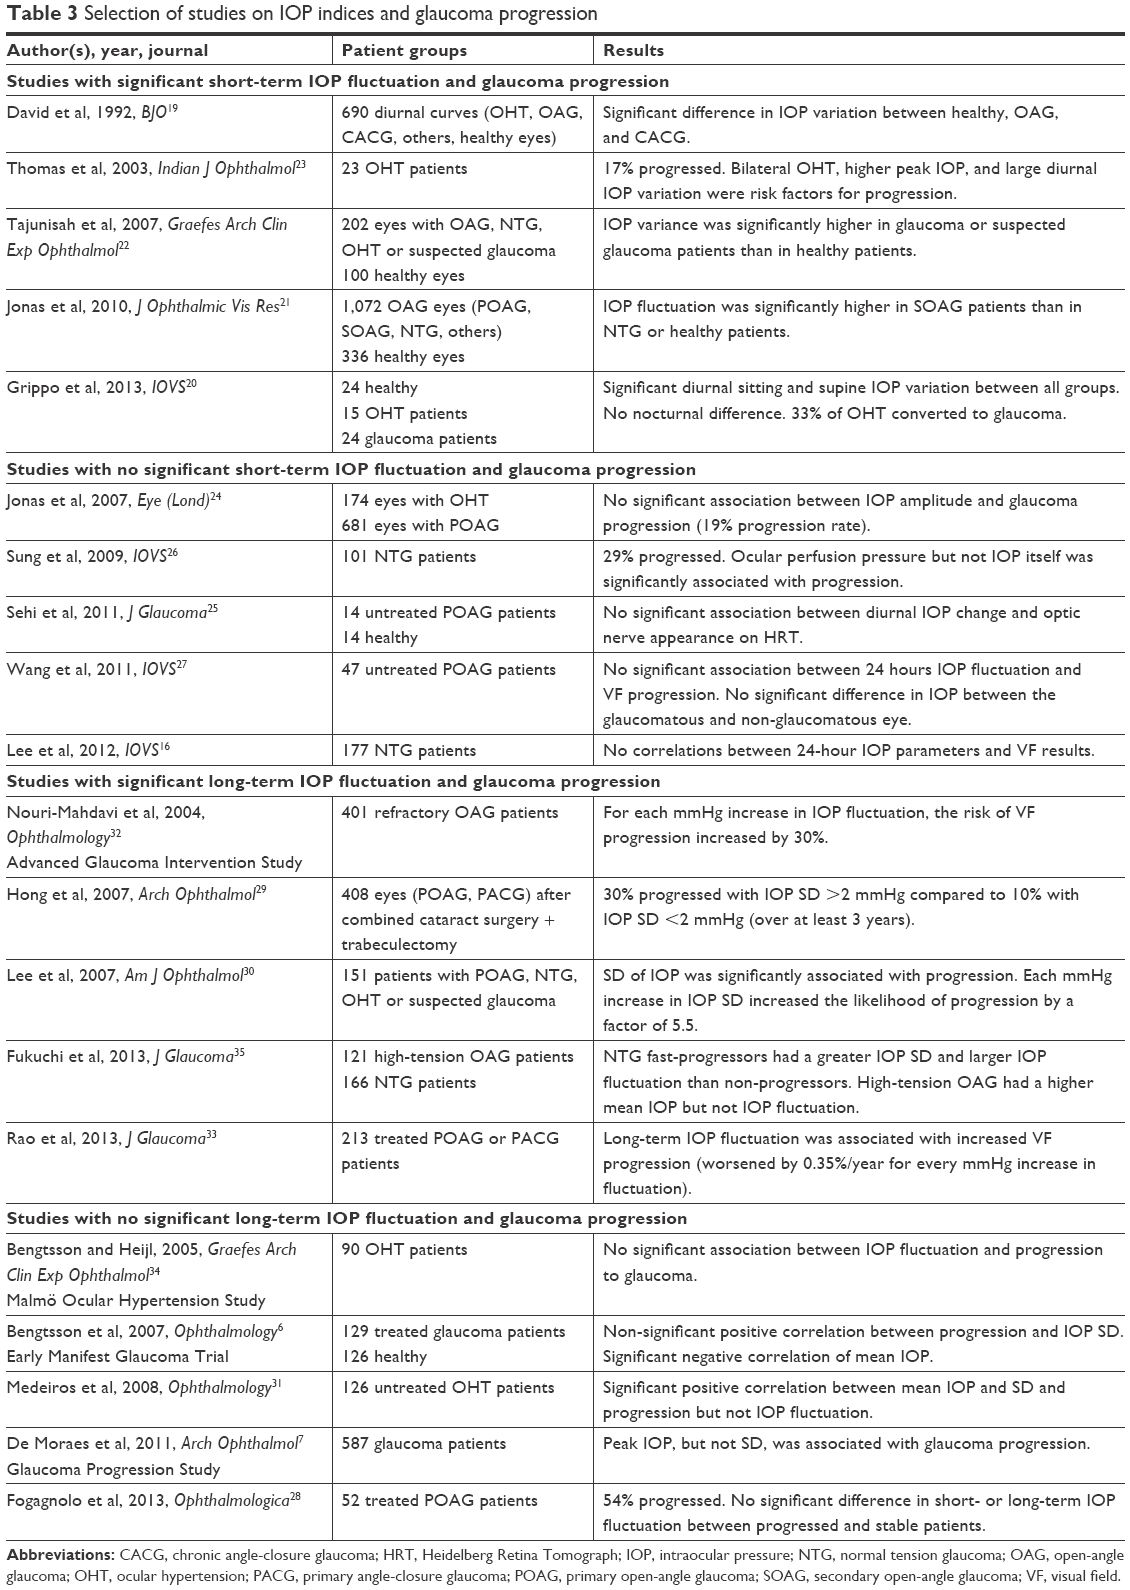 | Table 3 Selection of studies on IOP indices and glaucoma progression |
Several limitations of our study have to be discussed. First, this was a retrospective collection of data with a risk of bias and confounding. Second, as our study reflects daily practice, patients without any progression may not have received intensive follow-up as fast-progressing patients. By including all patients’ data for evaluating glaucoma progression, we have tried to address the problem of pre-selecting data. The classification of progression and non-progression was subjective without masking to structural or functional tests or IOP readings. Also, grading of glaucoma progression or no progression was performed by a single experienced glaucoma specialist without determining the individual test–retest reproducibility. Third, we have included a variety of patients with different types of glaucoma, eg, POAG, NTG, and secondary glaucoma. This may have affected the progression rate because different glaucoma types progress faster than others. Fourth, results of multivariate Cox regression analysis should be interpreted with caution since only a small number of patients with progression on VF or HRT were included. The last and important weakness of our study was the fact that glaucoma treatment may change during follow-up if progression is suspected. This would have caused biases in the conclusion of our study, which should therefore be interpreted with caution.
Conclusion
Our results show that short-term, but not long-term IOP fluctuation influences the progression of glaucoma. Analysis of risk factors did not reveal any significant influence of demographic characteristics, ocular or general health on glaucoma progression. Time to progression was fairly similar for VF and HRT analysis. Prospective clinical trials are needed to answer the question of whether or not short-term or long-term IOP fluctuation is a risk factor of glaucoma progression.
Author contributions
All authors contributed to data analysis, drafting and revising the article, gave final approval of the version to be published, and agree to be accountable for all aspects of the work.
Disclosure
The authors report no conflicts of interest in this work.
References
European Glaucoma Society Terminology and Guidelines for Glaucoma, 4th Edition – Part 1. Supported by the EGS Foundation. Br J Ophthalmol. 2017;101:1–72. | ||
Leske MC, Heijl A, Hyman L, Bengtsson B. Early Manifest Glaucoma Trial: design and baseline data. Ophthalmology. 1999;106(11):2144–2153. | ||
Oddone F, Centofanti M, Rossetti L, et al. Exploring the Heidelberg Retinal Tomograph 3 diagnostic accuracy across disc sizes and glaucoma stages: a multicenter study. Ophthalmology. 2008;115(8):1358–1365.e1. | ||
Wollstein G, Garway-Heath DF, Fontana L, Hitchings RA. Identifying early glaucomatous changes. Comparison between expert clinical assessment of optic disc photographs and confocal scanning ophthalmoscopy. Ophthalmology. 2000;107(12):2272–2277. | ||
The Advanced Glaucoma Intervention Study (AGIS): 7. The relationship between control of intraocular pressure and visual field deterioration. The AGIS Investigators. Am J Ophthalmol. 2000;130(4):429–440. | ||
Bengtsson B, Leske MC, Hyman L, Heijl A; Early Manifest Glaucoma Trial Group. Fluctuation of intraocular pressure and glaucoma progression in the early manifest glaucoma trial. Ophthalmology. 2007;114(2):205–209. | ||
De Moraes CG, Juthani VJ, Liebmann JM, et al. Risk factors for visual field progression in treated glaucoma. Arch Ophthalmol. 2011;129(5):562–568. | ||
Heijl A, Leske MC, Bengtsson B, et al; Early Manifest Glaucoma Trial Group. Reduction of intraocular pressure and glaucoma progression: results from the Early Manifest Glaucoma Trial. Arch Ophthalmol. 2002;120(10):1268–1279. | ||
De Moraes CG, Jasien JV, Simon-Zoula S, Liebmann JM, Ritch R. Visual field change and 24-hour IOP-related profile with a contactlenssensor in treated glaucoma patients. Ophthalmology. 2016;123(4):744–753. | ||
Kass MA, Heuer DK, Higginbotham EJ, et al. The Ocular Hypertension Treatment Study: a randomized trial determines that topical ocular hypotensive medication delays or prevents the onset of primary open-angle glaucoma. Arch Ophthalmol. 2002;120(6)701–713; discussion 829–830. | ||
De Moraes CG, Demirel S, Gardiner SK, et al; Ocular Hypertension Treatment Study Group. Effect of treatment on the rate of visual field change in the ocular hypertension treatment study observation group. Invest Ophthalmol Vis Sci. 2012;53(4):1704–1709. | ||
Lee PP, Sultan MB, Grunden JW, Cioffi GA; Consensus Panel. Assessing the Importance of IOP Variables in Glaucoma Using a Modified Delphi Process. J Glaucoma. 2010;19(5):281–287. | ||
Caprioli J, Coleman AL. Intraocular pressure fluctuation a risk factor for visual field progression at low intraocular pressures in the advanced glaucoma intervention study. Ophthalmology. 2008;115(7):1123:1123–1129.e3. | ||
Mottet B, Aptel F, Romanet JP, Hubanova R, Pépin JL, Chiquet C. 24-hour intraocular pressure rhythm in young healthy subjects evaluated with continuous monitoring using a contact lens sensor. JAMA Ophthalmol. 2013;131(12):1507–1516. | ||
Jonas JB, Budde W, Stroux A, Oberacher-Velten IM, Jünemann A. Single intraocular pressure measurements and diurnal intraocular pressure profiles. Am J Ophthalmol. 2005;139(6):1136–1137. | ||
Lee YR, Kook MS, Joe SG, et al. Circadian (24-hour) pattern of intraocular pressure and visual field damage in eyes with normal-tension glaucoma. Invest Ophthalmol Vis Sci. 2012;53(2):881–887. | ||
Shuba LM, Doan AP, Maley MK, et al. Diurnal fluctuation and concordance of intraocular pressure in glaucoma suspects and normal tension glaucoma patients. J Glaucoma. 2007;16(3):307–312. | ||
Kotecha A, Crabb DP, Spratt A, Garway-Heath DF. The relationship between diurnal variations in intraocular pressure measurements and central corneal thickness and corneal hysteresis. Invest Ophthalmol Vis Sci. 2009;50(9):4229–4236. | ||
David R, Zangwill L, Briscoe D, Dagan M, Yagev R, Yassur Y. Diurnal intraocular pressure variations: an analysis of 690 diurnal curves. Br J Ophthalmol. 1992;76(5):280–283. | ||
Grippo TM, Liu JH, Zebardast N, Arnold TB, Moore GH, Weinreb RN. Twenty-four-hour pattern of intraocular pressure in untreated patients with ocular hypertension. Invest Ophthalmol Vis Sci. 2013;54(1):512–517. | ||
Jonas JB, Budde WM, Stroux A, Oberacher-Velten IM, Juenemann AG. Circadian intraocular pressure profiles in chronic open angle glaucomas. J Ophthalmic Vis Res. 2010;5(2):92–100. | ||
Tajunisah I, Reddy SC, Fathilah J. Diurnal variation of intraocular pressure in suspected glaucoma patients and their outcome. Graefes Arch Clin Exp Ophthalmol. 2007;245(12):1851–1857. | ||
Thomas R, Parikh R, George R, Kumar RS, Muliyil J. Five-year risk of progression of ocular hypertension to primary open angle glaucoma. A population-based study. Indian J Ophthalmol. 2003;51(4):329–333. | ||
Jonas JB, Budde WM, Stroux A, Oberacher-Velten IM, Jünemann A. Diurnal intraocular pressure profiles and progression of chronic open-angle glaucoma. Eye (Lond). 2007;21(7):948–951. | ||
Sehi M, Flanagan JG, Zeng L, Cook RJ, Trope GE. The association between diurnal variation of optic nerve head topography and intraocular pressure and ocular perfusion pressure in untreated primary open-angle glaucoma. J Glaucoma. 2011;20(1):44–50. | ||
Sung KR, Lee S, Park SB, et al. Twenty-four hour ocular perfusion pressure fluctuation and risk of normal-tension glaucoma progression. Invest Ophthalmol Vis Sci. 2009;50(11):5266–5274. | ||
Wang NL, Friedman DS, Zhou Q, et al. A population-based assessment of 24-hour intraocular pressure among subjects with primary open-angle glaucoma: the handan eye study. Invest Ophthalmol Vis Sci. 2011;52(11):7817–7821. | ||
Fogagnolo P, Orzalesi N, Centofanti M, Oddone F, Manni G, Rossetti L. Short- and long-term phasing of intraocular pressure in stable and progressive glaucoma. Ophthalmologica. 2013;230(2):87–92. | ||
Hong S, Seong GJ, Hong YJ. Long-term intraocular pressure fluctuation and progressive visual field deterioration in patients with glaucoma and low pressures after triple procedure. Arch Ophthalmol. 2007; 125(8):1010–1013. | ||
Lee PP, Walt JW, Rosenblatt LC, Siegartel LR, Stern LS; Glaucoma Care Study Group. Association between intraocular pressure variation and glaucoma progression: data from a United States chart review. Am J Ophthalmol. 2007;144(6):901–907. | ||
Medeiros FA, Weinreb RN, Zangwill LM, et al. Long-term intraocular pressure fluctuations and risk of conversion from ocular hypertension to glaucoma. Ophthalmology. 2008;115(6):934–940. | ||
Nouri-Mahdavi K, Hoffman D, Coleman AL, et al; Advanced Glaucoma Intervention Study. Predictive factors for glaucomatous visual field progression in the Advanced Glaucoma Intervention Study. Ophthalmology. 2004;111(9):1627–1635. | ||
Rao HL, Addepalli UK, Jonnadula GB, Kumbar T, Senthil S, Garudadri CS. Relationship between intraocular pressure and rate of visual field progression in treated glaucoma. J Glaucoma. 2013;22(9):719–724. | ||
Bengtsson B, Heijl A. Diurnal IOP fluctuation: not an independent risk factor for glaucomatous visual field loss in high-risk ocular hypertension. Graefes Arch Clin Exp Ophthalmol. 2005;243(6):513–518. | ||
Fukuchi T, Yoshino T, Sawada H, et al. The relationship between the mean deviation slope and follow-up intraocular pressure in open-angle glaucoma patients. J Glaucoma. 2013;22(9):689–697. | ||
Kim JH, Caprioli J. Intraocular Pressure Fluctuation: Is It Important? J Ophthalmic Vis Res. 2018;13(2):170–174. | ||
Leidl MC, Choi CJ, Syed ZA, Melki SA. Intraocular pressure fluctuation and glaucoma progression: what do we know? Br J Ophthalmol. 2014;98(10):1315–1319. | ||
Rezapour J, Hoffmann EM. The role of intraocular pressurefluctuation in the development and progression of glaucoma. Klin Monbl Augenheilkd. Epub 2017 May 17. | ||
Sultan MB, Mansberger SL, Lee PP. Understanding the importance of IOP variables in glaucoma: a systematic review. Surv Ophthalmol. 2009;54(6):643–662. | ||
Lee EW, Wei LJ, Amato DA, Leurgans S. Cox-type regression analysis for large numbers of small groups of correlated failure time observations. Surviv Anal State Art. 1992;211(series Nato Science):237–247. |
 © 2018 The Author(s). This work is published and licensed by Dove Medical Press Limited. The full terms of this license are available at https://www.dovepress.com/terms.php and incorporate the Creative Commons Attribution - Non Commercial (unported, v3.0) License.
By accessing the work you hereby accept the Terms. Non-commercial uses of the work are permitted without any further permission from Dove Medical Press Limited, provided the work is properly attributed. For permission for commercial use of this work, please see paragraphs 4.2 and 5 of our Terms.
© 2018 The Author(s). This work is published and licensed by Dove Medical Press Limited. The full terms of this license are available at https://www.dovepress.com/terms.php and incorporate the Creative Commons Attribution - Non Commercial (unported, v3.0) License.
By accessing the work you hereby accept the Terms. Non-commercial uses of the work are permitted without any further permission from Dove Medical Press Limited, provided the work is properly attributed. For permission for commercial use of this work, please see paragraphs 4.2 and 5 of our Terms.