")
Back to Journals » International Journal of Nanomedicine » Volume 14
Investigation of gold nanoparticle effects in brachytherapy by an electron emitter ophthalmic plaque
Authors Hashemi S, Aghamiri MR, Kahani M, Jaberi R
Received 18 February 2019
Accepted for publication 4 May 2019
Published 6 June 2019 Volume 2019:14 Pages 4157—4165
DOI https://doi.org/10.2147/IJN.S205814
Checked for plagiarism Yes
Review by Single anonymous peer review
Peer reviewer comments 2
Editor who approved publication: Prof. Dr. Anderson Oliveira Lobo
S Hashemi,1 MR Aghamiri,1 M Kahani,1 R Jaberi2
1Radiation Medicine Engineering Department, Shahid Beheshti University, Tehran, Iran; 2Cancer Institute, Imam Khomeini Hospital, Tehran, Iran
Background: During decades, all improvements and developments in radiation therapy technologies have been focused on its main goal: maximize the dose in the tumor and minimize it in surrounding normal tissues. Recently, scientists have some approaches to nanoparticles, especially gold nanoparticles (GNPs), for dose localization.
Purpose: Herein, the effect of GNPs in combination with electron brachytherapy in a model of eye tumor has been investigated.
Materials and methods: Monte Carlo simulation was utilized and a complete anatomical model of the eye, a tumor with 5 mm thick, and a type of Ruthenium-106 beta emitter ophthalmic plaque were simulated. Simulation results have been validated by a Plexiglas eye phantom and film dosimetry, experimentally.
Results: The results showed using GNPs causes the dose amplification in 2 mm from the plaque surface which the higher concentration has the higher enhancement. At more distances, Dose Enhancement Factors (DEFs) have the negative amounts, so that total delivered dose to the tumor has decreased with increasing of Au concentrations and the dose of organ at risk like sclera has increased.
Conclusion: Therefore, using of GNPs along with a 106,Ru/106,Rh ocular plaque, as an electron emitter source, is a good choice only for superficial lesions, and it is not recommended for deeper tumors due to the parameters of radiation treatment and delivered dose to the tissues.
Keywords: gold-nanoparticles, dose enhancement, electron brachytherapy, Ru-106 eye plaque, Monte Carlo simulation
Introduction
Ocular melanoma is the rarest and most dangerous intraocular tumor with a probability of one hundred thousand per year, which can lead to vision loss or even death.1,2 Using the sealed radiation sources is a viable treatment modality of radiotherapy for this tumor. Two types of plaque are available: photon- and electron-emitter. 106Ru types of plaque are one of the electron emitter plaques, which is produced by Eckert & Ziegler BEBIG GmbH in Germany, and used to the small size of melanoma with a maximum thickness of 5 mm. Short-range radiation, the size of a few millimeters or less, with a small degree of irradiation broadband disruption on surrounding normal tissue has given preference to these types of brachytherapy modality.3–6
In recent years, one of the scientist attempts to dose enhancement and improvement of treatment efficacy in the field of radiation medicine is a combination of nano-materials with various types of radiation. Gold nanoparticles (GNPs) are the most attractive material in this regard, and many investigations have been conducted on its characteristics.7–12 GNPs due to its high atomic number (Z=79) rather than body soft tissue drastically increase the probability of photoelectric absorption and therefore, delivered doses. Jones et al13 employed Monte Carlo calculations to estimate the dose enhancement factor (DEF) around the GNPs. They used a water phantom and six different photon sources. C. Hwang et al14 analyzed the effects of type, concentration, and diameter of nanoparticles for dose enhancement of low- and high-energy X-rays of a medical linear accelerator. Monte Carlo N-particle eXtended (MCNPX) code was used for dose calculation with a mathematical Snyder head phantom. Asadi et al15 studied on choroidal melanoma and the effect of GNPs in combination with I-125 ophthalmic brachytherapy.
As can be seen, there are a lot of studies which investigate GNPs in a medium under photon radiation exposure, but electron therapy has a much lower contribution. Among the rare studies, Rahman et al12 studied on the enhancement of radiation effect on the bovine aortic endothelial cells in the presence of GNPs. They used superficial X-ray and megavoltage electron radiation therapy.
Due to the high energy deposition and short radiation range with a little dose to underlying normal tissues and structures,16 electron therapy could have an important impact in the treatment of sensitive organs like the eye. Consequently and because of the good results on target dose enhancement in photon irradiation with GNPs, the question is whether the combination of electron emission plaque as a source of electron radiation and the presence of GNPs in target tissue will help dose improvement in target or not. This study aims to investigate the radiation-based treatment modality of a choroidal tumor with an electron emitter eye plaque in the presence of GNPs.
Material and methods
106Ru-ophthalmic plaque
Ruthenium-106 (106Ru), a fission product in a nuclear reactor, is a beta emitter source with a mean energy of 10 KeV and maximum energy of 39 KeV. 106Ru is disintegrated to the stable nuclide 106Pd via 106Rh, where the half-life of 106Ru is 368.2 days and 106Rh is 29.9 s. The important factor in 106Ru decay is its daughter nucleus, Rhodium-106 (106Rh), which is an energetic beta ray source. 106Rh emits continue spectrum of the beta ray with a maximum energy of 3.5 MeV and a peak of 1.4 MeV. Figure 1A shows the spectrum of 106Rh.
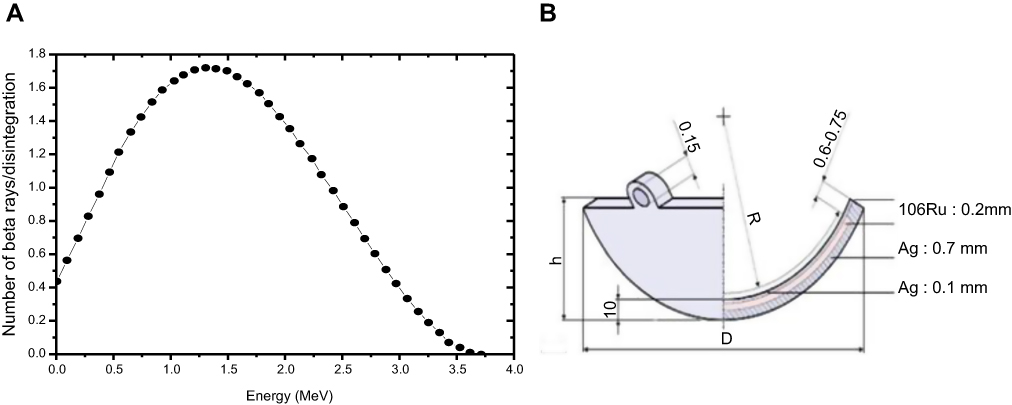 | Figure 1 (A) The energy spectrum of 106Ru/106Rh17 and (B) CCB concave model of 106Ru eye applicator. |
CCB concave model of 106Ru plaque is divided into three layers (see Figure 1B); the radioactive layer is located between two windows of silvers. This layer has a thickness of 0.2 mm. The concave window has a thickness of 0.1 mm and the back silver window has 0.7 mm. Low-energy beta ray of 106Ru, because of its short-range, cannot escape from the plaque silver window; so they were not considered in the calculation. CCB has a radius of curvature of 12 mm, the external diameter of 20 mm, and the initial activity of 24.6 MBq that is reported by the manufacturer.
Simulation dosimetry
MCNPX, Monte Carlo simulation code
The Monte Carlo (MC) MCNPX code is a general-purpose MC code for radiation transport simulation, developed by Los Alamos National Laboratory in the United States,18 which can be used for nuclear, industrial, and medical simulations. By increasing computer processing power in recent years, the interest in employing the MC codes in the field of radiation research has dramatically extended.19,20 Simulation is used when the experimental study is not possible due to the difficult, expensive, or even dangerous procedure and in the case of nanoparticles dose enhancement, in the first steps, simulation is employed to achieve a physical assurance for a clinical justification.
Herein, a complete geometry of the eyeball, including sclera, choroid, retina, cornea, skull bone, and surrounding tissues was performed by MCNPX MC Code (Figure 2). Sclera, choroid, and retina were modeled by three concentric spheres with 1 mm thickness and diameter of 2.4 cm for sclera. Lens, cornea, and tumor were simulated by an ellipsoid mathematical formula which has been taken from some medical references.15,21
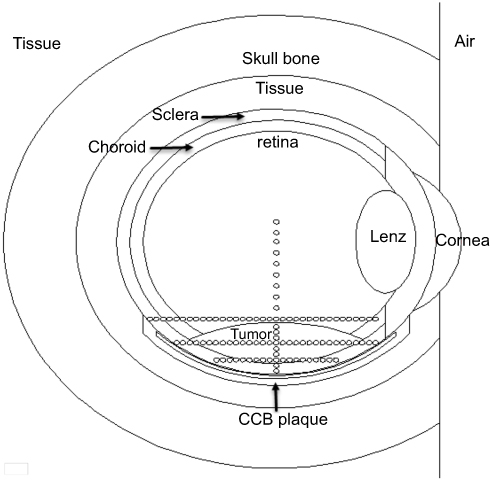 | Figure 2 Eye geometry defined in the MCNPX simulation code and CCB applicator sewn on the sclera. |
CCB applicator, with exact specification defined on the base of tumor and sclera. Therefore, dose rate and dose distribution were calculated on the central axis of plaques and perpendicular on it in a Plexiglas phantom. Some spheres were defined with a radius of 0.2 mm on the central axis of plaques with 0.5 mm intervals from each other and delivered doses were measured by them. Measuring processes were done using *f8: e tally of MCNPX MC Code with the number of 2×10⁸ histories and an uncertainty below of 2%. Also, spheres were defined in perpendicular lines of the central axis at various distances from plaque for getting profile dose information. Those have located on tumor basal, middle, and its apex (Figure 2).
The simulation was done in two stages: with and without GNP’s presence. The first step, dose values were measured for the result’s validation with experimental and manufacturer dosimetry. Afterward, three GNP concentrations of 12, 20, and 40 mgrAu/grTumor were introduced to a tumor cell and their effects on dosimetry were studied. These concentrations were chosen in the range of NPs concentrations of some previous studies14,22–26 and one of them (40 mgr/grTumor) selected a little more because of better investigation of electron behavior in the medium containing GNPs. Hainfeld27 reported a concentration ratio of 3.5:1 for tumor-to-muscle gold concentration. To investigate the effect of gold nanoparticles in tissues outside the tumor, a concentration of 5.7 mg Au/grTissue (in the case of 20 mg Au/grTumor) was introduced to the surrounding tumor tissues. Nanoparticle introduction was uniformly simulated in the form of a Plexiglas-gold mixture.
Experimental dosimetry
Phantom
Eye modeling for dose investigation of CCB applicator was done by a Plexiglas cubic phantom with the size of 4×4×4 cm3 containing the eyeball (Figure 3). Phantom is divided into some layers with 1 mm thick, so that the film can be located at various plaque distances. There are some cylinders in the cubic phantom with 1 mm thick and various radiuses for better modeling of the eyeball and its surrounding structures. The phantom was designed to be completely fixed under the plaque to leave no space between plaque and phantom for the elimination of any dosimetry error.
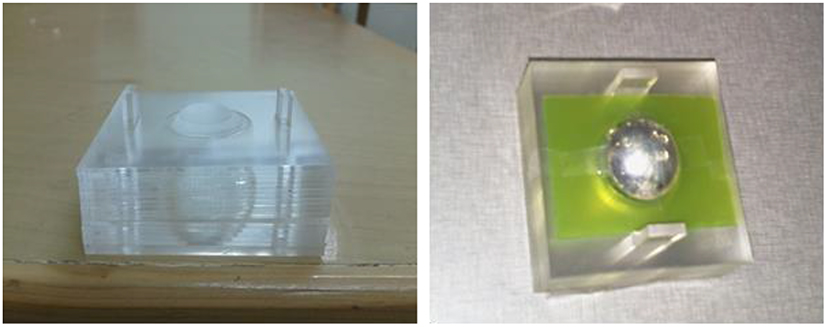 | Figure 3 Experimental phantom (left) and CCB plaque along with EBT2 film on the phantom in the experimental dosimetry (right). |
Film dosimetry
EBT-2 was employed for film dosimetry in this study. 106Ru plaque, CCB 1876 model, was located on the phantom and three pieces of EBT-2 were put on the phantom at distances of 3, 6, and 9 mm from plaque surface. Films can generate dosimetric shadow when placed below the treatment plaque within a phantom.28 Measuring process was repeated three times, and the results were averaged to reduce the human errors and uncertainty. The plaque was placed on the phantom for 80 mins.
For film dosimetry calibration, 10 pieces of film in size of 2×2 cm2, at radiation field of 15×15 cm2, and 100 cm SSD were irradiated by 6 MeV electron beam of a Varian 2100 Clinac. Films were scanned by Microtek ScanMarker 9800XL and analyzed by Matlab software. A region of interest (ROI) of every piece was chosen and film data were extracted from the red channel of the image because EBT has a maximum absorption at 636 nm, which is located on the red channel of the film.29
Results
Simulation validation
With converting the tally output to dose rate, data on the central axis of the plaque were compared with experimental results. Phantom’s EBT pieces, after passing a rest time,30–32 were scanned and analyzed. The amount of absorbed dose was calculated by the calibration curve. The relative depth dose along with the central axis is shown in Figure 4. The curves have been normalized on dose at 3 mm because the first piece of EBT, due to experimental constraints of dosimetry, was located at 3 mm distance from the plaque. Figure 4 represents a good agreement between experiment and simulation data. The correlation coefficient of curves in Figure 4 is 0.999.
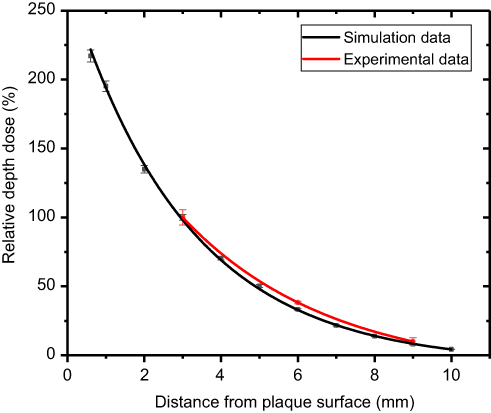 | Figure 4 RDD of simulation and experiment, normalized at 3 mm distance from the plaque. |
Simulation results were compared with reported dosimetry of manufacturer. Figure 5 represents the dose rate of CCB plaque along the central axis for manufacturer data and simulation measurement. The correlation coefficient of curves is 0.997 and a good correlation is obvious in this figure.
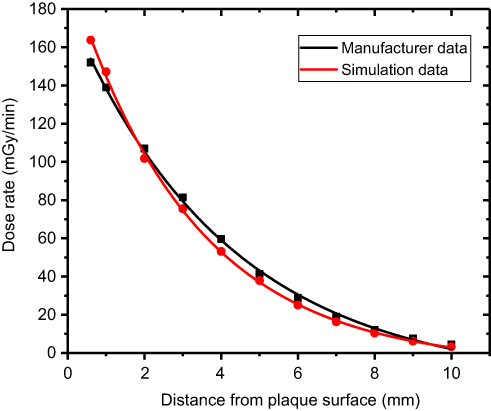 | Figure 5 Dose rate comparison between manufacturer and simulation data. |
It must be mentioned that this work was totally done with Plexiglas phantom due to its access to experimental work, while the manufacturer uses the water phantom. We evaluated the difference between water and Plexiglas phantoms by MCNPX simulation code, which can be seen in Figure 6.
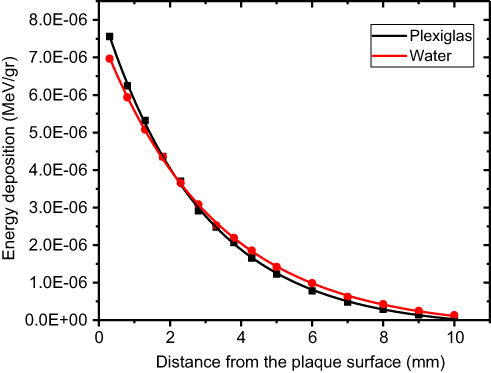 | Figure 6 Simulation results for Plexiglas and water phantom. |
Effects of GNP’s concentrations
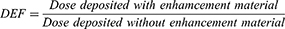
Three concentrations of GNPs, 12, 20, and 40 mgrAu/grTumor, were introduced to the tumoral region, and the energy deposited differences with and without GNPs were measured. The percent depth dose (PDD) versus distance from the plaque surface is shown for four situations in Figure 7. The values are normalized to the maximum dose in the nearest measuring point to the plaque surface (0.3 mm). It can be seen that the increase in GNP’s concentration will result to decrease the tumor dose. Dose enhancement factor (DEF) in Figure 8 could better show this matter (see Equation 1). It is quite obvious that adding GNPs to the target volume not only does not enhance the deposited dose but also will reduce it.
(1) 
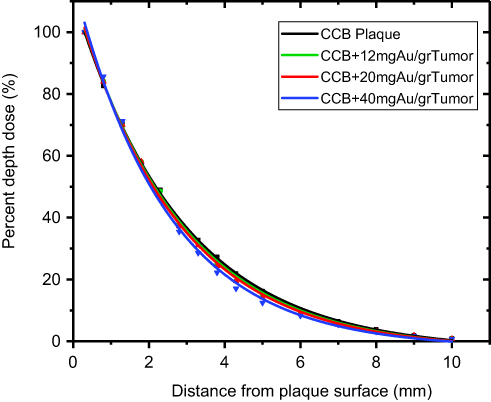 | Figure 7 PDD comparison with and without different GNP’s concentration. |
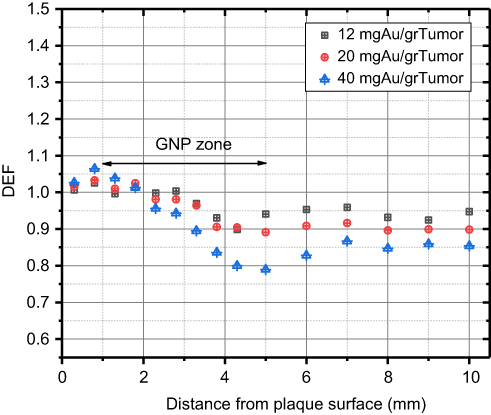 | Figure 8 Dose enhancement factor for different concentration of GNPs. |
The profiles of energy deposition were calculated, too. Three profiles of plaque deposited energy in the base, middle, and tumor apex were measured in the absence and presence of GNPs, which can be seen in Figure 9.
To investigate the total delivered dose to the tumor and a sensitive eye’s organ, tumor, and sclera considered as a cell individually. Figure 10 shows the electron energy deposition based on various GNP’s concentrations in tumor and sclera. It can be seen that GNPs adding and increasing its concentration just decrease the target dose and increase the dose of sclera as the most important organ at risk.
Figure 11 shows the results of a concentration of 5.7 mgAu/grTissue of gold simulation out of the tumor. As expected, the dose has increased about 5% in the tumor apex and this enhancement continued in the normal tissues after the tumor volume.
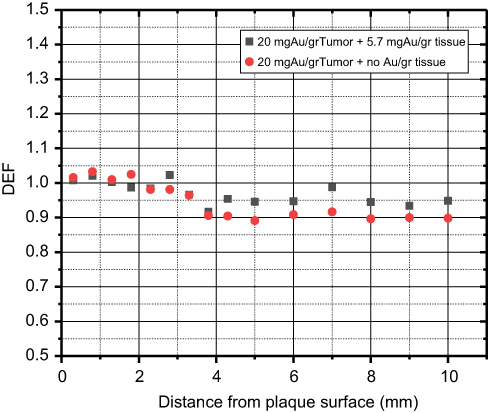 | Figure 11 Effect of 5.7 mgAu/grTissue in the tissues outside the tumor for 20 mgAu/grTumor inside the tumor. DEFs were measured at the central axis of plaque. |
Discussion
This study was performed to investigate dose variation in tumor and normal surrounding tissues by GNPs under beta irradiation of an eye plaque. Choroidal melanoma and the eye structures, as well as CCB model of 106Ru ophthalmic plaque, were modeled by MCNPX MC Code (Figure 2). Simulation validation was performed experimentally (Figure 4) and with manufacturer data (Figure 5). Due to the material difference of manufacture phantom and the phantom used in this work, we evaluated the differences in absorbing dose between water and Plexiglas phantoms, which can be seen in Figure 6. The results show that the difference is negligible and it does not have the same behavior in all points; it has a turning point. This matter can explain the turning point in Figure 5, too. At the initial interval, approximately until 2 mm, water has received a lower amount of energy than the Plexiglas (Figure 6) and subsequently, manufacturer measured the lower dose in a water phantom at this distance. Trend changes at the following and Plexiglas phantom absorbs lower energy rather than the water phantom and so simulation calculates the lower amount of dose. In general, it was shown that the simulation results are in a good correlation with the experiment and manufacturer dosimetry.
Figures 7 and 8 show the effect of introducing GNPs to the target volume without any GNPs out of the tumor. Tumor area is bounded between 1 and 5 mm from the plaque surface (see Figure 2) and GNPs are only present in this region. Figure 7 demonstrates that there is a reduction of energy deposition in the tumoral region with GNPs which this reduction increases with distance and concentration. It can be seen that (Figure 8) dose enhancement has occurred for first 2 mm distance from the plaque surface and after that dose has decreased, and its minimum amount is located in the apex of the tumor (5 mm) which higher concentration has the higher reduction. The percent DEF for the concentration of 40 mgAu/grTumor is 5% at the tumor basal and −20% at the tumor apex (Figure 8). It seems that high energetic electron, passing close to the heavy gold nuclide, loses some fraction of its energy in the form of Bremsstrahlung photon. This photon can escape from the intended target and may reach for underlying normal tissues. These results were repeated when a concentration of GNPs considered outside the tumor but delivered dose to normal tissue increased about 5% compared to the case of no GNPs in surrounding tissues (see Figure 11).
This is while the most articles, which studied on photon therapy modalities, have pointed out the usefulness of using GNPs. Jones et al13 reported a remarkable microscopic dose enhancement for GNPs and low energy photon sources. C. Hwang et al14 showed that among some important nanoparticles, GNPs has the greatest DEFs and the amplification increases with increasing nanoparticle diameter and concentration. Asadi et al15 reported dose amplification in the tumor cell and absorbed dose reduction at normal tissues. Rahman et al12 who studied on both photon and electron beam, reported a lower survival percentage in cells containing GNPs for photon and electron irradiations. While the results of our study demonstrate that using GNPs with high energy electron beam does not only increase the dose of the tumor but also reduce the delivered dose to the tumor. In the explanation of this contradiction, it must be considered that Rahman et al employed megavoltage electron radiation of a medical linear accelerator for measuring GNPs effects on bovine aortic endothelial cells, which are different from the radiotherapy conditions like electron energy and the subject of this study.
In this study, the profiles of energy deposition were calculated, too. Three profiles of plaque deposited energy in the base, middle, and apex of the tumor were measured in the absence and presence of GNPs, which can be seen in Figure 9. What is observable is as follows: at the tumor base, the largest concentration of GNPs has the largest amount of energy deposition and dose of CCB plaque without GNPs has the minimum amount; therefore dose enhancement has occurred. The maximum percent of DEF at tumor base is 7%, 4%, and 3% for 40, 20, and 12 mgAu/grTumor, respectively. As far as plaque surface toward the tumor apex these values will be reversed. At the apex, which maximum dose is prescribed for, 106Ru plaque delivers the maximum dose alone and 40 mgAu/grTumor has the lowest amount of absorbed dose.
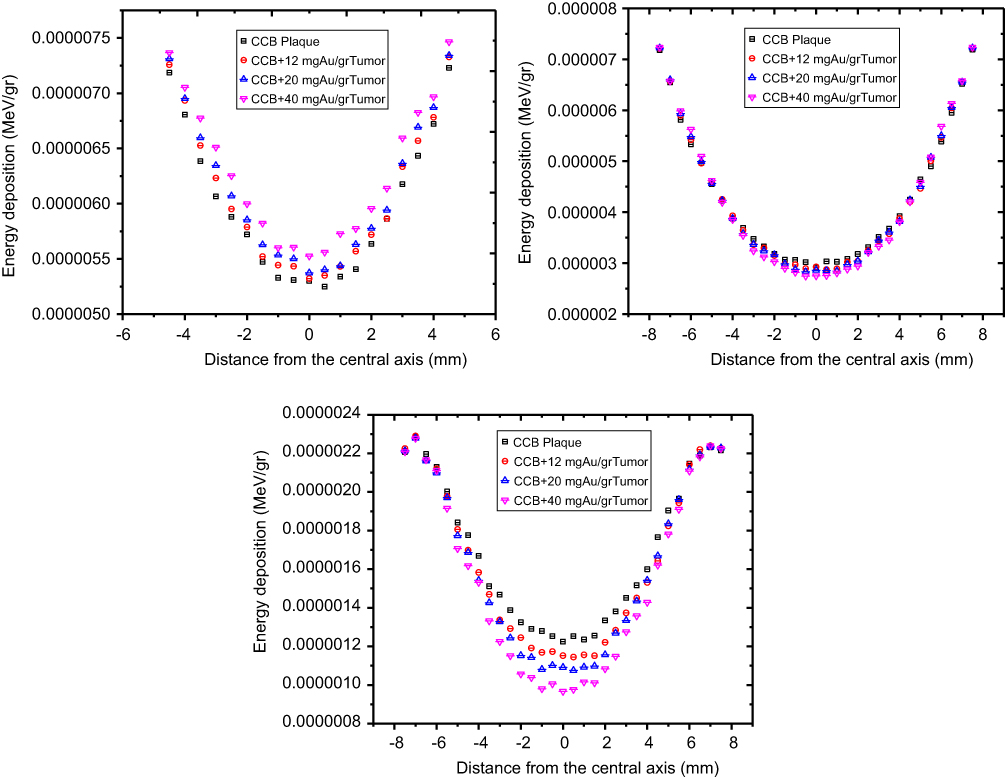 | Figure 9 Energy deposition profile in three distance of plaque: (up-left) 1.3 mm and in the tumor base, (up-right) 3 mm and in the tumor middle, (down) 5 mm and in the tumor apex. |
As can be seen in Figure 8, in the range of 2 mm from the plaque, an enhancement has occurred and large GNP’s concentration has delivered the largest amount of energy. Therefore, it can be concluded that at small distances from the source of electron radiation, GNPs can be used as a dose enhancer. This can be approval for employing the GNPs for electron therapy of superficial tumors. It should be mentioned that there are no GNPs at the interval of 0 to 1 mm. This amplification may be occurring due to bremsstrahlung photons which scatter backward. The maximum DEF in the depth of 1 mm was equal to 7% for 40 mg Au/gr Tumor.
Forasmuch as the aim of the radiation treatment planning is to deliver the maximum possible dose to the tumor and the minimum dose to the healthy surrounding tissues, so it can be seen that the result of GNP’s employment in radiation therapy with electron emitter ophthalmic plaque, 106Ru/106Rh, is exactly to the contrary of radiation treatment planning’s goal, as it can be seen in Figure 10. Therefore, according to the results of this study, it can be said that the use of GNPs with 106Ru ophthalmic plaque is a wrong choice for ocular tumors with more than 2 mm extent, while it can be useful for dose improvement of a tumor with less than 2 mm depth. An example of this kind of tumors can be found at the ocular surface. They are especially the conjunctival melanoma and conjuctival squamous cell carcinomas of the epibulbar conjunctiva which are usually flat and occasionally treated by brachytherapy.33,34
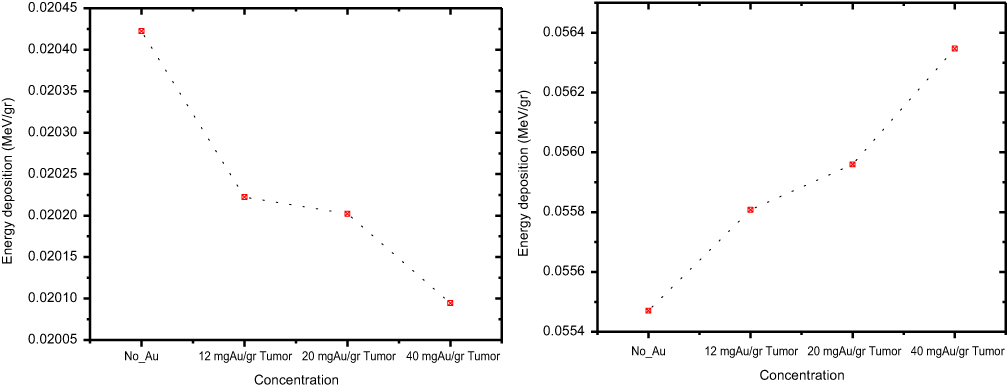 | Figure 10 Energy deposition in tumor cell (left) and sclera (right) at different concentration of GNPs. |
Conclusion
Investigation of electron brachytherapy of eye melanoma demonstrates that employing GNPs cause to decrease tumor absorbed dose and increase the dose of organ at risk like sclera. This conclusion is correct for an interval more than 2 mm from the plaque surface. For shorter distances, GNP’s concentrations improve the target dose and can be used as a dose enhancer in the tumoral region. So, GNPs with electron brachytherapy can be a good treatment approach for superficial lesions and tumors of the ocular surface.
Disclosure
The authors report no conflicts of interest in this work.
References
1. Hill JC, Sealy R, Shackleton D, et al. Improved iodine125 plaque design in the treatment of choroidal malignant melanoma. Br J Ophthalmol. 1992;76:914. doi:10.1136/bjo.76.2.91
2. Gerbaulet A, Potter R, Mazeron JJ, Meertens H, Van Limbergen E. The GEC ESTRO Handbook of Brachytherapy. European Society for Therapeutic Radiology and Oncology and International Atomic Energy Agency (IAEA), Leuven; 2002. ISBN.
3. Orion I, Rubin E. Dose Calculations of the Ru/Rh-106 CCA and CCB Eyes Applicators. InBrachytherapy, InTechOpen ; 2012. ISBN.
4. Barbosa NA, Da Rosa LAR, Facure A, Braz D. Brachytherapy treatment simulation of strontium-90 and ruthenium-106 plaques on small size posterior uveal melanoma using MCNPX code. Radiat Phys Chem. 2014;95:224–226. doi:10.1016/j.radphyschem.2012.12.025
5. Brualla L, Sempau J, Zaragoza FJ, Wittig A, Sauerwein W. Accurate estimation of dose distributions inside an eye irradiated with 106Ru plaques. StrahlentherOnkol. 2013;189:68–73. doi:10.1007/s00066-012-0245-6
6. Šolc J. Monte Carlo calculation of dose to water of a 106Ru COB-type ophthalmic plaque. J Phys. 2008;102(1):012021.
7. Detappe A, Kunjachan S, Drané P, et al. Key clinical beam parameters for nanoparticle-mediated radiation dose amplification. Sci Rep. 2016;23(6):34040. doi:10.1038/srep34040
8. Zhang XD, Guo ML, Wu HY, et al. Irradiation stability and cytotoxicity of gold nanoparticles for radiotherapy. Int J Nanomedicine. 2009;4:165. doi:10.2147/IJN.S6723
9. Leung MK, Chow JC, Chithrani BD, Lee MJ, Oms B, Jaffray DA. Irradiation of gold nanoparticles by x-rays: Monte Carlo simulation of dose enhancements and the spatial properties of the secondary electrons production. Med Phys. 2011;38(2):624–631. doi:10.1118/1.3539623
10. Paro AD, Hossain M, Webster TJ, Su M. Monte Carlo and analytic simulations in nanoparticle-enhanced radiation therapy. Int J Nanomedicine. 2016;11:4735. doi:10.2147/IJN.S114025
11. Cooper DR, Bekah D, Nadeau JL. Gold nanoparticles and their alternatives for radiation therapy enhancement. Front Chem. 2014;14(2):86.
12. Rahman WN, Bishara N, Ackerly T, et al. Enhancement of radiation effects by gold nanoparticles for superficial radiation therapy. Nanomedicine. 2009;5(2):136–142.
13. Jones BL, Krishnan S, Cho SH. Estimation of microscopic dose enhancement factor around gold nanoparticles by Monte Carlo calculations. Med Phys. 2010;37(7Part1):3809–3816. doi:10.1118/1.3455703
14. Hwang C, Kim JM, Kim J. Influence of concentration, nanoparticle size, beam energy, and material on dose enhancement in radiation therapy. J Radiat Res. 2017;58(4):405–411. doi:10.1093/jrr/rrx009
15. Asadi S, Vaez‐Zadeh M, Masoudi SF, Rahmani F, Knaup C, Meigooni AS. Gold nanoparticle‐based brachytherapy enhancement in choroidal melanoma using a full Monte Carlo model of the human eye. J Appl Clin Med Phys. 2015;16(5):344–357. doi:10.1120/jacmp.v16i5.5568
16. Hogstrom KR, Almond PR. Review of electron beam therapy physics. Phys Med Biol. 2006;51(13):R455. doi:10.1088/0031-9155/51/13/R25
17. ICRU (International Commission on Radiation Units and Measurements). Dosimetry of beta rays and low-energy photons for brachytherapy with sealed sources. ICRU Report 72, 2001. Preliminary version.
18.
19. Boone JM, Buonocore MH, Cooper VN. Monte Carlo validation in diagnostic radiological imaging. Med Phys. 2000;27(6):1294–1304. doi:10.1118/1.599007
20. Kahani M, Kamali-Asl A, Tabrizi SH. Proposition of a practical protocol for obtaining a valid radiology image using radiography tally of MCNPX Monte Carlo Code. Appl Radiat Isot. 2019. doi:10.1016/j.apradiso.2019.02.013
21. Yoriyaz H, Sanchez A, Dos Santos A. A new human eye model for ophthalmic brachytherapy dosimetry. Radiat Prot Dosimetry. 2005;115(1–4):316–319. doi:10.1093/rpd/nci105
22. Toossi MTB, Ghorbani M, Mehrpouyan M, Akbari F, Sabet LS, Meigooni AS. A Monte Carlo study on tissue dose enhancement in brachytherapy: a comparison between gadolinium and gold nanoparticles. Australas Phys Eng Sci Med. 2012;35(2):177–185. doi:10.1007/s13246-012-0143-3
23. Hossain M, Su M. Nanoparticle location and material-dependent dose enhancement in X-ray radiation therapy. The Journal of Physical Chemistry C. 2012;116(43):23047–23052. doi:10.1021/jp306543q
24. Zabihzadeh M, Arefian S. Tumor dose enhancement by nanoparticles during high dose rate 192 Ir brachytherapy. J Cancer Res Ther. 2015;11(4):752. doi:10.4103/0973-1482.153668
25. Pakravan D, Ghorbani M, Momennezhad M. Tumor dose enhancement by gold nanoparticles in a 6 MV photon beam: a Monte Carlo study on the size effect of nanoparticles. Nukleonika. 2013;58.
26. Mesbahi A, Jamali F. Effect of photon beam energy, gold nanoparticle size and concentration on the dose enhancement in radiation therapy. BioImpacts: BI. 2013;3(1):29.
27. Hainfeld JF, Slatkin DN, Smilowitz HM. The use of gold nanoparticles to enhance radiotherapy in mice. Phys Med Biol. 2004;49(18):N309. doi:10.1088/0031-9155/49/18/N03
28. Eidi R, Aghamiri SR, Sheibani S, Jaberi R, Pourbeigi H, Daghigh SM. Three-dimensional dosimetry imaging of 125i plaque using gafchromic film for eye cancer treatment. Brachytherapy. 2013;12:S63–S64. doi:10.1016/j.brachy.2013.01.126
29.
30. Devic S. Radiochromic film dosimetry: past, present, and future. Physica Medica. 2011;27.3:122–134. doi:10.1016/j.ejmp.2010.10.001
31. Sim GS, Wong JHD, Ng KH. The use of radiochromic EBT2 film for the quality assurance and dosimetric verification of 3D conformal radiotherapy using microtek scanmaker 9800XL flatbed scanner. J Appl Clin Med Phys. 2013;14(4). doi:10.1120/jacmp.v14i4.4182
32. Bilge H, Cakir A, Okutan M, Acar H . Surface dose measurements with Gafchromic EBT film for 6 and 18MV photon beams. Physica Medica. 2009;25(2):101–104. doi:10.1016/j.ejmp.2008.05.001
33. Honavar SG, Manjandavida FP. Tumors of the ocular surface: A review. Indian J Ophthalmol. 2015;63(3):187. doi:10.4103/0301-4738.156912
34. Mehta M, Fay A. Squamous cell carcinoma of the eyelid and conjunctiva. Int Ophthalmol Clin. 2009;49(1):111–121. doi:10.1097/IIO.0b013e3181928fb9
 © 2019 The Author(s). This work is published and licensed by Dove Medical Press Limited. The full terms of this license are available at https://www.dovepress.com/terms.php and incorporate the Creative Commons Attribution - Non Commercial (unported, v3.0) License.
By accessing the work you hereby accept the Terms. Non-commercial uses of the work are permitted without any further permission from Dove Medical Press Limited, provided the work is properly attributed. For permission for commercial use of this work, please see paragraphs 4.2 and 5 of our Terms.
© 2019 The Author(s). This work is published and licensed by Dove Medical Press Limited. The full terms of this license are available at https://www.dovepress.com/terms.php and incorporate the Creative Commons Attribution - Non Commercial (unported, v3.0) License.
By accessing the work you hereby accept the Terms. Non-commercial uses of the work are permitted without any further permission from Dove Medical Press Limited, provided the work is properly attributed. For permission for commercial use of this work, please see paragraphs 4.2 and 5 of our Terms.