")
Back to Journals » OncoTargets and Therapy » Volume 8
Investigation of brain tumors using 18F-fluorobutyl ethacrynic amide and its metabolite with positron emission tomography
Authors Huang Y, Huang H, Yeh C, Lin K, Yu C
Received 30 November 2014
Accepted for publication 19 May 2015
Published 24 July 2015 Volume 2015:8 Pages 1877—1885
DOI https://doi.org/10.2147/OTT.S78404
Checked for plagiarism Yes
Review by Single anonymous peer review
Peer reviewer comments 3
Editor who approved publication: Dr Faris Farassati
Ying-Cheng Huang,1 Ho-Lien Huang,2 Chun-Nan Yeh,3 Kun-Ju Lin,4 Chung-Shan Yu2,5
1Department of Neurosurgery, Chang-Gung Memorial Hospital at Linkou, Chang Gung University, 2Department of Biomedical Engineering and Environmental Sciences, National Tsinghua University, 3Department of Surgery, 4Department of Nuclear Medicine, Chang-Gung Memorial Hospital at Linkou, Chang Gung University, 5Institute of Nuclear Engineering and Science, National Tsing-Hua University, Hsinchu, Taiwan
Abstract: To date, imaging of malignant glioma remains challenging. In positron emission tomography-related diagnostic imaging, differential tumor uptake of 3'-deoxy-3'-[18F]fluorothymidine ([18F]FLT) has been shown to reflect the levels of cell proliferation and DNA synthesis. However, additional biomarkers for tumors are urgently required. Aberrant levels of glutathione transferase (GST) activity have been hypothesized to constitute such a novel diagnostic marker. Here, a C6 rat glioma tumor model was used to assess the ability of the positron emission tomography tracers, [18F]FLT and 18F-fluorobutyl ethacrynic amide ([18F]FBuEA), to indicate reactive oxygen species-induced stress responses as well as detoxification-related processes in tumors. Using a GST activity assay, we were able to demonstrate that FBuEA is more readily catalyzed by GST-π than by GST-α. Furthermore, we showed that FBuEA-GS, a metabolite of FBuEA, elicits greater cytotoxicity in tumor cells than in normal fibroblast cells. Finally, in vitro and in vivo investigation of radiotracer distribution of [18F]FBuEA and [18F]FBuEA-GS revealed preferential accumulation in C6 glioma tumor cells over normal fibroblast cells for [18F]FBuEA-GS but not for [18F]FBuEA.
Keywords: fluorine-18, C6-glioma, molecular imaging, GST-α, glutathione transferase
Introduction
Per the predictions of the Annual Report to the Nation on the Status of Cancer concerning brain and other nervous system tumors for 1975–2007, the incidence rates for five of the 15 most prevalent cancers among men has significantly decreased.1 These reductions in cancer incidence indicate real progress in cancer control, reflecting a rise in the combination of primary prevention, early detection, and treatment success. Brain and other nervous system tumors have been particularly difficult to diagnose pathologically because they are often heterogeneous histologically, genetically, and therapeutically. Nevertheless, progress in understanding the molecular pathogenesis of malignant gliomas is increasingly leading to better classifications of these tumors.
Current magnetic resonance imaging (MRI) techniques are inaccurate for tumor grading, and evaluations of tumor prognosis remain challenging.2,3 Especially when the tumor progresses into the neighboring tissue, the proliferation zone can generally not be distinguished from edema or necrosis by morphological imaging modalities such as computed tomography or MRI. Fluorine-18-labeled compounds have been extensively used in imaging of tumors4,5 and brain diseases.6 Fluorine atoms are often used as hydrogen atom or hydroxyl group substitutes due to their similarity in van der Waals radius and molecular size.7,8 For instance, the positron-emitting radioisotope 18F has a relatively short physical half-life of 110 minutes and emits two coincident γ-rays at 180° to each other. The resulting signal eliminates the need for detector collimation, and in contrast with single-photon emission tomography, which is based on a planar or pinhole approach, permits accurate corrections of γ-ray attenuation yielding a unique image.9
Among the radiotracers studied, fluorine-18-labeled 2′-[18F]fluoro-2′-deoxyglucose ([18F]FDG) is one of the most widely used positron emission tomography (PET) tracers to date. Using [18F]FDG, tumor lesions can be easily localized because of their high glucose demand.10 However, the non-biomarker-driven uptake and the resulting elevated levels of radioactivity within the normal brain call for the development of new radiopharmaceuticals such as 3′-deoxy-3′-[18F]fluorothymidine ([18F]FLT, Figure 1).11 [18F]FLT has been used for probing thymidine kinase (TK) expression. TK-targeted [18F]FLT accumulation in the tumor and decreased levels in the healthy brain ensures a lower background. Moreover, a larger tumor mass could be detected using [18F]FLT and [11C]methionine as a PET tracer than with gadolinium-enhanced MRI. Upregulation of amino acid transporters can carry these tracers into tumor tissue even if the blood–brain barrier is largely intact. Other amino acid analogs such as 18F-fluoro-ethyl-tyrosine have been used in the evaluation of patients with primary brain tumors. Furthermore, 18F-FET PET has shown value in the diagnosis of brain tumor recurrence after initial surgery or radiotherapy and for directing biopsy or radiosurgery.4
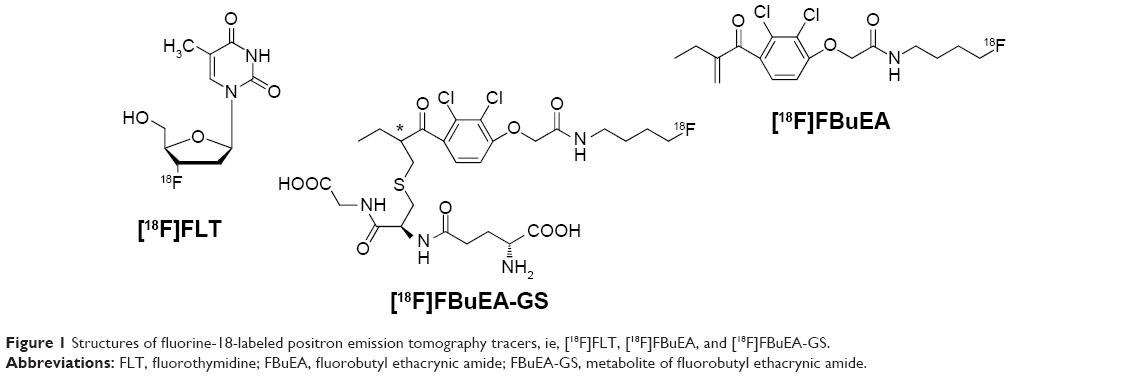 | Figure 1 Structures of fluorine-18-labeled positron emission tomography tracers, ie, [18F]FLT, [18F]FBuEA, and [18F]FBuEA-GS. |
For discovering novel tracers for imaging tumors, biomarkers are of particular value. For example, it has been shown that reactive oxygen species (ROS) are associated with tumor progression.12 By reacting with ROS, glutathione (GSH), a tripeptide composed of cysteine, glutamic acid, and glycine, acts as an antioxidant, whilst at the same time forming glutathione disulfide, its oxidized state. However, the mechanism underlying the regulation of this relatively concentrated antioxidant (approximately 2–3 mM in the brain) remains unresolved.13 Additionally, GSH is also catalyzed by glutathione transferase (GST) to incorporate electrophilic substances as part of the detoxification process.
GSTs are composed of three subfamilies including cytosolic and mitochondrial GSTs as well as membrane associated proteins in prostaglandin and eicosanoid metabolism.14–16 Of the seven cytosolic GSTs, the α-class GSTs are the predominant subtype, and are expressed in the liver, testis, and kidney. Their expression levels are similar in both adult and fetal tissues. In contrast, GST-π (GSTP1), originally isolated from human placenta, is found mainly in the brain, lung, and heart, with expression levels slowly decreasing during embryonic development, becoming very low in adult tissue.
It has been suggested that an oxidation event early in the G1-phase of the cell cycle acts as a critical regulatory step for progression into S-phase.17 Both TK1 and GSH-related enzymes could be involved in subsequent regulatory mechanisms of cell cycle control. TK1 plays a role in the salvage pathway of DNA synthesis, with TK1 activity being associated with proliferating cells and peaking in the late G1-phase and S-phase.18 On the other hand, in the G1-phase, cellular GSH levels are low, and an increase in total GSH is subsequently necessary for the cells to progress from G1-phase to S-phase.19
Because tumor progression is associated with increased cell proliferation and DNA synthesis, this mechanism may be exploited for diagnostic purposes. Although [18F]FLT is not incorporated into DNA itself, in vitro and in vivo studies have shown that [18F]FLT uptake reflects TK1 activity and DNA synthesis levels.20,21 Consequently, differential [18F]FLT uptake may be used to grade tumors. The PET tracer, 18F-fluorobutyl ethacrynic amide ([18F]FBuEA), was initially prepared to study GST activity,22 which is overexpressed in many tumors and contributes to multidrug resistance.23–26 Hence, aberrant GST activity levels may constitute a diagnostic tumor marker since tumors not only need to protect themselves from ROS-induced stress, but also require rescuing from impaired detoxification processes (Figure 2). Thus, comparison of imaging data of the syngeneic rat C6 glioma model obtained with the PET probes [18F]FLT and [18F]FBuEA as well as its metabolite [18F]FBuEA-GS (Figure 1) may provide further insight into the relationship between tumor growth and related antioxidant and detoxification processes.
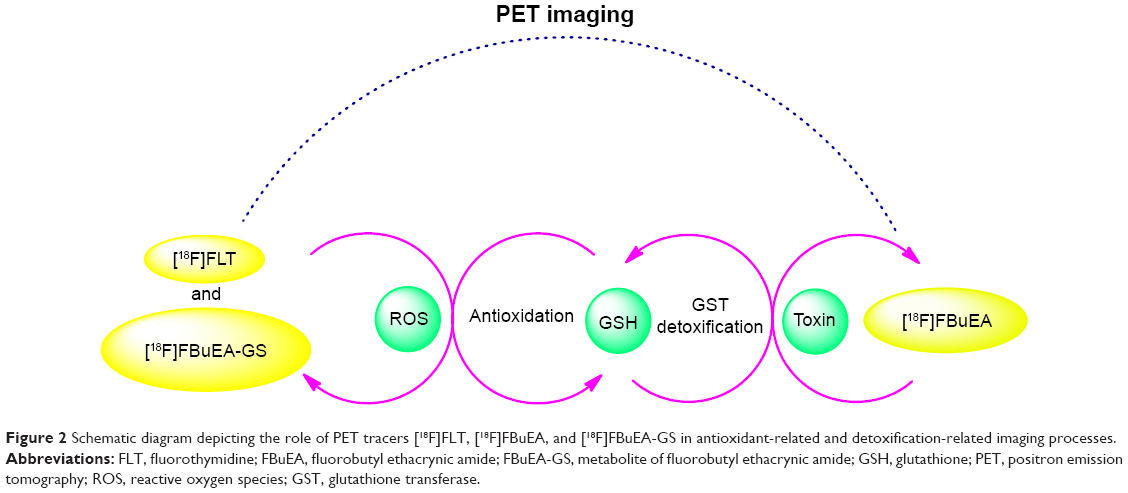 | Figure 2 Schematic diagram depicting the role of PET tracers [18F]FLT, [18F]FBuEA, and [18F]FBuEA-GS in antioxidant-related and detoxification-related imaging processes. |
Materials and methods
General
[18F]FLT was prepared as reported previously.27 Recombinant human glutathione S-transferase alpha-1 (GSTA1 human, 50 μg) and Pi-1 (GSTP1 human, 25 μg) were purchased from Pro Spec-Tany TechnoGene Ltd (East Brunswick, NJ, USA) and Alpha Diagnostic International Inc (San Antonio, TX, USA), respectively.
PET scans were performed with a microPET R4 system (Concorde Microsystems Inc, Siemens Medical Solutions, Knoxville, TN, USA) at the Nuclear Energy Research Institute. Measurement of ultraviolet-visible absorbance was performed using a Chameleon™ multilabel detection platform (Hidex Oy, Turku, Finland). GraphPad Prism 5.0 software was used to generate dose–response curves (IC50 [half maximal inhibitory concentration] values).
GST activity assay
Inhibitors at various concentrations were assessed for their ability to compete with chlorodinitrobenzene (CDNB) for GST-catalyzed conjugation to GSH using a GST assay kit (Cayman Chemical, Ann Arbor, MI, USA) according to the manufacturer’s instructions. In brief, assay conditions were 0.1 M sodium phosphate buffer solution (pH 6.8, double-distilled H2O, 1 M Na2HPO4, 1 M NaH2PO4) and GSTA1 or GSTP1 (5 μg/mL). GSH and CDNB were added from stock solutions of 2.5 mM and 7.5 mM, respectively. Stock solutions of ethacrynic acid (EA, 10 mM) and FBuEA (10 mM) were prepared in ethyl alcohol. Uridine stock (10 mM) was prepared in double-distilled H2O. Samples with concentrations of 10−2, 10−1, 1, 10, and 100 μM were obtained via serial dilution. After 1–5 minutes of incubation, absorption was measured at 355 nm. Inhibition of CDNB–GSH formation was quantified by measuring absorption at 355 nm (ABSmax 340 nm). All measurements were adjusted by subtracting non-enzymatic conjugation of CDNB. The experiment was performed in triplicate.
Cell viability assay
Preparation of cell lines and reagents
The cell lines were purchased from the American Type Tissue Collection (Manassas, VA, USA). The rat glioma cell line C6 was grown in Dulbecco’s Modified Eagle’s Medium (Gibco, Grand Island, NY, USA) supplemented with 10% fetal calf serum (Gibco), 100 U/mL of penicillin, and 0.1 mg/mL streptomycin. The cell lines were cultured at 37°C in a humidified 5% CO2 atmosphere. Fibroblast cells (3T3) derived from a non-tumorigenic cell line were used as a control.
Performing the assay
Cells (5×10⁴) were seeded onto 24-well cell culture plates in medium containing FBuEA at varying concentrations (0.01–100 μM). Dimethyl sulfoxide (0.1%, 104 μM) was used as a vehicle. 3-(4,5-dimethyl-thiazol-2-yl)-2,5-diphenyl tetrazolium bromide (MTT, 5 mg/mL) was added after 24, 48, and 72 hours and incubated for 4 hours. After removal of the medium, 100 μL of dimethyl sulfoxide was added to each well to dissolve the formazan crystals. Optical absorbance at 570 nm was determined by an Infinite M200 plate reader (Tecan US Inc, Morrisville, NC, USA). Each measurement was carried out in triplicate. Survival ratios for both C6 and 3T3 cells treated with FBuEA or FBuEA-GS are expressed as bar diagrams. All measurements were adjusted for background absorption of medium alone.
Cellular uptake of [18F]FLT
Freshly prepared [18F]FLT was diluted with medium (Dulbecco’s Modified Eagle’s Medium, 5% fetal bovine serum) to a concentration of 10 μCi/50 mL in a centrifuge tube. When the cells were grown for 24 hours, the growth medium was replaced with diluted [18F]FLT (500 μL) at 0.25, 0.5, 1, and 2 hours for each well followed by incubation at 37°C. Addition of tracer was temporally staggered such that the samples could be harvested at the same time point. Cell supernatant for each well was harvested. Following rinsing with phosphate-buffered saline (500 μL) twice, the supernatant together with the rinses (1.5 mL) were combined to provide extracellular radioactivity counts. Subsequently, the cells were lysed with 0.25% trypsin-ethylenediaminetetraacetic acid (30 μL) followed by rinsing with phosphate-buffered saline twice. Both the lysates and rinses (1.5 mL) were combined to provide intracellular radioactivity counts. All the samples were adjusted to the same volume, thereby diminishing geometric disturbances during measurement of radioactivity. Measurement was performed using a gamma scintillation counter (Packard 5000, Packard Instrument Co, Meriden, CT, USA) taking the decay into account. Experiments for each time point were performed in triplicate. The uptake ratio was calculated according to the following formula:
|
Rat model
All in vivo experiments were conducted in compliance with the National Health and Medical Research Council Taiwan Code of Practice for the care and use of animals for scientific purposes. An affidavit of approval of Animal Use Protocol Chang Gung Memorial Hospital (2013092702 and CGU12-055) was granted before performing the assessment. Sprague–Dawley rats (8 weeks of age) were obtained from Biolasco Taiwan Co Ltd. The rats were housed under constant environmental conditions and had access to food and water ad libitum throughout the experimental period. The rats were anesthetized using inhaled isoflurane (Forthane, Abbott Laboratories, Abbott Park, IL, USA) in 200 mL/min oxygen before imaging. One healthy rat and one tumor-bearing rat were used for the PET scanning study.
Two weeks prior to imaging, healthy male rats were stereotactically inoculated in the right hemisphere with 1.0×10⁵ C6 glioma cells. Immediately before imaging, all rats were fastened with venous and arterial catheters. Syngeneic gliomas were grown for 2 weeks after transplantation. When tumors reached 3–5 mm in diameter and were well demarcated from normal brain tissue, the PET study was performed.
Regular oral feeding was continued once the animals had recovered from anesthesia. The animals were carefully monitored on a regular basis with respect to feeding quality, response upon stimulation, and symptoms of dystrophy. The animal care unit checked for abnormalities such as a feeding intake rate of less than 50% in 72 hours, hind leg paraparesis, or weight loss greater than 20%. In case one of the above conditions was met, the animal was sedated with ketamine and xylazine hydrochloric acid followed by euthanasia by CO2 and intravenous xylocaine (200 mg).
Results
Effects of test compounds on GST-catalyzed GSH conjugation
GSH-related enzymes have been shown to be involved in control of the cell cycle. In particular, it was hypothesized that tumors may display aberrant GST activity, which could be used for tumor diagnostics. To evaluate the ability of the test compounds to compete with CDNB for GST-α-catalyzed or GST-π-catalyzed conjugation to GSH, a GST assay was performed (Figures 3 and 4). The IC50 values for FBuEA in the presence of GST-α and GST-π were 17.5 μM and 6.0 μM, respectively (Table 1). FBuEA is more readily catalyzed by GST-π than by GST-α. The effects of GST class were not as clear for EA, with comparatively low IC50 values of 1.1 μM and 0.5 μM, respectively (Table 1).
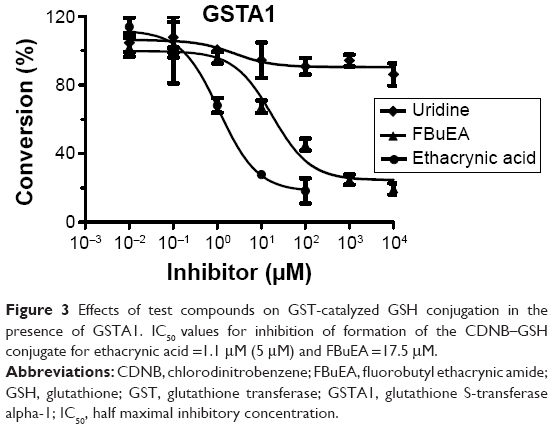 | Figure 3 Effects of test compounds on GST-catalyzed GSH conjugation in the presence of GSTA1. IC50 values for inhibition of formation of the CDNB–GSH conjugate for ethacrynic acid =1.1 μM (5 μM) and FBuEA =17.5 μM. |
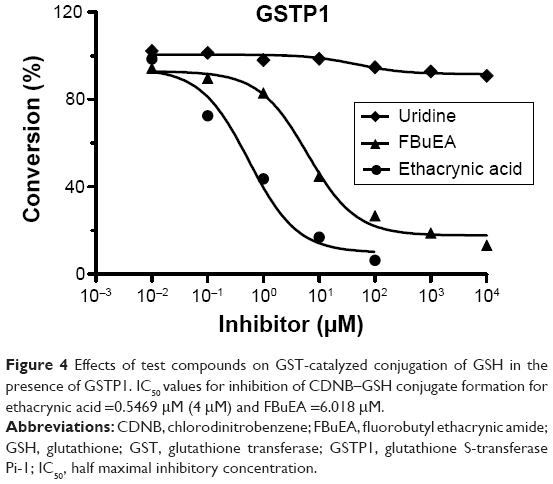 | Figure 4 Effects of test compounds on GST-catalyzed conjugation of GSH in the presence of GSTP1. IC50 values for inhibition of CDNB–GSH conjugate formation for ethacrynic acid =0.5469 μM (4 μM) and FBuEA =6.018 μM. |
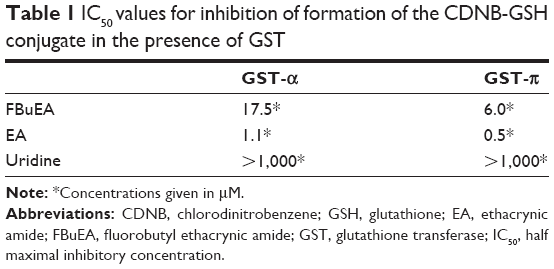 | Table 1 IC50 values for inhibition of formation of the CDNB-GSH conjugate in the presence of GST |
Effects of test compounds on in vitro cell viability
The cell viability assay can be used to evaluate both the biological end-point effects and indirectly the incorporation efficiency of investigated substances. In this regard, the tested compounds with concentrations ranging from 0.001 μM to 1 μM were assessed for their cytotoxicity against C6 glioma and fibroblast cell lines (Figure 5). The cytotoxicity of FBuEA in C6 glioma cells was prominent only after 72 hours of exposure. FBuEA-GS, the metabolite of FBuEA, demonstrated a slightly greater cytotoxic effect in C6 glioma cells rather than in normal fibroblasts (survival ratio, 1:1.08, 24 hours). This bioactivity profile was not altered during the span of 48 hours.
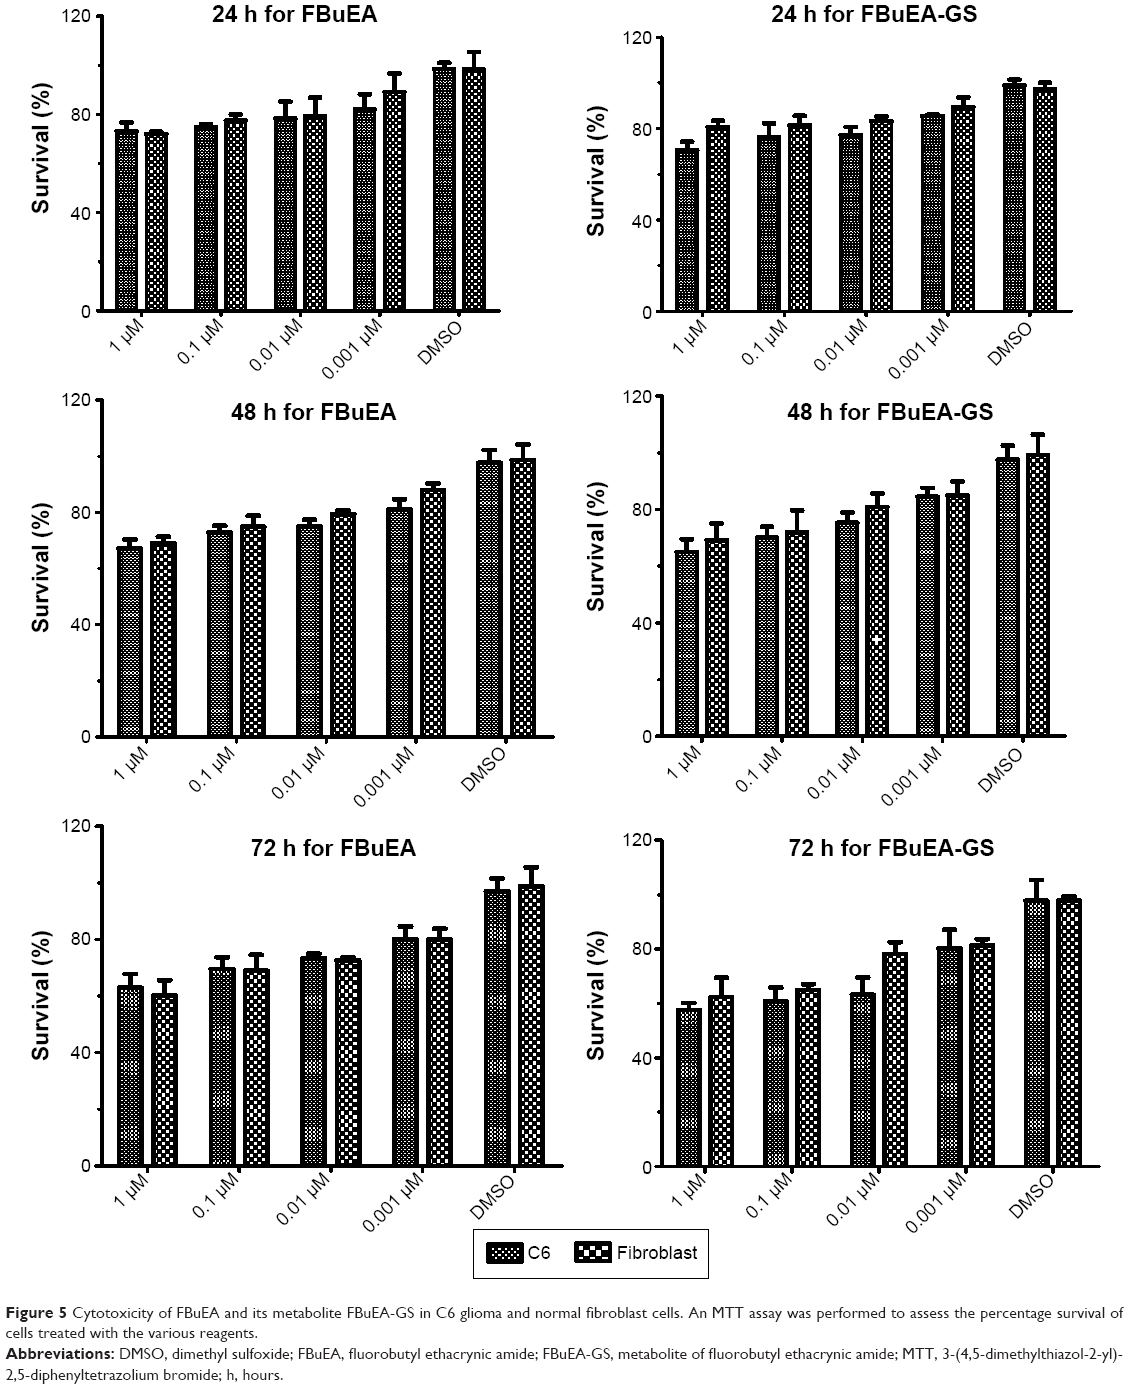 | Figure 5 Cytotoxicity of FBuEA and its metabolite FBuEA-GS in C6 glioma and normal fibroblast cells. An MTT assay was performed to assess the percentage survival of cells treated with the various reagents. |
In vitro cellular uptake of test compounds
Accumulation of [18F]FLT in C6 glioma tumor cells was, as expected, higher than in normal fibroblast cells (Figure 6).
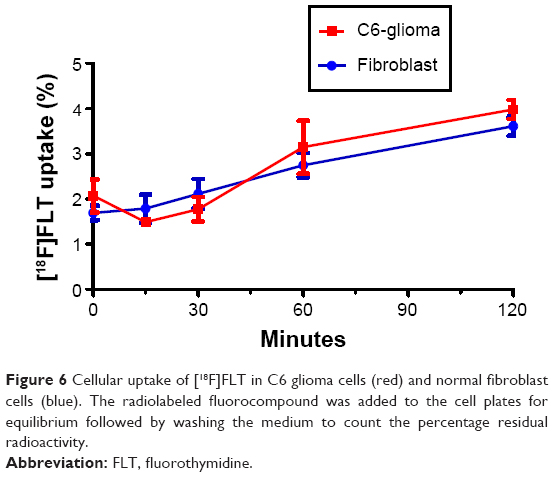 | Figure 6 Cellular uptake of [18F]FLT in C6 glioma cells (red) and normal fibroblast cells (blue). The radiolabeled fluorocompound was added to the cell plates for equilibrium followed by washing the medium to count the percentage residual radioactivity. |
In vivo tissue uptake of test compounds
Before acquiring PET scans, tumor loci were confirmed by MRI (Figure 7A). In addition, the tumor sites were targeted by [18F]FLT by means of their elevated levels of DNA synthesis (Figure 7B and C). The relatively lower background of normal rat might be due to the losing dose during injection. However, similar to the in vitro cellular uptake analysis, [18F]FBuEA did not preferentially accumulate in the C6 glioma tumor loci (Figure 8). Subtle radioactivity accumulation in the tumor site was noted, with most of the radioactivity found in the bone region. Nevertheless, the PET scans showing a differential accumulation of [18F]FBuEA-GS should be attributable to the metabolism of [18F]FBuEA.29 One of the reasons for the contradictory results could involve the function of the liver. It is possible that, in the liver, the transporter that most likely couples with GST, and removes the metabolite [18F]FBuEA-GS immediately after detoxifying [18F]FBuEA catalyzed by GST-α. In contrast, [18F]FBuEA-GS administered intravenously bypasses the liver and therefore the majority of the dose can be delivered continually.
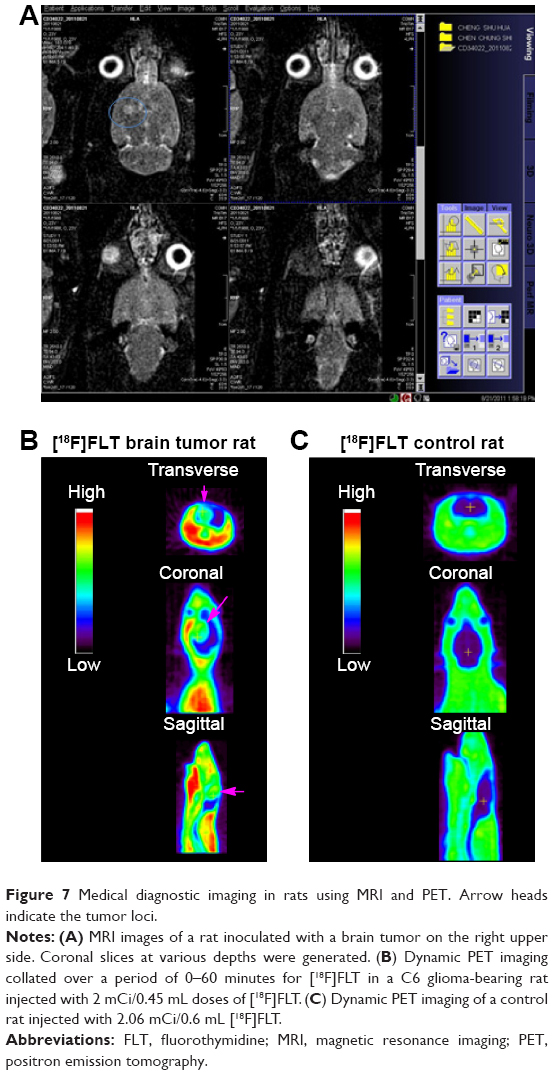 | Figure 7 Medical diagnostic imaging in rats using MRI and PET. Arrow heads indicate the tumor loci. |
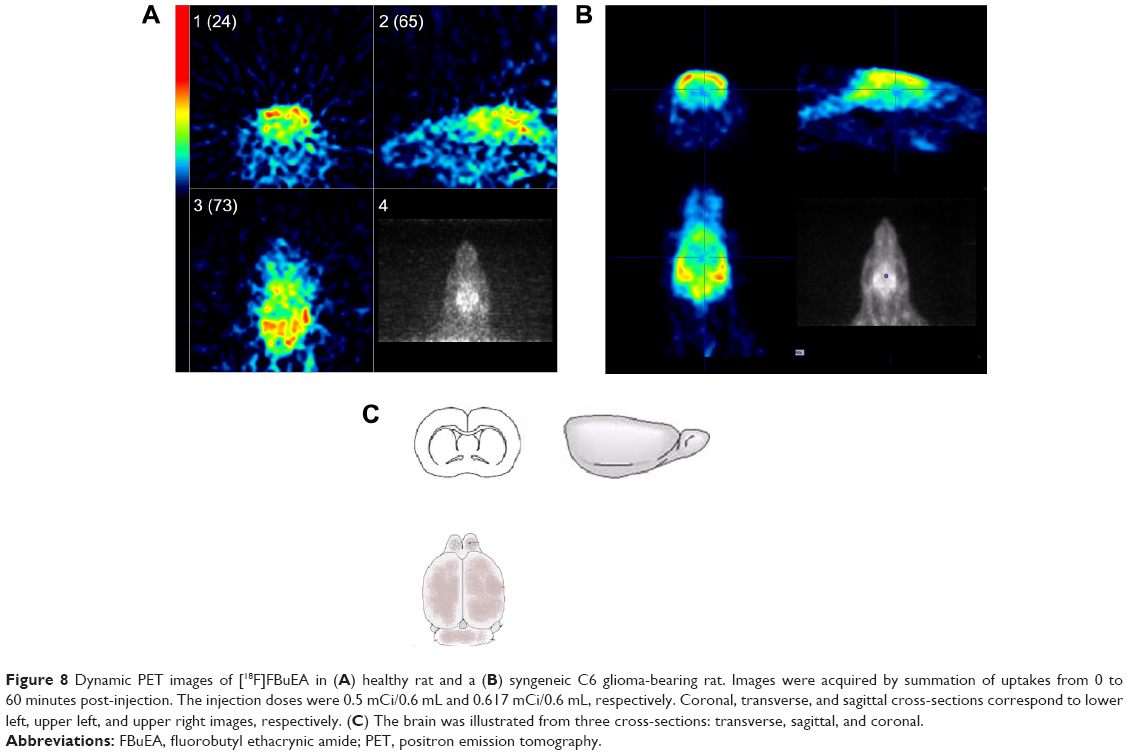 | Figure 8 Dynamic PET images of [18F]FBuEA in (A) healthy rat and a (B) syngeneic C6 glioma-bearing rat. Images were acquired by summation of uptakes from 0 to 60 minutes post-injection. The injection doses were 0.5 mCi/0.6 mL and 0.617 mCi/0.6 mL, respectively. Coronal, transverse, and sagittal cross-sections correspond to lower left, upper left, and upper right images, respectively. (C) The brain was illustrated from three cross-sections: transverse, sagittal, and coronal. |
Discussion
In comparison with EA, the diminished conjugation activity of FBuEA may be explained by the additional aliphatic chain, which interferes with the molecular recognition.30
The differential toxicity of FBuEA-GS noted between the two cell lines is probably due to the higher demand for the antioxidant GSH by the tumor cells. It has been documented that the toxicity of EA analogs may be mediated via both apoptotic and necrotic pathways.31 Additionally, the hydrophobicity of FBuEA may serve to increase cellular penetration, thereby promoting toxicity. The lack of significant toxicity shown for FBuEA may be due to either the general insensitivity of tumor cells owing to downregulation of GST enzymes or to very low concentrations of GSH available for detoxification.
For our purpose of in vivo PET imaging, differential degrees of accumulation of [18F]FBuEA in tumors were crucial. Interestingly, the cellular uptake results showed a contradictory trend, ie, greater accumulation in normal fibroblast cells.29 The lower uptake of [18F]FBuEA in C6 glioma tumor cells is probably the result of the restricted observation period available due to the short half-life of F-18. Alternatively, it is possible that tumors may have developed an alternative salvage pathway in order to adapt to the toxic environment caused by exhausted supplies of the antioxidant GSH, thereby inactivating its responsiveness. In contrast, the normal fibroblasts still combat toxicity-induced and ROS-induced stress via regular defense mechanisms. Thus, antioxidant and detoxification processes are impaired in the tumor environment. However, it is not clear how the tumor decreases its susceptibility to toxins when GSH is still required to reduce oxidative stress.
The present findings were further compared with in vivo PET imaging data, and the reasonable stability of both [18F]FBuEA and its metabolite [18F]FBuEA-GS, with half-lives of 46 minutes and 60 minutes, respectively, provided the tracer compounds with moderate distribution times.
According to the in vivo half-life, a significant amount of both intact radiotracers, [18F]FBuEA and [18F]FBuEA-GS should be able to reach the brain. However, the blood–brain barrier is probably more accessible by [18F]FBuEA than by the more hydrophilic [18F]FBuEA-GS. Interestingly, both tracers representing a toxin and an antioxidant are precisely pumped out of and into the tumor lesions, respectively. It seems that tumor cells have a shortage of nucleophilic cofactors, such as GSH, carrying thiol groups for detoxification. This may partly explain why electrophilic chemical reagents such as temozolomide, a chemotherapeutic agent used to treat brain tumors, exert DNA toxicity through alkylating amino groups on purine bases without encountering serious neutralization by GSH before coming in contact with DNA molecules.
The in vitro and in vivo distribution of the three radiotracers, ie, [18F]FLT, [18F]FBuEA, and [18F]FBuEA-GS, has been described previously in part and in greater detail in this study. Correlation of the oxidation and toxicity status of tumors with the uptake of fluorine-18-labeled compounds have revealed the impaired defense system of the tumor. Hopefully, either a combination of drugs using a “cocktail” approach or a drug with dual function will be effective in the future treatment of brain tumors and related neural disorders.
Acknowledgments
We are grateful to the National Science Council of Taiwan, CGMH_NTHU Joint Research, and Chang-Gung Medical Research Project for providing grant support (NSC-100-2113-M-007-003, NSC-97-2314-B-182A-020-MY3, NSC-97-2314-B-182A-020-MY3, CGTH96N2342E1, CMRPG390931, CMRPG3A0512, CMRPG3B0361, CMRPG 3D0161). We are also grateful for the technical assistance provided by Jenn-Tzong Chen, Yean-Hung Tu, and Gang-Wei Chang from the Nuclear Energy Research Institute, Taoyuan.
Disclosure
The authors report no conflicts of interest in this work.
References
Kohler BA, Ward E, McCarthy BJ, et al. Annual report to the nation on the status of cancer, 1970–2007, featuring tumors of the brain and other nervous system. J Natl Cancer Inst. 2001;103:714–736. | ||
Corroyer-Dulmont A, Pérès EA, Petit E, et al. Detection of glioblastoma response to temozolomide combined with bevacizumab based on μMRI and μPET imaging reveals [18F]-fluoro-D-thymidine as an early and robust predictive marker for treatment efficacy. Neuro Oncol. 2013;15:41–56. | ||
Chen W, Delaloye S, Silverman DH, et al. Predicting treatment response of malignant gliomas to bevacizumab and irinotecan by imaging proliferation with [18F] fluorothymidine positron emission tomography: a pilot study. J Clin Oncol. 2007;25:4714–2721. | ||
Dunet V, Rossier C, Buck A, Stupp R, Prior JO. Performance of F-18-fluoro-ethyl-tyrosine (F-18-FET) PET for the differential diagnosis of primary brain tumor: a systematic review and meta-analysis. J Nucl Med. 2012;53:207–214. | ||
Mertens K, Slaets D, Lambert B, Acou M, Devos F, Goethals I. PET with F18-labeled choline-based tracers for tumor imaging: a review of the literature. Eur J Nucl Med Mol Imaging. 2010;37:2188–2193. | ||
Zeng FX, Goodman MM. Fluorine-18 radiolabeled heterocycles as PET tracers for imaging beta-amyloid plaques in Alzheimer’s disease. Curr Top Med Chem. 2013;13:909–919. | ||
Howard JAK, Hoy VJ, O’Hagan D, Smith GT. How good is fluorine as a hydrogen bond acceptor? Tetrahedron. 1996;52:12613–12622. | ||
Welch JT. Advances in the preparation of biologically-active organofluorine compounds. Tetrahedron. 1987;43:3123–3197. | ||
Peremans K, Cornelissen B, Van den Bossche B, Audenaert K, Van den Wiele C. A review of small animal imaging planar and pinhole SPECT gamma camera imaging. Vet Radiol Ultrasound. 2005;46:162–170. | ||
Hess S, Blomberg BA, Zhu HJ, Hoilund-Carlsen PF, Alavi A. The pivotal role of FDG-PET/CT in modern medicine. Acad Radiol. 2014;21:232–249. | ||
Wardak M, Schiepers C, Cloughesy TF, Dahlbom M, Phelps ME, Huang SC. 18F-FLT and 18F-FDOPA PET kinetics in recent brain tumors. Eur J Nucl Med Mol Imaging. 2014;41:1199–1209. | ||
Chiara G, Isaac SH, Tak WM. Modulation of oxidative stress as an anticancer strategy. Nat Rev Drug Discov. 2013;12:931–947. | ||
Rae CD. A guide to the metabolic pathways and function of metabolites observed in human brain 1H magnetic resonance spectra. Neurochem Res. 2014;39:1–36. | ||
Wu B, Dong D. Human cytosolic glutathione transferases: structure, function, and drug discovery. Trends Pharmacol Sci. 2012;33:656–668. | ||
Laborde E. Glutathione transferases as mediators of signalling pathways involved in cell proliferation and cell death. Cell Death Differ. 2010;17:1373–1380. | ||
Deponte M. Glutathione catalysis and the reaction mechanisms of glutathione-dependent enzymes. Biochim Biophys Acta. 2013;1830:3217–3266. | ||
Menon SG, Sarsour EH, Spitz DR, et al. Redox regulation of the G1 to S phase transition in the mouse embryo fibroblast cell cycle. Cancer Res. 2003;63:2109–2117. | ||
Su YJ, Sang ML. Comparison of 3′-deoxy-3′-[18F]fluorothymidine PET and O-(2-[18F]fluoroethyl)-L-tyrosine PET in patients with newly diagnosed glioma. Nucl Med Biol. 2012;39:977–981. | ||
Shelly CL. Glutathione synthesis. Biochim Biophys Acta. 2013;1830:3143–3153. | ||
Rasey JS, Grierson JR, Wiens LW, Kolb PD, Schwartz JL. Validation of FLT uptake as a measure of thymidine kinase-1 activity in A549 carcinoma cells. J Nucl Med. 2002;43:1210–1217. | ||
Barthel H, Perumal M, Latigo J, et al. The uptake of 3′-deoxy-3′-[18F]fluorothymidine into L5178Y tumours in vivo is dependent on thymidine kinase 1 protein levels. Eur J Nucl Med Mol Imaging. 2005;32:257–263. | ||
Huang HL, Yeh CN, Chang KW, et al. Synthesis and evaluation of [18F]fluorobutyl ethacrynic amide: a potential PET tracer for studying glutathione transferase. Bioorg Med Chem Lett. 2012;22:3998–4003. | ||
Fletcher JI, Gherardi S, Murray J, et al. N-Myc regulates expression of the detoxifying enzyme glutathione transferase GSTP1, a marker of poor outcome in neuroblastoma. Cancer Res. 2012;72:845–853. | ||
Yang X, Liu G, Li H, et al. Novel oxadiazole analogues derived from ethacrynic acid: design, synthesis, and structure-activity relationships in inhibiting the activity of glutathione s-transferase P1-1 and cancer cell proliferation. J Med Chem. 2010;53:1015–1022. | ||
Ritchie KJ, Henderson CJ, Wang XJ, et al. Glutathione transferase pi plays a critical role in the development of lung carcinogenesis following exposure to tobacco-related carcinogens and urethane. Cancer Res. 2007;67:9248–9257. | ||
Federici L, Sterzo CL, Pezzola S, et al. Structural basis for the binding of the anticancer compound 6-(7-nitro-2,1,3-benzoxadiazol-4-ylthio)hexanol to human glutathione s-transferases. Cancer Res. 2009;69:8025–8034. | ||
Huang HL, Chiang LW, Chen JR, et al. Study of [18F]FLT and [123I]IaraU for cellular imaging in HSV1 tk-transfected murine fibrosarcoma cells: evaluation of the tracer uptake using 5-fluoro, 5-iodo and 5-iodovinyl arabinosyl uridines as competitive probes. Nucl Med Biol. 2012;39:371–376. | ||
Maeda DY, Mahajan SS, Atkins WM, Zebalaa JA. Bivalent inhibitors of glutathione S-transferase: the effect of spacer length on isozyme selectivity. Bioorg Med Chem Lett. 2006;16:3780–3783. | ||
Chiang LW, Pei K, Chen SW, et al. Combining a solution-phase derived library with in-situ cellular bioassay: prompt screening of amide-forming minilibraries using MTT assay. Chem Pharm Bull. 2009;57:714–718. | ||
Wang K, Li C, Song D, Zhao G, Zhao L, Jing Y. Cancer Res. 2007;67:7856–7864. | ||
Huang HL, Huang YC, Lee WY, Yeh CN, Lin KJ, Yu CS. 18F-Glutathione conjugate as a PET tracer for imaging tumors that overexpress L-PGDS enzyme. PLoS One. 2014;9:e104118. |
 © 2015 The Author(s). This work is published and licensed by Dove Medical Press Limited. The full terms of this license are available at https://www.dovepress.com/terms.php and incorporate the Creative Commons Attribution - Non Commercial (unported, v3.0) License.
By accessing the work you hereby accept the Terms. Non-commercial uses of the work are permitted without any further permission from Dove Medical Press Limited, provided the work is properly attributed. For permission for commercial use of this work, please see paragraphs 4.2 and 5 of our Terms.
© 2015 The Author(s). This work is published and licensed by Dove Medical Press Limited. The full terms of this license are available at https://www.dovepress.com/terms.php and incorporate the Creative Commons Attribution - Non Commercial (unported, v3.0) License.
By accessing the work you hereby accept the Terms. Non-commercial uses of the work are permitted without any further permission from Dove Medical Press Limited, provided the work is properly attributed. For permission for commercial use of this work, please see paragraphs 4.2 and 5 of our Terms.