")
Back to Journals » Open Access Emergency Medicine » Volume 13
Investigating Indicators of Waiting Time and Length of Stay in Emergency Departments
Authors Al Nhdi N, Al Asmari H, Al Thobaity A
Received 18 April 2021
Accepted for publication 7 July 2021
Published 16 July 2021 Volume 2021:13 Pages 311—318
DOI https://doi.org/10.2147/OAEM.S316366
Checked for plagiarism Yes
Review by Single anonymous peer review
Peer reviewer comments 3
Editor who approved publication: Dr Hans-Christoph Pape
Nojoud Al Nhdi,1,2 Hajar Al Asmari,1 Abdulellah Al Thobaity1
1Nursing Department, Applied Medical Sciences, Taif University, Taif, Saudi Arabia; 2Nursing Department, Health directorate in Jeddah, East Jeddah Hospital, Jeddah, Saudi Arabia
Correspondence: Abdulellah Al Thobaity
Nursing Department, Applied Medical Sciences, Taif University, Taif, Saudi Arabia
Email [email protected]
Purpose: To investigate potential indicators of patients’ waiting time and length of stay in emergency departments (ED) at the Ministry of Health (MOH) hospitals in order to determine the causes of delayed patient care and to recommend clinical implications to achieve a better ED system.
Materials and Methods: This exploratory study was conducted in the EDs at four tertiary hospitals of MOH. A random sample of 1360 people was tested from December 2019 to February 2020. Data included patient Canadian Triage Acuity and System (CTAS) level, registration time, triage time, physician examination time, decision time, and disposition time. Descriptive statistics, multivariate analysis, multiple linear regression analysis and Pearson correlation were used according to SPSS (version 24).
Results: The findings showed that 89.6% of total emergency patients were categorized as levels 3, 4 and 5. Around 73.5% of emergency patients stayed less than 4 hours due to registration or triage to disposition, while 26.5% of those patients stayed more than 4 hours.
Conclusion: The majority of patients’ total stay in EDs was less than 4 hours. According to ED international standard of length of stay, this is appropriate. The highest effective indicator in total length of stay was the decision to disposition time in EDs.
Keywords: emergency department, length of stay, indicators, waiting time, Canadian Triage and Acuity Scale
Introduction
The emergency department (ED) is the front-line defense of any health care system, both for daily events and during disasters. The ED defined as a “highly effective setting for urgent and lifesaving care, as well as a core provider for ambulatory care in many communities”.14 Understanding the path of the patient from the gate to the exit door of the ED—which is the time a patient spends in the ED, or length of stay—is the key to improve patients’ experiences and ED services.18 An analysis of that time reveals the important indicators of assessing quality of care. Over the last 10 years, Saudi Arabian emergency departments at tertiary MOH hospitals have used the Canadian Triage and Acuity Scale (CTAS) and application of CTAS helped ED nurses to achieve better quality of solving and saving time.4 The CTAS is a ″validated triage system that prioritizes patient care by severity of illness″.11 It has been argued that there is a tangible association between using CTAS and decrease mortality rate in elderly patient by recognizing which patients require immediate life-saving interventions.19 Over the past decade, there has been an increase in the utilization of public EDs in Saudi Arabia; for instance, due to increased chronic disease burden and road traffic, visits to EDs of MOH hospitals increased from 9 million visits in 2000 to around 18 million visits in 2018.20 Emergency department length of stay (EDLOS) is known as a key performance indicator of quality in EDs, and defined as a time interval from patient arrival to leaving EDs affected by crowdedness.6 The mean of EDLOS according to the Australian Federal Government and the National Emergency Access Target (NEAT) is 4 hours among 85% of the patients from arrival to disposition.2 The increasing of those emergency patients leads to long lengths of stay (LLOS) and increased waiting time, which directly develop EDs crowdedness. The issues of overcrowding has influenced patient care and considered as one of the biggest challenges facing EDs every day, both in Saudi Arabia and in other countries.17 Indeed, it seems that overcrowding in EDs has turned into a national and international crisis; a lack of timely decision-making and service providence has led to increase risks of adverse outcomes, mortality, dissatisfaction of patients and their families, cost increases, violence, and interference with normal events occurring in EDs.12 Studying waiting time and length of stay (LOS) in EDs—that is, the time from registration or triage to disposition from the ED—helps stockholders to plan, improve, and manage ED systems and resources.22 This study will focus on investigating indicators of the patients’ length of stay in EDs in terms of door to doctor (the time from registration or triage, either of which indicates the patient’s first time to seen by a physician), doctor to decision (the time seen by physician to time of medical decision), decision to disposition (the time of medical decision to the time of moving the patient outside the ED through either admission or discharge), and door to disposition time (the patient’s total length of stay in ED). This is the first step in exploring and determining the causes of patient care delays to recommend solutions to reach ideal performance in EDs.
Materials and Methods
Research Design
This study utilized exploratory cross-sectional design to investigate indicators of waiting time and length of stay in Saudi Arabian MOH emergency departments.
Setting
The data were collected from the system of EDs of four tertiary MOH hospitals in Jeddah, Saudi Arabia. Furthermore, King Abdullah Medical Complex is a general hospital with a total bed capacity of 500 beds and an ED capacity of 33 beds received around 92,759 patients in ED 2020, whereas King Fahad Hospital has a total bed capacity of 600 beds and an ED capacity of 46 beds received around 84,233 patients in ED 2020. The East Jeddah Hospital is a general hospital with a total bed capacity of 300 beds and an ED capacity of 36 beds received around 136,670 patients in ED 2020, and King Abdelaziz Hospital has a total bed capacity of 436 beds and an ED capacity of 38 beds received around 83.846 patients in ED 2020.
Sample
A random sample of 1360 patients who visited the ED within 3 months from each hospital database was collected. Data of 340 (25%) for each hospital period between December 2019 and February 2020 were collected and categorised from Level 1 to Level 5, based on the Canadian Triage and Acuity Scale.
Data Collection
The data exported from the database of each hospital were previously collected by the key performance indicator (KPI) collectors in the ED of each hospital. Those KPI collectors collect yearly and save those data on special database and/or excel files. Data were gathered manually from patient records, and/or electronically from the database.
Data Analysis
Data were entered into an Excel spreadsheet and exported into an SPSS spreadsheet (SPSS 25).
Data included patient CTAS level, registration time, triage time, physician examination time, decision time, and disposition time, with descriptive statistics describing the relation between variables.
Multivariate analysis, multiple linear regression analysis and Pearson correlation were performed to determine which indicators most affect ED patient waiting time from registration time or triage time, whichever was earlier, to disposition time.
Independent variables included triage time, registration time, physician examination time, physician decision time and disposition time. The regression model had waiting time from door to disposition as the dependent variable and several independent variables were used for the model.
Time Intervals
The time was divided into four intervals: 1) door to doctor: the total time from registration or triage, whichever was the earlier time to be seen by a physician, 2) doctor to decision: the total time from the time examined by a physician to time of decision by the physician, 3) decision to disposition: the total time from time of decision by the physician to time of disposing the patient from ED, and 4) door to disposition: the total time from registration time or triage (whichever was earlier) to time of disposition.
Results
Table 1 shows the average time in minutes for every period of time, including door to doctor (mean [M]: 48.60 – standard deviation [STD]: 59.07), doctor to decision (M: 94.33 – STD: 101.01), decision to disposition (M: 58.51 – STD: 166.30), and door to disposition (M: 202.07 – STD: 215.73). The average total length of stay in ED in hours was M:3.36 – STD:3.59.
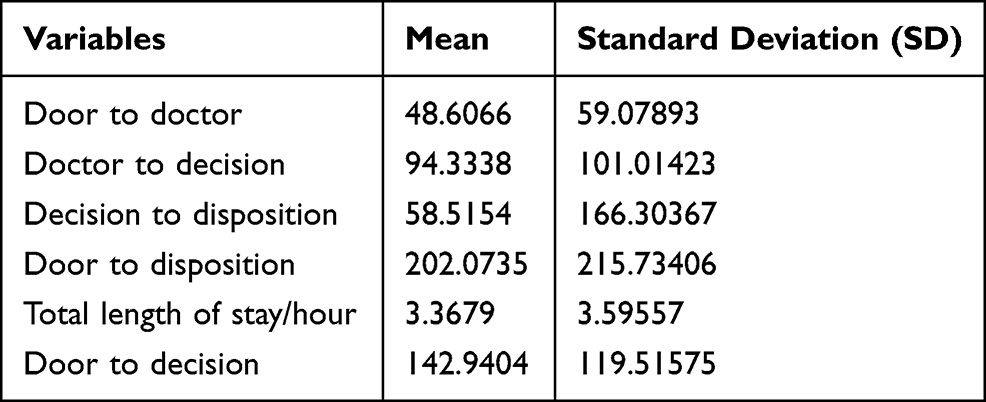 |
Table 1 Sample Size Number for Each Hospital |
Table 2 shows the categories of the sample divided as follows: CAT 1: 67 (4.9%), CAT 2: 74 (5.4%), CAT 3: 622 (45.7%), CAT 4: 461 (33.9%), and CAT 5: 136 (10%). Between 10% and 45.7% of the total sample fell in categories 3, 4, 5 (moderate to non-urgent).
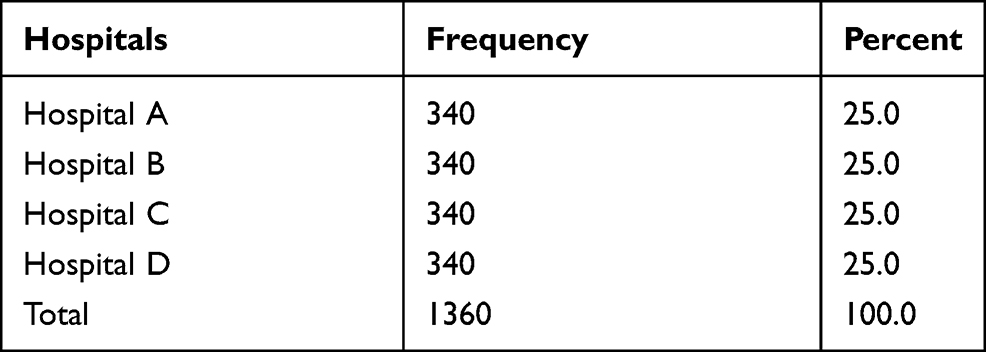 |
Table 2 Mean and Standard Deviation (SD) for Time Interval |
Table 3 shows that the total length of stay from registration or triage (whichever was first) to disposition of the patient from ED was less than 2 hours (45.7%), between 2 and 4 hours (27.7%), between 4 and 6 hours (13.1%), between 6 and 8 hours (5.9%), and more than 8 hours (7.6%).
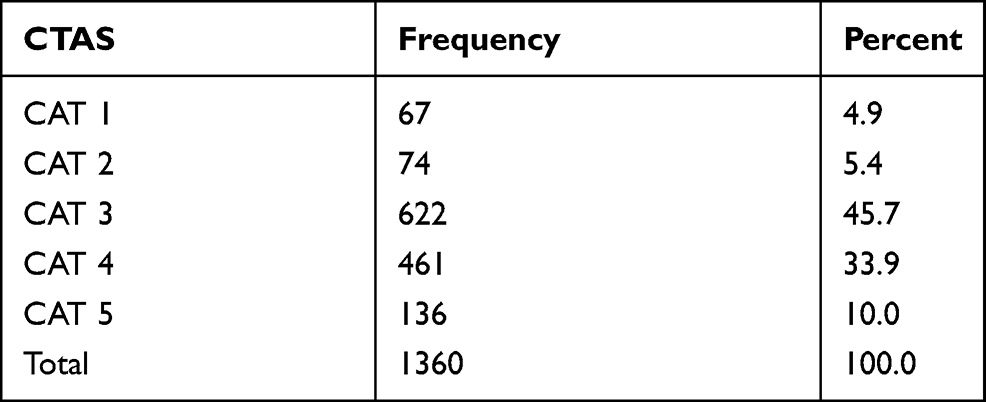 |
Table 3 Number of Patients Based on CTAS Level |
Table 4 in terms of door to disposition and total stay per hour there is a weak positive significant correlation with door to doctor (r = 0.263, p = 0.000), a moderate positive significant correlation with doctor to decision (r = 0.608, p = 0.000), and a strong positive significant correlation with decision to disposition (r = 0.836, p = 0.000).
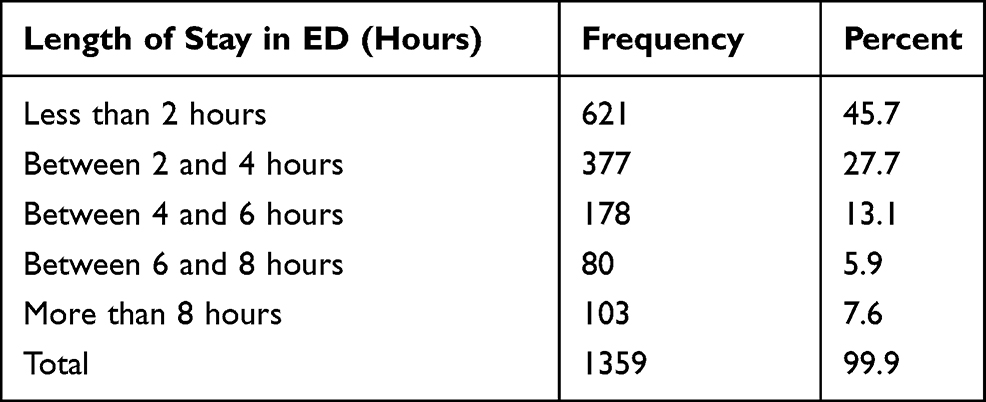 |
Table 4 Total Length of Stay at Each ED |
Table 5 shows that, in terms of door to doctor, the highest mean was for Hospital A = 65.0735 minutes (STD 67.64564), the lowest mean was for Hospital B = 14.2588 minutes (STD 20.98062), while Hospital C had the maximum = 443.00 minutes. In terms of door to disposition (total stay in ED/hour), the highest mean was Hospital C: 261.3676 minutes = 4.3561 hours (STD 61.73567 minutes = 4.13677 hours), the lowest mean was for Hospital B: 115.3441 minutes = 1.9224 hours (STD 20.98062 minutes = 2.85747 hours), with the maximum in Hospital A: 1544.00 minutes = 25.73 hours. The ANOVA table shows that is significance varies between all hospitals in all intervals time (p value 0.000 less than alpha).
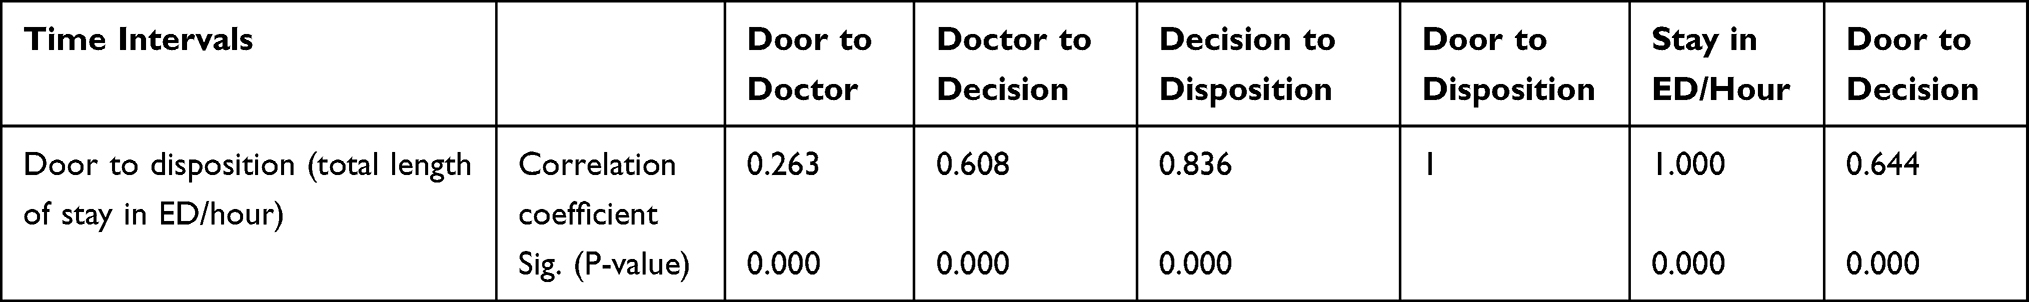 |
Table 5 The Pearson Parametric Correlation Between Each Time Interval |
Table 6 in terms of door to doctor, doctor to decision, and total length of stay in ED/hour in Hospital B, there is a significance mean difference with Hospitals A, C, and D, and no significance mean difference between groups A, C, and D. In terms of decision to disposition in Hospital C, there is significance mean difference with Hospital D and no significance mean difference between A and B.
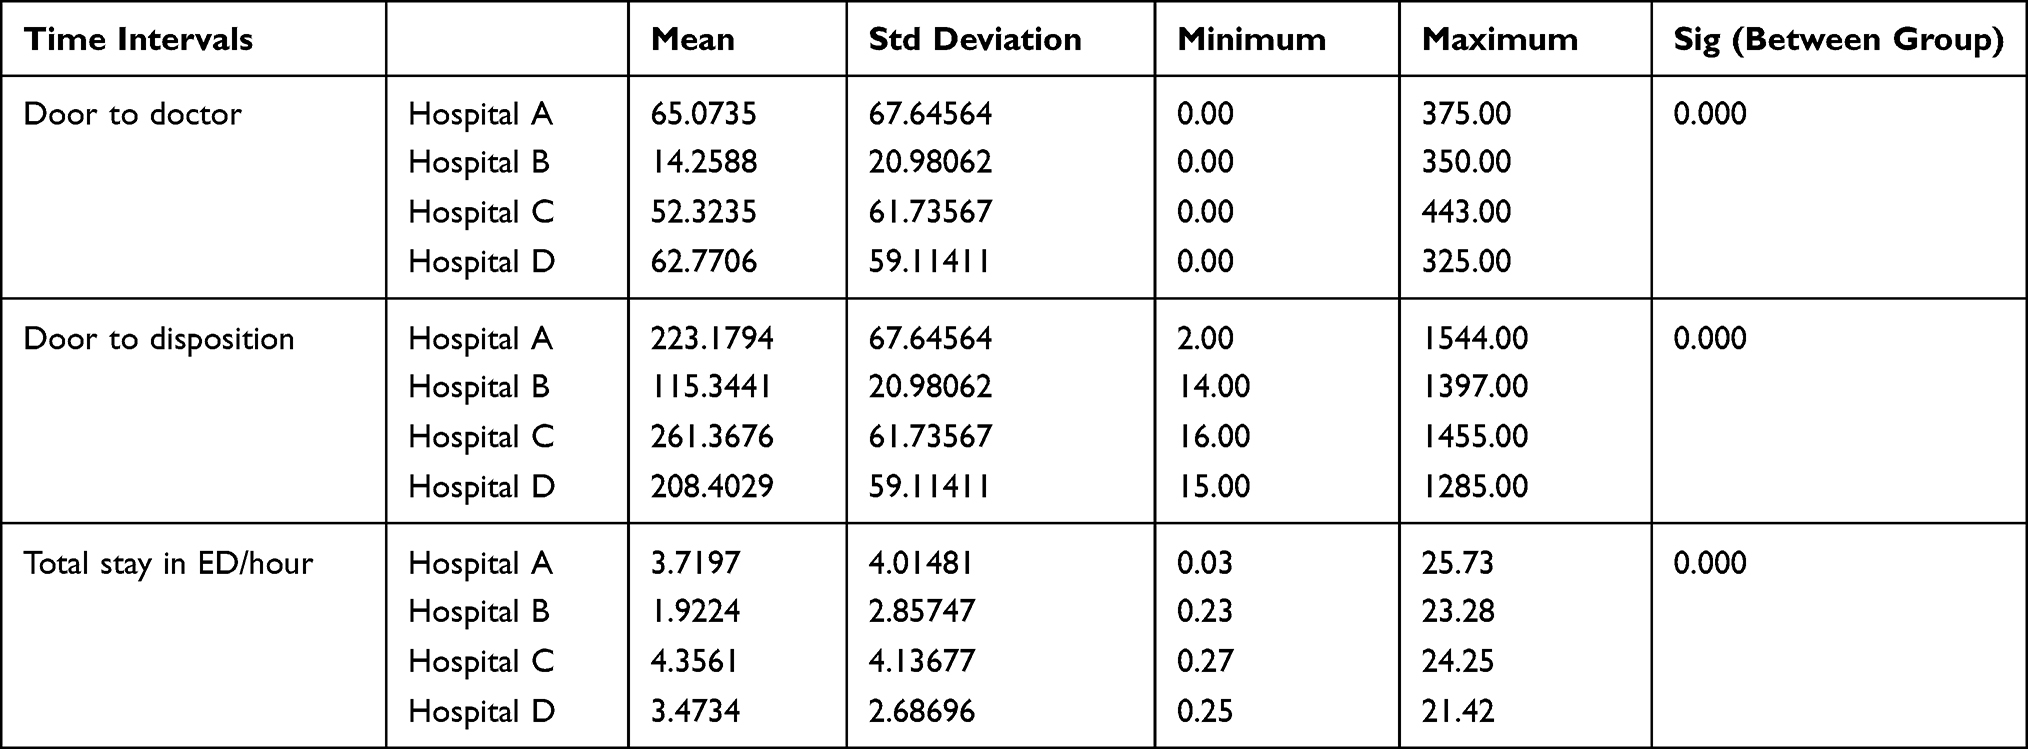 |
Table 6 Mean and Standard Deviation (SD) and Minimum and Maximum for All Time Periods |
Table 7 In terms of door to doctor, the highest mean for CAT 3 to CAT 5 was between 44.5386 minutes (STD 58.81712) and 64.8915 minutes (STD 65.63527), and the lowest mean for CAT 1 to CAT 2 was between 13.2537 minutes (STD 37.93030) and 15.2162 minutes (STD 19.56042); the maximum in CAT 3 = 443.00 minutes. In terms of door to disposition (total stay in ED), the highest mean for CAT 1 to CAT 2 was between 372.8108 minutes (STD 338.43478) and 316.0000 minutes (5.2667 to 6.2135 hours) (STD 345.53582), while the lowest mean for CAT 3 to CAT 5 was between 208.6994 minutes (STD 213.91765) and 131.9853 minutes (2.1998 to 3.4783 hours) (STD 107.02419); the maximum in CAT 3 = 1544.00 minutes (25.73 hours). There was a significant difference between all category groups in all time intervals.
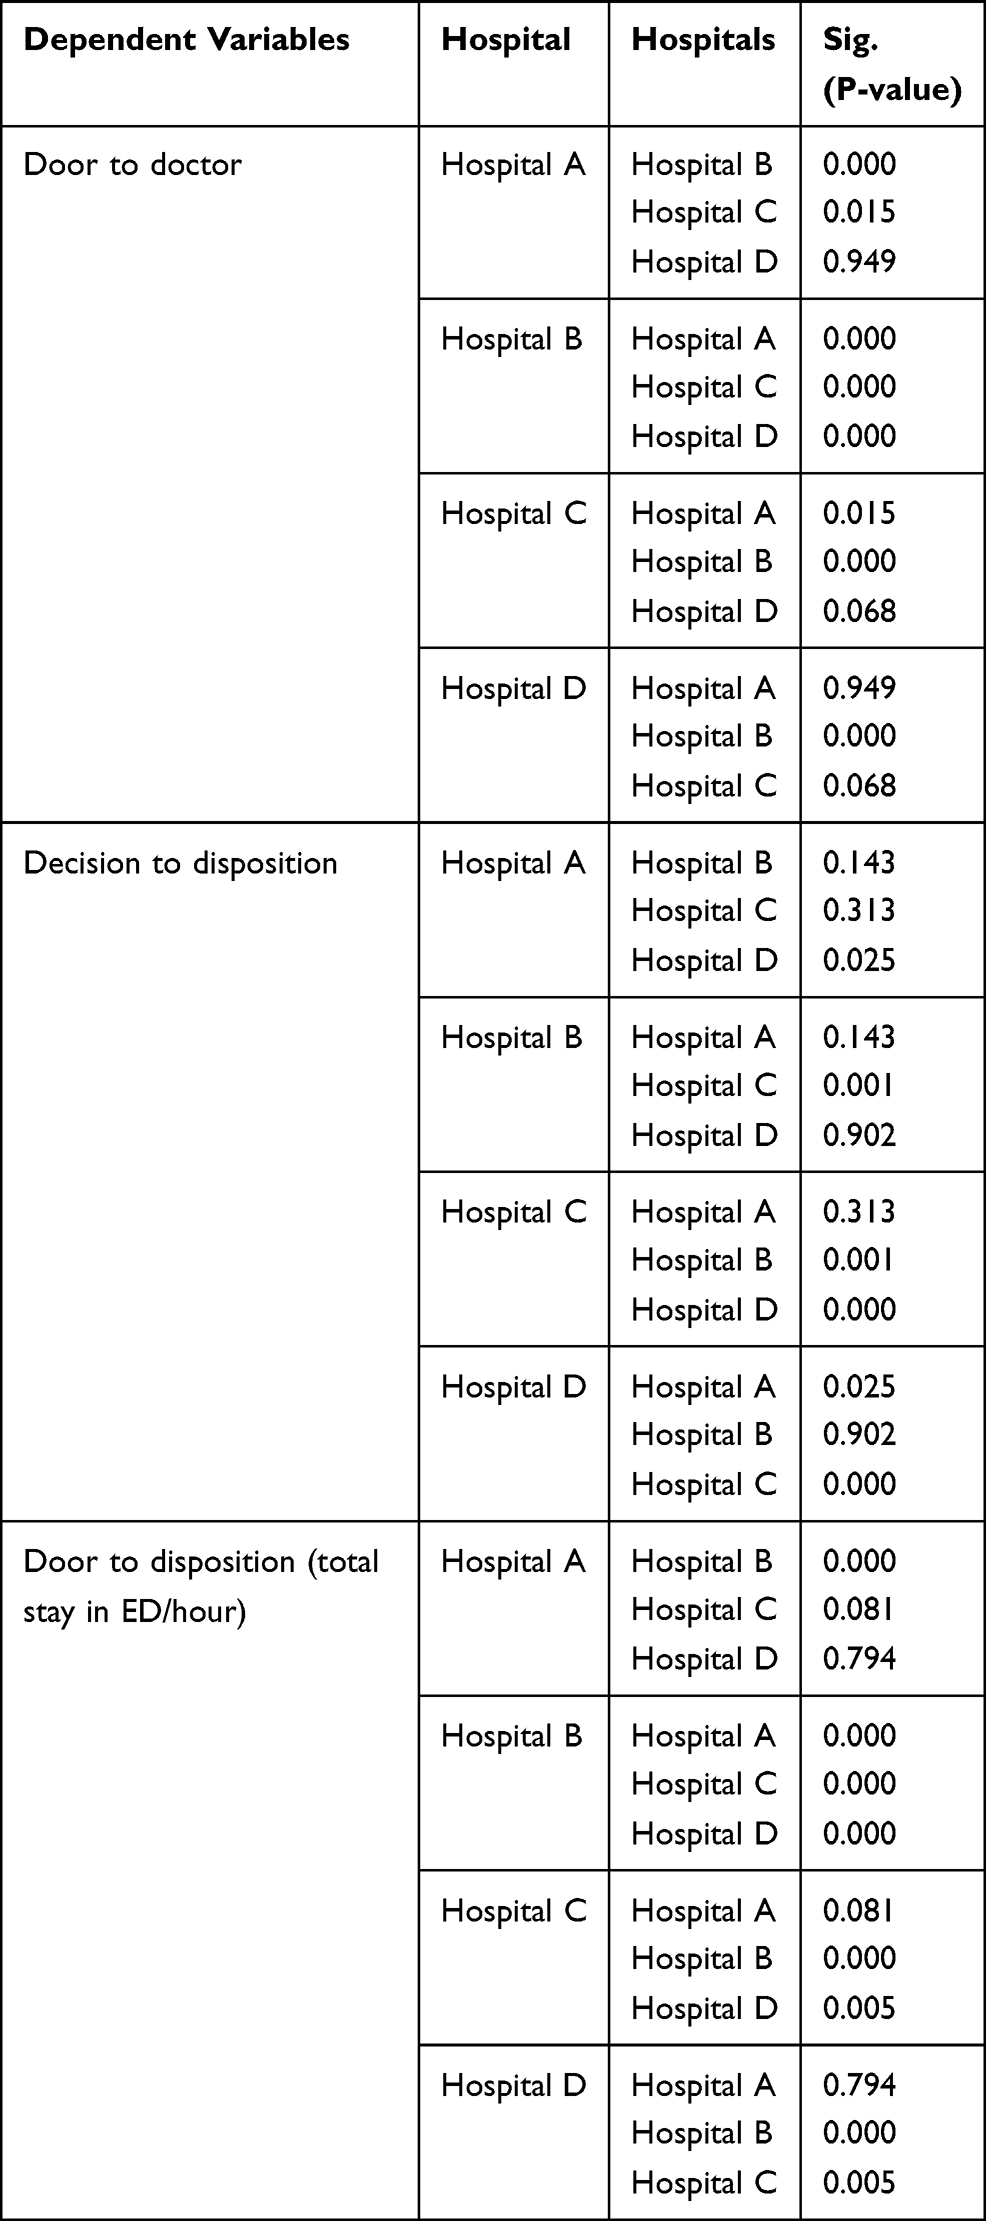 |
Table 7 Post Hoc Tests/Multiple Comparisons Between All Hospitals for Door to Doctor and Door to Disposition (Total Stay in ED/Hour) |
Tables 8 and 9. In terms of door to doctor, there was a significant mean difference in CAT 3 with CAT 1, 2, and 4, and no significant mean difference with CAT 5. Also, there was a significant mean difference in CAT 4 with CAT 1 and 2 and no significant mean difference with CAT 5. In terms of door to disposition (total stay in ED/hour), there was a significant mean difference in CAT 2 with CAT 3, 4, and 5. Also, there was a significant mean difference in CAT 1 with CAT 4 and 5, and no significant mean difference with CAT 2 and 3.
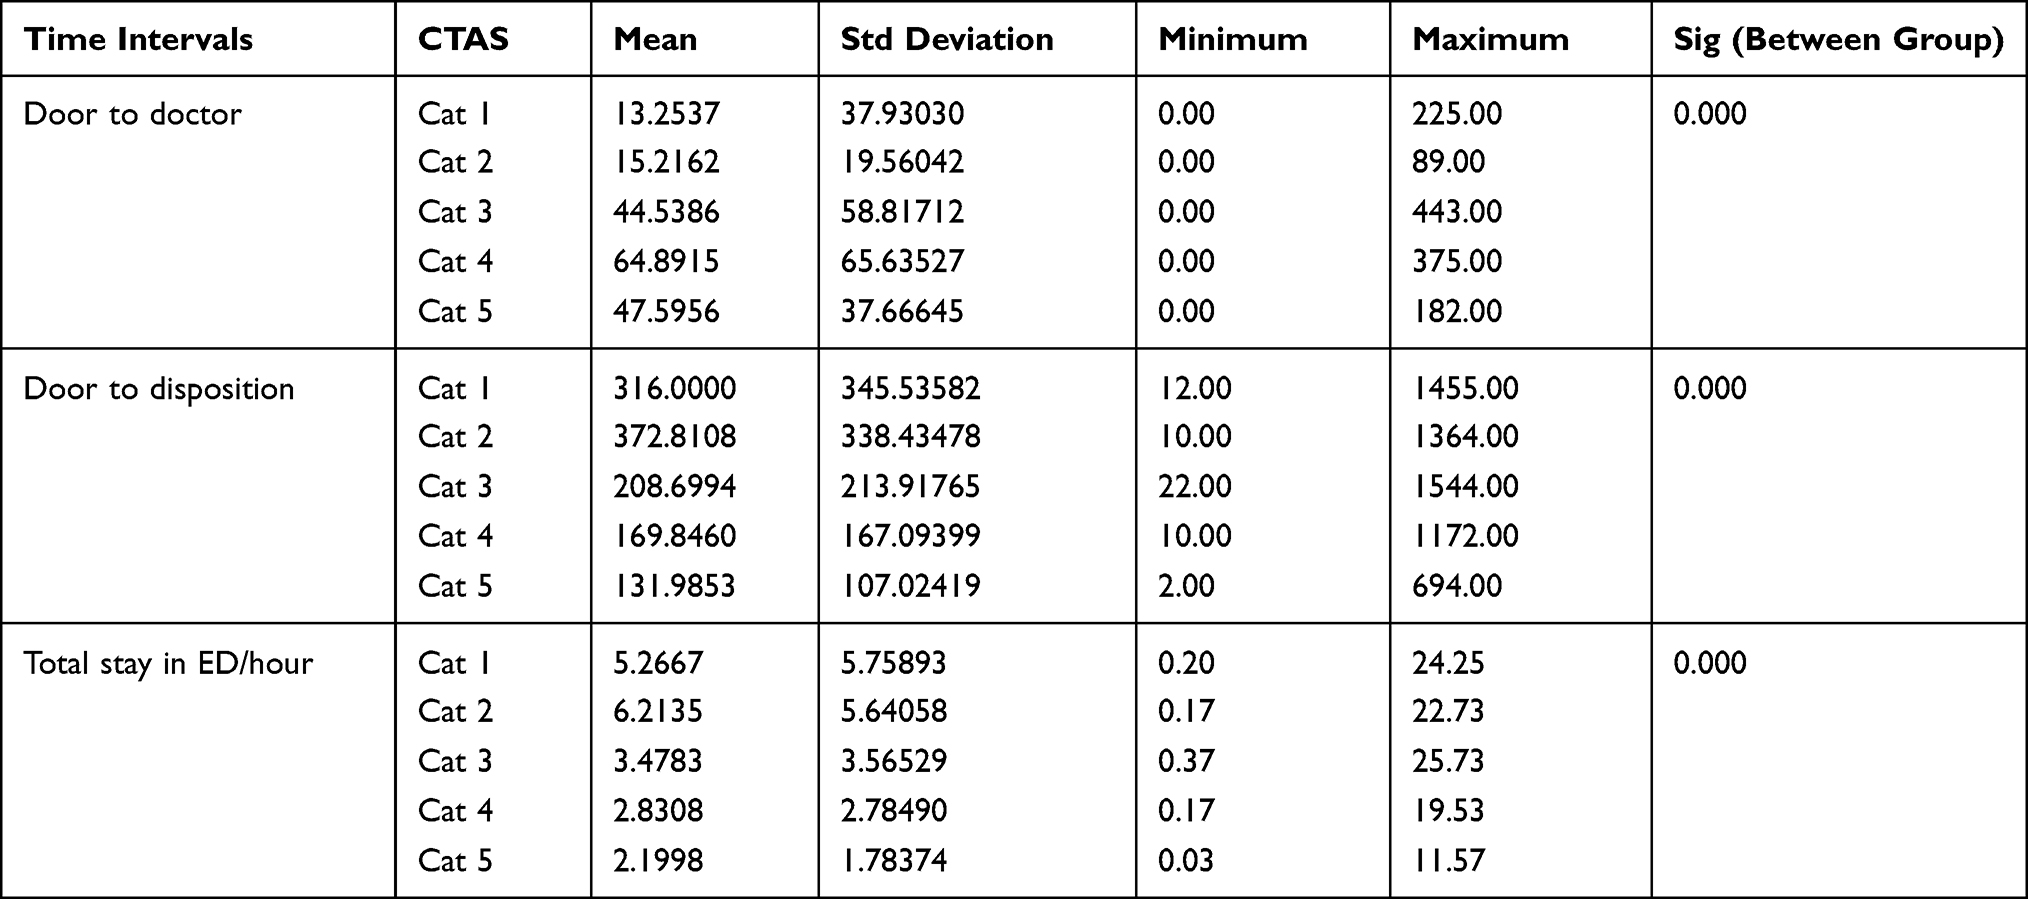 |
Table 8 Mean, Standard Deviation, Minimum, Maximum and ANOVA Test Between All Hospitals in All Intervals Based on CAT Level |
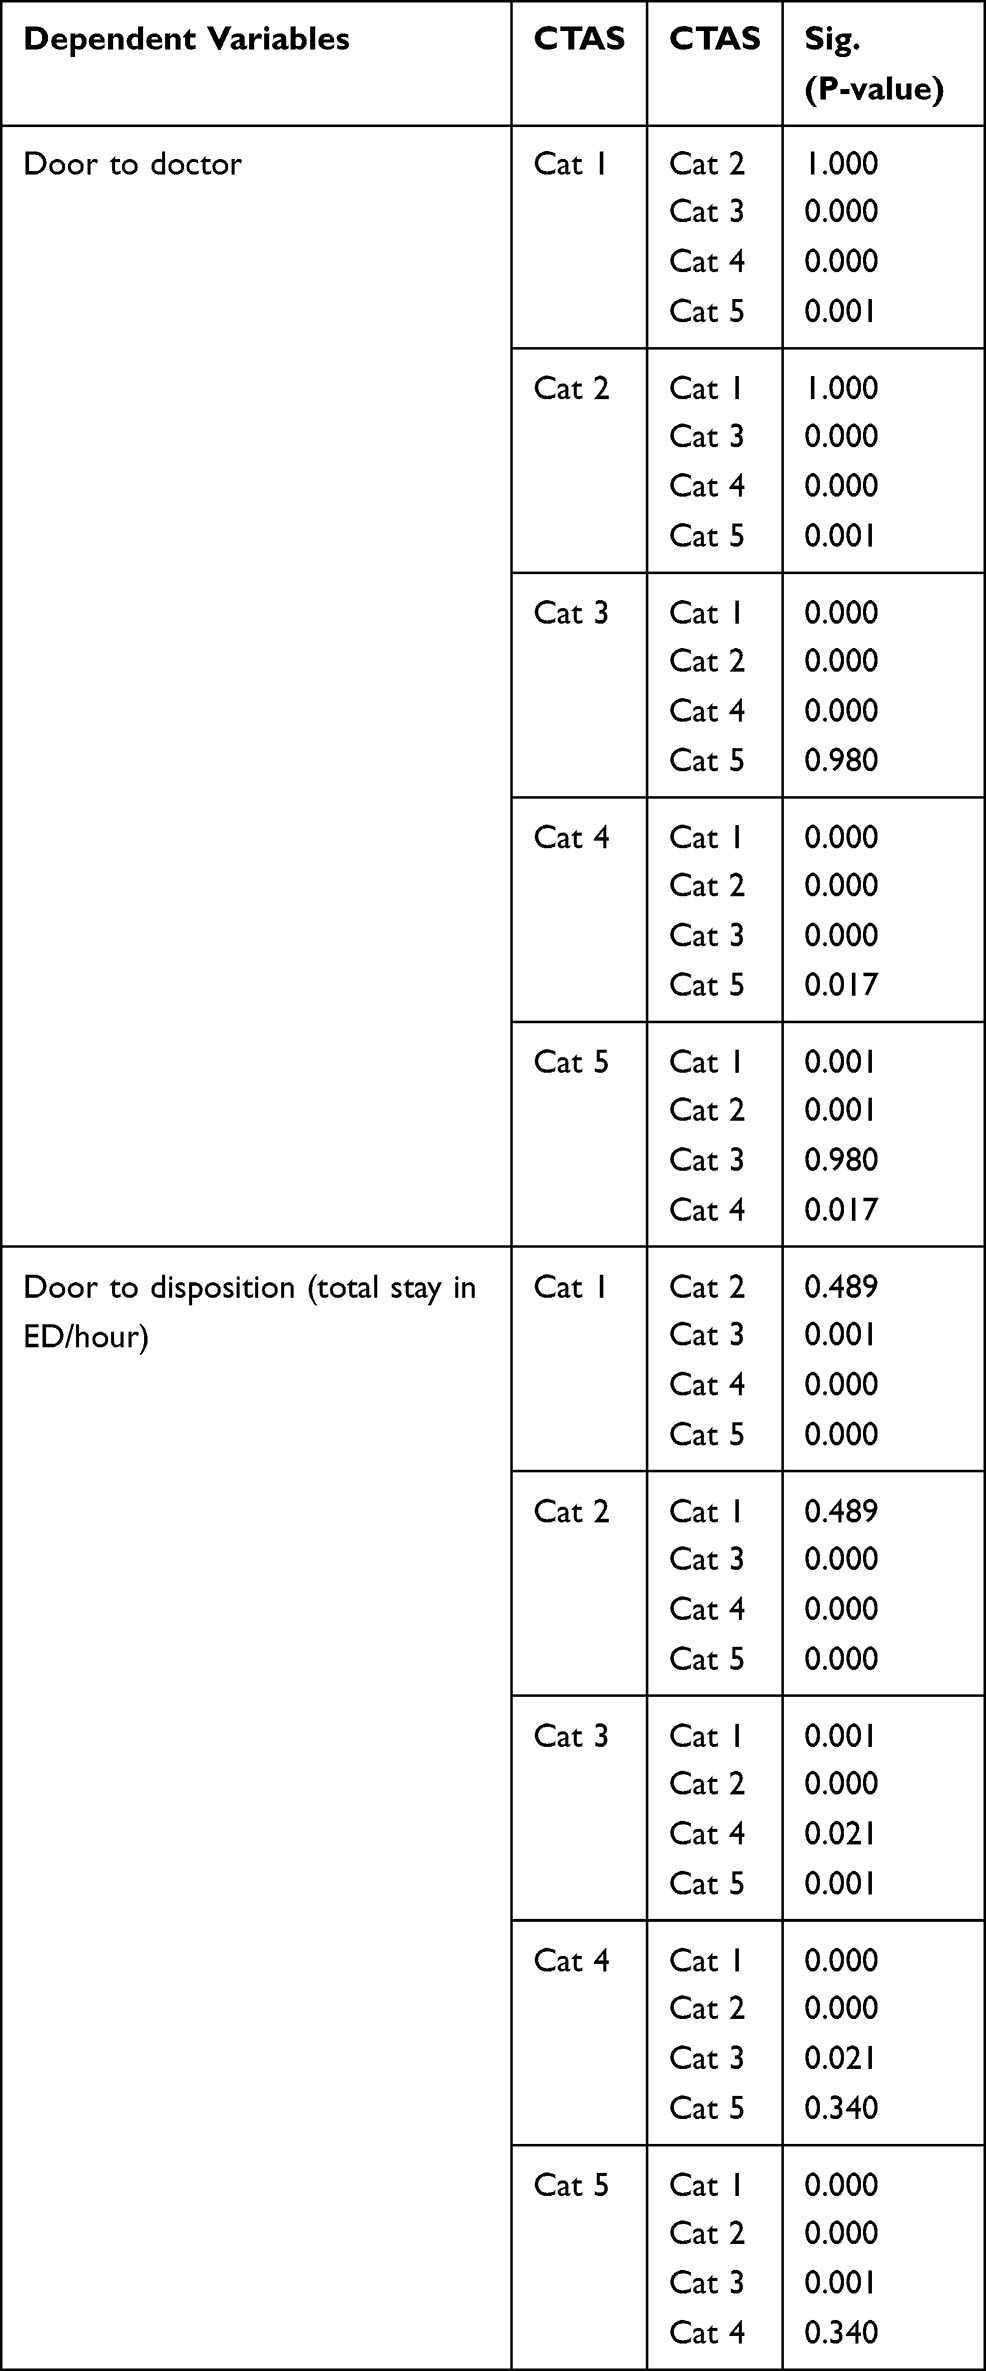 |
Table 9 Post Hoc Tests/Multiple Comparisons Between All Hospitals in All Intervals Based on CAT Level |
Discussion
The most important indicator directly influencing patient satisfaction in EDs is waiting time. To improve performance and services in EDs, this study focused on investigating the indicators of waiting time and length of stay (LOS) to identify the causes, in order, that affect long LOS. The findings of this study showed that the highest percentage from the sample (Table 1) from category 3,4, and 5 representing half of the ED visits was moderate urgency to non-urgent cases. This may be due to the unavailability of 24/7 primary health centers, inadequate access to outpatient services, lack of awareness about the role of ED, and poor discharge follow-up plans and instructions.15 A study by Qureshi found that ED utilization by non-urgent patients increased the range from 50% to more than 70%, leading to overcrowding and decreasing time of care for urgent patients and life-threatening cases.21 There is a significant difference between mean LOS in CTAS 1 and 2 and CTAS 4 and 5. Moreover, there was an inverse correlation between the CTAS levels and mean LOS, the highest level spending more time than the lowest level due to their critical conditions requiring less waiting time before initial assessment and more time and manpower resources for the care and management of patients.11 This result also corresponds with a study conducted at Alnoor Specialist Hospital by Bukhari et al.7 Table 2 shows that the mean of the first indicator (door to doctor time) in all hospitals was (48.60 minutes); SD:59.07, on the other hand, it is the wasted time. This time is crucial for trauma patients and for those patients who have silent life-threatening conditions, such as acute myocardial infarction (AMI). Furthermore, in 2013 the American College of Cardiology (ACC) and the American Heart Association (AHA) recommended that, to decrease mortality, those with acute myocardial infarction should obtain an ECG within 10 minutes and have thrombolytics initiated within 30 minutes.10 In the trauma cases, especially traffic accidents and head injuries, from 75% to 85% of mortalities occur within the first 20 minutes post trauma. These minutes and seconds are critical parameters in a patient’s life.16 The interval of door to doctor is affected by many factors, including triage personnel (either physician or nurse) and ED closure. The second indicator for waiting time doctor to decision time was mean (94.33) SD (101.01) meaning in some cases a wait time was more than 1 hour. During this time, patients can deteriorate, and complications can arise if they do not receive proper timely intervention. There are many reasons that affect physician decision time, including delays in performing consultations from specialized services, delays in ancillary services, patient volume and acuity, and a shortage of nursing staff.12 Additional factors include physician level and experience, shortage of medical resources, poor communication either between staff or with the patient, and delays in physician attendance.13 For decision to disposition time, the third indicator was mean (58.51) STD (166.30) minutes. This interval, known as ED boarding—which refers to the time after the patient has completed ED care and is waiting for an inpatient bed—has a strong relation to inpatient services and availability of beds. There is another correlation here between boarding time and increased inpatient mortality rates.23 In all indicators there were significant differences between hospitals. This may be due to variance between the policies, systems, and characteristics of each ED. The total length of stay (door to disposition time) for patients who visited the ED during the time of the study was less than 4 hours (73.4%), with a mean (3.35 h) SD (3.59) = (202) minutes this result is less than a finding in another study has been conducted by Amina at Baharloo Hospital in Iran by 8 minutes.5 According to the National Emergency Access Target (NEAT) in Australia and the Four-Hour Rule program in the UK, this is an acceptable range; a specific percentage of ED patients should be “admitted, referred for specialist assessment or discharged within 4 hours of presentation when it is clinically appropriate to do so”.1,24 However, around 26.6% of the sample stayed between 4 and 25.7 hours. Chang et al found a strong relation between long length of stay (LLOS) in EDs and poor patient satisfaction, who left without being seen by a physician.8 Moreover, LLOS in ED has a negative effect on inpatient length of stay. A study by Chong et al demonstrated that those who stayed in the ED for a long time were more likely to stay in the inpatient department longer than did those with other admission problems.9 There was a high significance effect for doctor to decision and decision to disposition on total length of stay (door to disposition). In addition to the previous reasons, the following can lead to long doctor to disposition times: variations in surgical schedules (with more elective procedures scheduled for earlier in the week), inefficient discharge and bed-turnover processes, inadequate access to inpatient services, and unavailability of inpatient and critical beds.3,15 Moreover, decision to disposition time has a strong positive significance correlation with total length of stay in ED (door to disposition time), which means that most of the waiting time was related to external factors either inpatient departments or the discharge process. Many solutions have been suggested to improve LLOS, such as having a physician with the specialized nurse as team in visual triage to improve triage scoring; designating a temporary department to accommodate admitted patients who are waiting for beds; creating a discharge lounge for those patients who have been discharged and are waiting for medications or their families; and using online applications or hotline calls to obtain health advice prior to visiting the ED.15 Further research is required to determine the specific reason for long length of stay especially decision to disposition time for each emergency department separately to develop comprehensive solutions.
Conclusion
Most of the ED visits were in the moderate to non-urgent categories. There is a significant difference in the mean time of the categories from one hospital to another. The highest effective indicator for total length of stay in EDs was decision to disposition time. According to the ED international standard of length of stay, the majority of the patients’ total stay in EDs was less than 4 hours.
Recommendations
- Encourage policy makers in each MOH ED to improve waiting time by using continuous evaluation and follow-up.
- Open primary health care centers 24/7 to receive all CTAS level 4 and 5 referrals from EDs of each hospital.
- Conduct cohort study to minimize differences between MOH waiting time and length of stay.
- Implement standardized ED system in all MOH in relation to waiting time and length of stay.
- Ensure that every MOH hospital has appropriate tools to measure patient satisfaction in relation to quality of patient care in EDs, particularly waiting time and length of stay.
- Allocate senior physicians in case assessment and management in ED.
- Improve communication methods between ED and in-patient departments.
- Assign emergency beds in each inpatient department in case of full occupancy of ED; this should depend on special criteria determined by a higher authority.
- Remove decision to disposition interval time from indicators of ED and put it under the bed management and inpatient departments.
- Use artificial intelligence to improve triaging pathway.
Abbreviations
ED, emergency department; CTAS, Canadian Triage and Acuity Scale; LOS, length of stay; KPIs, key performance indicators; MOH, Ministry of Health; AMI, acute myocardial infarction; ACC, American College of Cardiology; AHA, American Heart Association; NEAT, National Emergency Access Target in Australia; ECG, electrocardiogram.
Ethics Statement
Ethical approval was obtained from the Directorate of Health Affairs in Jeddah. The patient consent was not needed because the researcher only used retrospective data focusing on time of patients’ arrival and did not use any patients’ demographic/personal data. All data were kept and stored according to Taif university protocol in terms of patient confidentiality and this study complies with the Declaration of Helsinki.
Acknowledgments
We would like to express our sincere gratitude to Taif University and the MOH hospitals who gave us the golden opportunity to complete this interesting research. Also, we respectfully acknowledge Taif University for supporting this study through Taif University Researchers Supporting Project number (TURSP‐2020/237), Taif University, Taif, Saudi Arabia. The authors also express their gratitude to all participants for giving their valuable time to this study.
Disclosure
The authors report no conflicts of interest in this work.
References
1. Alberti G. Transforming Emergency Care in England: A Report by Professor Sir George Alberti. London: Department of Health (UK); 2004.
2. Agency for Clinical Innovation. 2020. Validation and impact of the 4 hour rule in emergency departments. Agency for Clinical Innovation. Available from: https://aci.health.nsw.gov.au/ie/projects/4-hour-rule-in-eds.
3. Ahmed AA, Ibro SA, Melkamu G, Seid SS, Tesfaye T. Length of stay in the emergency department and its associated factors at Jimma Medical Center, Southwest Ethiopia. Open Access Emerg Med. 2020;12:227–235. doi:10.2147/OAEM.S254239
4. Alquraini M, Awad E, Hijazi R. Reliability of Canadian Emergency Department Triage and Acuity Scale (CTAS) in Saudi Arabia. Int J Emerg Med. 2015;8:29. doi:10.1186/s12245-015-0080-5
5. Amina S, Barrati A, Sadeghifar J, et al. Measuring and analyzing waiting time indicators of patients’ admitted in emergency department: a case study. Glob J Health Sci. 2015;8(1):143–149. doi:10.5539/gjhs.v8n1p143
6. Andersson J, Nordgren L, Cheng I, Nilsson U, Kurland L. Long emergency department length of stay: a concept analysis. Int Emerg Nurs. 2020;53:100930. doi:10.1016/j.ienj.2020.100930
7. Bukhari H, Albazli K, Almaslmani S, et al. Analysis of waiting time in emergency department of Al-Noor Specialist Hospital, Makkah, Saudi Arabia. Open J Emerg Med. 2014;2:67–73. doi:10.4236/ojem.2014.24012
8. Chang AM, Lin A, Fu R, McConnell KJ, Sun B. Associations of emergency department length of stay with publicly reported quality-of-care measures. Acad Emerg Med. 2017;24(2):246–250. doi:10.1111/acem.13102
9. Chong CP, Haywood C, Barker A, Lim WK. Is emergency department length of stay associated with inpatient mortality? Australas J Ageing. 2012;32(2):122–124. doi:10.1111/j.1741-6612.2012.00651.x
10. Goff DC, Lloyd-Jones DM, Glen Bennett MPH, et al. ACC/AHA Guideline on the Assessment of Cardiovascular Risk. US: Lippincott Williams & Wilkins; 2014. Available from: https://www.ahajournals.org/doi/epub/10.1161/01.cir.0000437741.48606.98.
11. Elkum N, Barrett CA, Alomran H. Canadian Emergency Department Triage and Acuity Scale: implementation in a tertiary care center in Saudi Arabia. BMC Emerg Med. 2011;11:3. doi:10.1186/1471-227X-11-3
12. Esmaeili R, Aghili SM, Sedaghat M, Afzalimoghaddam M. Causes of prolonged emergency department stay: a cross-sectional action research. Advan J Emerg Med. 2018;2(2):e18. doi:10.22114/AJEM.v0i0.58
13. Hemmati F, Mahmoudi G, Dabbaghi F, Fatehi F, Rezazadeh E. The factors affecting the waiting time of outpatients in the emergency unit of selected teaching hospitals of Tehran. Electronic J General Med. 2018;15. doi:10.29333/ejgm/93135.
14. Institute of Medicine. Hospital-Based Emergency Care: At the Breaking Point. Washington, DC: National Academies Press; 2007.
15. Jarousse L. ED throughput: a key to patient safety. Hospit Health Net AHA. 2011;85:33–40.
16. Khankeh HR, Khorasani-Zavareh D, Azizi-Naghdloo F, Hoseini MA, Rahgozar M. Triage effect on wait time of receiving treatment services and patient’s satisfaction in the emergency department: example from Iran. Iran J Nurs Midwifery Res. 2013;18(1):79–83.
17. Khattab E, Sabbagh A, Aljerian N, et al. Emergency medicine in Saudi Arabia: a century of progress and a bright vision for the future. Int J Emerg Med. 2019;12:16. doi:10.1186/s12245-019-0232-0
18. Krall SP, Cornelius AP, Addison JB. Hospital factors impact variation in emergency department length of stay more than physician factors. Western J Emerg Med. 2014;15(2):158–164. doi:10.5811/westjem.2013.12.6860.
19. Lee JY, Oh SH, Peck EH, et al. The validity of the Canadian triage and acuity scale in predicting resource utilization and the need for immediate life-saving interventions in elderly emergency department patients. Scand J Trauma Resusc Emerg Med. 2011;19:68. doi:10.1186/1757-7241-19-68
20. Ministry of Health. 2006-2018. Annual statistical report. Available from: https://www.moh.gov.sa/Ministry/MediaCenter/Publications/Pages/default.aspx?PageIndex=2.
21. Qureshi NA. Triage systems: a review of the literature with reference to Saudi Arabia. Eastern Mediterranean Health J. 2010;16:690–698. doi:10.26719/2010.16.6.690
22. Sariyer G, Taşar C, Cepe G. Use of data mining techniques to classify length of stay of emergency department patients. Bio-Algorithms MedSyst. 2019;15:
23. Singer A, Thode H, Viccellio P, Pines J. The association between length of emergency department boarding and mortality. Acad Emerg Med. 2011;18(12):1324–1329. doi:10.1111/j.1553-2712.2011.01236.x
24. Sullivan C, Staib A, Khanna S, et al. The National Emergency Access Target (NEAT) and the 4-hour rule: time to review the target. Med J Aust. 2016;204:354. doi:10.5694/mja15.01177
 © 2021 The Author(s). This work is published and licensed by Dove Medical Press Limited. The full terms of this license are available at https://www.dovepress.com/terms.php and incorporate the Creative Commons Attribution - Non Commercial (unported, v3.0) License.
By accessing the work you hereby accept the Terms. Non-commercial uses of the work are permitted without any further permission from Dove Medical Press Limited, provided the work is properly attributed. For permission for commercial use of this work, please see paragraphs 4.2 and 5 of our Terms.
© 2021 The Author(s). This work is published and licensed by Dove Medical Press Limited. The full terms of this license are available at https://www.dovepress.com/terms.php and incorporate the Creative Commons Attribution - Non Commercial (unported, v3.0) License.
By accessing the work you hereby accept the Terms. Non-commercial uses of the work are permitted without any further permission from Dove Medical Press Limited, provided the work is properly attributed. For permission for commercial use of this work, please see paragraphs 4.2 and 5 of our Terms.