")
Back to Journals » Vascular Health and Risk Management » Volume 13
Inverse relationship of cardioankle vascular index with BMI in healthy Japanese subjects: a cross-sectional study
Authors Nagayama D , Imamura H, Sato Y, Yamaguchi T, Ban N, Kawana H, Ohira M , Saiki A, Shirai K, Tatsuno I
Received 13 August 2016
Accepted for publication 29 September 2016
Published 21 December 2016 Volume 2017:13 Pages 1—9
DOI https://doi.org/10.2147/VHRM.S119646
Checked for plagiarism Yes
Review by Single anonymous peer review
Peer reviewer comments 2
Editor who approved publication: Dr Daniel Duprez
Daiji Nagayama,1,2 Haruki Imamura,2 Yuta Sato,2 Takashi Yamaguchi,2 Noriko Ban,2 Hidetoshi Kawana,2 Masahiro Ohira,2 Atsuhito Saiki,2 Kohji Shirai,3 Ichiro Tatsuno2
1Center of Endocrinology and Metabolism, Shin-Oyama City Hospital, Oyama-City, 2Center of Diabetes, Endocrinology and Metabolism, 3Department of Vascular Function, Sakura Medical Center, Toho University, Sakura-City, Japan
Objective: The objective of this study is to investigate the association of body mass index (BMI) with arterial stiffness assessed by cardioankle vascular index (CAVI).
Subjects and methods: A retrospective cross-sectional study was conducted in 23,257 healthy Japanese subjects (12,729 men and 10,528 women, aged 47.1 ± 12.5 years, BMI 22.9 ± 3.4 kg/m2) who underwent health screening between 2004 and 2006 in Japan. Exclusion criteria were current medication use and a past history of cardiovascular disease, hypertension, stroke, diabetes, and nephritis.
Results: Male subjects showed significantly higher BMI, CAVI, and triglycerides and lower high-density lipoprotein (HDL)-cholesterol compared with female subjects. Next, the subjects were divided into tertiles of BMI: lower, middle, and upper, in a gender-specific manner. After adjusting for confounders including age, systolic blood pressure, and HDL-cholesterol identified by multiple regression analysis, the mean CAVI decreased progressively as BMI tertile increased in both genders. Furthermore, a negative inverse relationship between BMI and adjusted CAVI was observed throughout the BMI distribution. Multivariate logistic regression model for contributors of high CAVI (≥90th percentile) identified obesity (odds ratios (95% confidence interval): 0.804 (0.720–0.899)], older age [15.6 (14.0–17.4)], male gender [2.26 (2.03–2.51)], hypertension [2.28 (2.06–2.54)], impaired fasting glucose [1.17 (1.01–1.37)], and low HDL-cholesterol [0.843 (0.669–1.06)] as independent factors.
Conclusion: We demonstrated an inverse relationship between CAVI and BMI in healthy Japanese subjects, suggesting that systemic accumulation of adipose tissue per se may lead to a linear decrease of arterial stiffness in nonobese and obese subjects without metabolic disorders.
Keywords: BMI, cardioankle vascular index, arterial stiffness
Introduction
Overweight and obesity are defined as abnormal or excessive fat accumulation that may impair health1 and have been reported to be associated with glucose in tolerance, dyslipidemia, and hypertension, thus increasing cardiovascular risks.2,3 Furthermore, cardiovascular disease (CVD) is the leading cause of death worldwide.4 On the other hand, underweight is also associated with increased all-cause mortality compared to normal weight after adjustment for covariates.5–8 It is an obvious fact that body fat distribution influences morbidity and mortality. Thus, healthy ranges for percentage body fat (%BF) should be considered in the management of intensive therapeutic approaches for obesity.9–11 The most commonly used surrogate marker of %BF is body mass index (BMI), which is calculated from a person’s height and weight. BMI is reliable and provides a fair indication of body fat level but is not a perfect system for measuring body fat.12–14 A BMI <18.5 kg/m2 is defined as underweight and a BMI >25 kg/m2 as overweight. Actually, numerous studies have documented a U- or J-shaped association between BMI and mortality and an association of increased mortality rate with relatively low or high BMI.15,16 In Japan, the ideal body weight that is associated with the lowest mortality corresponds to a BMI of 22 kg/m2 in both men and women.17 Arterial stiffness is a significant surrogate marker of subclinical atherosclerosis, and increased arterial stiffness is independently associated with an increased risk of major adverse cardiovascular events (MACEs).18,19
Recently, a novel arterial stiffness diagnostic parameter called cardioankle vascular index (CAVI) has been developed in Japan, which allows quantification of the stiffness parameter beta independent of blood pressure (BP).20–22 This stiffness parameter has adequate reproducibility for clinical use23–27 and is associated with a number of risk factors and severity of CVD.28–33 CAVI has also been reported to be an independent predictor of MACE.34,35 Moreover, an increase in the number of risk factors for metabolic syndrome correlates positively with increased CAVI, probably due to insulin resistance.36 Weight gain most likely contributes to the risk of increase in arterial stiffness. Nevertheless, the relationship between BMI and arterial stiffness has not been fully elucidated.
The aim of this cross-sectional study was to investigate whether BMI is associated independently with arterial stiffness assessed by CAVI after adjustment for covariates in healthy Japanese subjects. Additionally, gender difference in the relationship between BMI and CAVI was also examined.
Subjects and methods
Design
This retrospective cross-sectional study was approved by the Institutional Review Board and Ethics Committee of Sakura Hospital, School of Medicine, Toho University (no S16002). Written informed consent was obtained from the participants.
Data collection and laboratory assay methods
A total of 23,257 Japanese urban residents (12,729 men and 10,528 women) residing in major cities nationwide, who participated in the CVD and cancer screening program provided by the Japan Health Promotion Foundation between 2004 and 2006, were studied. Subjects were excluded if they were taking any medication or had a past history of heart disease, hypertension, stroke, diabetes, nephritis, or gout. Height and body weight were measured, and BMI was calculated [weight (kg) divided by square of height (m2)]. Obesity was defined as BMI ≥25 kg/m2, which is the definition for obesity in adult Japanese population according to the Examination Committee of Criteria for Obesity Disease in Japan.37 Blood was collected from the antecubital vein in the morning after 12-hour fasting to determine γ-glutamyl transpeptidase (γ-GTP), fasting plasma glucose (FPG), glycosylated hemoglobin (HbA1c), total cholesterol (TC), triglycerides (TGs), high-density lipoprotein-cholesterol (HDL-C), creatinine, and uric acid. All the blood levels were measured according to standard procedures. Non-HDL-C was defined as the difference between total and HDL-cholesterol. HbA1c (%) measured by the Japan Diabetes Society (JDC) method was converted to NGSP value (%) using the following formula: HbA1c (NGSP) (%) = HbA1c (JDS) (%) + 0.4%.38 Impaired fasting glucose (IFG) was defined as fasting glucose levels of 100 to 125 mg/dL.39
Measurement of CAVI and BP
CAVI was measured using a VaSera VS-1000 (Fukuda Denshi Co Ltd, Tokyo, Japan) by the methods described previously.20 Cuffs were applied to bilateral upper arms and ankles, with the subject lying supine and the head held in midline position. After resting for 10 minutes, the examinations were performed. To detect the brachial and ankle pulse waves with cuffs, a low cuff pressure from 30 to 50 mmHg was used to ensure minimal effect of cuff pressure on hemodynamics. Furthermore, BP was measured thereafter. Hypertension was defined as systolic BP (sBP) ≥140 mmHg and/or diastolic BP (dBP) ≥90 mmHg.40 Finally, for the convenience of comparison with the pulse wave velocity (PWV), scale conversion was performed. CAVI was calculated by the following formula: CAVI = a{(2ρ/∆P) × ln(Ps/Pd)PWV2} + b, where Ps is sBP, Pd is dBP, ∆P is Ps − Pd, ρ is blood density, and a and b are constants. BP was measured from the cuff of the upper arm. PWV was obtained by dividing the vascular length by the time for which the pulse wave propagated from the aortic valve to the ankle and was measured using cuffs at the upper arms and ankles. All the measurements and calculations were performed automatically by the VaSera. Subjects with ankle–brachial indices <0.90 were excluded, because patients with severe arterial occlusive diseases may give falsely low CAVI.20 The mean coefficient of variation of CAVI measured by this method is <5%, which is sufficiently small for clinical usage and indicates that CAVI has good reproducibility.25
Statistical analysis
All data are expressed as mean ± standard deviation. The SPSS software (version 11.5; SPSS Inc, Chicago, IL, USA) was used for statistical processing. Student’s t-test was performed to examine gender difference in clinical variables. The relationship between CAVI and clinical variables was analyzed using multiple regression analysis. The relationship of CAVI with BMI was analyzed using analysis of variance (ANOVA) after adjusting for confounders of CAVI, together with trend analysis. Logistic regression analysis was used to identify contributors of high CAVI (≥90th percentile) and expressed as odds ratio (OR) with 95% confidence interval (CI). In all comparisons, P values <0.05 were considered statistically significant.
Results
Characteristics of male and female participants
In this study, a total of 23,257 Japanese urban residents (12,729 men and 10,528 women) aged from 20 to 74 (mean 47.1 ± 12.5) years were screened. Table 1 compares the clinical characteristics of male and female participants. Compared with women, men had significantly and markedly higher BMI (23.9 ± 3.2 vs. 21.7 ± 3.3 kg/m2, P = 0.003) and CAVI (7.96 ± 1.14 vs. 7.69 ± 0.97, P < 0.001).
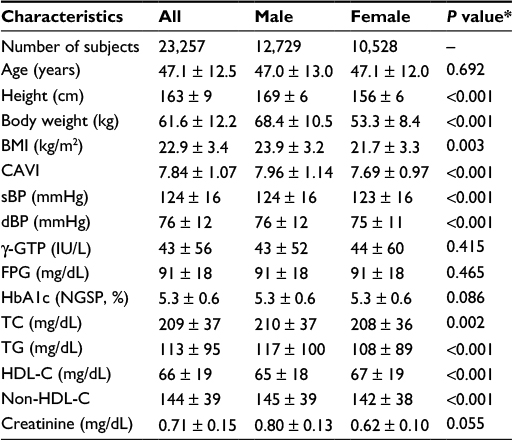 | Table 1 Characteristics of male and female participants Notes: Data are presented as mean ± standard deviation. *Student’s t-test was used to compare male and female subjects. Abbreviations: BMI, body mass index; CAVI, cardioankle vascular index; sBP, systolic blood pressure; dBP, diastolic blood pressure; γ-GTP, γ-glutamyl transpeptidase; FPG, fasting plasma glucose; HbA1c, glycosylated hemoglobin; TC, total cholesterol; TG, triglyceride; HDL-C, high-density lipoprotein-cholesterol. |
Prevalence of major cardiovascular risk factors
The prevalence of traditional cardiovascular risks in participants is shown in Table 2. The proportions of older age, obesity, and hypertension were significantly (P < 0.001) higher in men than in women, whereas the proportions of IFG and low HDL-cholesterol (defined as HDL-C <40 mg/dL) were not significantly different (Table 2).
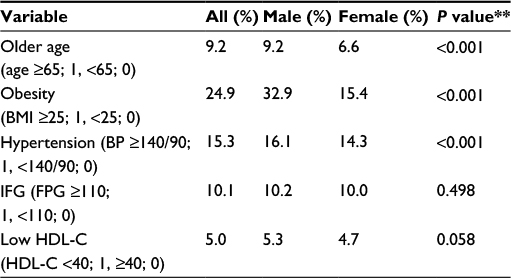 | Table 2 Prevalence of major cardiovascular risk factors Note: **Fisher’s exact test was used to compare male and female subjects. Abbreviations: BMI, body mass index; BP, blood pressure; IFG, impaired fasting glucose; FPG, fasting plasma glucose; HDL-C, high-density lipoprotein-cholesterol. |
Correlation of CAVI with clinical variables analyzed by multiple regression model
Next, we examined the factors associated with CAVI. Table 3 summarizes the results of a multiple regression analysis for the correlation between CAVI and clinical variables. TG was also omitted because of intraclass correlation with HDL-C, and non-HDL-C was added instead. Age was a major independent predictor of CAVI (β coefficient = 0.584, P < 0.001). Additionally, a low correlation between CAVI and gender (β = 0.149, P < 0.001), BMI (β = −0.119, P < 0.001), sBP (β = 0.139, P < 0.001), or HDL-C (β = 0.107, P < 0.001) was observed. These confounders, except gender and BMI, were adjusted in subsequent analyses of CAVI as shown in Table 4 and Figure 1.
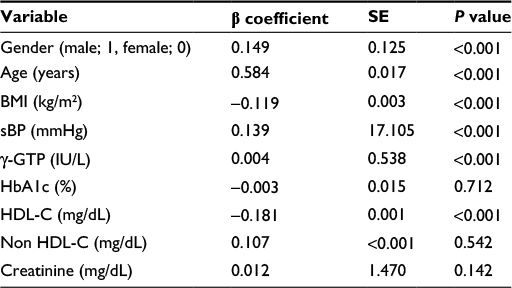 | Table 3 Correlation of cardioankle vascular index with clinical variables analyzed by multiple regression model Note: Model: r2 = 0.598, P < 0.001. Abbreviations: SE, standard error; BMI, body mass index; sBP, systolic blood pressure; γ-GTP, γ-glutamyl transpeptidase; HbA1c, glycosylated hemoglobin; HDL-C, high-density lipoprotein-cholesterol. |
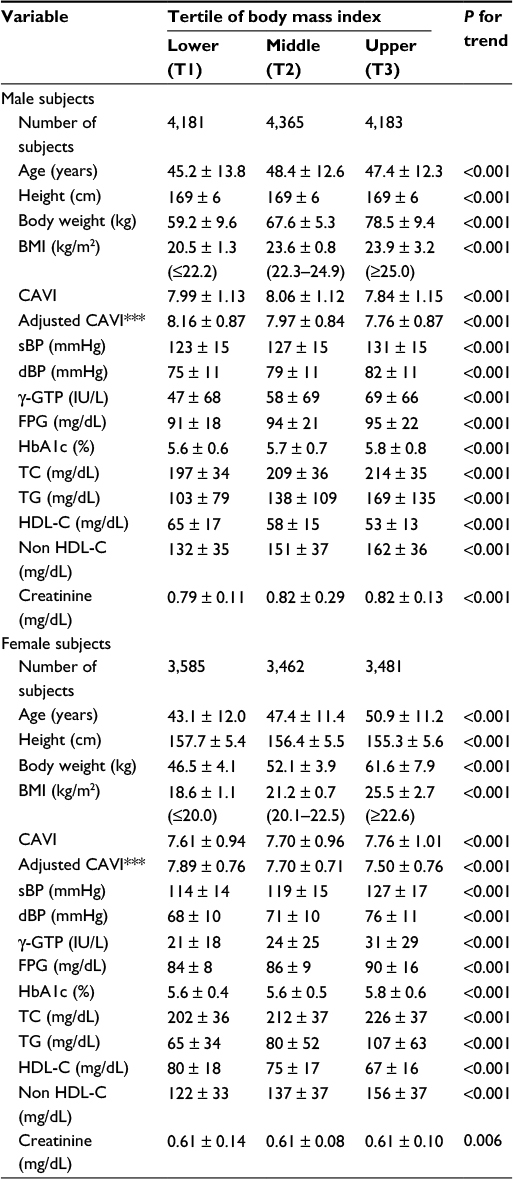 | Table 4 Characteristics of male and female participants stratified by tertile of body mass index Notes: ***CAVI was adjusted by age, sBP, and HDL-C. Data are presented as mean ± standard deviation, P value for trend by ANOVA. Abbreviations: BMI, body mass index; CAVI, cardioankle vascular index; sBP, systolic blood pressure; dBP, diastolic blood pressure; γ-GTP, γ-glutamyl transpeptidase; FPG, fasting plasma glucose; HbA1c, glycosylated hemoglobin; TC, total cholesterol; TG, triglyceride; HDL-C, high-density lipoprotein-cholesterol; ANOVA, analysis of variance. |
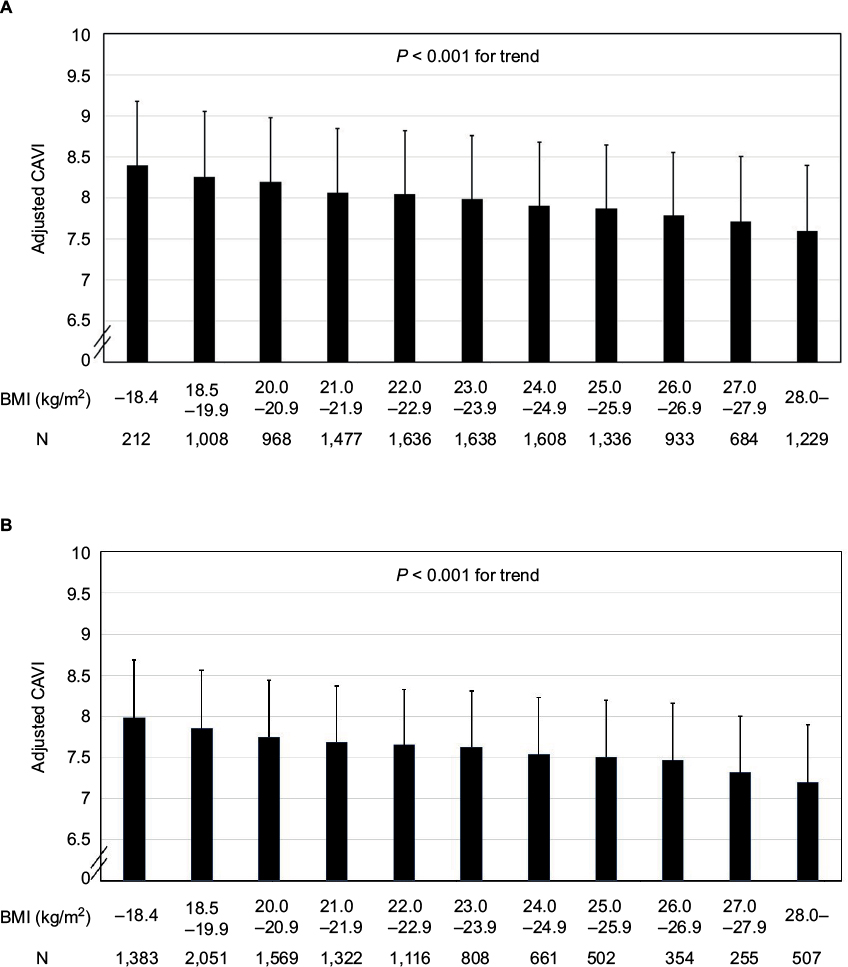 | Figure 1 Relationship between adjusted cardioankle vascular index and BMI in (A) male and (B) female subjects. Notes: CAVI was adjusted by age, sBP, and HDL-C. Data are presented as mean ± standard deviation. A significant linear trend [F = 53.732, P < 0.001 in (A) and F = 61.386, P < 0.001 in (B)] was observed for the whole BMI distribution. Abbreviations: BMI, body mass index; CAVI, cardioankle vascular index; sBP, systolic blood pressure; HDL-C, high-density lipoprotein-cholesterol. |
Characteristics of male and female participants stratified by tertiles of BMI
Participants were divided into men and women, and each gender group was stratified by BMI tertiles into the following three groups: lower (T1), middle (T2), and upper tertile (T3). Among 12,729 men, 4,181 were stratified into T1 (BMI ≤22.2 kg/m2), 4,365 into T2 (22.3–24.9 kg/m2), and 4,183 into T3 (≥25.0 kg/m2). Among 10,528 women, 3,585 were stratified into T1 (≤20.0 kg/m2), 3,462 into T2 (20.1–22.5 kg/m2), and 3,481 into T3 (≥22.6 kg/m2). Table 4 compares their clinical characteristics. CAVI was adjusted for confounders identified in the multiple regression model as shown in Table 3. In both genders, sBP, dBP, γ-GTP, FPG, HbA1c, TC, TG, and non-HDL-C increased, while adjusted CAVI and HDL-C decreased progressively with increasing BMI tertile.
ORs (95% CIs) for high CAVI (≥90th percentile)
Furthermore, we examined the factors associated with high CAVI using multivariate logistic regression model with dichotomous variables (Table 5). High CAVI was defined as ≥90th percentile of CAVI (9.20 in all participants). Gender and major cardiovascular risks were entered into the model as shown in Table 2. The analysis identified the following factors to be independently associated with high CAVI: male gender (OR: 2.26, P < 0.001), older age (OR: 15.6, P < 0.001), hypertension (OR: 2.28, P < 0.001), and IFG (OR: 1.17, P = 0.0428). Interestingly, obesity correlated negatively with high CAVI (OR: 0.804, P < 0.001). Low HDL-cholesterol was not a significant independent predictor of high CAVI.
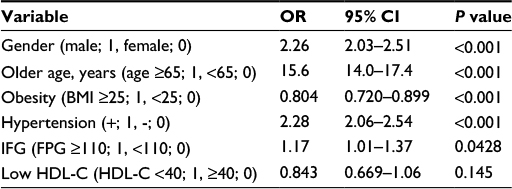 | Table 5 OR (95% CI) for high cardioankle vascular index (≥90th percentile) Note: Akaike’s Information Criterion: 12,166, residual deviance: 12,152, P < 0.0001. Abbreviations: CI, confidence interval; BMI, body mass index; IFG, impaired fasting glucose; FPG, fasting plasma glucose; HDL-C, high-density lipoprotein-cholesterol; OR, odds ratio. |
Relationship of adjusted CAVI with BMI in men and women
Figure 1 shows the relationship of adjusted CAVI with BMI in (Figure 1A) men and (Figure 1B) women. In both genders, a trend test after ANOVA detected an inverse linear relationship (P < 0.001) between adjusted CAVI and BMI throughout the entire BMI distribution.
Discussion
In this cross-sectional study, gender, age, BMI, BP, and HDL-cholesterol were major independent variables associated with CAVI in 23,257 healthy Japanese subjects. After adjusting for confounders, CAVI correlated negatively with BMI in both genders. Furthermore, obesity was identified as an independent negative predictor of high CAVI (≥90th percentile), while male gender, hypertension, and IFG were found to be independent positive predictors. Consequently, the present study is the first report to demonstrate an inverse relationship between CAVI and BMI in healthy middle-aged subjects. Note that most of the participants in the present study were nonobese subjects without metabolic disorders. If the study was conducted in obese subjects with metabolic disorders, the results might have been markedly different.
Weight gain has been associated with vascular remodeling and increased cardiovascular mortality.41 CAVI has been shown to be high in the abdominal obesity/metabolic syndrome and decrease by body weight reduction.42 Insulin resistance, a consequence of weight gain, has been recognized as an independent predictor of vascular stiffening and other elements of diabetic vasculopathy.43 Our finding of an inverse relationship between CAVI and BMI might seem inconsistent with previous reports. However, the interaction of weight gain with insulin resistance in the regulation of vascular pathophysiology involves complex mechanisms that are not fully understood. Thus, the mechanism of vascular adaptation to fat accumulation remains controversial. In fact, a negative association of obesity with vascular stiffening has been reported in children and adolescents44–46 but not in older adults or the elderly.47–50 We therefore stratified the participants in this study by age into tertiles: lower (33.1 ± 5.0 years, n = 7,878), middle (47.1 ± 3.8 years, n = 7,577), and upper (61.0 ± 6.1 years, n = 7,802) and investigated the contribution of BMI to CAVI in each group using logistic regression analysis. We found approximately equal degree of inverse relationship between CAVI and BMI in all three tertiles (data not shown). However, these data do not imply a similar inverse relationship between CAVI and BMI in elderly subjects. While weight gain is a risk factor for CVD, an inverse relationship between BMI and CAVI was observed in the present study. An increase in number of risk factors for metabolic syndrome has been shown to correlate positively with an increase in CAVI.36 Furthermore, we observed previously that weight reduction resulted in a decrease of CAVI in 47 obese (BMI: 33.3 ± 7.5 kg/m2) Japanese subjects with metabolic disorders.42 In that study, change in visceral fat area alone contributed to the change in CAVI. From the previous findings, we hypothesize that systemic accumulation of adipose tissue per se leads to decreased arterial stiffness in nonobese subjects and in obese subjects without metabolic disorders, and excessive accumulation of visceral fat may induce an increase in arterial stiffness from insulin resistance. However, the mechanism and the threshold of the effect of BMI on change in arterial stiffness are not fully understood. Despite weight gain being a risk of CVD development, an obesity paradox exists in which obese patients with heart failure, hypertension, and chronic renal disease have better prognosis with lower mortality than normal weight individuals.51–54 For example, ~10–25% of obese individuals are metabolically healthy due to preserved insulin sensitivity.55 The plausible mechanisms for this reverse epidemiology may be explained by greater metabolic reserves, less cachexia, attenuated response to renin–angiotensin–aldosterone system, increased muscular strength, implications related to cardiorespiratory fitness, and others. Furthermore, various protective cytokines and neuroendocrine profiles in obese patients may account for this phenomenon.56–58 Similarly, adipose tissue-derived cytokines may explain the paradox in arterial stiffness observed in the present study. Shiba et al59 reported that intravitreal injection of antivascular endothelial growth factor (anti-VEGF) drugs decreased CAVI and carotid intima–media thickness, probably due to attenuation of vasa vasorum and improved kidney function. Inhibition of angiogenesis inducers such as VEGF may therefore result in a decrease in arterial stiffness. On the other hand, tenomodulin (TNMD), a putative angiogenesis inhibitor, has been shown to be highly expressed in human adipose tissue, especially in obese subjects.60 Furthermore, a recent study suggests that TNMD acts as a protective factor in visceral adipose tissue to alleviate insulin resistance in obesity.61 We have previously reported that improved insulin resistance may contribute to decreased CAVI in obese42 and type 2 diabetic patients.62–64 These reports suggest that adipose tissue may affect systemic vascular function through expression of antiangiogenic factors such as TNMD. However, whether the decrease in arterial stiffness through inhibition of angiogenesis provides favorable effects is questionable, because antiangiogenic factor may impair the development of collaterals, which is an important mechanism to compensate for obstructive artery disease.65 Further elucidation of the cause–effect relationship between accumulation of adipose tissue and regulation of arterial pathophysiology is required.
What is the clinical efficacy of our findings? We hypothesized that CAVI might be useful to exclude “malignant obesity”, which was rapidly needed to receive intensive medical interventions. Obese subjects with relatively low CAVI may reveal “benign obesity”, which means normal metabolic features despite increased adiposity, and they may be allowed a period of grace for atherogenesis. Of course, metabolically healthy overweight/obese individuals may be needed to receive permanent medical follow-up because of increased risk of adverse long-term outcomes after all.66
Gender difference in CAVI has been reported previously.21 Similarly, in this study, mean CAVI was higher in men (7.96 ± 1.14) than in women (7.69 ± 0.97), despite almost the same age in both groups (47.0 ± 13.0 in men and 47.1 ± 12.0 years in women). The mechanism of this gender difference in CAVI remains uncertain, although gender-related differences in body fat distribution may partly explain the phenomenon.
In 2002, brachial–ankle PWV (baPWV) was proposed to be a marker of vascular damage and was reported to be a predictive marker of CVD.67 Furthermore, baPWV correlates strongly with aortic (carotid–femoral) PWV, an established index of central arterial stiffness.68 However, PWV is known to depend on BP at the time of measurement. Therefore, the validity of PWV in reflecting actual arterial stiffness is controversial, and this parameter is unsuitable for evaluating the effect of antihypertensive drugs on the arterial wall. On the other hand, CAVI is independent of BP, which makes it more precise and reproducible than PWV as an index of arterial stiffness, whereas its predictive value of cardiovascular events has not been established adequately.69 Additionally, a multiple logistic analysis revealed that CAVI, but not baPWV, was associated with the presence of carotid and coronary arteriosclerosis.29
The limitations of this study include the lack of data on some potential confounders such as proteinuria,70 alcohol consumption, menopause, and smoking status. In addition, the cross-sectional nature of this study does not allow determination of the time course for the development of vascular changes. Therefore, it was not possible to establish the exact pathophysiology linking BMI with CAVI. From these viewpoints, longitudinal cohort studies are needed to clarify the change in relationship between body composition and arterial stiffness during the development of cardiovascular risks.
Conclusion
We demonstrated an inverse linear relationship between CAVI and BMI in healthy Japanese subjects, suggesting that systemic accumulation of adipose tissue per se may lead to a proportionate decrease in arterial stiffness in nonobese subjects and obese subjects without metabolic disorders.
Acknowledgments
We are grateful to Dr. Kenji Suzuki, Japan Health Promotion Foundation, for making enormous contribution in this study, and we gratefully acknowledge the investigators, their coinvestigators, study coordinators, and the patients who participated in this study.
Author contributions
Kohji Shirai contributed to concept/design. Daiji Nagayama contributed to data analysis and interpretation. Ichiro Tatsuno contributed to critical revision of article. Haruki Imamura, Yuta Sato, Takashi Yamaguchi, Noriko Ban, Hidetoshi Kawana, Masahiro Ohira, and Atsuhito Saiki contributed to data interpretation. All authors contributed toward data analysis, drafting and critically revising the paper and agree to be accountable for all aspects of the work.
Disclosure
The authors report no conflicts of interest in this work.
References
World Health Organization [webpage on the Internet]. Obesity and Overweight: Fact Sheet N0 311. 2012. Updated June 2016. Available from: http://www.who.int/mediacentre/factsheets/fs311/en/index.html. Accessed June 1, 2016. | ||
Yusuf S, Hawken S, Ounpuu S, et al; INTERHEART Study Investigators. Obesity and the risk of myocardial infarction in 27,000 participants from 52 countries: a case-control study. Lancet. 2005;366(9497):1640–1649. | ||
Britton KA, Massaro JM, Murabito JM, Kreger BE, Hoffmann U, Fox CS. Body fat distribution, incident cardiovascular disease, cancer, and all-cause mortality. J Am Coll Cardiol. 2013;62(10):921–925. | ||
GBD Mortality Causes of Death Collaborators. Global, regional, and national age-sex specific all-cause and cause-specific mortality for 240 causes of death, 1990-2013: a systematic analysis for the Global Burden of Disease Study 2013. Lancet. 2015;385(9963):117–171. | ||
Flegal KM, Graubard BI, Williamson DF, Gail MH. Excess deaths associated with underweight, overweight, and obesity. JAMA. 2005;293(15):1861–1867. | ||
Jee SH, Sull JW, Park J, et al. Body-mass index and mortality in Korean men and women. N Engl J Med. 2006;355(8):779–787. | ||
Roh L, Braun J, Chiolero A, et al; Swiss National Cohort Study Group. Mortality risk associated with underweight: a census-linked cohort of 31,578 individuals with up to 32 years of follow-up. BMC Public Health. 2014;16(14):371. | ||
Bucholz EM, Krumholz HA, Krumholz HM. Underweight, markers of cachexia, and mortality in acute myocardial infarction: a prospective cohort study of elderly medicare beneficiaries. PLoS Med. 2016;13(4):e1001998. | ||
Gallagher D, Heymsfield SB, Heo M, Jebb SA, Murgatroyd PR, Sakamoto Y. Healthy percentage body fat ranges: an approach for developing guidelines based on body mass index. Am J Clin Nutr. 2000;72(3):694–701. | ||
McCarthy HD, Cole TJ, Fry T, Jebb SA, Prentice AM. Body fat reference curves for children. Int J Obes. 2006;30(4):598–602. | ||
Gómez-Ambrosi J, Silva C, Galofré JC, et al. Body mass index classification misses subjects with increased cardiometabolic risk factors related to elevated adiposity. Int J Obes. 2012;36(2):286–294. | ||
Jackson AS, Stanforth PR, Gagnon J, et al. The effect of sex, age and race on estimating percentage body fat from body mass index: the heritage family study. Int J Obes Relat Metab Disord. 2002;26(6):789–796. | ||
Gallagher D, Visser M, Sepulveda D, Pierson RN, Harris T, Heymsfield SB. How useful is body mass index for comparison of body fatness across age, sex, and ethnic groups? Am J Epidemiol. 1996;143:228–239. | ||
Ranasinghe C, Gamage P, Katulanda P, Andraweera N, Thilakarathne S, Tharanga P. Relationship between Body Mass Index (BMI) and body fat percentage, estimated by bioelectrical impedance, in a group of Sri Lankan adults: a cross sectional study. BMC Public Health. 2013;3(13):797. | ||
Whitlock G, Lewington S, Sherliker P, et al. Body-mass index and cause-specific mortality in 900000 adults: collaborative analyses of 57 prospective studies. Lancet. 2009;373(9669):1083–1096. | ||
Zheng W, McLerran DF, Rolland B, et al. Association between body-mass index and risk of death in more than 1 million Asians. N Engl J Med. 2011;364(8):719–729. | ||
Tokunaga K, Matsuzawa Y, Kotani K, et al. Ideal body weight estimated from the body mass index with the lowest morbidity. Int J Obes. 1991;15(1):1–5. | ||
Yamashina A, Tomiyama H, Arai T, et al. Brachial-ankle pulse wave velocity as a marker of atherosclerotic vascular damage and cardiovascular risk. Hypertens Res. 2003;26(8):615–622. | ||
Imanishi R, Seto S, Toda G, et al. High brachial-ankle pulse wave velocity is an independent predictor of the presence of coronary artery disease in men. Hypertens Res. 2004;27(2):71–78. | ||
Shirai K, Utino J, Otsuka K, Takata M. A novel blood pressure-independent arterial wall stiffness parameter; cardioankle vascular index (CAVI). J Atheroscler Thromb. 2006;13(2):101–107. | ||
Shirai K, Hiruta N, Song M, et al. Cardio-ankle vascular index (CAVI) as a novel indicator of arterial stiffness: theory, evidence and perspectives. J Atheroscler Thromb. 2011;18(11):924–938. | ||
Shirai K, Saiki A, Nagayama D, Tatsuno I, Shimizu K, Takahashi M. The role of monitoring arterial stiffness with cardio-ankle vascular index in the control of lifestyle-related diseases. Pulse (Basel). 2015;3(2):118–133. | ||
Matsui Y, Kario K, Ishikawa J, Eguchi K, Hoshide S, Shimada K. Reproducibility of arterial stiffness indices (pulse wave velocity and augmentation index) simultaneously assessed by automated pulse wave analysis and their associated risk factors in essential hypertensive patients. Hypertens Res. 2004;27(11):851–857. | ||
Yambe T, Yoshizawa M, Saijo Y, et al. Brachio-ankle pulse wave velocity and cardio-ankle vascular index (CAVI). Biomed Pharmacother. 2004;58(suppl 1):95–98. | ||
Kubozono T, Miyata M, Ueyama K, et al. Clinical significance and reproducibility of new arterial distensibility index. Circ J. 2007;71(1):89–94. | ||
Nakamura K, Tomaru T, Yamamura S, Miyashita Y, Shirai K, Noike H. Cardio-ankle vascular index is a candidate predictor of coronary atherosclerosis. Circ J. 2008;72(4):598–604. | ||
Noike H, Nakamura K, Sugiyama Y, et al. Changes in cardio-ankle vascular index in smoking cessation. J Atheroscler Thromb. 2010;17(5):517–525. | ||
Nakamura K, Iiduka T, Takahashi M, et al. Association between cardio-ankle vascular index and serum cystatin C levels in patients with cardiovascular risk factor. J Atheroscler Thromb. 2009;16(4):371–379. | ||
Izuhara M, Shioji K, Kadota Y, et al. Relationship of cardiovascular index to carotid and coronary arteriosclerosis. Circ J. 2008;72(11):1762–1767. | ||
Miyoshi T, Doi M, Hirohata S, et al. Cardio-ankle vascular index is independently associated with the severity of coronary atherosclerosis and left ventricular function in patients with ischemic heart disease. J Atheroscler Thromb. 2010;17(3):249–258. | ||
Horinaka S, Yabe A, Yagi H, et al. Comparison of atherosclerotic indicators between cardio ankle vascular index and brachial ankle pulse wave velocity. Angiology. 2009;60(4):468–476. | ||
Yingchoncharoen T, Limpijankit T, Jongjirasiri S, Laothamatas J, Yamwong S, Sritara P. Arterial stiffness contributes to coronary artery disease risk prediction beyond the traditional risk score (RAMA-EGAT score). Heart Asia. 2012;4(1):77–82. | ||
Suzuki J, Kurosu T, Kon T, Tomaru T. Impact of cardiovascular risk factors on progression of arteriosclerosis in younger patients: evaluation by carotid duplex ultrasonography and cardio-ankle vascular index (CAVI). J Atheroscler Thromb. 2014;21(6):554–562. | ||
Sato Y, Nagayama D, Saiki A, et al. Cardio-ankle vascular index is independently associated with future cardiovascular events in outpatients with metabolic disorders. J Atheroscler Thromb. 2016;23(5):596–605. | ||
Satoh-Asahara N, Kotani K, Yamakage H, et al; Japan Obesity and Metabolic Syndrome Study (JOMS) Group. Cardio-ankle vascular index predicts for the incidence of cardiovascular events in obese patients: a multicenter prospective cohort study (Japan Obesity and Metabolic Syndrome Study: JOMS). Atherosclerosis. 2015;242(2):461–468. | ||
Satoh N, Shimatsu A, Kato Y, et al. Evaluation of the cardio-ankle vascular index, a new indicator of arterial stiffness independent of blood pressure, in obesity and metabolic syndrome. Hypertens Res. 2008;31(10):1921–1930. | ||
Examination Committee of Criteria for ‘Obesity Disease’ in Japan, Japan Society for the Study of Obesity. New criteria for ‘obesity disease’ in Japan. Circ J. 2002;66(11):987–992. | ||
The Committee of Japan Diabetes Society on the Diagnostic Criteria of Diabetes Mellitus, Seino Y, Nanjo K, et al. Report of the Committee on the classification and diagnostic criteria of diabetes mellitus. J Diabetes Soc. 2010;53:450–467. | ||
Genuth S, Alberti KG, Bennett P, et al; Expert Committee on the Diagnosis and Classification of Diabetes Mellitus. Follow-up report on the diagnosis of diabetes mellitus. Diabetes Care. 2003;26:3160–3167. | ||
Carretero OA, Oparil S. Essential hypertension. Part I: definition and etiology. Circulation. 2000;101(3):329–335. | ||
Martínez-Martínez E, Miana M, Jurado-López R, et al. The potential role of leptin in the vascular remodeling associated with obesity. Int J Obes (Lond). 2014;38(12):1565–1572. | ||
Nagayama D, Endo K, Ohira M, et al. Effects of body weight reduction on cardio-ankle vascular index (CAVI). Obes Res Clin Pract. 2013;7(2):139–145. | ||
Jia G, Sowers JR. Endothelial dysfunction potentially interacts with impaired glucose metabolism to increase cardiovascular risk. Hypertension. 2014;64(6):1192–1193. | ||
Lurbe E, Torro I, Garcia-Vicent C, Alvarez J, Fernández-Fornoso JA, Redon J. Blood pressure and obesity exert independent influences on pulse wave velocity in youth. Hypertension. 2012;60(2):550–555. | ||
Dangardt F, Osika W, Volkmann R, Gan LM, Friberg P. Obese children show increased intimal wall thickness and decreased pulse wave velocity. Clin Physiol Funct Imaging. 2008;28(5):287–293. | ||
Charakida M, Jones A, Falaschetti E, et al. Childhood obesity and vascular phenotypes: a population study. J Am Coll Cardiol. 2012;60(25):2643–2650. | ||
Sutton-Tyrrell K, Newman A, Simonsick EM, et al. Aortic stiffness is associated with visceral adiposity in older adults enrolled in the study of health, aging, and body composition. Hypertension. 2001;38(3):429–433. | ||
Wildman RP, Mackey RH, Bostom A, Thompson T, Sutton-Tyrrell K. Measures of obesity are associated with vascular stiffness in young and older adults. Hypertension. 2003;42(4):468–473. | ||
Rider OJ, Tayal U, Francis JM, et al. The effect of obesity and weight loss on aortic pulse wave velocity as assessed by magnetic resonance imaging. Obesity (Silver Spring). 2010;18(12):2311–2316. | ||
Zebekakis PE, Nawrot T, Thijs L, et al. Obesity is associated with increased arterial stiffness from adolescence until old age. J Hypertens. 2005;23(10):1839–1846. | ||
Morse SA, Gulati R, Reisin E. The obesity paradox and cardiovascular disease. Curr Hypertens Rep. 2010;12(2):120–126. | ||
Cicoira M, Maggioni AP, Latini R, et al. Body mass index, prognosis, and mode of death in chronic heart failure: results from the Valsartan Heart Failure Trial. Eur J Heart Fail. 2006;9(4):397–402. | ||
Fonarow GC, Srikanthan P, Costanzo MR, Cintron GB, Lopatin M; ADHERE Scientific Advisory Committee and Investigators. An obesity paradox in acute heart failure: analysis of body mass index and inhospital mortality for 108,927 patients in the Acute Decompensated Heart Failure National Registry. Am Heart J. 2007;153(1):74–81. | ||
Wu AH, Eagle KA, Montgomery DG, Kline-Rogers E, Hu YC, Aaronson KD. Relation of body mass index to mortality after development of heart failure due to acute coronary syndrome. Am J Cardiol. 2009;103(12):1736–1740. | ||
Blüher M. The distinction of metabolically ‘healthy’ from ‘unhealthy’ obese individuals. Curr Opin Lipidol. 2010;21(1):38–43. | ||
Lavie CJ, Milani RV, Ventura HO. Obesity and cardiovascular disease: risk factor, paradox, and impact of weight loss. J Am Coll Cardiol. 2009;53(21):1925–1932. | ||
Anker S, Negassa A, Coats AJ, et al. Prognostic importance of weight loss in chronic heart failure and the effect of treatment with angiotensin-converting enzyme inhibitors: an observational study. Lancet. 2003;361(9363):1077–1083. | ||
Kalantar-Zadeh K, Block G, Horwich T, Fonarow GC. Reverse epidemiology of conventional cardiovascular risk factors in patients with chronic heart failure. J Am Coll Cardiol. 2004;43(8):1439–1444. | ||
Shiba T, Takahashi M, Yoshida I, Taniguchi H, Matsumoto T, Hori Y. Arteriosclerotic changes after intravitreal injections of anti-vascular endothelial growth factor drugs in patients with exudative age-related macular degeneration. Ophthalmologica. 2016;235(4):225–232. | ||
Saiki A, Olsson M, Jernås M, et al. Tenomodulin is highly expressed in adipose tissue, increased in obesity, and down-regulated during diet-induced weight loss. J Clin Endocrinol Metab. 2009;94(10):3987–3994. | ||
Senol-Cosar O, Flach RJ, DiStefano M, et al. Tenomodulin promotes human adipocyte differentiation and beneficial visceral adipose tissue expansion. Nat Commun. 2016;16(7):10686. | ||
Nagayama D, Saiki A, Endo K, et al. Improvement of cardio-ankle vascular index by glimepiride in type 2 diabetic patients. Int J Clin Pract. 2010;64(13):1796–1801. | ||
Nagayama D, Ohira M, Saiki A, Shirai K, Tatsuno I. Sarpogrelate hydrochloride decreases cardio-ankle vascular index accompanied by increased serum lipoprotein lipase mass in type 2 diabetic patients. Int Heart J. 2014;55(4):337–341. | ||
Ohira M, Yamaguchi T, Saiki A, et al. Pioglitazone improves the cardio-ankle vascular index in patients with type 2 diabetes mellitus treated with metformin. Diabetes Metab Syndr Obes. 2014;17(7):313–319. | ||
Pereg D, Lishner M. Bevacizumab treatment for cancer patients with cardiovascular disease: a double edged sword? Eur Heart J. 2008;29(19):2325–2326. | ||
Kramer CK, Zinman B, Retnakaran R. Are metabolically healthy overweight and obesity benign conditions? A systematic review and meta-analysis. Ann Intern Med. 2013;159(11):758–769. | ||
Kim HJ, Nam JS, Park JS, et al. Usefulness of brachial-ankle pulse wave velocity as a predictive marker of multiple coronary artery occlusive disease in Korean type 2 diabetes patients. Diabetes Res Clin Pract. 2009;85(1):30–34. | ||
Sugawara J, Hayashi K, Yokoi T, et al. Brachial-ankle pulse wave velocity: an index of central arterial stiffness? J Hum Hypertens. 2005;19(5):401–406. | ||
Wen W, Luo R, Tang X, et al. Age related progression of arterial stiffness and its elevated positive association with blood pressure in healthy people. Atherosclerosis. 2015;238(1):147–152. | ||
Kuo CF, See LC, Luo SF, et al. Gout: an independent risk factor for all-cause and cardiovascular mortality. Rheumatology (Oxford). 2010;49(1):141–146. |
 © 2016 The Author(s). This work is published and licensed by Dove Medical Press Limited. The full terms of this license are available at https://www.dovepress.com/terms.php and incorporate the Creative Commons Attribution - Non Commercial (unported, v3.0) License.
By accessing the work you hereby accept the Terms. Non-commercial uses of the work are permitted without any further permission from Dove Medical Press Limited, provided the work is properly attributed. For permission for commercial use of this work, please see paragraphs 4.2 and 5 of our Terms.
© 2016 The Author(s). This work is published and licensed by Dove Medical Press Limited. The full terms of this license are available at https://www.dovepress.com/terms.php and incorporate the Creative Commons Attribution - Non Commercial (unported, v3.0) License.
By accessing the work you hereby accept the Terms. Non-commercial uses of the work are permitted without any further permission from Dove Medical Press Limited, provided the work is properly attributed. For permission for commercial use of this work, please see paragraphs 4.2 and 5 of our Terms.