")
Back to Journals » Cancer Management and Research » Volume 12
Intratreatment Tumor Volume Change During Definitive Chemoradiotherapy is Predictive for Treatment Outcome of Patients with Esophageal Carcinoma
Authors Huang R , Guo H, Chen J, Zhai T, Chen J, Lin K, Chen Z, Li D , Chen C
Received 18 January 2020
Accepted for publication 13 July 2020
Published 18 August 2020 Volume 2020:12 Pages 7331—7339
DOI https://doi.org/10.2147/CMAR.S246500
Checked for plagiarism Yes
Review by Single anonymous peer review
Peer reviewer comments 3
Editor who approved publication: Professor Lu-Zhe Sun
Ruihong Huang,1 Hong Guo,1 Jianzhou Chen,1,2 Tiantian Zhai,1,3 Junwei Chen,4 Kun Lin,5 Zhijian Chen,6 Derui Li,1 Chuangzhen Chen1
1Department of Radiation Oncology, Cancer Hospital of Shantou University Medical College, Shantou, Guangdong 515031, People’s Republic of China; 2CRUK/MRC Oxford Institute for Radiation Oncology, University of Oxford, Oxford OX3 7DQ, UK; 3Department of Radiation Oncology, University Medical Center Groningen, University of Groningen, Groningen 9700 RB, the Netherlands; 4Department of Radiology, Cancer Hospital of Shantou University Medical College, Shantou, Guangdong 515031, People’s Republic of China; 5Department of Health Statistics, Shantou University Medical College, Shantou, Guangdong 515031, People’s Republic of China; 6Department of Radiation Oncology, University of Hong Kong-Shenzhen Hospital, Shenzhen, Guangdong 518053, People’s Republic of China
Correspondence: Chuangzhen Chen; Derui Li
Department of Radiation Oncology, Cancer Hospital of Shantou University Medical College, Shantou, Guangdong 515031, People’s Republic of China
Tel +86 8855 5844
Email [email protected]; [email protected]
Background: This study aimed to assess the predictive value of tumor volume changes of esophagus evaluated by serial computed tomography (CT) scans before, during, and after radical chemoradiotherapy (CRT) for treatment outcomes in patients with esophageal cancer (EC).
Methods: Fifty-three patients with histologically confirmed EC were included for analysis. Gross tumor volume of esophagus (GTVe) was manually contoured on the CT images before treatment, at a twentieth fraction of radiotherapy, at completion of CRT and three months after treatment. GTVe reduction ratio (RR) was calculated to reveal changes of tumor volume by time. The Kaplan–Meier method was used to estimate survival and for univariate analysis. The Cox regression model was performed for multivariate analysis.
Results: Predominant reduction of GTVe was observed during the first 20 fractions of radiotherapy. Age, pretreatment GTVe, GTVe three months after treatment and GTVe RR at twentieth fraction of radiotherapy were all significantly associated with overall survival (OS) in a univariate analysis. Gender was correlated with locoregional recurrence-free survival (LRRFS) in univariate analysis. Multivariate analysis showed that GTVe ≤ 20 cc, GTVe RR at twentieth fraction of radiotherapy ≥ 35% were positive predictive factors of OS and pretreatment GTVe ≤ 20 cc was prognostic for a favorable LRRFS.
Conclusion: Pretreatment tumor volume and intratreatment volume reduction ratio are reliable prognostic factors for esophageal cancer treated with definitive CRT.
Keywords: esophageal neoplasms, chemoradiotherapy, computed tomography, response evaluation, prognosis
Background
Esophageal cancer (EC) is one of the most common malignant tumors around the world. In China, it accounts for the fourth-leading overall cause of cancer deaths.1 About three-quarters of patients with esophageal cancer are not suitable for curative surgery because of broad tumor invasion or patients’ comorbidities. Concurrent chemoradiotherapy (CRT) is the standard care for nonsurgical candidates. However, long-term outcome for patients treated with CRT is poor, with five-year survival ranging from 20% to 40%. Therefore, it is of great value to classify patients as responders or nonresponders to CRT so that early intervention could be given to improve treatment outcomes. Pathological response was recognized as a reliable prognostic factor for patients treated with neoadjuvant CRT.2–4 Nevertheless, in cases of definitive CRT, response evaluation is still a difficult issue as pathological response could not be accurately determined without complete resection specimen.5 Though positron emission tomography-computed tomography(PET-CT) is promising in predicting treatment response after CRT by functionally evaluating metabolic activity of tumor,6–8 its application is limited in clinical practice as it is not readily available in primary health care institutes. Therefore, CT (computed tomography) is still the most commonly used imaging modality for response evaluation, especially in developing countries like China. Emerging evidence has proved that primary tumor volume was a prognostic factor for disease progression and survival in solid tumors, such as head and neck squamous cell carcinoma, lung cancer, and esophageal cancer.9–12 A larger GTV is inversely related to survival. Chen et al reported that patients with pretreatment gross tumor volume of esophagus (GTVe) ≦20cc had better survival than those with GTVe >20cc.13 Chen et al demonstrated similar results with a significant cut-off value of 39.41cm in 187 EC patients treated with definitive radiotherapy (IMRT).14 Boggs et al indicated that primary GTV of esophagus is a more powerful predictor of patient outcomes than traditional TNM staging and GTV >85cc and GTV>46 cc were correlated with an increased risk of local failure and distant failure respectively.15 Posttreatment GTVe is also found predictive for overall survival as those patients insensitive to CRT would have larger GTVe remaining after CRT.16 Volumetric measurements of tumor shrinkage of esophagus were also found to be correlated with pathological outcome and locoregional recurrence (LRR) in patients undergoing neoadjuvant CRT.17
However, the role of dynamic volume changes of esophageal tumor during and after definitive CRT in patients treated with radical CRT has not been studied before. A potential additional benefit of serial CT is the ability to view the ongoing response of the tumor to CRT, which allows physicians to adjust the treatment plan in time for those patients with modest response to treatment. The aim of this study is to investigate the relationship between volumetric comparison of esophageal cancer and prognosis.
Patients and Methods
Patients and Treatments
Our study is a correlative study with a single-arm, prospective phase II clinical trial “simultaneous modulated accelerated radiotherapy combined with chemotherapy for esophageal cancer” (clinical trial: NCT01670409) that commenced in Shantou University Medical College in August 2012. Major eligibility criteria included primary, pathologically confirmed esophageal squamous cell carcinoma without distant metastasis, unsuitable for surgery or patients who decline surgery. The study protocol has been previously published.18 All patients were treated with definitive CRT. Simultaneous modulated accelerated radiation therapy (SMART) technique was applied for EC patients to deliver a higher dose of 66 Gy to gross tumor volume and a lower dose of 54 Gy to subclinical tumor volume in 30 fractions. All patients received two cycles of concurrent chemotherapy and two cycles of adjuvant chemotherapy.
Tumor Volume Assessment
All the patients underwent CT exams before treatment, at twentieth fraction of radiotherapy, at completion of treatment and three months after treatment using CT simulator (PHILIPS Brilliance Big Bore CT, Amsterdam, Netherlands). Patients were given an intravenous injection of contrast agent iopromide (75 mL) and simulated in a supine position with the entire thorax from lower neck to upper abdomen scanned. After scanning, axial images were reconstructed in 3-mm thick slices. Pretreatment GTVe was manually contoured on the pretreatment CT images by an experienced radiation oncologist utilizing information provided by barium radiography, CT scan with contrast, PET and endoscopic ultrasound. Pretreatment GTVe on CT images included area where eccentric or circumferential esophageal wall thickening was greater than 5 mm. Empty cavity of esophagus was eradicated from GTVe when contoured. The cranial and caudal borders of GTVe contoured during and after treatment were consistent with those of pretreatment GTVe and the entire esophagus in between was delineated (Figure 1). GTVe on different CT images were all contoured by the same radiation oncologist to ensure consistency. The volume of GTVe was automatically measured by Eclipse 10.0 treatment planning system (Varian, CA, USA). GTVe reduction ratio (RR) compared with pretreatment GTVe was calculated to reveal changes of tumor volume by time, taking twentieth fraction of radiotherapy as example, RR=100×(pretreatment GTVe -GTVe at twenthieth fraction of radiotherapy)/pretreatment GTVe.
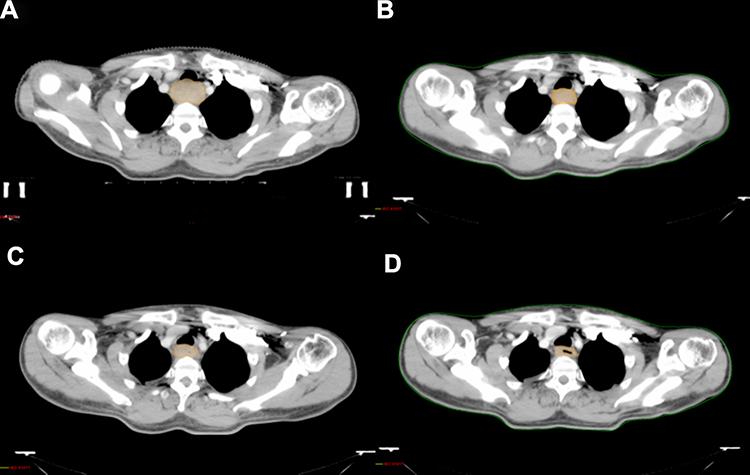 |
Figure 1 CT scans of a EC patient taken at separate time points, indicating continuous tumor shrinkage during and after treatment. (A) Before treatment; (B) twentieth fraction of radiotherapy; (C) at completion of treatment; (D) three months after treatment (scale 1: 6.2). |
All patients were followed-up every three months after completion of CRT for the first two years then every six months for three years.
Statistical Analysis
The primary endpoint was overall survival (OS), which was calculated from the date of treatment to the date of all-cause death or to the last day of follow-up. Secondary endpoint was locoregional recurrence free survival (LRRFS), defined as the interval between treatment and the earliest occurrence of disease progression resulting in LRR. We used repeated measures ANOVA (general linear model) to detect overall differences of GTVe at four separate time points (independent variable was time and level was four). Spearman bivariate analysis was used to reveal changes of GTVe by time of the whole group, with y variate referring to GTVe reduction ratio at three different time points of the whole cohort and X variate referring to time. Spearman coefficient (r) of every individual is calculated to show the trend of GTVe changes during and after treatment. We used the Kaplan–Meier method to estimate overall and LRRFS. Kaplan–Meier method was also applied for univariate analysis, with the Log rank test to ascertain significance. Prognostic factors with p<0.05 in univariate analysis, data of GTV and volume changes and other clinical characteristics which were reported closely related to prognosis were included in multivariate Cox proportional hazards models for further analysis. Considering the relatively small sample size, multivariate analysis was run twice for each time in which only five variates were included. And variates with p<0.05 were included for the final analysis. Significance was defined at a confidence level of p<0.05.
Results
The recruitment was completed in August 2015. Of all 87 patients, 53 (60.92%) patients underwent all four CT exams as designed and thus the CT scans of these patients were included for this analysis. Thirty-four patients were excluded because of missing tomographic exams as designed (20), disease progression (5), fail to follow adjuvant chemotherapy (3), esophageal fistula (2), death of esophageal hemorrhage (3) and death of noncancer related cause (1). Of all 53 patients, 41 were male, 12 were female, median age was 61 years old. Clinical characteristics were listed in Table 1. All the patients successfully received full dose radiotherapy and 45 (84.91%) patients completed full course chemotherapy. The last day of follow-up was August 15, 2018, the median follow-up was 44 months (5–67 months) for all patients. Prior to August 15, 2018, there had been 20 deaths. Locoregional failure remained the main reason of treatment failure. Thirteen patients (24.52%) had LRR and 11 (20.75%) had distant metastasis. The OS and LRRFS of three and five years of the entire cohort were 65.9% and 74.4%, 61.1%, and 74.4%, respectively.
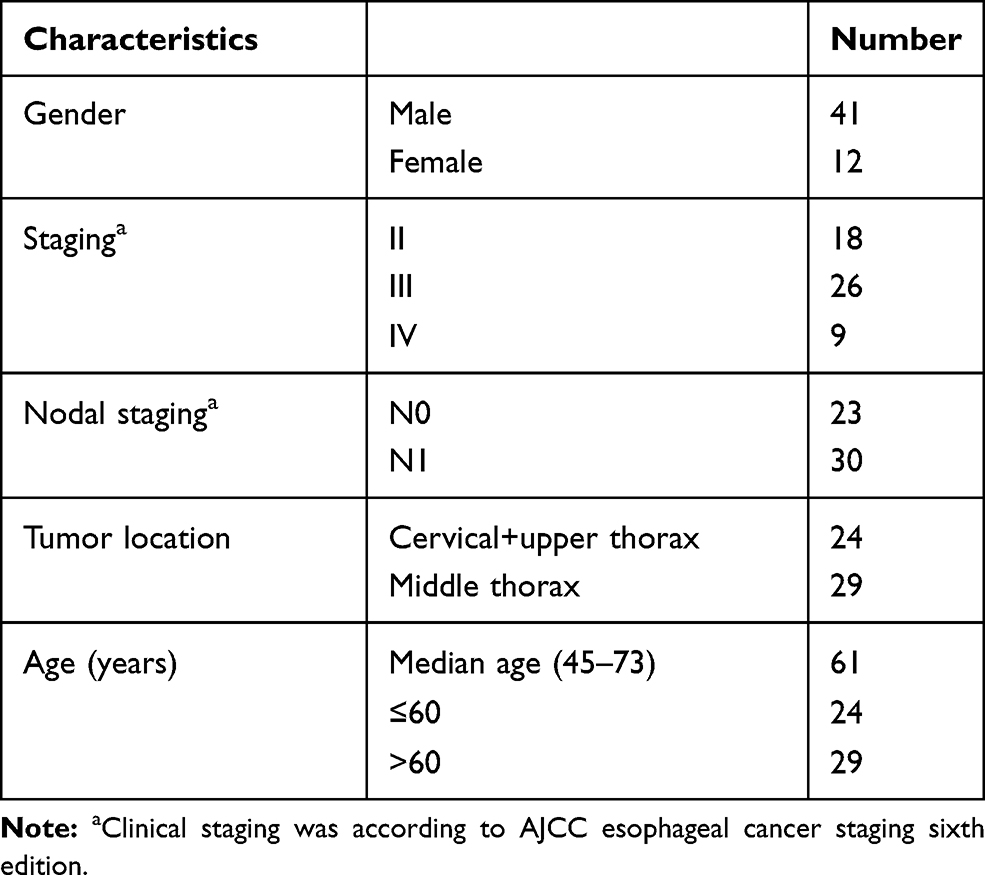 |
Table 1 Clinical Characteristics of Entire Cohort |
Repeated measures ANOVA was run and Mauchly’s sphericity test showed violation of sphericity (p<0.05). After Greenhouse–Geisser correction, F value was 40.652 (p=0.00 to F), indicating significant difference between tumor volumes at four separate time points. Further analysis revealed that pretreatment GTVe was statistically different from GTVe measured at other time points while difference between GTVe at twentieth fraction of radiotherapy, at completion of treatment and three months after treatment was not statistically significant, implying the most significant tumor regression occurred during radiotherapy. Data of GTVe values at separate time points were made spaghetti plot (Figure 2). Tumor shrinkage was seen mostly in the first 20 fractions of radiotherapy.
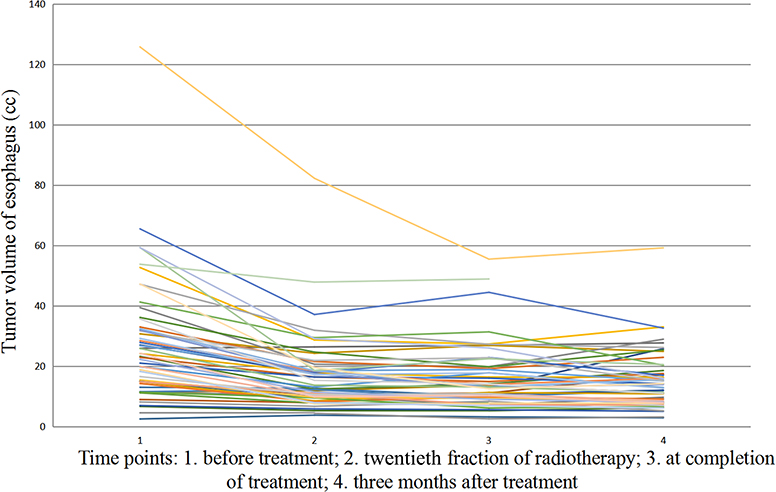 |
Figure 2 Spaghetti plot of GTVe during treatment course for 53 EC patients. |
GTVe and GTVe RR data at separate time points were listed in Table 2. Spearman coefficient (r) was 0.551 (p=0.00), meaning that tumor continued to shrink from commencement of treatment to three months after treatment.
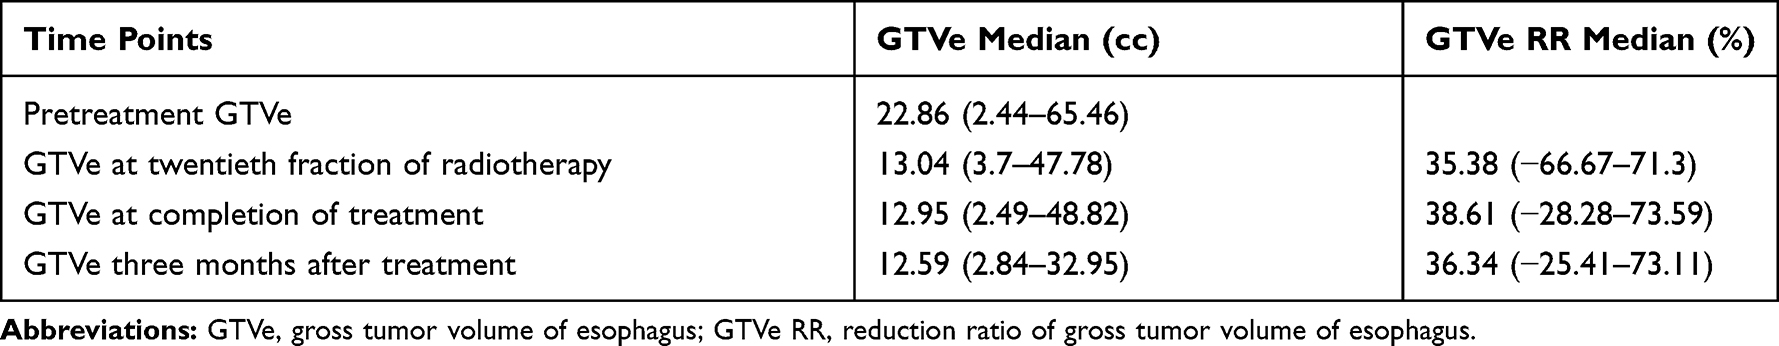 |
Table 2 GTVe and GTVe RR at Different Time Points |
Age (p=0.048), pretreatment GTVe (p=0.033), GTVe three months after treatment (p=0.005) and GTVe RR at twentieth fraction of radiotherapy (p=0.041) were all significantly associated with OS in univariate analysis. Gender (p=0.027) was correlated with LRRFS in univariate analysis. Multivariate analysis showed that pretreatment GTVe ≤22cc (p=0.006), GTVe RR at twentieth fraction of radiotherapy ≥35% (p=0.007) were positive predictive factors of OS. Patients with pretreatment GTVe ≤22 cc (p=0.040) had favorable LRRFS (Table 3, Figure 3).
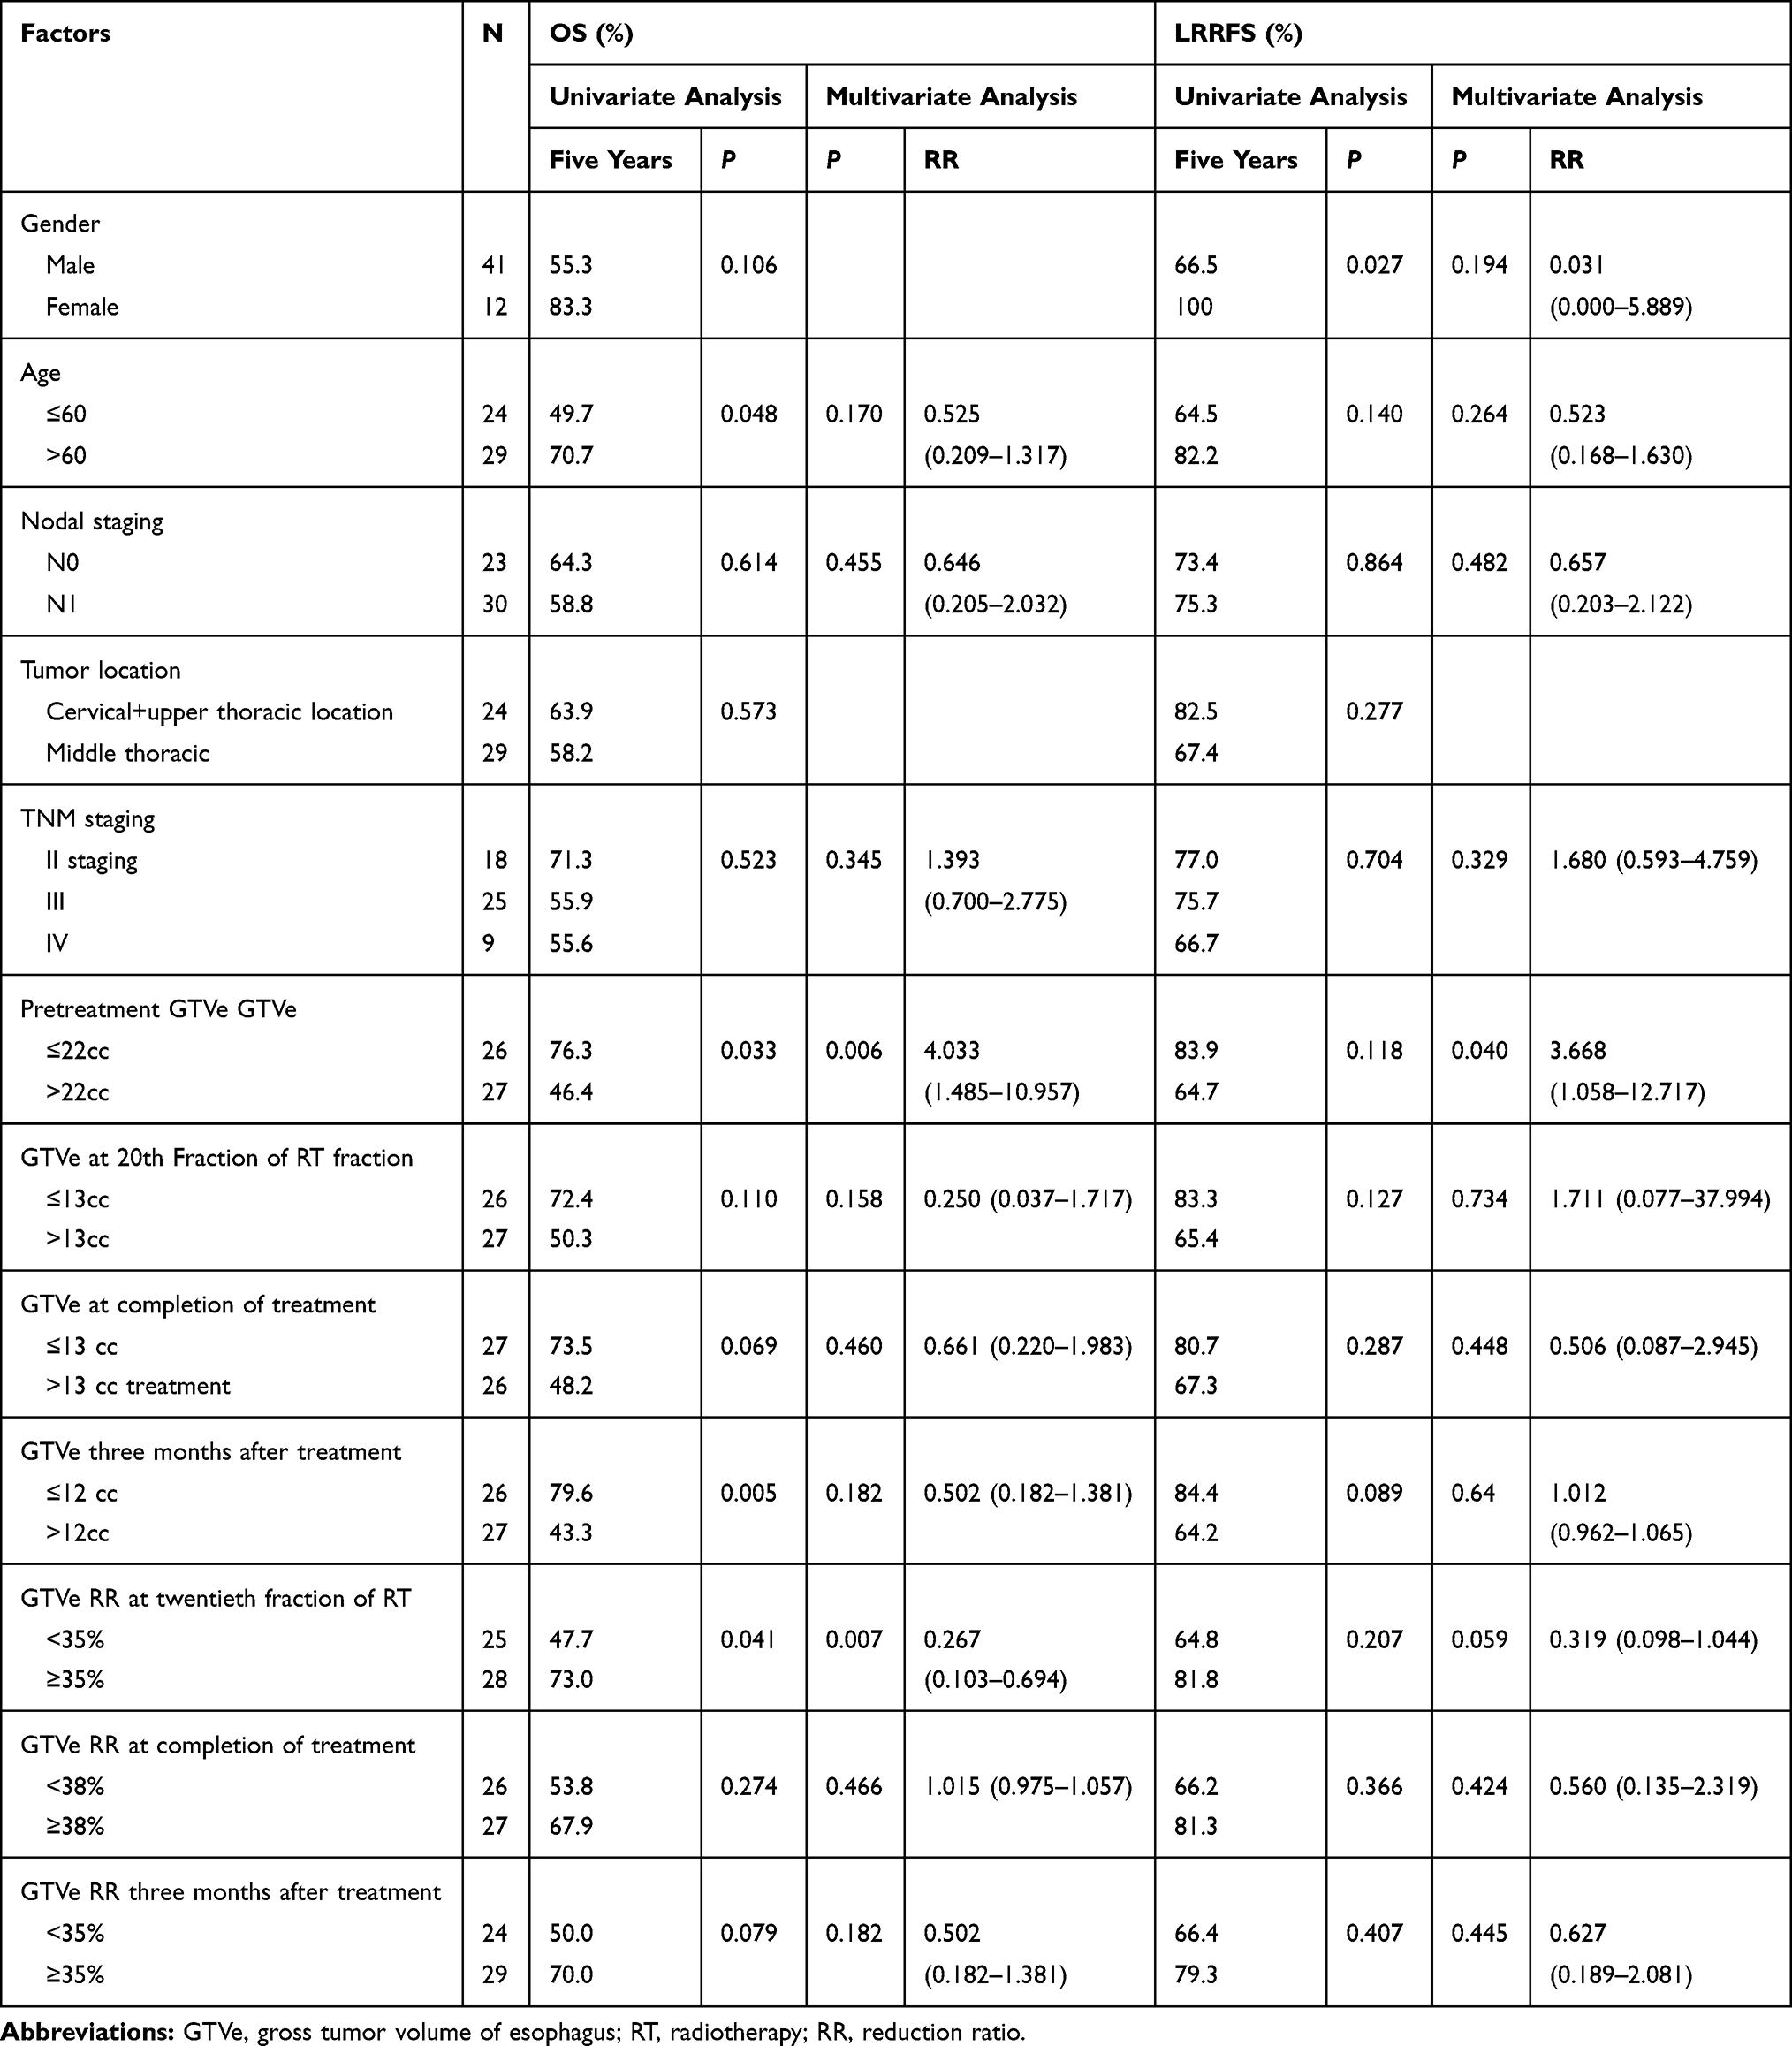 |
Table 3 Univariate and Multivariate Analyses of Factors Potentially Predicting for OS and LRRFS |
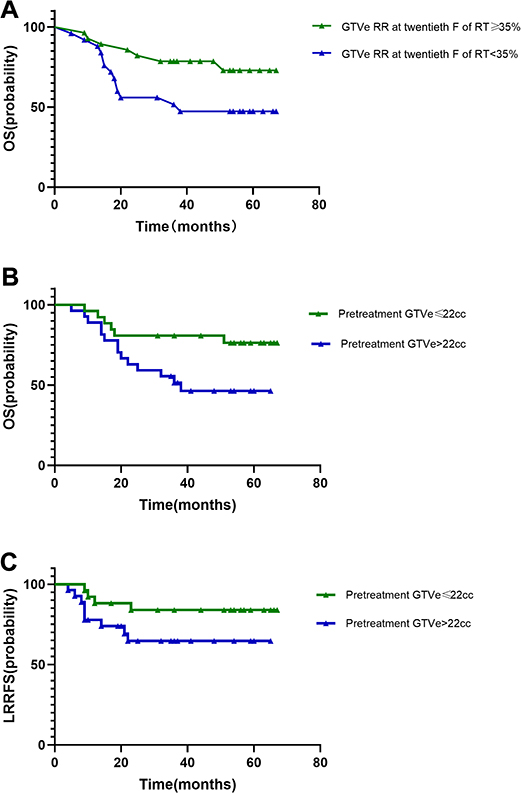 |
Figure 3 (A) Kaplan–Meier curve of five-year overall survival stratified by reduction ratio of tumor volume at twentieth fraction of radiotherapy in patients treated with definitive CRT, patients with GTVe RR ≥35% had longer five-year OS (73.0% vs 47.7%). (B) Five-year overall survival stratified by pretreatment GTVe, patients with pretreatment GTVe ≤22 cc had better five-year OS (76.3% vs 46.4%). (C) Five-year locoregional recurrence-free survival, pretreatment GTVe ≤22 cc had favorable five-year LRRFS (83.9% vs 64.7%). |
Discussion
In clinical practice, imaging based evaluation of response is of great importance. Response evaluation criteria in solid tumors (RECIST 1.1) is the most widely adopted tool for response assessment of cancer therapeutics.19 But it requires presence of measurable tumor lesions. As the RECIST guidelines caution, the primary lesion in the digestive tract is not a suitable measurable lesion in terms of reproducibility. In the case of EC, the longest diameter is difficult to define in repetitive measurements on CT images especially after radiotherapy. Maximal esophageal wall thickness had been utilized as substitute for longest diameter in a previous study by Li et al which showed that pre- and post-CRT maximal esophageal wall thicknesses were significantly correlated with pathological complete response, but no relationship between changes of esophageal wall thickness and survival was observed.20
Our finding is consistent with most published data that a larger GTVe is closely related to a worse treatment outcome. In our study, patients with GTVe ≤22 cc had significantly better five-year OS and LRRFS (76.3% and 83.9%) compared to those with GTVe >22 cc (46.4% and 64.7%).
Previous studies have reported that tumor volume changes during treatment on the basis of evaluation by imaging modalities like CT and magnetic resonance imaging (MRI) was correlated with survival in rectal cancer and non-small-cell lung cancer.12,21 The role of tumor volume changes in predicting treatment outcomes of esophageal cancer is still to be studied. Alfieri et al compared pre- and posttreatment tumor volumes and found that neither post-CRT tumor volume nor volume change were predictive of disease-free survival or overall survival though volumetric change seemed to be a moderate predictor of pathological T stage.16 A similar result was achieved by another research study conducted by van Heijl et al, in which serial CT before and after two weeks of neoadjuvant CRT was performed in patients with esophageal carcinoma treated with neoadjuvant CRT. There was no statistical significance in tumor volume change between histopathological responders and nonresponders. Tumor volume changes after 14 days of neoadjuvant CRT measured by 3D-CT were not associated with histopathological tumor response.22 However, Voncken et al analyzed relative tumor volume changes pretreatment and posttreatment in 56 EC patients. Their study revealed that relative tumor volume reduction following CRT was correlated with pCR, LRR, disease-free survival, and overall survival. The relative tumor reduction ≥20% was significantly correlated with a higher proportion of PCR and a longer LRR.17 Nevertheless, the aforementioned studies were performed in the neoadjuvant CRT setting.
To the best of our knowledge, our study was the first one to use serial CT scans for response evaluation for EC patients undergoing definitive CRT. There is no standard guideline for posttreatment tumor contouring. Regarding peritumoral edema, radiation-related fibrosis and inflammation after radiotherapy, esophageal wall thickness may not be an accurate reference. To better compare tumor volume changes with baseline data, we contoured GTVe during and after treatment between cranial and caudal borders of GTVe consistent with those on pretreatment CT images. This method could improve accuracy and reproducibility in measuring tumor volumes among different observers. It was also proved to be a reliable reflection of tumor burden. As seen on Figure 2, a linear reduction of GTVe in the first four weeks of CRT was observed in most patients. The five-year OS rates were 47.7% in patients with GTVe RR at twentieth fraction of radiotherapy <35% vs 73.0% in those with GTVe RR ≥35%. This result indicated that gross tumor volume reduction ratio is a promising parameter to differentiate responders from nonresponders to definitive CRT. The sensitivity to CRT may be predicted as early as at twentieth fraction of radiotherapy. Responders who would benefit most from CRT should continue planned therapy. But for nonresponders, early intervention should be taken to improve treatment outcomes, like surgery or changing adjuvant chemotherapy regimen. Since the publication of the CROSS study in 2012, neoadjuvant CRT followed by esophagectomy has become standard care of resectable locally advanced EC.23 Compared with the surgery alone group, patients who received multimodality therapy had significantly longer survival. Though many patients who received definitive CRT are not candidates for curative esophagectomy because of broad tumor invasion, tumor shrinkage after CRT may enable surgery and allow for adequate clean margins. Furthermore, the accumulative radiation dose of 20 fractions is close to the total dose of neoadjuvant CRT as in the CROSS study (41.4 Gy in 23 fractions). Thus, we suggest a CT exam at twentieth fraction of radiotherapy for tumor response assessment for all patients who underwent definitive CRT. If patients have GTVe RR <35%, reevaluating the feasibility of a curative or salvage surgery would be indicated.
There were some limitations of our study. Firstly, volume changes of lymph nodes were not involved in prognostic analysis because of a small percentage of patients with measurable lymph nodes in our study and low predicting rate of pathological lymph nodes with CT scanning alone.20,24 Another limitation is the relatively small number of study subjects as only 53 eligible patients were included for analysis. In our study, we took the median value of GTVe reduction ratios at twentieth fraction of radiotherapy fraction (35%) of the whole cohort as the cut-off value. Further research with bigger sample sizes are needed to determine an optimal cut-off value.
Despite the aforementioned limitations, our study proved that serial CT played an important role in response evaluation in EC patients undergoing definitive CRT. For health care institutes not equipped with PET-CT, tumor volume reduction ratio is a reliable parameter to recognize responders from nonresponders and further to guide clinical decision-making.
Data Sharing Statement
Derived data supporting the findings of this study are available from the corresponding author Chuangzhen Chen on request.
Ethics Approval and Informed Consent
Ethical approval for patient recruitment and data collection in our trial was approved by the Clinical Research Ethics Review Committee of Cancer Hospital of Shantou University Medical College (Approval No. 005). All patients in the trial provided written informed consent, and this trial was conducted in accordance with the Declaration of Helsinki.
Author Contributions
All authors made substantial contributions to conception and design, acquisition of data, or analysis and interpretation of data; took part in drafting the article or revising it critically for important intellectual content; gave final approval of the version to be published; and agree to be accountable for all aspects of the work.
Disclosure
The authors report no conflicts of interest in this work.
References
1. Chen W, Sun K, Zheng R, et al. Cancer incidence and mortality in China, 2014. Chin J Cancer Res. 2018;30(1):1–12. doi:10.21147/j.issn.1000-9604.2018.01.01
2. Soror T, Kho G, Zhao KL, Ismail M, Badakhshi H. Impact of pathological complete response following neoadjuvant chemoradiotherapy in esophageal cancer. J Thorac Dis. 2018;10(2072–1439(Print)):4069–4076. doi:10.21037/jtd.2018.06.85
3. Francoual J, Lebreton G, Bazille C, et al. Is pathological complete response after a trimodality therapy, a predictive factor of long-term survival in locally-advanced esophageal cancer? Results of a retrospective monocentric study. J Visc Surg. 2018;155(1878–7886(Electronic)):365–374. doi:10.1016/j.jviscsurg.2018.02.003
4. Berger AC, Farma JM, Scott WJ, et al. Complete response to neoadjuvant chemoradiotherapy in esophageal carcinoma is associated with significantly improved survival. J Clin Oncol. 2005;23(19):4330–4337. doi:10.1200/JCO.2005.05.017
5. Noordman BJ, Spaander MCW, Valkema R, et al. Detection of residual disease after neoadjuvant chemoradiotherapy for oesophageal cancer (preSANO): a prospective multicentre, diagnostic cohort study. Lancet Oncol. 2018;19(7):965–974. doi:10.1016/S1470-2045(18)30201-8
6. Tandberg DJ, Cui Y, Rushing CN, et al. Intratreatment response assessment with 18F-FDG PET: correlation of semiquantitative PET features with pathologic response of esophageal cancer to neoadjuvant chemoradiotherapy. Int J Radiat Oncol Biol Phys. 2018;102(4):1002–1007. doi:10.1016/j.ijrobp.2018.07.187
7. Hammoudi N, Hennequin C, Vercellino L, et al. Early metabolic response to chemoradiotherapy by interim FDG PET/CT is associated with better overall survival and histological response in esophageal cancers. Dig Liver Dis. 2018;51(1878–3562(Electronic)):887–893. doi:10.1016/j.dld.2018.12.006
8. Kim N, Cho H, Yun M, Park KR, Lee CG. Prognostic values of mid-radiotherapy (18)F-FDG PET/CT in patients with esophageal cancer. Radiation Oncology. 2019;14(1):27.
9. Mendenhall WM, Mancuso AA, Strojan P, et al. Impact of primary tumor volume on local control after definitive radiotherapy for head and neck cancer. Head Neck. 2014;36(9):1363–1367.
10. Strongin A, Yovino S, Taylor R, et al. Primary tumor volume is an important predictor of clinical outcomes among patients with locally advanced squamous cell cancer of the head and neck treated with definitive chemoradiotherapy. Int J Radiat Oncol Biol Phys. 2012;82(5):1823–1830. doi:10.1016/j.ijrobp.2010.10.053
11. Romesser PB, Qureshi MM, Subramaniam RM, et al. A prognostic volumetric threshold of gross tumor volume in head and neck cancer patients treated with radiotherapy. Am J Clin Oncol. 2014;37(2):154. doi:10.1097/COC.0b013e31826e04d6
12. Jabbour SK, Kim S, Haider SA, et al. Reduction in tumor volume by cone beam computed tomography predicts overall survival in non-small cell lung cancer treated with chemoradiation therapy. Int J Radiat Oncol Biol Phys. 2015;92(3):627–633. doi:10.1016/j.ijrobp.2015.02.017
13. Chen CZ, Chen JZ, Li DR, et al. Long-term outcomes and prognostic factors for patients with esophageal cancer following radiotherapy. World J Gastroenterol. 2013;19(10):1639–1644. doi:10.3748/wjg.v19.i10.1639
14. Chen Y, Zhang Z, Jiang G, Zhao K. Gross tumor volume is the prognostic factor for squamous cell esophageal cancer patients treated with definitive radiotherapy. J Thorac Dis. 2016;8(6):1155–1161. doi:10.21037/jtd.2016.04.08
15. Boggs DH, Hanna A, Burrows W, Horiba N, Suntharalingam M. Primary gross tumor volume is an important prognostic factor in locally advanced esophageal cancer patients treated with trimodality therapy. J Gastrointest Cancer. 2015;46(2):131–137. doi:10.1007/s12029-015-9699-y
16. Alfieri R, Pintacuda G, Cagol M, et al. Oesophageal cancer: assessment of tumour response to chemoradiotherapy with tridimensional CT. Radiol Med. 2015;120(5):430–439. doi:10.1007/s11547-014-0466-0
17. Voncken FEM, Jiang H, Kim J, et al. Degree of tumor shrinkage following neoadjuvant chemoradiotherapy: a potential predictor for complete pathological response in esophageal cancer? Dis Esophagus. 2014;27(6):552–559. doi:10.1111/j.1442-2050.2012.01445.x
18. Chen J, Guo H, Zhai T, et al. Radiation dose escalation by simultaneous modulated accelerated radiotherapy combined with chemotherapy for esophageal cancer: a phase II study. Oncotarget. 2016;7(16):22711–22719. doi:10.18632/oncotarget.8050
19. Eisenhauer EA, Therasse P, Bogaerts J, et al. New response evaluation criteria in solid tumours: revised RECIST guideline (version 1.1). Eur J Cancer. 2009;45(2):228–247. doi:10.1016/j.ejca.2008.10.026
20. Li S-H, Rau KM, Lu HI, et al. Pre-treatment maximal oesophageal wall thickness is independently associated with response to chemoradiotherapy in patients with T3–4 oesophageal squamous cell carcinoma. Eur J Cardiothorac Surg. 2012;42(6):958–964.
21. Kang J, Kim YC, Kim H, et al. Tumor volume changes assessed by three-dimensional magnetic resonance volumetry in rectal cancer patients after preoperative chemoradiation: the impact of the volume reduction ratio on the prediction of pathologic complete response. Int J Radiat Oncol Biol Phys. 2010;76(4):1018–1025. doi:10.1016/j.ijrobp.2009.03.066
22. Van Heijl M, Phoa SSKS, Van Berge Henegouwen M, et al. Accuracy and reproducibility of 3D-CT measurements for early response assessment of chemoradiotherapy in patients with oesophageal cancer. Eur J Surg Oncol. 2011;37(12):
23. Shapiro J, Van Lanschot JJB, Hulshof MCCM, et al. Neoadjuvant chemoradiotherapy plus surgery versus surgery alone for oesophageal or junctional cancer (CROSS): long-term results of a randomised controlled trial. Lancet Oncol. 2015;16(9):1090–1098. doi:10.1016/S1470-2045(15)00040-6
24. Wu AJ, Goodman KA. Clinical tools to predict outcomes in patients with esophageal cancer treated with definitive chemoradiation: are we there yet? J Gastrointest Oncol. 2014;6(1):53–59.
 © 2020 The Author(s). This work is published and licensed by Dove Medical Press Limited. The full terms of this license are available at https://www.dovepress.com/terms.php and incorporate the Creative Commons Attribution - Non Commercial (unported, v3.0) License.
By accessing the work you hereby accept the Terms. Non-commercial uses of the work are permitted without any further permission from Dove Medical Press Limited, provided the work is properly attributed. For permission for commercial use of this work, please see paragraphs 4.2 and 5 of our Terms.
© 2020 The Author(s). This work is published and licensed by Dove Medical Press Limited. The full terms of this license are available at https://www.dovepress.com/terms.php and incorporate the Creative Commons Attribution - Non Commercial (unported, v3.0) License.
By accessing the work you hereby accept the Terms. Non-commercial uses of the work are permitted without any further permission from Dove Medical Press Limited, provided the work is properly attributed. For permission for commercial use of this work, please see paragraphs 4.2 and 5 of our Terms.