")
Back to Journals » Clinical and Experimental Gastroenterology » Volume 13
Intraprocedural Transcatheter Intraarterial Perfusion (TRIP)-MRI for Evaluation of Irreversible Electroporation Therapy Response in a Rabbit Liver Tumor Model
Authors Shangguan AJ, Zhou K, Yang J , Eresen A , Wang B, Sun C, Pan L, Hu S, Khan AT, Mouli SK, Yaghmai V, Zhang Z
Received 4 July 2020
Accepted for publication 24 September 2020
Published 6 November 2020 Volume 2020:13 Pages 543—553
DOI https://doi.org/10.2147/CEG.S269163
Checked for plagiarism Yes
Review by Single anonymous peer review
Peer reviewer comments 2
Editor who approved publication: Professor Wing-Kin Syn
Anna J Shangguan,1,* Kang Zhou,2,* Jia Yang,1 Aydin Eresen,1 Bin Wang,3 Chong Sun,4 Liang Pan,5 Su Hu,6 Ali T Khan,1 Samdeep K Mouli,1 Vahid Yaghmai,7 Zhuoli Zhang1
1Department of Radiology, Feinberg School of Medicine, Northwestern University, Chicago, IL, USA; 2Department of Radiology, Peking Union Medical College Hospital, Peking Union Medical College, Beijing, People’s Republic of China; 3Department of General Surgery, Nanfang Hospital, Southern Medical University, Guangdong Provincial Engineering Technology Research Center of Minimally Invasive Surgery, Guangzhou, People’s Republic of China; 4Department of Orthopedics, Affiliated Hospital of Qingdao University, Qingdao, Shandong, People’s Republic of China; 5Department of Radiology, Third Affiliated Hospital of Suzhou University, Changzhou, Jiangsu, People’s Republic of China; 6Department of Radiology, First Affiliated Hospital of Soochow University, Suzhou, Jiangsu, People’s Republic of China; 7Department of Radiological Sciences, School of Medicine, University of California Irvine, Irvine, CA, USA
*These authors contributed equally to this work
Correspondence: Zhuoli Zhang
Department of Radiology, Northwestern University, 737 N Michigan Ave, 16 th Floor, Chicago, IL 60611, USA
Tel +1 312 695 5753
Fax +1 312 926 5991
Email [email protected]
Purpose: Irreversible electroporation (IRE) is a promising new ablation method for hepatocellular carcinoma (HCC) treatment with few side-effects; however, tissue perfusion and differentiation between treatment zones have not been sufficiently studied. In this project, we analyzed HCC tumor perfusion changes immediately after IRE treatment using transcatheter intraarterial perfusion (TRIP)-MRI to monitor treatment zone margins.
Materials and Methods: All protocols were approved by the institutional animal care and use committee. A total of 34 rabbits were used for this prospective study: tumor liver group (n=17), normal liver group (n=14), and 3 for growing VX2 tumors. All procedures and imaging were performed under anesthesia. VX2 tumors were grown by injection of VX2 cells into rabbit hindlimbs. Liver tumors were induced by percutaneous US-guided injection of VX2 tumor fragments into liver. For digital subtraction angiography (DSA), a 2F catheter was advanced through left hepatic artery via femoral artery access, followed by contrast injection. All rabbits underwent baseline anatomic MRI, then IRE procedure or IRE probe placement only, and lastly post-procedure anatomic and TRIP-MRI. Liver tissues were dissected immediately after imaging for histology. All statistical analyses were performed on GraphPad Prism, with P< 0.05 considered significant.
Results: IRE generated central IRE zone and peripheral reversible electroporation (RE) zone on anatomic MRI for both normal liver and liver tumor tissues. The semiquantitative analysis showed that IRE zone had the lowest AUC, PE, WIS, Ktrans, ve, and vp as well as the highest TTP, followed by RE zone, then untreated tissues. Receiver operating characteristic analysis showed that WIS and AUC60 had the highest AUCROC. Histologic analysis showed a positive correlation in viable area fraction between MRI and histologic measurements. IRE zone had the highest %apoptosis and lowest CD31+ staining.
Conclusion: Our results demonstrated that intraprocedural TRIP-MRI can effectively differentiate IRE and RE zones after IRE ablation in normal liver and liver tumor tissues.
Keywords: hepatocellular carcinoma, irreversible electroporation, liver cancer, perfusion, transcatheter intraarterial perfusion magnetic resonance imaging
Introduction
Hepatocellular carcinoma (HCC) is the sixth most common and fourth leading cause of cancer-related deaths worldwide.1 Many treatments currently exist for HCC, including surgical resection and transplantation, locoregional ablation, multikinase inhibitors, and chemotherapy.2–4 Among these, locoregional ablation offers a minimally invasive treatment option for patients not amenable to surgical methods and may be curative in early-stage disease.5
Irreversible electroporation (IRE) is a locoregional ablation technique that delivers electrical currents to targeted tissues, creating nanopores in the cell membrane and causing cellular damage.6 IRE causes two ablation zones: central IRE zone with permanent nanopores and complete cell death and peripheral reversible electroporation (RE) zone with transient nanopores and mostly cell swelling.7 IRE technique demonstrated promising results in early-stage HCC, lacked heat sink effects, and preserved healthy adjacent tissues.8–10 Additionally, IRE generates clear treatment margins that can be identified by imaging.9,11 Although boundaries between treated and untreated tissues are well defined, boundaries between IRE and RE zones have not been studied. As IRE and RE zones differ with respect to cell apoptosis, a clear delineation between IRE and RE zones is crucial for effective treatment and recurrence after the IRE ablation method. Moreover, blood vessels may remain undamaged in treated tissues due to the protective effects of collagen in the extracellular matrix.12,13 Investigating perfusion and its impact on recovery in treated HCC tissues soon after IRE is of importance.
IRE may be monitored perioperatively using a variety of imaging modalities, including MRI, CT, and ultrasound (US).14,15 While MRI and other imaging modalities have been used for differentiating treated and untreated tissues, a few studies focused on margins between treatment zones. Granata et al inspected the data acquired from MRI, CT, and contrast-enhanced (CE) US evaluated longitudinally for assessment of treatment response to IRE in HCC patients.14 Besides, Vroomen et al observed distinctive MRI signal changes in both CE-MRI and diffusion-weighted MRI images after IRE procedure in pancreatic cancer patients.15 However, functional changes in tissue perfusion after IRE treatment have not been studied.7,16,17 Transcatheter intraarterial perfusion (TRIP)-MRI is a well-established technique for functional evaluation of tissue perfusion changes by injecting small doses of contrast to supplying blood vessels.18,19 Liver tissue perfusion changes have been evaluated before by traditional intravenous methods, but TRIP-MRI allows continuous iterative imaging at higher spatial and temporal resolutions than conventional perfusion MRI using IV contrast injection.19 TRIP-MRI has also been previously used to evaluate liver perfusion changes after other locoregional approaches.7
In this project, we aimed to study normal liver and liver tumor perfusion changes immediately after IRE ablation using intraprocedural TRIP-MRI and investigate intraprocedural TRIP-MRI as a potential method to monitor of treatment zone margins immediately after IRE procedure.
Materials and Methods
Experimental Overview
All studies were approved by the institutional animal use and care committee of Northwestern University by following Guide for the Care and Use of Laboratory Animals: Eighth Edition.20 A total of 31 New Zealand white rabbits (Covance, Denver, PA) were randomly assigned to IRE treatment of normal liver tissue (n=14) or IRE treatment of liver tumor tissue (n=17).
Animal Methods
Anesthesia was induced by bolus intramuscular injection of ketamine (100 mg/kg) and xylazine (5 mg/kg) and maintained by inhalation of isoflurane (2–3% isoflurane in oxygen) during all procedures and imaging. For donor tumors, VX2 tumor cells were injected into hind limbs of tumor donor NZW rabbits (n=3) under anesthesia and harvested when reaching 1 cm in diameter. For liver tumor implantation, small pieces (around 1 mm3) of VX2 tumors were percutaneously injected into the liver via ultrasound guidance. The tumors were allowed to reach the size of at least 10 mm in the longest diameter on T2w images by weekly MRI experiments after tumor implantation.
Digital Subtraction Angiography (DSA)
DSA was performed using a C-arm unit (PowerMobil; Siemens Medical Solutions, Erlangen, Germany) and enhanced with iohexol (Omnipaque 350; Amersham, Princeton, NJ). The femoral artery was accessed, and a 2F catheter was advanced into hepatic arteries (K.Z., >10 years of experience). The DSA was conducted within 5 minutes after IRE procedure.
IRE Protocol
IRE was performed using a square-wave generator (ECM830; BTX-Harvard Apparatus, Holliston, MA). Following catheterization of hepatic arteries with DSA, a midline laparotomy was performed, and two paralleled MRI-compatible needle electrodes with 1 cm spacing (platinum-iridium materials; Microprobes, Gaithersburg, MD) were inserted into the left median lobe in the normal liver group or into the liver tumor (C.S. and B.W. both with 2 years of experience). IRE procedure was performed on all animals using pre-determined parameters, 10 pulses (2000 V, 100 μs duration, 100 ms between pulses).17,21–25
MRI Methods
Following baseline MRI scans, the IRE procedure was performed. Post-IRE anatomical MRI acquisition was performed immediately after closing the abdominal incision approximately 20 min after post-IRE procedure. Multi-modality MRI data were acquired using a 3T MRI scanner (MAGNETOM Skyra; Siemens Medical Solutions, Erlangen, Germany) with a 15-channel knee coil. All rabbits underwent baseline anatomic MRI, then IRE procedure, and intraprocedural TRIP-MRI and repeated anatomic MRI. The acquisition parameters are listed in Table 1. Intraprocedural TRIP-MRI volumes were acquired every 2.6 s for a total of 11 min 40 s (250 volumes). One minute after initiating TRIP-MRI, gadopentetate dimeglumine (3 mL, 5%, Magnevist; Berlex, Wayne, NJ) was manually injected via intraartery catheter over 6 s followed by 3 mL saline flush at the same flow rate.
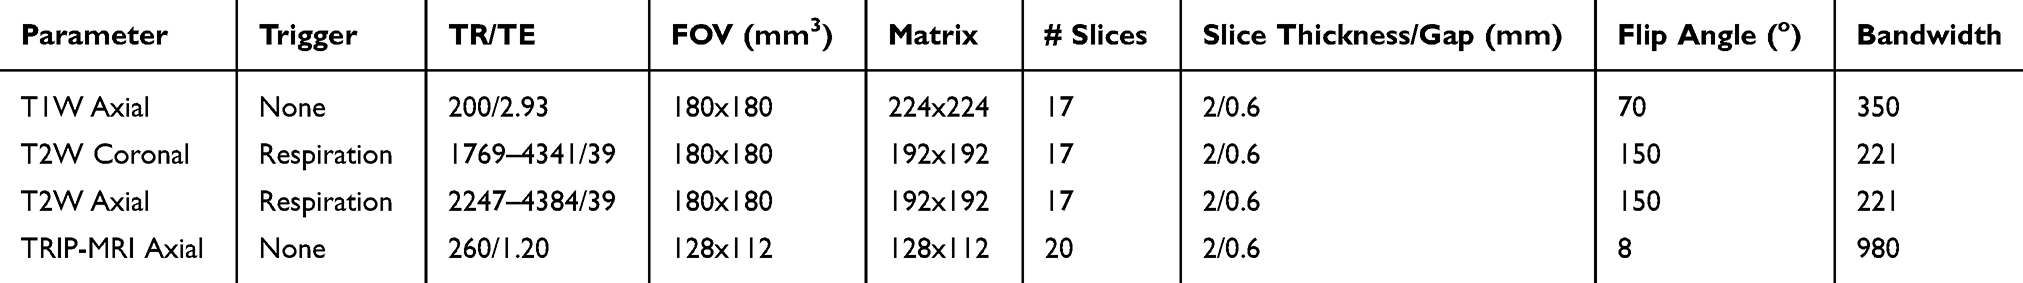 |
Table 1 MRI Acquisition Parameters |
Histologic Analysis
Rabbits were euthanized immediately after MRI acquisition to obtain liver tissues for histological examination. Liver tissue with the ablated region was sectioned along with an orientation parallel to the electrode array for staining with hematoxylin-eosin (HE) and terminal deoxynucleotidyl transferase dUTP nick end labeling (TUNEL). The RE and IRE zones were identified on HE-stained slices. Using HE slices, IRE zone is defined by the percentage of the necrotic area, while RE zone is measured by a mixed area with apoptotic cells and normal cells. The number of cells staining positively on TUNEL sections was counted in randomly chosen 10 fields from IRE, RE, and normal tissue sections at 200x magnification. The apoptosis index was calculated as the number of positively stained cells divided by the total number of cells in the field. The viable area fraction was calculated from the RE zone area divided by the IRE zone area from a single slice.
Imaging Analysis
All MR images were analyzed by radiologists with more than 5 years of experience (L.P. and S.H.) using Jim (version 7.0, Xinapse Systems, Essex, UK). For semi-quantitative analysis, three regions of interest (ROIs) encompassing either the IRE zone, RE zone, or untreated tissues were drawn on a single section parallel to the electrode array using post-contrast T1w images as reference. IRE zone was identified as the central hypointense zone, and the RE zone was identified as the hyperintense rim surrounding the IRE zone. A time–intensity curve (TIC) was generated for each ROI. The area under the curve (AUC) at 30, 60, 90, 120, 150, and 180 s after contrast arrival at the tissue and peak enhancement (PE), time to peak (TTP), and wash-in slope (WIS) were calculated for each TIC. PE was defined as the difference between the maximal signal and the average baseline signal. TTP was the time from contrast arrival to time at the maximum signal. WIS was calculated by dividing TTP from PE. For quantitative analysis, we used a widely used pharmacokinetic modeling approach, the extended Tofts model, which includes intravascular contribution into account during the processing of the contrast-enhanced MRI data.26 In extended Tofts modeling, the pharmacokinetic parameters were computed by solving the following equation 1,
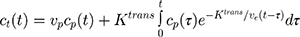
where ct(t) and cp(t) are the concentration–time curves in the tissue of interest and the plasma space, vp is the volume fraction of the plasma of a feeding artery, Ktrans is the volume transfer constant between plasma and extravascular-extracellular space (EES), ve represents the EES volume fraction, and vp is the blood plasma fraction. In our experiments, we have used Jim software (version 7.0, Xinapse Systems, Essex, UK) to compute the quantitative values of Ktrans, ve, and vp maps.27,28 The ROIs were used to measure the mean values of these perfusion parameters.
Statistical Analysis
Statistical analysis was performed using GraphPad Prism (v8.0.1, GraphPad Software, La Jolla, CA). Kruskal–Wallis test was used to compare differences in apoptosis, multivessel density (MVD), semiquantitative, and quantitative imaging parameters among IRE zone, RE zone, and untreated tissues. Multiple T-tests were used to compare differences in apoptosis and intraprocedural TRIP-MRI parameters between normal liver and liver tumor tissues. Receiver operating characteristic (ROC) analysis was used to assess the diagnostic performances of intraprocedural TRIP-MRI parameters. P<0.05 was considered statistically significant for all statistical analyses.
Results
DSA Imaging
DSA of liver tumors before and after IRE are shown in Figure 1. Before IRE, left hepatic angiography demonstrated tumor hypervascularity in the left hepatic lobes. Following IRE, the treated tumor is no longer visible on angiography, suggesting the destruction of tumor vascular supply. The untreated tumor did not demonstrate angiographic changes.
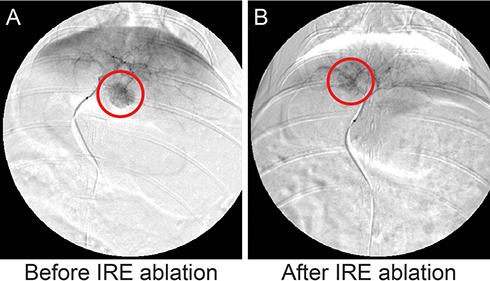 |
Figure 1 DSA images of rabbit models with VX2 tumors before (A) and after (B) IRE. A 2F catheter was advanced to the left hepatic artery via guidewire, followed by the delivery of the iodinated contrast agent. |
MR Imaging
Figure 2 shows representative anatomic MR images of both normal liver and liver tumor tissues before and after IRE treatment as well as corresponding AUCs. After IRE treatment, the treated tissue demonstrated a marked signal heterogeneity compared to untreated tissues (Figure 2A). On semiquantitative analysis, the untreated tissues had the highest AUC at 30, 60, 90, 120, 150, and 180 s after contrast arrival, followed by the RE zone, and then by the IRE zone (Figure 2B, P<0.05). For liver tumor tissues, the tumor is hyperintense on T2w images and hypointense on T1w images compared with untreated tissues (Figure 2C). After IRE, tumor and treated tissues were heterogeneous with a central hypointense region and a peripheral hyperintense region, like healthy liver tissues (Figure 2C). Consistently, the IRE zone had the lowest AUC at all time points after contrast arrival, followed by the RE zone, and then untreated tissue (Figure 2D, P<0.05).
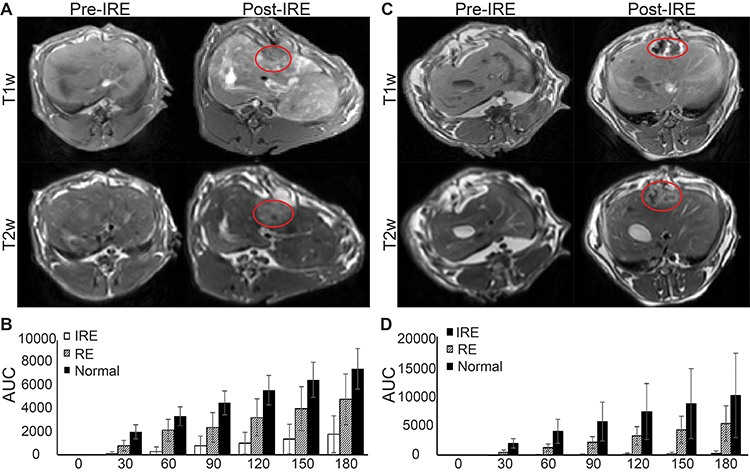 |
Figure 2 MRI of normal liver and liver tumor tissues before and after IRE treatment and AUC analysis. (A) Representative T1w and T2w images of normal liver tissues before and approximately 20 min after IRE procedure. (B) AUC analysis of normal liver tissue TRIP-MRI after IRE. A significant difference was found between AUC among IRE zone, RE zone, and untreated tissues at 30–180s after contrast arrival (P<0.05). (C) Representative T1w and T2w images of liver tumor tissues before and approximately 20 min after IRE procedure. (D) AUC analysis of liver tumor tissue TRIP-MRI after IRE. A significant difference was found between AUC among IRE zone, RE zone, and untreated tissues at 30–180s after contrast arrival (P<0.05). Red lines enclose margins of IRE treatment. |
Quantitative maps of Ktrans, ve, and vp for both normal liver and tumor tissues overlaid on T1w images as well as quantitative measurements of Ktrans, ve, and vp are shown in Figure 3. For both normal liver and liver tumor tissues, IRE treated tissue had a central hypointense zone and a peripheral zone with an increased signal. Quantitatively, both IRE and RE zones had decreased average Ktrans, ve, and vp compared with untreated tissues (P<0.05). For liver tumor tissues, the IRE zone had significantly decreased Ktrans, ve, and vp compared with the RE zone (P<0.05). On average, the IRE treated regions had the lowest (P<0.05) Ktrans (0.1088), ve (5.878), and vp (1.144), followed by the RE zones (1.295 for Ktrans, 33.86 for ve, and 6.066 for vp), and then by the untreated tissues (2.560 for Ktrans, 33.86 for ve, and 8.907 for vp).
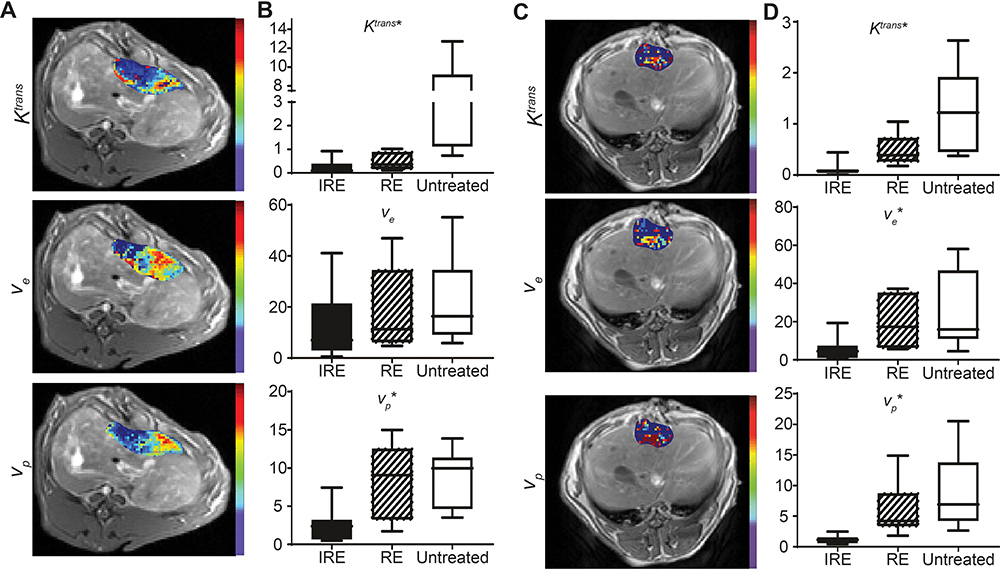 |
Figure 3 Quantitative analysis of normal liver and liver tumor TRIP-MRI after IRE. (A) Representative Ktrans, ve, and vp maps of IRE treated normal liver tumor overlaid on corresponding T1w images. (B, D) Ktrans, ve, and vp intensities in each of the treatment regions of normal liver and liver tumor, respectively. (C) Representative Ktrans, ve, and vp maps of IRE treated liver tumor overlaid on corresponding T1w images. |
PE, TTP, and WIS of all regions of the normal liver after IRE are shown in Table 2. The untreated tissues significantly (P<0.05) had the greatest PE (77.31) and WIS (0.6596), followed by the RE zone (41.63 for PE, 0.6596 for WIS), and then by the IRE zone (17.93 for PE, 0.06684 for WIS). The IRE zone demonstrated the greatest TTP (255.5), followed by the RE zone (73.16), and then by untreated normal tissues (17.23, P<0.05). PE, TTP, and WIS of all regions of the liver tumors are shown in Table 2. For tumor tissues, the IRE zone also had the highest TTP (297.4), followed by the RE zone (93.6) and untreated tissues (30.71). Similarly, tumor tissue IRE zone had the lowest PE (11.91) and WIS (0.03991), followed by the RE zone (56.58 for PE and 0.8533 for WIS), and then by the untreated tissues (97.19 for PE and 3.976 for WIS, P<0.05 for all).
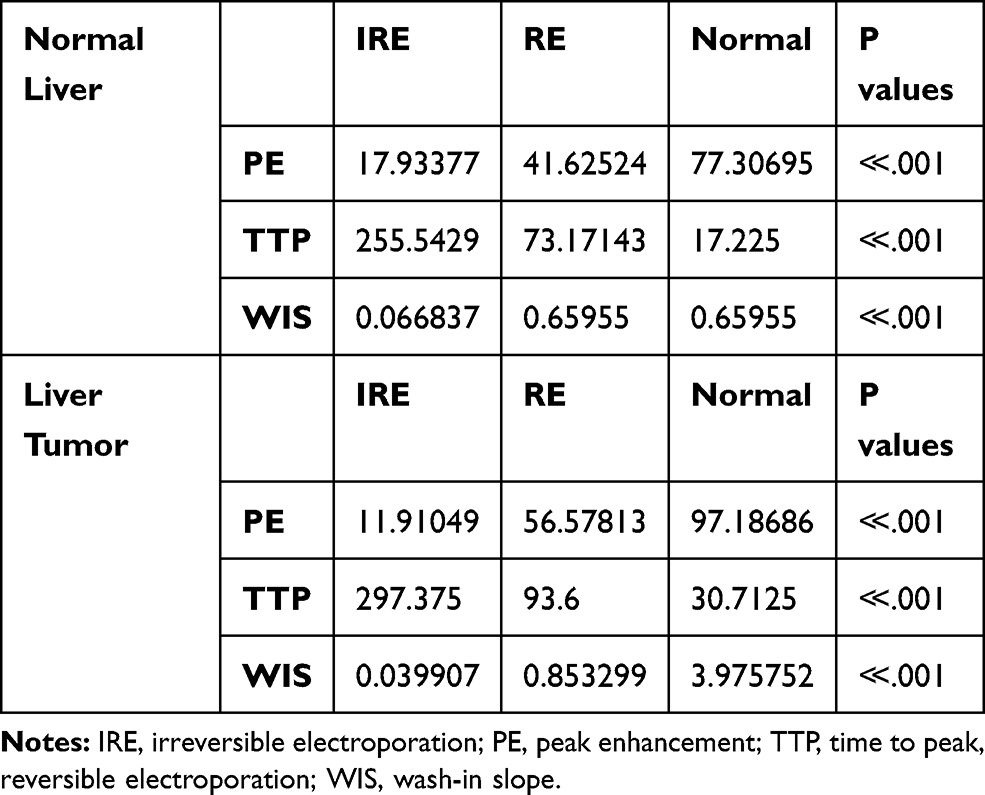 |
Table 2 Semiquantitative Measurements of Tissue Perfusion After IRE in Normal Liver and Liver Tumor Tissues |
Figure 4 shows the average % differences of each intraprocedural TRIP-MRI measurement in each treatment zone and tissue group from average intraprocedural TRIP-MRI values in each treatment zone. Supplementary Tables 1–3 show the comparison between normal liver and tumor tissues of the average values of each TRIP-MRI measurement in each treatment zone. No significant differences were found between average values of percent differences between normal liver and liver tumor tissues, suggesting similar tissue responses between normal liver and liver tumor tissues.
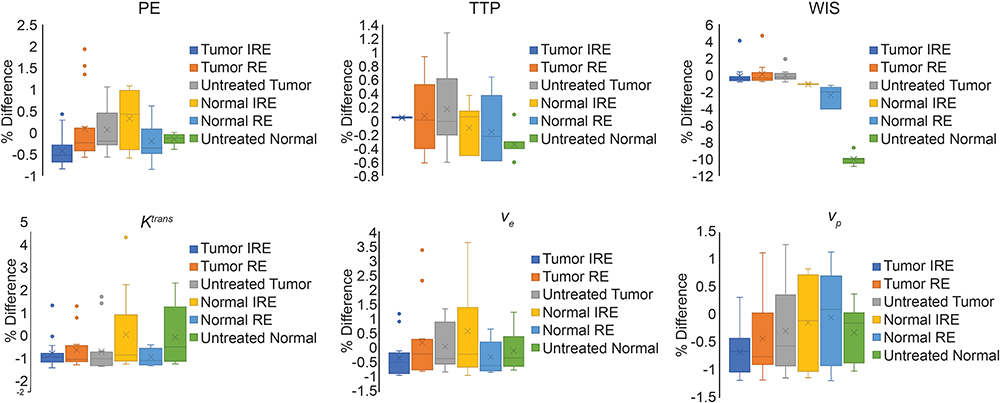 |
Figure 4 Percent difference from average measurement within each treatment zone and each MR measurement. Average MR measurement values were obtained by pooling the same MR measurement (eg TTP, WIS, Ktrans) within the same treatment zone. Percent difference was the difference between each MR measurement and the average MR measurement within the same treatment zone and then averaged across all animals within the same group (normal liver vs liver tumor). |
Semiquantitative (WIS, AUC60, AUC90, AUC120, and AUC150) and quantitative intraprocedural TRIP-MRI parameters were chosen for ROC analysis and displayed in Table 3. AUC of ROC (AUCROC) of the parameters ranged from 0.90 to 0.99. The parameters with the highest AUCs are WIS and AUC60. WIS had a cut-off value of 0.1057, sensitivity of 93.75%, and specificity of 100%. AUC60 had a cut-off value of 436.9, sensitivity of 93.33%, and specificity of 100%.
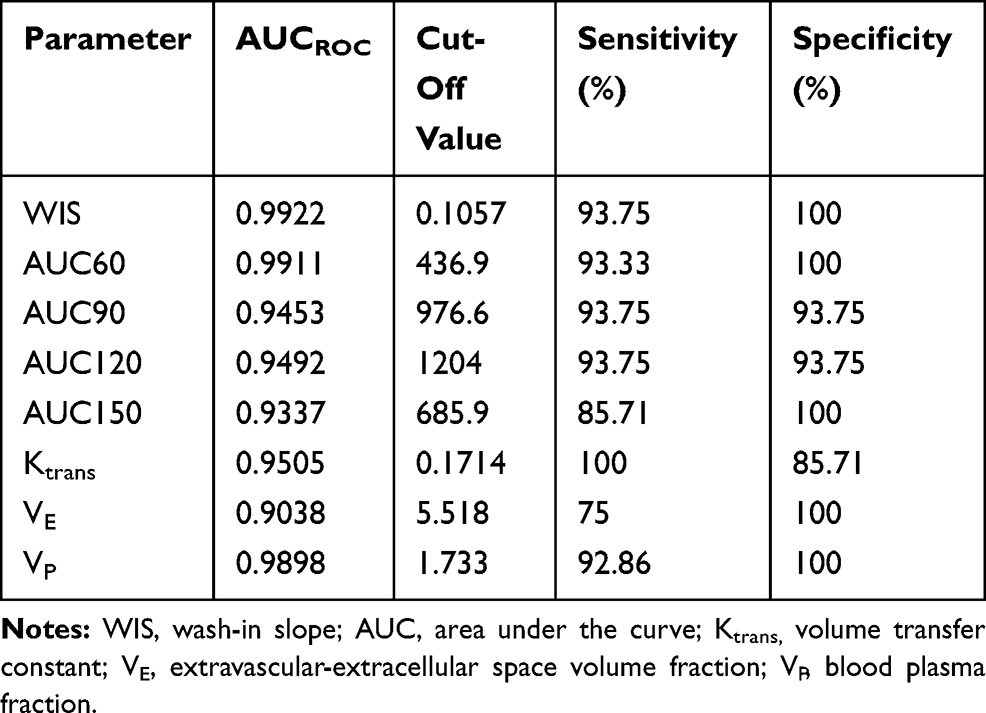 |
Table 3 Summary of Receiver Operating Characteristics (ROC) Curve Analysis |
Histologic Findings
Representative HE-stained images of treated tissues with corresponding MRI images are shown in Figure 5. IRE zone cells in both normal liver and liver tumor tissues showed significant cell necrosis with karyorrhexis and pyknosis. In the peripheral RE zones of both normal and liver tumor tissues, cells displayed swelling with sinusoidal congestion. Distinct boundaries and treatment margins were observed between treated and untreated tissues and between IRE and RE zones. IRE and RE zones were labeled in both histology slides and corresponding slice T1w MRI anatomic images (Figure 5A and B). Viable area fraction (VAF) was measured using histology and compared between normal liver and liver tumor tissues (Figure 5C). No significant differences were found between VAF in tumor tissues versus normal tissues. VAF was also measured using MR images and compared with histologic measurements (Figure 5D). A significant positive correlation was found between histology-based ratios and MRI-based ratios (R2=0.824, P<0.001).
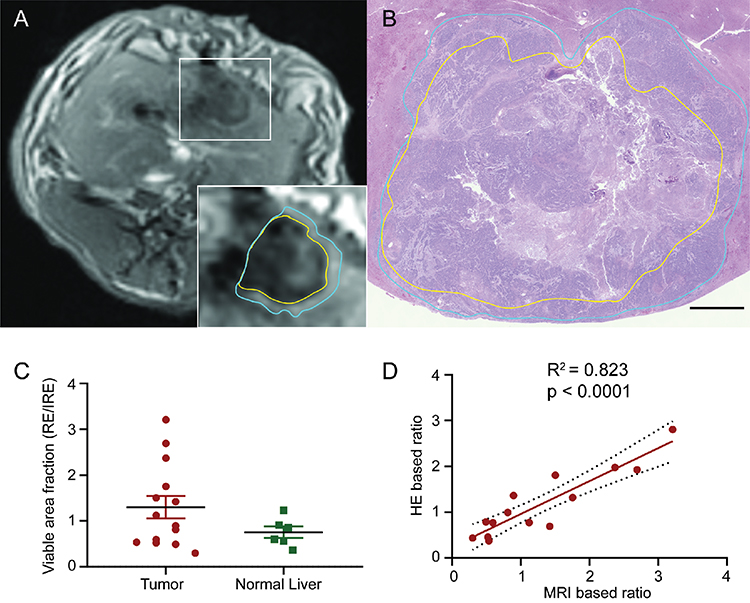 |
Figure 5 Comparison of IRE treatment zones on MRI and histology. (A) Representative T1w axial image of IRE treated tissues. The yellow border represents the central IRE zone and blue border represents the peripheral RE zone. (B) Representative HE-stained histologic section of IRE treatment tissues at a section correlating with the section in A. The yellow border represents the central IRE zone and blue border represents the peripheral RE zone. (C) Histology-based viable area fraction of IRE treated tissues, calculated as RE zone area divided by IRE zone area. No significant difference was found between tumor and normal liver VAFs. (D) Correlation of MRI calculated VAF with gold standard histology-based VAF for each animal Significant positive correlation was found between MRI and HE based ratios (R2=0.832, P<0.001). Histology slices were acquired immediately after post-IRE MRI acquisitions. |
Figure 6A shows representative TUNEL and CD31 stained normal liver and liver tumor sections. On average, IRE zone demonstrated the greatest percentage apoptosis for both normal liver (23.4) and liver tumor (24.9), followed by RE zone (3.59 for normal tissue and 8.61 for tumor tissues), and lastly by untreated tissues (0.348 for normal liver and 7.22 for tumor tissues). On CD31 staining, the tumor tissue IRE zone on average had significantly decreased (P<0.05) MVD compared with the RE zone. The normal liver had a high artifact on CD31 staining that prevented MVD quantification (Figure 6B). Normal liver displayed significantly lower apoptosis in RE zone and untreated tissues (P<0.05 for both) but not in the IRE zone (Figure 6C).
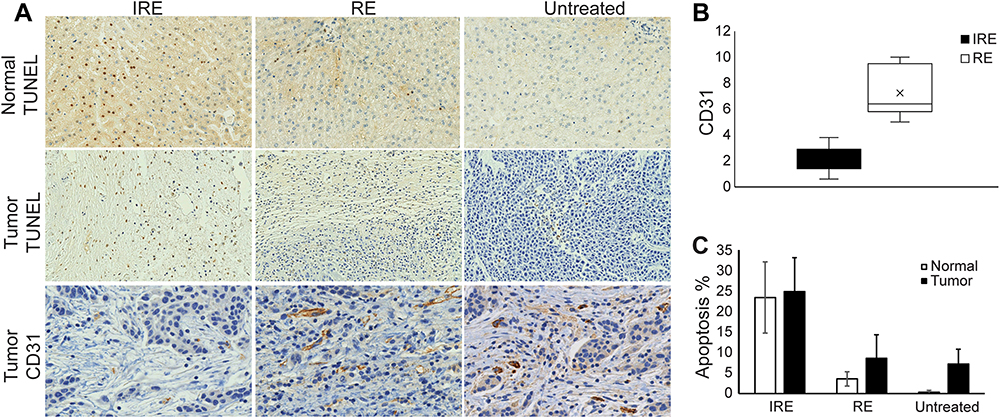 |
Figure 6 Histology staining and quantification. (A) Representative histologic images of treated normal liver tissues stained for TUNEL and treated liver tumor tissues stained for TUNEL and CD31. (B) Comparison of cells staining positively for CD31 in IRE zone and RE zone of tumors after IRE treatment. RE zone demonstrated significantly higher CD31 staining compared with the IRE zone (P<0.05). (C) % apoptosis in tumor and normal IRE-treated tissues. No significant difference was found between normal liver and liver tumor tissue apoptosis in all treatment. Histology slices were acquired immediately after post-IRE MRI acquisitions. |
Discussion
In this study, we showed that intraprocedural TRIP-MRI detected a reduction in tissue perfusion after IRE in both normal liver and liver tumor tissues and also distinguished between treatment zones in both liver tumors and normal liver. Intraprocedural TRIP-MRI measurements can be used for immediate functional monitoring of liver tumor IRE response and accurately differentiate IRE and RE zones.
Quantitative and Semiquantitative Parameters Differentiated Between IRE Treatment Zones
Differentiation between IRE and RE zones is vital in clinical applications. In case IRE zone does not cover the whole tumor, RE zone will affect the efficacy of the IRE treatment and cause high recurrence rates.16,29 Therefore, the ability to identify RE zones will be useful in which combined IRE-chemotherapy/immunotherapy will achieve remarkable clinical results and prevents tumor recurrence immediately following IRE treatment. In our previous studies, we have optimized the IRE parameters for the treatment of liver tumors using a VX2 liver tumor model and rat liver tumor model.17,23–25 Therefore, we use the same IRE parameters for this project. Previously, Guo et al used contrast-enhanced MRI to predict IRE treatment zones in rat models of liver cancer16 but did not assess immediate responses to IRE nor functional changes. Vogel et al found that tissue damage after IRE is a dynamic process with remarkable time differences in different tissues and the ablation size continues to develop for at least 24 hours.30,31 Padia et al demonstrated the RE zones with the enhancement of the periphery on immediate post-procedure MR images that, over time, involutes and is associated with decreasing signal in humans.32 Others also showed that RE treatment zones could not be detected at more than 2 days after IRE treatment in porcine models.33 Thus, in this study, we determined both the RE zones and IRE zones by immediate intraprocedural imaging to evaluate the therapy response after IRE. TRIP‐MRI, a technique for the evaluation of tissue perfusion characteristics, allowed to identify both RE and IRE zones 20 min after IRE procedure with volumetric monitoring of tissue perfusion features with a high spatial and temporal resolution. We previously used dynamic contrast imaging (DCE-MRI) to show that IRE and RE zones both have decreased perfusion in normal rabbit liver tissue.25 In this study, IRE treated regions in both normal liver and liver tumor tissues showed identifiable IRE and RE zones as verified by histology. The similarities between normal liver and liver tumors after IRE suggest potential similar responses to IRE.
TRIP-MRI is a volumetric perfusion imaging technique that directly delivers contrast via an arterial catheter. Compared with intravenous perfusion MRI, TRIP-MRI allows up to 60% reduction in contrast agent dosage to diminish potential adverse effects and allows direct perioperative delivery of adjuvant treatment agents for increased uptake via IRE-induced nanopores. Wang et al showed that intraprocedural TRIP-MRI perfusion measurement correlated with response to therapy and IRE can be a powerful tool for combination therapy.18
In this study, we used intraprocedural TRIP-MRI with clinical parameters of perfusion to study changes in both normal liverand liver tumor tissues after IRE. For both normal and tumor tissues, TTP was increased, while PE, WIS, Ktrans, ve, and vp were decreased in the IRE treated tissues, with the IRE zone having greater changes than the RE zone. Semiquantitative parameters derived from TICs such as AUC, PE, TTP, and WIS correlated with physiologic parameters including blood flow, perfusion, and permeability. The increased TTP and decreased AUCs, PE, and WIS in treated tissues reflected decreased perfusion. This was further supported by quantitative parameters. Ktrans is a measurement of flux across the endothelium, while ve and vp are measurements of EES and plasma volumes, respectively. Diminished Ktrans suggests decreased blood flow to the treated regions; decreased vp and ve suggested blood vessel and tissue damage, respectively.34–36 Greater changes in IRE zone TRIP-MRI measurements suggested greater capillary and tissue damage than the RE zone. This was supported by histology, which showed increased cell death in the IRE and RE zones via TUNEL staining and worse BV damage via decreased CD31 staining. No significant differences were found between normal liver and liver tumor tissues for all parameters, suggesting that IRE responses are reproducible and can be effectively clinically used.
ROC Analysis for Potential Clinical Applications
Eight of the ten semiquantitative (WIS, AUC60, AUC90, AUC120, and AUC150) and quantitative parameters (Ktrans, ve, and vp) demonstrated high sensitivity and specificity for differentiating IRE and RE zones within treated tissues. Among quantitative parameters, Ktrans had optimal sensitivity of 100% and a high specificity of 85.70%. vp had a sensitivity of 92.9% and a specificity of 100%. Among all parameters, the semiquantitative parameters WIS and AUC60 had the best abilities to differentiate IRE and RE zones, both with a sensitivity of 93.75% and specificity of 100%. These semiquantitative parameters had the same specificity as vp and only marginally increased sensitivity. Only Ktrans had 100% sensitivity among all parameters. In clinical practice, both quantitative and semiquantitative parameters will likely be needed for effective intraoperative differentiation of RE and IRE zones.
Limitations
Our results demonstrated that intraprocedural TRIP-MRI not only depicts serial reductions in liver tumor perfusion immediately post-IRE ablation but also discriminates between the IRE zone and RE zone in a rabbit model. However, our study had a few limitations. First, we did not perform a baseline preprocedural TRIP-MRI. However, the contrast agent has a long washout time from the liver, and pre-IRE TRIP-MRI may cause artifacts in post-IRE measurement of tissue perfusion. Also, TRIP-MRI measurements of tumor tissues after IRE were compared with untreated liver tissue in rabbits with tumors and not directly with the tumor tissue. IRE electrodes were designed to encapsulate liver tumors during treatment, so no viable tumor tissues remained for comparison after IRE for comparison with treated tissues. In future experiments, multiple tumors will be induced in rabbit models in similar planes to allow comparison of treated and untreated tumors.
Conclusion
Intraprocedural TRIP-MRI measurements can effectively differentiate IRE and RE zones immediately post-IRE ablation in normal liver tissue and liver tumor tissues.
Abbreviations
AUC, area under the curve; HCC, hepatocellular carcinoma; HE, hematoxylin-eosin; IRE, irreversible electroporation; RE, reversible electroporation; ROC, receiver operating characteristics; TRIP-MRI, transcatheter intraarterial perfusion MRI; TUNEL, terminal deoxynucleotidyl transferase dUTP nick end labeling.
Data Sharing Statement
The datasets generated during and/or analyzed during the current study are available from the corresponding author on reasonable request.
Ethics Approval and Informed Consent
Our pre-clinical animal study was approved by the Institutional Animal Care and Use Committee of Northwestern University and performed in accordance with the USDA Animal Welfare Act and Animal Welfare Regulations and National Institutes of Health’s Guide for the Care and Use of Laboratory Animals.
Acknowledgments
We would like to thank Dr. Matteo Figini for his contributions to this study. Co-first authors: Anna J. Shangguan and Kang Zhou.
Funding
This study was supported by the National Cancer Institute (grants R01CA209886, R01CA196967, and R01CA241532), by 2019 Harold E. Eisenberg Foundation Scholar Award, and by the Fishel Fellowship Award at the Robert H. Lurie Comprehensive Cancer Center of Northwestern University, and by SIR Foundation Pilot Grant (PR-0000000012).
Disclosure
The authors declare no potential conflicts of interest.
References
1. Global Burden of Disease Cancer C, Fitzmaurice C, Allen C, Barber RM, et al. Global, regional, and national cancer incidence, mortality, years of life lost, years lived with disability, and disability-adjusted life-years for 32 cancer groups, 1990 to 2015: a systematic analysis for the global burden of disease study. JAMA Oncol. 2017;3(4):524–548. doi:10.1001/jamaoncol.2016.5688
2. Lurje I, Czigany Z, Bednarsch J, et al. Treatment Strategies for Hepatocellular Carcinoma – a Multidisciplinary Approach. Int J Mol Sci. 2019;20(6):6. doi:10.3390/ijms20061465
3. Xie B, Wang DH, Spechler SJ. Sorafenib for treatment of hepatocellular carcinoma: a systematic review. Dig Dis Sci. 2012;57(5):1122–1129. doi:10.1007/s10620-012-2136-1
4. Le Grazie M, Biagini MR, Tarocchi M, Polvani S, Galli A. Chemotherapy for hepatocellular carcinoma: the present and the future. World J Hepatol. 2017;9(21):907–920. doi:10.4254/wjh.v9.i21.907
5. Li D, Kang J, Golas BJ, Yeung VW, Madoff DC. Minimally invasive local therapies for liver cancer. Cancer Biol Med. 2014;11(4):217–236.
6. Guo Y, Zhang Y, Klein R, et al. Irreversible electroporation therapy in the liver: longitudinal efficacy studies in a rat model of hepatocellular carcinoma. Cancer Res. 2010;70(4):1555–1563. doi:10.1158/0008-5472.CAN-09-3067
7. Figini M, Zhou K, Pan L, et al. Transcatheter intra-arterial perfusion (TRIP)-MRI biomarkers help detect immediate response to irreversible electroporation of rabbit VX2 liver tumor. Magn Reson Med. 2019:2;154.
8. Zimmerman A, Grand D, Charpentier KP. Irreversible electroporation of hepatocellular carcinoma: patient selection and perspectives. J Hepatocell Carcinoma. 2017;4:49–58. doi:10.2147/JHC.S129063
9. Simmerman E, Chung J, Lawson A, Kruse E. Application of Irreversible Electroporation Ablation as Adjunctive Treatment for Margin Enhancement: safety and Efficacy. J Surg Res. 2020;246:260–268.
10. Sugimoto K, Kakimi K, Takeuchi H, et al. Irreversible Electroporation versus Radiofrequency Ablation: comparison of Systemic Immune Responses in Patients with Hepatocellular Carcinoma. J Vasc Interv Radiol. 2019;30(6):845–853. doi:10.1016/j.jvir.2019.03.002
11. Papoulas M, Abdul-Hamid S, Peddu P, Cotoi C, Heaton N, Menon K. Irreversible electroporation in borderline resectable pancreatic adenocarcinoma for margin accentuation. J Surg Case Rep. 2018;2018(6):rjy127. doi:10.1093/jscr/rjy127
12. Dollinger M, Zeman F, Niessen C, et al. Bile Duct Injury after Irreversible Electroporation of Hepatic Malignancies: evaluation of MR Imaging Findings and Laboratory Values. J Vasc Interv Radiol. 2016;27(1):96–103. doi:10.1016/j.jvir.2015.10.002
13. Narayanan G, Bhatia S, Echenique A, Suthar R, Barbery K, Yrizarry J. Vessel patency post irreversible electroporation. Cardiovasc Intervent Radiol. 2014;37(6):1523–1529. doi:10.1007/s00270-014-0988-9
14. Granata V, de Lutio di Castelguidone E, Fusco R, et al. Irreversible electroporation of hepatocellular carcinoma: preliminary report on the diagnostic accuracy of magnetic resonance, computer tomography, and contrast-enhanced ultrasound in evaluation of the ablated area. Radiol Med. 2016;121(2):122–131.
15. Vroomen L, Scheffer HJ, Melenhorst M, et al. MR and CT imaging characteristics and ablation zone volumetry of locally advanced pancreatic cancer treated with irreversible electroporation. Eur Radiol. 2017;27(6):2521–2531. doi:10.1007/s00330-016-4581-2
16. Guo Y, Zhang Y, Nijm GM, et al. Irreversible electroporation in the liver: contrast-enhanced inversion-recovery MR imaging approaches to differentiate reversibly electroporated penumbra from irreversibly electroporated ablation zones. Radiology. 2011;258(2):461–468. doi:10.1148/radiol.10100645
17. Zhang Y, Guo Y, Ragin AB, et al. MR imaging to assess immediate response to irreversible electroporation for targeted ablation of liver tissues: preclinical feasibility studies in a rodent model. Radiology. 2010;256(2):424–432. doi:10.1148/radiol.10091955
18. Wang D, Gaba RC, Jin B, et al. Perfusion reduction at transcatheter intraarterial perfusion MR imaging: a promising intraprocedural biomarker to predict transplant-free survival during chemoembolization of hepatocellular carcinoma. Radiology. 2014;272(2):587–597. doi:10.1148/radiol.14131311
19. Wang D, Virmani S, Tang R, et al. Four-dimensional transcatheter intraarterial perfusion (TRIP)-MRI for monitoring liver tumor embolization in VX2 rabbits. Magn Reson Med. 2008;60(4):970–975. doi:10.1002/mrm.21678
20. CftUotGftCaUoL A, Council NR, Studies D, Research I. Guide for the Care and Use of Laboratory Animals: Eighth Edition: Washington. 2012.
21. Lee EW, Wong D, Prikhodko SV, et al. Electron microscopic demonstration and evaluation of irreversible electroporation-induced nanopores on hepatocyte membranes. J Vasc Interv Radiol. 2012;23(1):107–113. doi:10.1016/j.jvir.2011.09.020
22. Yao C, Dong S, Zhao Y, et al. Bipolar Microsecond Pulses and Insulated Needle Electrodes for Reducing Muscle Contractions During Irreversible Electroporation. IEEE Trans Biomed Eng. 2017;64(12):2924–2937.
23. Pan L, Sun C, Zhou K, et al. Transcatheter Intraarterial Perfusion MRI Approaches to Differentiate Reversibly Electroporated Penumbra From Irreversibly Electroporated Zones in Rabbit Liver. Acad Radiol. 2020. doi:10.1016/j.acra.2020.01.008
24. Hu S, Sun C, Wang B, et al. Diffusion-Weighted MR Imaging to Evaluate Immediate Response to Irreversible Electroporation in a Rabbit VX2 Liver Tumor Model. J Vasc Interv Radiol. 2019;30(11):1863–1869. doi:10.1016/j.jvir.2019.05.030
25. Shangguan AJ, Sun C, Wang B, et al. DWI and DCE-MRI approaches for differentiating reversibly electroporated penumbra from irreversibly electroporated ablation zones in a rabbit liver model. Am J Cancer Res. 2019;9(9):1982–1994.
26. Sourbron SP, Buckley DL. On the scope and interpretation of the Tofts models for DCE-MRI. Magn Reson Med. 2011;66(3):735–745. doi:10.1002/mrm.22861
27. Tofts PS. Modeling tracer kinetics in dynamic Gd-DTPA MR imaging. J Magn Reson Imaging. 1997;7(1):91–101. doi:10.1002/jmri.1880070113
28. Tofts PS, Brix G, Buckley DL, et al. Estimating kinetic parameters from dynamic contrast-enhanced t1-weighted MRI of a diffusable tracer: standardized quantities and symbols. J Magn Reson Imaging. 1999;10(3):223–232. doi:10.1002/(SICI)1522-2586(199909)10:3<223::AID-JMRI2>3.0.CO;2-S
29. Chen X, Ren Z, Zhu T, et al. Electric Ablation with Irreversible Electroporation (IRE) in Vital Hepatic Structures and Follow-up Investigation. Sci Rep. 2015;5(1):16233. doi:10.1038/srep16233
30. Vogel JA, van Veldhuisen E, Agnass P, et al. Time-Dependent Impact of Irreversible Electroporation on Pancreas, Liver, Blood Vessels and Nerves: A Systematic Review of Experimental Studies. PLoS One. 2016;11(11):e0166987. doi:10.1371/journal.pone.0166987
31. Vogel JA, van Veldhuisen E, Alles LK, et al. Time-Dependent Impact of Irreversible Electroporation on Pathology and Ablation Size in the Porcine Liver: A 24-Hour Experimental Study. Technol Cancer Res Treat. 2019;18:1533033819876899. doi:10.1177/1533033819876899
32. Padia SA, Johnson GE, Yeung RS, Park JO, Hippe DS, Kogut MJ. Irreversible Electroporation in Patients with Hepatocellular Carcinoma: immediate versus Delayed Findings at MR Imaging. Radiology. 2016;278(1):285–294. doi:10.1148/radiol.2015150031
33. Felker ER, Dregely I, Chung DJ, et al. Irreversible Electroporation: defining the MRI Appearance of the Ablation Zone With Histopathologic Correlation in a Porcine Liver Model. AJR Am J Roentgenol. 2017;208(5):1141–1146. doi:10.2214/AJR.16.17207
34. Ahmed Z, Levesque IR. An extended reference region model for DCE-MRI that accounts for plasma volume. NMR Biomed. 2018;31(7):e3924. doi:10.1002/nbm.3924
35. Thng CH. Perfusion magnetic resonance imaging of the liver. World J Gastroenterol. 2010;16(13):1598–1609. doi:10.3748/wjg.v16.i13.1598
36. Chen -B-B. DCE-MRI in hepatocellular carcinoma-clinical and therapeutic image biomarker. World J Gastroenterol. 2014;20(12):3125–3134. doi:10.3748/wjg.v20.i12.3125
 © 2020 The Author(s). This work is published and licensed by Dove Medical Press Limited. The full terms of this license are available at https://www.dovepress.com/terms.php and incorporate the Creative Commons Attribution - Non Commercial (unported, v3.0) License.
By accessing the work you hereby accept the Terms. Non-commercial uses of the work are permitted without any further permission from Dove Medical Press Limited, provided the work is properly attributed. For permission for commercial use of this work, please see paragraphs 4.2 and 5 of our Terms.
© 2020 The Author(s). This work is published and licensed by Dove Medical Press Limited. The full terms of this license are available at https://www.dovepress.com/terms.php and incorporate the Creative Commons Attribution - Non Commercial (unported, v3.0) License.
By accessing the work you hereby accept the Terms. Non-commercial uses of the work are permitted without any further permission from Dove Medical Press Limited, provided the work is properly attributed. For permission for commercial use of this work, please see paragraphs 4.2 and 5 of our Terms.