")
Back to Journals » International Journal of Nanomedicine » Volume 15
Intranasal Delivery of Immunotherapeutic Nanoformulations for Treatment of Glioma Through in situ Activation of Immune Response
Authors Yin P , Li H, Ke C, Cao G, Xin X , Hu J, Cai X, Li L, Liu X, Du B
Received 29 November 2019
Accepted for publication 25 February 2020
Published 6 March 2020 Volume 2020:15 Pages 1499—1515
DOI https://doi.org/10.2147/IJN.S240551
Checked for plagiarism Yes
Review by Single anonymous peer review
Peer reviewer comments 2
Editor who approved publication: Dr Linlin Sun
Peidi Yin, 1 Huifeng Li, 1 Chao Ke, 2 Guangxu Cao, 1 Xiaoqian Xin, 3 Junjiao Hu, 4 Xiangran Cai, 4 Lingfeng Li, 1 Xiaowen Liu, 3 Bin Du 1
1Department of Pathology, School of Medicine, Jinan University, Guangzhou 510632, People’s Republic of China; 2Department of Neurosurgery/Neuro-Oncology, Sun Yat-Sen University Cancer Center, State Key Laboratory of Oncology in South China, Collaborative Innovation Center for Cancer Medicine, Guangzhou 510060, People’s Republic of China; 3Department of Pharmacology, School of Medicine, Jinan University, Guangzhou 510632, People’s Republic of China; 4Medical Imaging Center, The First Affiliated Hospital, Jinan University, Guangzhou 510630, People’s Republic of China
Correspondence: Xiaowen Liu; Bin Du
Email [email protected]; [email protected]
Purpose: Some chemotherapeutics have been shown to induce both the release of damage-associated molecular patterns (DAMPs) and the production of type I interferon (IFN-I), leading to immunogenic cell death (ICD). However, the standard chemotherapy drug for glioma, temozolomide (TMZ), cannot induce ICD as it cannot activate IFN-I signaling. Moreover, inefficient delivery of immunostimulants across the blood–brain barrier (BBB) is the main obstacle to overcome in order to induce local immune responses in the brain.
Methods: A new oligonucleotide nanoformulation (Au@PP)/poly(I:C)) was constructed by coating gold nanoparticles (AuNPs) with methoxypolyethylene glycol (mPEG)-detachable (d)-polyethyleneimine (PEI) (Au@PP) followed by inducing the formation of electrostatic interactions with polyinosinic-polycytidylic acid (poly(I:C)). Intracranial GL261 tumor-bearing C57BL/6 mice were used to explore the therapeutic outcomes of Au@PP/poly(I:C) plus TMZ in vivo. The anti-tumor immune response in the brain induced by this treatment was analyzed by RNA sequencing and immunohistochemical analyses.
Results: Au@PP/poly(I:C) induced IFN-I production after endocytosis into glioma cells in vitro. Additionally, Au@PP/poly(I:C) was efficiently accumulated in the glioma tissue after intranasal administration, which allowed the nanoformulation to enter the brain while bypassing the BBB. Furthermore, Au@PP/poly(I:C) plus TMZ significantly improved the overall survival of the tumor-bearing mice compared with group TMZ only. RNA sequencing and immunohistochemical analyses revealed efficient immune response activation and T lymphocyte infiltration in the Au@PP/poly(I:C) plus TMZ group.
Conclusion: This study demonstrates that intranasal administration of Au@PP/poly(I:C) combined with TMZ induces ICD, thereby stimulating an in situ immune response to inhibit glioma growth.
Keywords: AuNPs, poly(I:C), intranasal administration, immunogenic cell death, in situ immune response activation
Corrigendum for this paper has been published
Introduction
Over the past few decades, increasing independent evidence has confirmed that immunogenic chemotherapy affects tumor–host interactions and thereby causes immunogenic cell death (ICD). This converts tumor cells into in situ vaccines in a process that involves the release of damage-associated molecular patterns (DAMPs) and type I interferon (IFN-I) production, resulting in anti-tumor immune response activation.1–3 Classic ICD inducers such as anthracyclines, oxaliplatin, and cyclophosphamide have been widely used in tumor chemotherapy for the successful induction of ICD.4 Temozolomide (TMZ) is a second-generation oral alkylating agent for the treatment of glioma.5 Surgical resection followed by radiotherapy and chemotherapy using TMZ is the standard treatment for glioma.6 However, TMZ alone cannot induce IFN-I production and ICD of glioma.7 TMZ must be combined with an immunostimulant to elicit an immune response. However, it is very difficult for immunostimulants to cross the blood–brain barrier (BBB), which is the main obstacle to overcome in order to induce local immune responses in the brain.
Polyinosinic-polycytidylic acid (poly(I:C)) is an artificially synthesized double-stranded RNA (dsRNA) that can bind to intracellular Toll-like receptor (TLR)-38,9 and retinoic acid-inducible gene I-like receptors (RLRs)10 to generate IFN-I via the interferon regulatory factor (IRF)-3/7 signaling pathway. This activates natural killer (NK) and dendritic cells (DCs), stimulating the host immune response and thereby producing an anti-tumor effect.11,12 However, unmodified poly(I:C) has a short in vivo half-life (<30 min); in contrast, poly(I:C) with polylysine and carboxymethylcellulose (poly-ICLC) has a long half-life but relatively high toxicity.13 Liposomes can be used to transfect tumor cells with poly(I:C) to induce ICD in situ,14 greatly increasing the immune effect of poly(I:C). The discovery of a way for poly(I:C) to cross or bypass the BBB and directly interact with glioma cells in situ may improve the outcomes of glioma patients.
Gold nanoparticles (AuNPs) with diameters of 1–100 nm can be loaded with large numbers of thiol-modified oligonucleotides.15 The binding of AuNPs to dsRNA,16 such as small interfering RNA (siRNA), can greatly improve the stability of the RNA in vivo and the complex is easily endocytosed by cells, producing significant biological effects.17 Moreover, AuNPs can pass through the BBB, thereby functioning as ideal vectors for the treatment of brain tumors.18,19 However, when RNA-loaded AuNPs are administered intravenously, nucleases in the blood may degrade the nucleic acid cargoes, and the efficiency of passage through the BBB remains suboptimal.19,20 Notably, the olfactory pathway is a route that connects the brain to the outside environment.21 Transmucosal delivery of drugs via the olfactory pathway, bypassing the BBB, is referred to as direct intranasal (IN) transport to the brain.21,22 However, to the best of our knowledge, no studies have reported on whether AuNPs can deliver nucleic acid drugs to the brain via the IN pathway.
In the present study, we assessed the abilities of nanoformulations to reach various parts of the brain via the IN route and found that IN administration of AuNPs modified with methoxypolyethylene glycol (mPEG)-detachable (d)-polyethyleneimine (PEI) (Au@PP)/poly(I:C) combined with intragastric (IG) administration of TMZ significantly prolonged the survival time of mice with intracranial glioma. The functional mechanism of this treatment involves stimulation of IFN-I production by dying glioma cells, which activates the local anti-tumor immune response to induce ICD of intracranial glioma cells. These findings will provide new insights into the treatment of glioma.
Materials and Methods
Cell Culture
GL261 murine glioblastoma cells (German Collection of Microorganisms and Cell Cultures, passage 10–20) were cultured in Dulbecco’s modified Eagle medium (DMEM) supplemented with 10% foetal bovine serum (FBS) and 1% penicillin/streptomycin. (Gibco, Massachusetts, USA).
Synthesis of AuNPs and mPEG-d-PEI-Modified AuNPs
AuNPs (13 nm) were synthesized based on published methods.23 In brief, the AuNPs were prepared by adding 0.5 mL trisodium citrate (1% by weight) solution to 50 mL boiling chloroauric acid (HAuCl4) solution (10−2% by weight). Boiling was conducted for 25 s, and the mixture was light blue. The solution suddenly turned from blue to bright red after approximately 70 s, indicating the formation of monodisperse spherical particles. Boiling was then continued for an additional 5 min, which allowed the HAuCl4 to be completely reduced to AuNPs.
We then used mPEG-d-PEI (3.4-kDa PEG and 25-kDa PEI; Ruixi Biological Technology Co., Ltd, Xi’an, China) to prepare Au@PP. After adding 0.1 mg/mL AuNPs to a thoroughly mixed 1.0 mg/mL mPEG-d-PEI solution, the AuNPs were modified by the mPEG-d-PEI for 30 min in the presence of 10 mM NaCl. Au@PP was then purified by centrifugation at 15,700×g for 15 min and resuspended in 10 mM 4-(2-hydroxyethyl)-1-piperazineethanesulfonic acid (HEPES) buffer (pH 7.4) with 1 mM NaCl. The Au@PP obtained had an Au concentration of 0.05 mg/mL in the final solution, as determined by inductively coupled plasma mass spectrometry (ICP-MS).
Binding Ability of AuNPs to Poly(I:C)
High-molecular-weight poly(I:C) (InvivoGen, California, USA; mean size: 1.5–8 kb) was mixed with Au@PP at a weight ratio of 0, 0.00375, 0.0075, 0.0125, 0.025, 0.0375, 0.05 (Au:poly(I:C)) and incubated at room temperature for 15 min to enable the formation of the Au@PP/poly(I:C) complexes. The mixture was then centrifuged at 10,000×g for 10 min to remove the free poly(I:C), and the concentration of poly(I:C) in the supernatant was detected using a NanoDrop 2000 Spectrophotometer (ThermoFisher Scientific, Massachusetts, USA). Additionally, the supernatant was analyzed by 1% agarose gel electrophoresis with Tris-acetate-ethylenediaminetetraacetic acid (TAE) buffer at 120 V for 15 min. The RNA bands were visualized using a Gel imaging system (Bio-Rad, California, USA). For the in vivo experiment, we prepared Au@PP/poly(I:C) at a weight ratio of 0.05 (Au:poly(I:C)) to attain a poly(I:C) concentration of 5 mg/mL by centrifuging the Au@PP/poly(I:C) solution at 4°C and 10,000×g for 10 min, adding ddH2O, and ultrasonically agitating the mixture at 4°C for 2 s.
Characterization of Au@PP/Poly(I:C)
Transmission electron microscopy (TEM) samples of AuNPs, Au@PP, and Au@PP/poly(I:C) were prepared (with an Au concentration of 0.5 mg/mL). The samples were dropped onto carbon grids (AZH300; ZJKY, Henan, China) that had been treated with oxygen plasma to increase the surface hydrophilicity. The UV–Vis absorption spectra of AuNPs, Au@PP, and Au@PP/poly(I:C) (with an Au concentration of 0.5 mg/mL) at wavelengths of 250–800 nm were also measured using a UV spectrophotometer. Water was used as the baseline and the detection interval was 1 nm/s. Next, the morphology of these three was characterized by TEM. The hydrodynamic diameters and zeta potential of the samples (AuNP, Au@PP and Au@PP/poly(I:C)) in aqueous solution were determined by dynamic light scattering (DLS) using a Zetasizer Nano S instrument (Malvern Panalytical, London, UK). The test temperature of the instrument was set to 25°C, and the equilibrium time was 120 s before each test. Each sample was tested five times, and the mean value was used as the final result.
Transfection Ability of Au@PP
Because it is hard to label high-molecular-weight poly(I:C) with fluorescence, a fluorescein amidite (FAM)-bonded oligonucleotide was used as a surrogate. The FAM-bonded oligonucleotide (3ʹ-AAATTT-5ʹ-FAM) was designed and combined with Au@PP at a weight ratio of 0.05 (Au:FAM-oligonucleotide). GL261 mouse glioma cells were seeded in six-well plates at a density of 1.5×10⁵ cells/well and then incubated with 20 μg/mL Au@PP/FAM or FAM-bonded oligonucleotide for 24 h. Next, the medium was removed and the cells were washed twice with phosphate-buffered saline (PBS). Fluorescence images were obtained by inverted fluorescence microscopy (Leica, Wetzlar, Germany).
Quantitative Real-Time PCR
Murine glioblastoma cells were harvested from 6-well plates with TRIzol Reagent (Life, Massachusetts, USA), and brain tissue homogenate was obtained with a homogenizer (Kinematica, Luzern, Switzerland). In vitro, cells were seeded in 6-well plates with a density of 1.5×10⁴ cells/well and then treated with 20 μg/mL free poly(I:C), Au:poly(I:C) or 1 mM TMZ for 24 h. RNA was extracted according to the TRIzol RNA isolation protocol, cDNA was synthesized with a reverse transcriptase kit, and real-time PCR was performed with a SYBR Premix Ex Taq Kit (Takara, Tokyo, Japan) in a CFX96 Touch Real-Time PCR System (Bio-Rad, California, USA). The cDNA was denatured at 95°C for 30 s and amplified at 95°C for 5 s and 60°C for 25 s (40 cycles). The murine primers used were as follows: Table S1 Primers for qRT-PCR.
Enzyme-Linked Immunosorbent Assay (ELISA)
The supernatant in the abovementioned six-well plates was collected for protein quantification using an ELISA kit (ABclonal, Boston, USA). The supernatants were incubated for 2 h, followed by the addition of biotin-conjugated antibody (1:100) for 1 h. Streptavidin–horseradish peroxidase (1:100) was then added and incubated for 30 min. The reaction was developed using 100 µL tetramethylbenzidine substrate for 15 min, and the reaction was terminated by adding stop solution. Finally, the absorbance at 450 nm was measured using UV–Vis spectroscopy.
Mice and Treatments
Female C57BL/6 mice (20–23 g, 6 weeks old) (Huafukang, Beijing, China) were housed at the Jinan University Animal Center. We performed all animal experiments under the supervision of the Jinan University Animal Ethics Committee in accordance with the Animal Research: Reporting of In Vivo Experiments (ARRIVE) guidelines (approval no. 20180604–02). According to a previous study,24 the amount of Au in the brain could be accurately detected when the mice were intraperitoneally (IP) injected with 40 μg/kg AuNP (equivalent to 800 ng/mouse) and Chauhan et al22 reported that 5 μL/nostril was suitable for IN administration of aqueous solution.
For the first in vivo experiments, the number of AuNPs taken up in the brain was accurately assessed. In some experiments, mice were administered AuNPs via the IN or IP routes and sacrificed 4 h later, and in other experiments, mice were administered AuNPs via the IN or IP routes over 8 days and the mice were then sacrificed on day 9. The mice were divided into five groups (n=6 per group): IN administration of 10 μL AuNP (8 mg/L) once and sacrifice after 4 h; IP administration of 100 μL AuNP (8 mg/L) once and sacrifice after 4 h; IN administration of 10 μL AuNP (8 mg/L) four times per day every other day for 8 days; and IP administration of 100 μL AuNP (8 or 0.8 mg/L) four times per day every other day for 8 days.
For the next in vivo experiments, a GL261 intracranial tumor-bearing mouse model was created. The mice were divided into four groups (n=12–15 per group): an untreated control group, an Au@PP/poly(I:C) group, a TMZ group, and an Au@PP/poly(I:C) + TMZ combination treatment group. The mice received five treatments, once a day from day 7 to day 11 after tumor implantation. For IN administration of Au@PP/poly(I:C) with a poly(I:C) concentration of 5 mg/mL, each mouse received 5 μL of solution in each nasal cavity (10 μL in total) based on a previous study,22 to provide a dose of 50 μg per mouse. For the mice treated with TMZ, they were administered 3 mg/mL TMZ (Sigma, Missouri USA) via the IG route in an olive oil suspension at a dose of 50 mg/kg body weight. The mice were assessed using a 3.0 T clinical magnetic resonance imaging (MRI) scanner (GE Healthcare, Connecticut, USA) on days 13, 21, and 28 (n≥4 per group) after being anaesthetized with 1% pentobarbital (60 mg/kg body weight). The RadiAnt DICOM Viewer was used to process the MRI images to calculate the maximum tumor area. Then, the mice were sacrificed and the tumors were harvested.
Quantification of the Au Mass Fraction in Brain Tissue
The Au ions in various brain tissues were quantified based on published methods.24 The olfactory lobe, cerebral cortex, and cerebellum were separately harvested, weighed, and heated in aqua fortis in a beaker at 180°C to form a solid residue. Aqua regia was prepared with a hydrochloric acid:aqua fortis ratio of 3:1 and then added to the beaker to dissolve the Au in the solid residue. The solution continued to be heated until the yellow color gradually turned transparent, and the solution was then collected. Using a constant volume, ICP-MS was used to detect the Au ion concentrations in the samples, and the Au mass fraction in each tissue was then calculated.
Establishment of Intracranial Tumor-Bearing Mouse Model
GL261 cells were harvested, washed twice in PBS to remove FBS, counted and adjusted to yield a cell suspension with a density of 4.2×10⁷/mL. The hair near the puncture was shaved and the skin was disinfected after the mice were anaesthetized with 1% pentobarbital (60 mg/kg body weight). The heads of the mice were fixed, the skin was opened longitudinally, and the bregma was located. A puncture point was selected 2 mm behind the front sill and 3 mm to the right of the midline. A vertical needle was inserted to a depth of 3 mm, and the GL261 single-cell suspension (including 1.26×10⁵ GL261 cells) was injected with a precision syringe (1013086, Hamilton, New York, USA) at a rate of 2 μL/min. The needle was slowly withdrawn, the skin was again disinfected and sutured, and the mice were left at room temperature to recover. The mice were observed daily, and survival was recorded. The mice were sacrificed when their weight reached two-thirds of their initial weight or when they demonstrated severe neuropsychiatric symptoms.
RNA Sequencing and Analysis
Total RNA from tumor tissues was isolated using TRIzol Reagent. The RNA-seq was performed using two biological replicate pools for each treatment group, with each pool representing tumor RNA from individual mice tumors (n=4–5).25 RNA sequencing was performed by Annoroad Gene Technology (Beijing, China). Briefly, a cDNA library was constructed and then sequenced with a HiSeq 4000 system (Illumina, California, USA). The sequence reads were aligned to the Mus musculus GRCm38 reference genome from Ensembl (http://asia.ensembl.org/index.html) with TopHat version 2.0.13. Read counts were generated using HTSeq-count version 0.9.1. Differentially expressed genes (DEGs) were identified using the DESeq2 package in R (3.5.4) with thresholds of a Benjamini-Hochberg-adjusted p value <0.05 and a twofold change in expression. In addition, Gene Ontology (GO) and Kyoto Encyclopedia of Genes and Genomes (KEGG) analyses of the resulting gene lists were performed using the Functional Annotation Tool hosted by the Database for Annotation, Visualization and Integrated Discovery (DAVID) 6.8 bioinformatics research platform.
Histological and Immunohistochemical (IHC) Analyses
For the histological and IHC analyses, six mice from each treatment group were sacrificed on days 13, 21, and 28, and their brains were harvested and fixed in 10% formalin followed by 70% ethanol. Paraffin was used to embed the samples and the blocks were then cut into 5-μm sections. The tumors on day 13 were too small to embed in paraffin, so we harvested them only for the extraction of RNA for sequencing.
Hematoxylin and eosin staining was performed to evaluate changes in the tumors after the various treatments. Briefly, sections were heated at 100°C in citrate buffer solution (pH 6.0) for 10 min for antigen retrieval. Thereafter, the sections were incubated overnight with murine anti-CD3 (ab5690; Abcam, Boston, USA), anti-CD8a (98941S; CST, Massachusetts, USA) or anti-programmed death-ligand 1 (PD-L1; BE0101; InVivoMAb, New Hampshire, USA) antibodies before being incubated with a secondary antibody (Bio X Cell, USA) for 30 min at room temperature. Thereafter, the nuclei were counterstained with hematoxylin. The sections were photographed under a light microscope (Leica, Wetzlar, Germany) with Leica Application Suite (LAS) v4.3
IHC results were evaluated using a semiquantitative approach to assign IHC scores to the tumor samples according to a previous study.26 The membrane staining intensity of the cells in a fixed field (200× magnification) was determined (0, 1+, 2+, or 3+) and an IHC score was then assigned using the following formula: [1 × (% cells 1+) + 2 × (% cells 2+) + 3 × (% cells 3+)]. We took three images per section and calculated the mean IHC score, which represented the IHC score for that section, and we studied at least six mice per group in this fashion.
Statistical Analysis
The data were graphed using GraphPad Prism 6 and analysed to determine statistical significance by one-way analysis of variance (ANOVA) (for 3 of more comparisons) or one-tailed Student’s t-test (for 2 group comparisons). A log-rank test was used in mice survival studies. p < 0.05 was considered as statistically significant. All experiments were performed at least in triplicate.
Results
Synthesis and Characterization of Au@PP/Poly(I:C)
As shown in the scheme, AuNPs were modified with mPEG-d-PEI by Au-S covalent bond, after the modification AuNPs was equipped with positive charge from PEI, which can absorb poly(I:C) efficiently through electrostatic interaction (Figure 1A). To verify the ability of AuNPs to combine with poly(I:C), we characterized each nanoformulation. In brief, TEM images of AuNPs showed a typical spherical morphology with a uniform diameter of 13 nm (Figure 1B(i)). The AuNPs also had a characteristic surface plasmon resonance peak of 520 nm (as determined by UV–Vis spectroscopy), a hydrodynamic diameter of approximately 20 nm (as determined by DLS), which concurred with the TEM images, and a negative surface charge of −18.6 ± 1.5 mV (Figure 1C–E). The AuNPs were then covalently modified by mPEG-d-PEI via an Au-thiol reaction that anchored the mPEG-d-PEI to the surface of the AuNPs to form Au@PP. Au@PP still exhibited a typical spherical morphology based on TEM images (Figure 1B(ii) and (iii)) and a characteristic UV absorption peak at 520 nm (Figure 1C). The hydrodynamic diameter of Au@PP was approximately 30 nm, as determined by DLS (Figure 1D), and the surface charge was reversed from a negative charge to 7.5 ± 0.4 mV due to the positive charge of PEI (Figure 1E). It was inferred that the AuNPs had been successfully coated with mPEG-d-PEI.
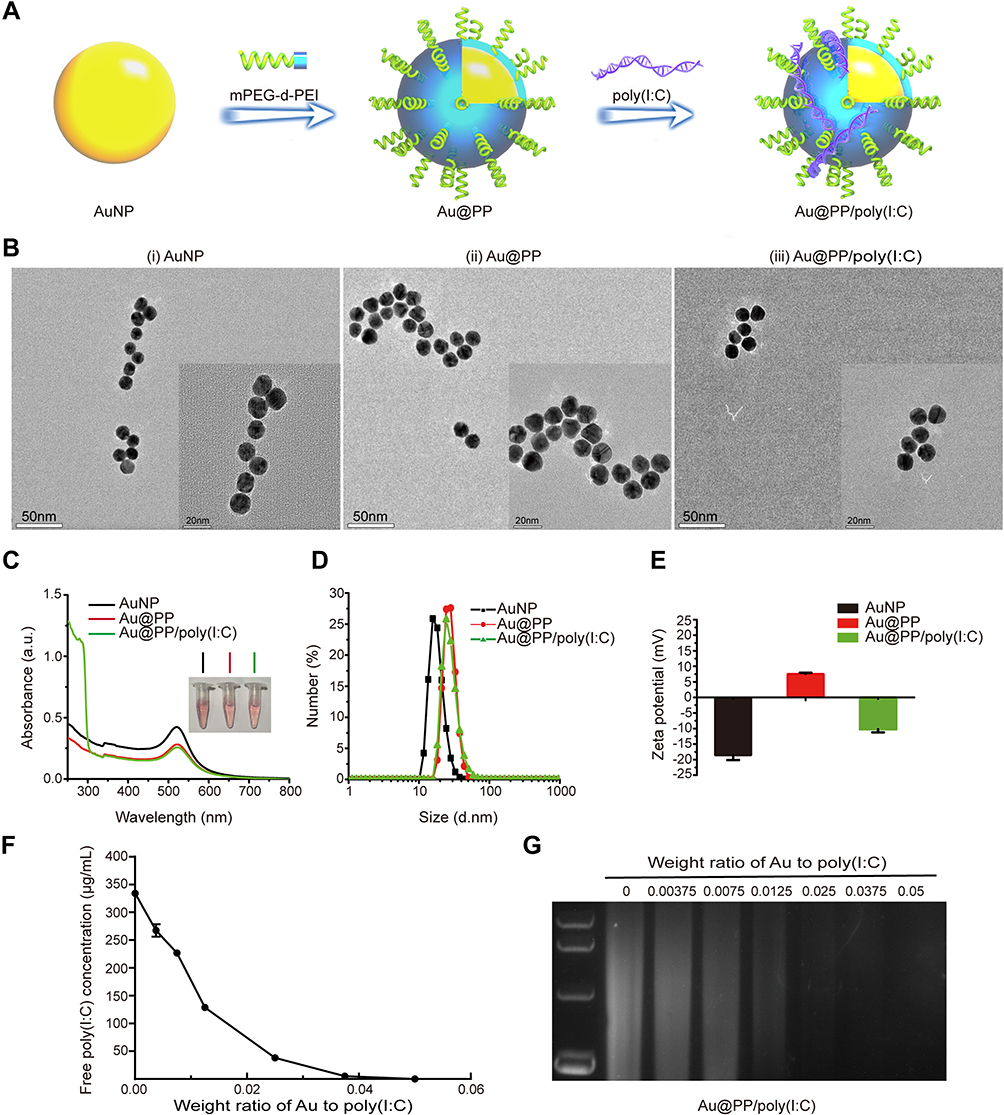 |
Figure 1 Preparation and characterization of Au@PP/poly(I:C) nanocomplexes. (A) Schematic diagram of modifying AuNPs with mPEG-d-PEI and poly(I:C). AuNPs were modified with mPEG-d-PEI by Au-S covalent bond, after the modification AuNPs was equipped with positive charge from PEI, which can absorb poly(I:C) efficiently through electrostatic interaction. (B) Representative TEM images of AuNP-based nanocomplexes. Scale bars, 50 nm. The insets show enlarged micrographs. Scale bars, 20 nm. (C) UV–Vis absorbance spectra of the indicated Au nanocomplexes with or without modification of poly(I:C). Insets, photographs of the indicated nanocomplex samples. (D) Size distribution of the Au nanocomplexes with or without modification of poly(I:C), as determined by DLS. (E) Zeta potential of the Au nanocomplexes before and after various modifications were performed. (F) The loading potency of AuNPs with poly(I:C) at various w/w ratios was determined by UV–Vis spectroscopy (n=3). (G) Agarose gel electrophoresis retardation assay of nanocomplexes with various w/w ratios of Au to poly(I:C). Complete retardation of poly(I:C) was achieved at the w/w ratio of 0.05. The data were shown (C–E) as the mean ± SD (n = 5). |
Poly(I:C) was then loaded onto the Au@PP at various weight ratios of Au:poly(I:C). The concentration of poly(I:C) in the supernatant decreased as the weight ratio increased (Figure 1F), indicating concentration-dependent combination of poly(I:C) with AuNPs. The positive correlation regarding the poly(I:C)-loading efficiency of AuNPs was also verified by the gradually decreasing intensity of the agarose gel electrophoresis bands (Figure 1G). To be specific, when the weight ratio of Au:poly(I:C) was 0.05, both the ELISA of the supernatant containing poly(I:C) (Figure 1F) and the agarose gel electrophoresis assay (Figure 1G, rightmost lane) indicated that almost all poly(I:C) combined with Au@PP to form Au@PP/poly(I:C) complexes. Therefore, poly(I:C) was considered fully combined with Au@PP at a weight ratio of 0.05 (Au: poly(I:C)). This ratio was thus selected for subsequent experiments. As poly(I:C) is a small molecule, it made almost no contribution to the size of the Au@PP/poly(I:C) complex, which was nanospherical in shape with a radius of 20 nm (i.e., almost the same size as Au@PP) according to the TEM and DLS measurements (Figure 1B and D). In addition, a new characteristic absorption peak appeared at 260 nm for the Au@PP/poly(I:C) complex, which further indicated that poly(I:C) was successfully loaded onto Au@PP (Figure 1C). Additionally, the surface charge of the Au@PP/poly(I:C) complex was converted to a negative charge again (approximately −10.2 ± 1.0 mV) due to the negatively charged poly(I:C) (Figure 1E). These results showed that Au@PP successfully absorbed poly(I:C) to form a nanoformulation,27 which was used for the following experiments.
IFN-I Production by Glioma Cells After Au@PP/Poly(I:C) Treatment in vitro
To investigate whether AuNPs could be used to transfect cells with nucleic acid, a FAM-bonded oligonucleotide (3ʹ-AAATTT-5ʹ-FAM) was loaded onto Au@PP (Au@PP/FAM) and then incubated with GL261 cells for 24 h. As shown in Figure 2A, green fluorescence was observed in cells treated with Au@PP/FAM, while there was no fluorescence in cells treated with the FAM-bonded oligonucleotide alone. This result indicated that the cells were successfully transfected with AuNPs loaded with nucleic acid in vitro. A previous study showed that the IFN-I produced by tumor cells is a major biological marker of ICD in vitro.2 To further clarify the effect of Au@PP/poly(I:C) on ICD in vitro, IFN-I production in GL261 and CT-2A glioma cells was analyzed by real-time PCR after incubation with free poly(I:C), Au@PP/poly(I:C), or TMZ for 24 h or after being left untreated for 24 h. As shown in Figure 2B, the mRNA expression of interferon beta 1 (Ifnb1) and chemokines 10 (Cxcl10) (which is an interferon-stimulated gene [ISG]) was slightly increased in the free poly(I:C) group compared with the control group (p < 0.05). However, the mRNA expression of Ifnb1, Cxcl10, and Mx1 in GL261 and CT-2A cells was dramatically increased in the Au@PP/poly(I:C) group compared with the control and free poly(I:C) groups (p < 0.05) (Figure 2B). Consistent with a previous liposome transfection study,28 these results indicate that Au@PP/poly(I:C) can efficiently enter the cytoplasm of glioma cells to elicit an immune response resembling that caused by infection with oncolytic vaccinia viruses. Furthermore, ELISA of the supernatant was used to detect the secretion of IFNB1 by GL261 and CT-2A glioma cells in vitro after treatment with free poly(I:C), Au@PP/poly(I:C), or TMZ or after being left untreated (Figure 2C). Consistent with the mRNA results, the secretion of IFNB1 by the two glioma cell types was dramatically increased in the Au@PP/poly(I:C) group compared with the control and free poly(I:C) groups (p < 0.05). In contrast, TMZ alone did not increase the expression of any of the assessed genes (p > 0.05). These results demonstrated that AuNPs can carry poly(I:C) into tumor cells, which can then directly bind to receptors in the cytoplasm to increasingly secrete IFN-I.
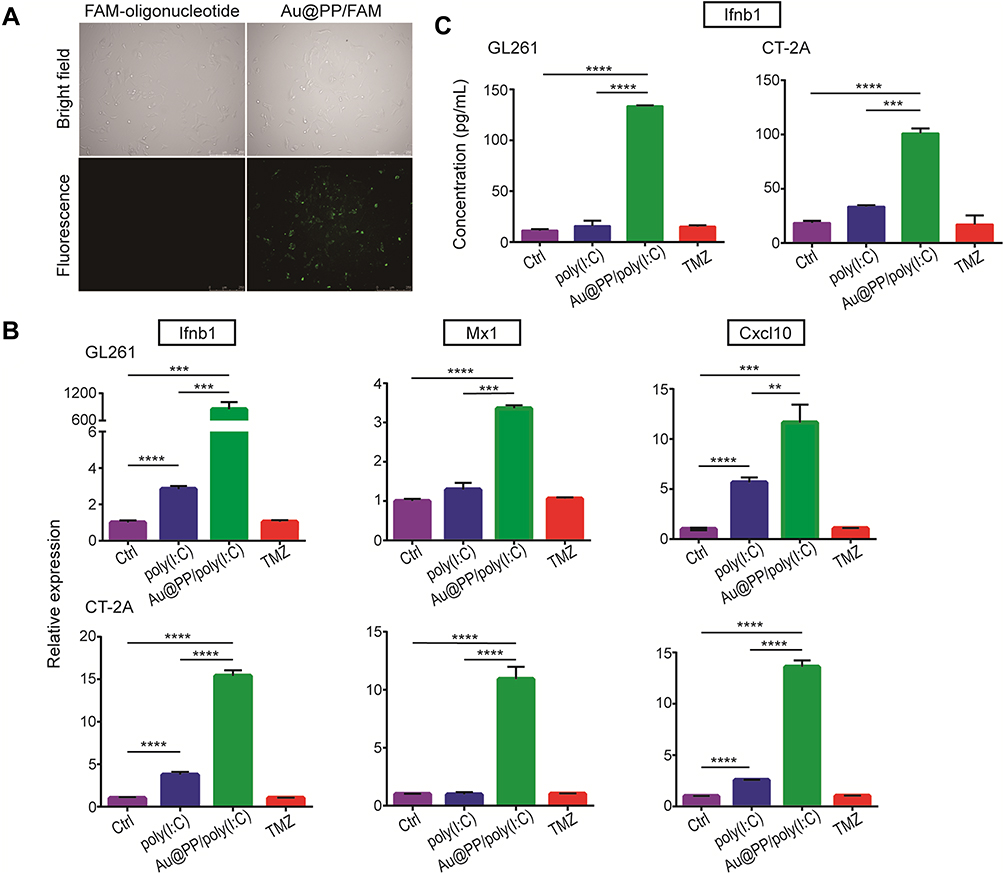 |
Figure 2 IFN-I production in cultured glioma cells induced by Au@PP/poly(I:C). (A) Fluorescence images of GL261 cells treated by 20 μg/mL free FAM-bonded oligonucleotide alone or combined with Au@PP at a weight ratio of 0.05 (Au:FAM-oligonucleotide). The same view is shown under fluorescence and bright-field microscopy. Scale bars, 250 μm. (B) qPCR analysis of ISGs expressed in GL261 and CT-2A cells treated by 20 μg/mL free poly(I:C), 20 μg/mL poly(I:C) combined with Au@PP at a weight ratio of 0.05 or 1 mM TMZ for 24 h. (Mean±SEM, n=6, **p < 0.01, ***p < 0.001 and ****p < 0.0001). (C) Concentration of IFNB1 in the supernatants of GL261 and CT-2A cells with the abovementioned treatments detected by ELISA. (Mean±SEM, n=3, ***p < 0.001 and ****p < 0.0001). |
IN Administration of Au@PP/Poly(I:C) Inhibited Intracranial Glioma Growth and Prolonged Mouse Survival
To determine the effects of different administration routes on the brain uptake of AuNPs, in one experiment, mice were sacrificed 4 h after IN or IP administration of AuNPs. Although the total amount of AuNPs administered by the IP route (100 μL of 8 mg/L) was 10-fold greater than that administered by the IN route (10 μL of 8 mg/L), the Au mass fractions in various parts of the brain were significantly higher in the IN group than the IP group (especially in the olfactory lobe; 659.2 ± 73.59 vs 66.45 ± 1.943, respectively, both p < 0.05) (Figure 3A). In another experiment, the mice were treated with different doses of AuNPs by the IN route (10 μL of 8 mg/L) or IP route (100 μL of 8 mg/L) four times per day every other day over 8 days, as shown in Figure 3B. Although the total amount of AuNPs administered by the IP route (100 μL of 8 mg/L) was 10-fold greater than that administered by the IN route (10 μL of 8 mg/L), there was no significant difference in the Au mass fraction in the olfactory lobe of the brain between the IN and IP groups. Additionally, when the same amount of AuNPs were used for IN administration (10 μL of 8 mg/L) and IP administration (100 μL of 0.8 mg/L) four times per day every other day over 8 days, as shown in Figure 3C, Au was not detectable in the brain in the IP group, but the mice in the IN group showed significant uptake in the brain. These results indicate that the IN route is a more efficient route, bypassing the BBB and allowing AuNPs to be taken up in the brain. Interestingly, comparing the Au mass fraction in the three parts of the brain between the two IN groups (10 μL AuNP of 8 mg/L once and sacrifice after 4 h vs 10 μL AuNP of 8 mg/L four times per day every other day for 8 days) (Figure 3A, B), the levels were significantly higher in the former group than the latter group (olfactory lobe: 659.2 ± 73.59 vs 88.72 ± 9.188; cerebral cortex: 38.55 ± 7.154 vs 11.02 ± 1.679; cerebellum: 24.78 ± 5.292 vs 11.10 ± 3.062, respectively, all p < 0.05). This indicated that AuNPs in the brain were metabolized instead of accumulating and causing toxicity. This mechanism may be related to the efflux systems of the BBB.29
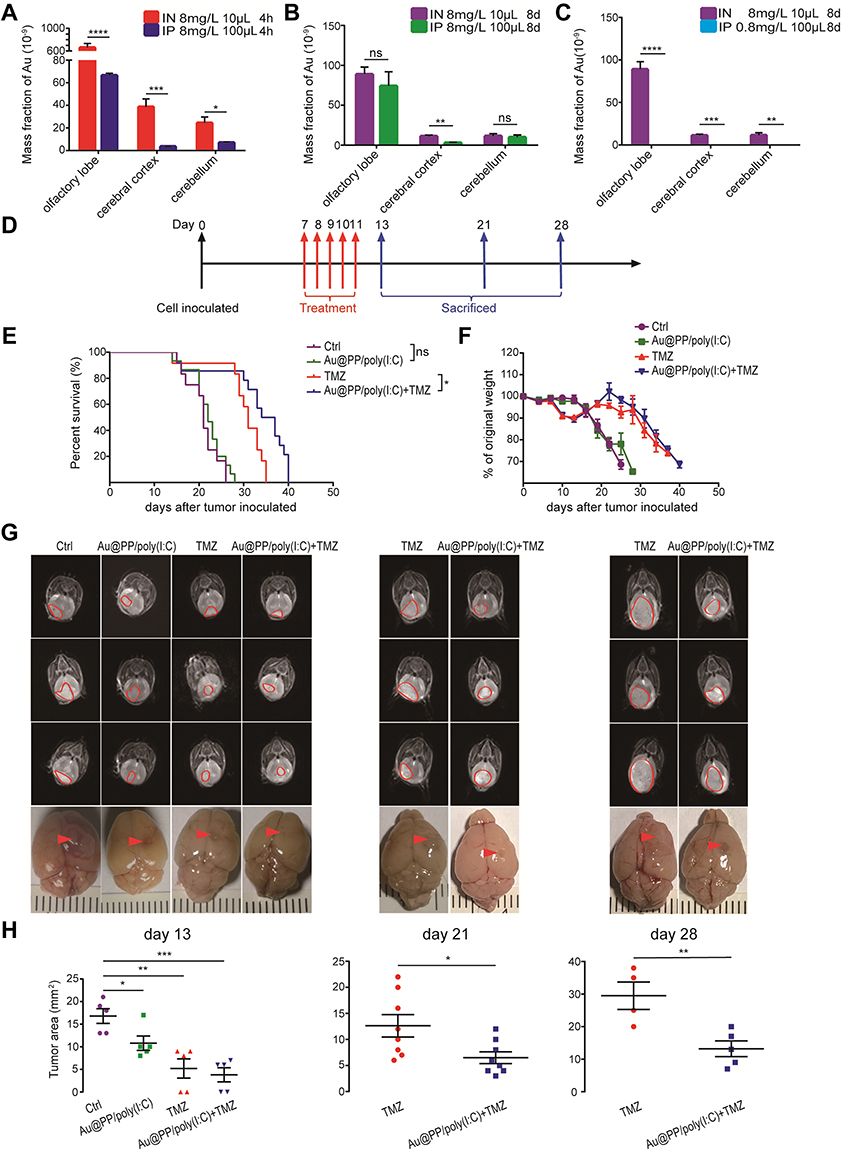 |
Figure 3 Intranasal administration of Au@PP/poly(I:C) inhibited intracranial glioma growth and prolonged mice survival. (A) Accumulation of AuNPs in different brain regions in the initial stage of dosing at 8 mg/L and the amounts of Au in the brain post-injection at 4 h after IN or IP administration. (B, C) Mice were treated with 8 mg/L AuNPs every other day for 4 times by the IN and IP routes (B), while were treated with 8 mg/L AuNPs every other day for 4 times by the IN route and with 0.8 mg/L AuNPs every other day for 4 times by the IP route or treated by the IN route with a total of 10 μL of solution and by the IP route with a total of 100 μL of solution every time (C). The brain tissue was ablated with aqua regia and ICP-MS was used to detect the solution gold ion concentration. (Mean±SEM, n=6 in each group. ns: no significant difference, *p < 0.05, **p < 0.01, ***p < 0.001 and ****p < 0.0001). (D) Schematic of the therapy regimen. Intracranial glioma orthotopic xenografts were established by inoculation of GL261 cells into C57BL/6 mice. The mice received intranasal Au@PP/poly(I:C) or intragastrical TMZ every day for 5 successive days. (E) Survival of the animals. Log-rank analysis was performed for each group; for the indicated comparisons in the last two groups, ns: non-significant, *p < 0.05. (F) Body weight changes in mice after tumor inoculation. (G) Representative MRI images of the existing brain tumors in day 13, day 21 and day 28. The red circles and arrows indicate the tumors. (H) Tumor area was measured with RadiAnt DICOM Viewer. (Mean±SEM, for (A–C), n=6 in each group; for (D–F), n≥12 in each group; for G and H, n≥4. ns: no significant difference, *p < 0.05, **p < 0.01, ***p < 0.001). |
To further explore the therapeutic outcomes of the combination treatment in vivo, GL261 intracranial tumor-bearing mice were treated with various formulations. In contrast to a recent study on IN administration of polyfunctional gold-iron oxide nanoparticles loaded with therapeutic miRNAs to enhance apoptosis of glioma cells,30 in the present study, for the first time, a novel non-invasive and simple technique was employed to deliver poly(I:C) in a manner that bypasses the BBB to treat glioma by inducing a local anti-tumor immune response. The treatment started from day 7 after tumor inoculation and ended on day 11. The details of the experimental design are depicted in Figure 3D. The survival of the mice was observed and recorded daily, and the survival curve and percentage changes in the body weight of the mice were plotted (Figure 3E, F). Log-rank tests were used to analyze the differences in the overall survival rates of mice under the different modes of administration. As shown in Figure 3E, there was no significant difference in survival between the control and Au@PP/poly(I:C) groups (p = 0.336), indicating that Au@PP/poly(I:C) alone could not directly inhibit glioma growth. Combination treatment (Au@PP/poly(I:C) + TMZ) and TMZ alone extended the median survival time compared to the control group (36 and 31 vs 21 days, respectively; both p < 0.0001). Furthermore, combination treatment significantly improved survival time compared to TMZ alone (36 vs 31 days, p = 0.0120). These findings proved that concurrent IN administration of Au@PP/poly(I:C) and IG administration of TMZ can increase the therapeutic effects of TMZ on intracranial glioma and prolong the survival time of mice. In addition, TMZ significantly reduced body weight, whereas Au@PP/poly(I:C) did not obviously affect body weight (Figure 3F), implying that Au@PP/poly(I:C) was not toxic to the mice.
To clarify the treatment effect, MRI T2-weighted imaging (T2WI) was used to monitor the tumor sizes on days 13, 21, and 28 after various treatments (Figure 3G). One-way ANOVA was used to analyze the differences in the maximum tumor cross-sectional area (Figure 3H). As shown in Figure 3H (left panel), on day 13, the maximum tumor cross-sectional area was much larger in the control group than in all of the treatment groups (control group: 16.80 ± 1.625 mm2; Au@PP/poly(I:C) group: 10.80 ± 1.594 mm2; TMZ group: 5.200 ± 2.131 mm2; and combination treatment group: 3.800 ± 1.562 mm2; n≥4 mice/group), and the differences were significant (16.80 ± 1.625 vs 10.80 ± 1.594, 5.200 ± 2.131, 3.800 ± 1.562 mm2, respectively; all p < 0.05). Interestingly, Au@PP/poly(I:C) alone did not improve overall survival compared with the control group (Figure 3E). Only mice treated with combination treatment or TMZ alone survived to days 21 and 28; therefore, the tumors of these two treatment groups were collected and analyzed. As expected, the inhibitory effect on tumor growth of combination treatment (IN administration of Au@PP/poly(I:C) and IG administration of TMZ) was better than that of TMZ alone on days 21 and 28 (Figure 3H). Notably, the tumor sizes in these two treatment groups were larger on day 28 than on day 21 (Figure 3H), implying that 5 days of treatment (up to day 11 after tumor implantation) could not completely eliminate the tumor cells. The tumor sizes on day 21 were smaller than those on days 13 and 28, indicating that the inhibitory effect was most obvious on day 21.
Combination Treatment Induced ICD by Activating IFN-I Signaling in Glioma Cells
To investigate the mechanism underlying the effects of the combination treatment, we performed transcriptome sequencing to examine the expression changes in the tumor tissues of the various treatment groups. According to DESeq analysis (to detect differentially expressed genes using RNA sequencing data) involving quantile normalization (based on the following criteria: fold change >2 and p < 0.05), 3121 upregulated genes were identified in the TMZ group and 1936 upregulated genes were identified in the combination treatment group compared to the control group, while the numbers of downregulated genes were 1848 and 486, respectively (DEG list in Table S2) (Figure 4A). As shown in the Venn diagram (Figure 4A), 1428 genes were significantly regulated in both the TMZ and combination treatment groups, while 1693 genes were uniquely regulated by TMZ. Moreover, 508 uniquely regulated genes were identified in the combination treatment group, and they may underlie the therapeutic mechanism of the combination treatment.
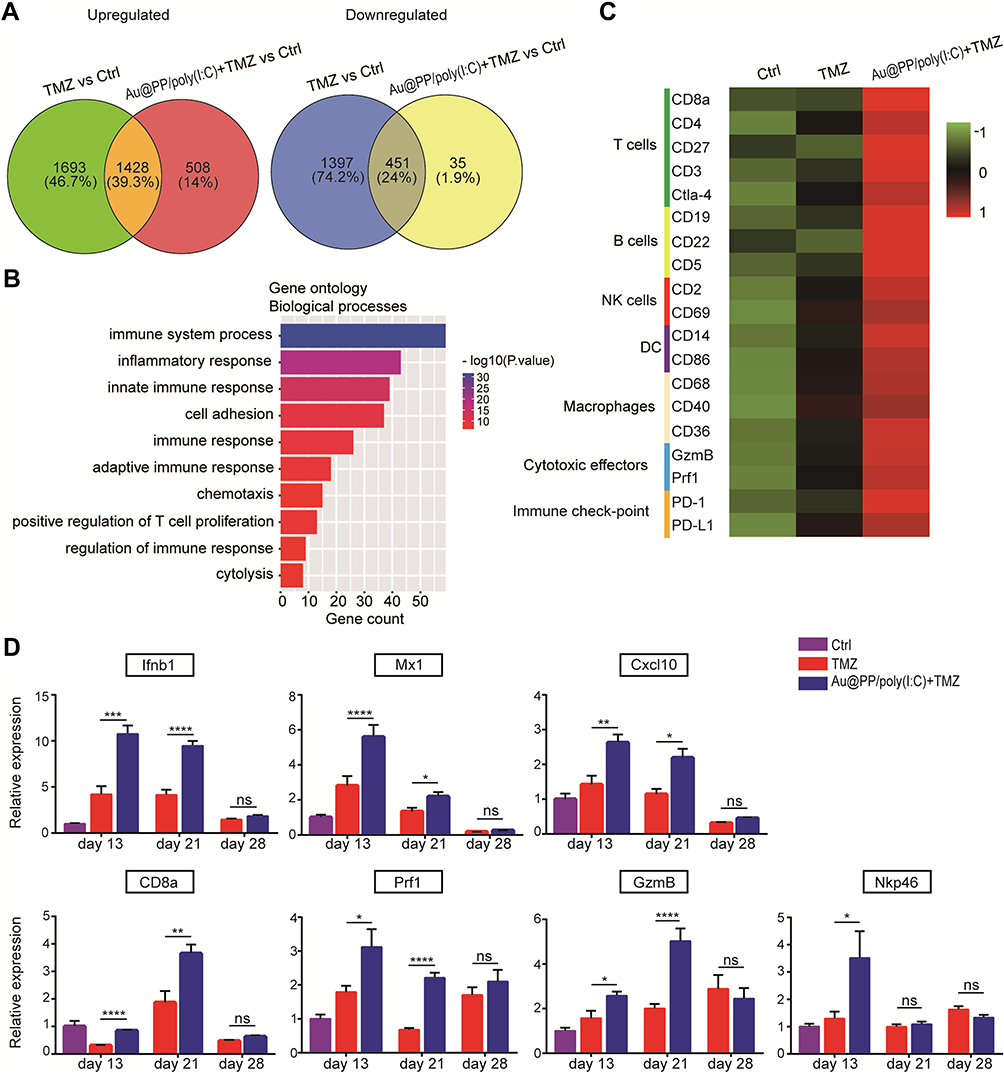 |
Figure 4 Intranasal Au@PP/poly(I:C) combined with TMZ induced local immune response in intracranial glioma. (A) Venn diagram showing the upregulated and downregulated genes differentially expressed in the Au@PP/poly(I:C) and TMZ combination group compared to the TMZ group. Treated mice were sacrificed on day 21, while control mice were sacrificed on day 13. (B) GO enrichment of the 508 significant upregulated DEGs in the TMZ and Au@PP/poly(I:C) combination treatment group compared to the TMZ treatment group. The DEGs were associated with terms in the biological process (BP) category, and the top 10 terms are listed. The X-axis corresponds to the number of DEGs, and the Y-axis represents various gene functions. The p value is indicated by the colour. (C) Heatmap displaying the relative mRNA levels of selected genes known as markers of immune cells. The heatmap was created based on the mean FPKM values of each group and shows the gene expression levels. The expression levels are divided into various classifications in the bar according to the Z-score. Green indicates low expression, and red indicates high expression. (D) The expression of genes in tumors reflects the intensity of the inflammatory response. (Mean±SEM, n=6 in each group. ns: no significant difference, *p < 0.05, **p < 0.01, ***p < 0.001 and ****p<0.0001). |
To obtain comprehensive gene function information, the Database for Annotation, Visualization and Integrated Discovery (DAVID) was used to conduct Gene Ontology (GO) enrichment analysis of the 508 genes (Figure 4B and GO_BP list in Table S3). The analysis revealed enrichment of biological functions closely related to immune responses, such as “immune system process” (p < 0.01, 13.20% of cluster frequency) and “innate immune response” (p < 0.01, 8.72% of cluster frequency). Furthermore, a series of biological markers of immune cells, including macrophages (CD68), B cells (B19), T cells (CD8a and CD3), and DCs (CD86), and cytotoxic effectors of NK and T cells (Perforin1 and Granzyme B), were upregulated in the combination treatment group compared with the TMZ and control groups (Figure 4C) (Fragments Per Kilobase of transcript per Million mapped reads [FPKM] value list in Table S4). Subsequently, the expression levels of immune response marker genes associated with IFN-I (Ifnb1, Mx1, and Cxcl10), T cells (CD8a), NK cells (Nkp46), and cytotoxic effectors of NK, T cells (Perforin1, Prf1, Granzyme B, and GzmB) were detected in tumors by real-time PCR at different time points to further elucidate the anti-tumor mechanism. As shown in Figure 4D, compared to in the control group, the expression of IFN-I-related genes in the combination treatment group was upregulated beginning on day 13, while nearly all immune cell marker genes were significantly upregulated on day 21, which may explain the optimal therapeutic outcome on day 21 (Figure 3H and G). Notably, because the mice in the control group did not survive to day 21, the IFN-I expression on days 21 and 28 in the control group was not measured. Moreover, all of the genes in the combination treatment and TMZ groups in day 28 were downregulated to it in day 21 (Figure 4D). The results indicated that combination treatment led to IFN-I induction followed by immune response activation, consistent with the effects of other ICD activators (Figure 2B and C). Taken together, these findings demonstrated that the reduction in tumor size and prolongation of survival time in the combination treatment group might be rooted in the activation of anti-tumor immune responses.
Combination Treatment Improved T-Cell Infiltration of Glioma Tissues
To assess lymphocyte infiltration of the intracranial GL261 gliomas, we performed IHC analyses of CD3+ and CD8a+ lymphocytes in brains harvested on days 13, 21, and 28 after various treatments (though the combination treatment and TMZ groups lacked sufficient tumor volumes on day 13 for analysis). Tumors from control mice exhibited relatively scant lymphocytic infiltration, as did tumors from mice treated with poly(I:C) (Figure 5A). These results implied that treatment with poly(I:C) alone could not activate anti-tumor immune responses. However, more lymphocytes appeared in the brain tumors of TMZ and combination treatment mice than in those of poly(I:C) mice. To fully quantify lymphocyte infiltration in the brain tumors, blinded pathologists quantitatively analyzed the IHC slides to calculate the IHC scores. As shown in Figure 5B, the numbers of lymphocytes infiltrating the brain tumors in each group were highest on day 21, which was consistent with the previous real-time PCR results (Figure 4D, bottom panel). However, the T-cell infiltration in the combination treatment group was reduced on day 28 compared to on day 21, and on day 28 there was no longer a significant difference between the combination treatment and TMZ groups, possibly due to IN administration of Au@PP/poly(I:C) being stopped on day 11 after tumor implantation. In detail, regarding the T-cell markers CD3 and CD8a, on day 21, the mean number of CD3+ cells was significantly higher in the combination treatment group than the TMZ group (56.33 ± 4.116 vs 42.11 ± 3.039 cells, respectively, p < 0.05), and the mean number of CD8a+ cells in the combination treatment group was almost twice that in the TMZ group (29.78 ± 2.253 vs 17.67 ± 1.716 cells, respectively, p < 0.001).
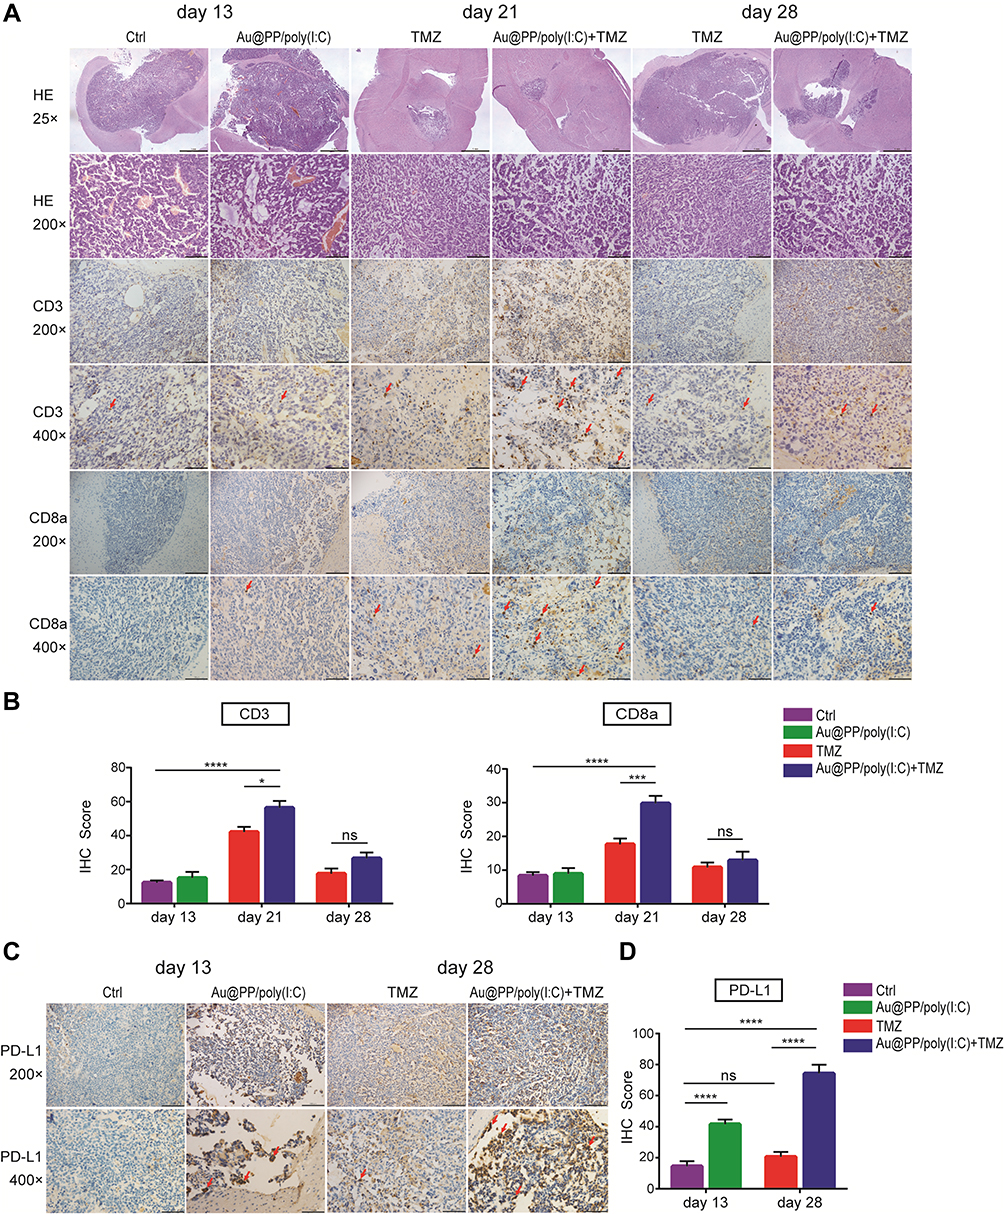 |
Figure 5 Intranasal Au@PP/poly(I:C) combined with TMZ improves T-cell infiltration and PD-L1 expression in intracranial glioma. (A, C) Representative images of H&E and immunohistochemical staining for CD3, CD8a and PD-L1 in GL261 glioma. The tumor tissue was collected on day13, day21 and day 28 after cell inoculating. The images are magnified 25×, 200× and 400× (the scale bars within the photomicrographs are 1000, 100 and 50 microns in length). The red arrows show the positive cells. (B, D) The IHC membrane staining intensity of each cell in a fixed field is determined as 0, 1+, 2+, or 3+, and the IHC score was assigned using the following formula: [1 × (% cells 1+) + 2 × (% cells 2+) + 3 × (% cells 3+)]. We took 3 pictures with 200× magnification per cut section of the brain tumors and counterstained cells from each picture and calculated an average from the three. The results at least include 6 mice per each group. (Mean±SEM, n=6–9 in each group. ns: no significant difference, *p < 0.05, ***p<0.001 and ****p<0.0001). |
As shown in Figure 4C, the expression of the immune checkpoint genes Ctla-4 and Pd-l1 was significantly increased in the combination treatment group to TMZ only group according to the RNA sequencing data. IHC scores were then used to assess the protein expression of PD-L1 in brain tumors. PD-L1 was slightly expressed in the control group, indicating that the GL261 tumor cells originally slightly expressed PD-L1 (Figure 5C), which is consistent with the findings of a previous study.31 Furthermore, the mean number of PD-L1+ cells on day 13 in the poly(I:C) group was twice that in the control group (41.56 ± 3.037 vs 14.44 ± 3.367 cells, respectively, p < 0.0001) (Figure 5D). Similarly, on day 28, the mean number of PD-L1+ cells in the combination treatment group was almost three times higher than that in the TMZ group (74.22 ± 5.622 vs 20.56 ± 3.145 cells, respectively, p < 0.0001) (Figure 5D). Interestingly, there was no significant increase in the mean number of PD-L1+ cells in the TMZ group compared to the control group (p > 0.05), which implied that the increase in PD-L1 expression was not attributable to TMZ but rather to poly(I:C).
Discussion
Immunotherapy represents a major advance in clinical oncology, with successful treatment of multiple cancers with immunotherapy in the last decade.32 However, many clinical trials on glioma have yielded non-significant results, partly because of inefficient drug delivery across the BBB.33 The IN (nose-to-brain) route represents a direct route for administering therapeutics to the brain. This route permits therapeutics to efficiently pass through the olfactory epithelium into the olfactory bulb via the olfactory nerve and then onto the hindbrain.29 DAMP release from dying cells and local IFN-I production are two requirements for inducing ICD.2,3 In this study, an in situ immunostimulant nanoadjuvant (Au@PP/poly(I:C)) delivered via IN administration was designed for the treatment of glioma. Briefly, AuNPs were modified with mPEG-d-PEI via an Au-thiol reaction, which caused the AuNPs to be positively charged (due to PEI) so they could efficiently absorb poly(I:C) via electrostatic interactions (Figure 1A).29 IN administration of Au@PP/poly(I:C) was performed and there was efficient delivery to the brain, bypassing the BBB. After the Au@PP/poly(I:C) entered the brain, the AuNPs could carry poly(I:C) into the tumor cells by promoting endocytosis (Figure 6).29 In the cytoplasm, poly(I:C) detached from the nanocomplexes and stimulated the production of IFN-α and IFN-β by binding to receptors.8 The expression of ISGs was then increased, which activated the downstream immune response. TMZ can kill a small number of tumor cells directly, and DAMPs such as ATP and high-mobility group box 1 (HMGB 1) are subsequently transferred outside the dying tumor cells.3 In short, dying glioma cells treated with TMZ combined with local IFN-I signaling induced by IN administration of Au@PP/poly(I:C) can lead to ICD of tumor cells.
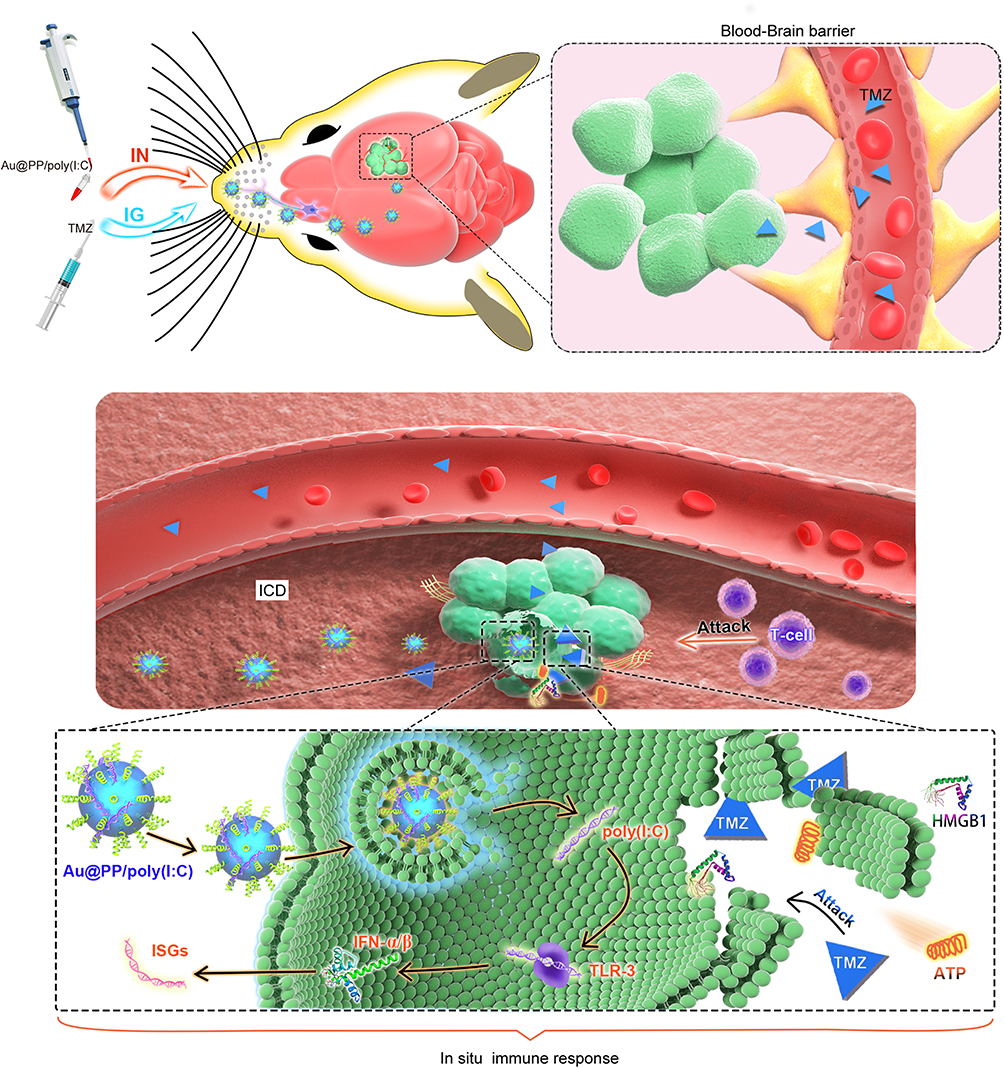 |
Figure 6 Schematic illustration of the principle of intranasal Au@PP/poly(I:C) delivery and the mechanism of local immune response in the brain. TMZ crosses through the BBB into the brain by IG administration, and Au@PP/poly(I:C) enters the brain via the olfactory nerve. Au@PP/poly(I:C) enters the tumor cells by endocytosis, the IFNI (IFN-α and IFN-β) were produced after the TLR-3 bonded with poly(I:C), which then increase the expression of ISGs. Besides, T cells activated by ISGs. TMZ kills a small number of tumor cells to expose the DAMPs such as ATP and high-mobility group box 1 (HMGB 1) outside. DAMPs stimulate activated T cells to attack tumor cells efficiently. |
Cancer cells are the sources of several chemokines induced by immunostimulants. Poly(I:C) is known to be an efficient inducer of proinflammatory cytokines, particularly IFN-I.10 Our in vitro experimental data showed that, compared with the entry of poly(I:C) alone into tumor cells, AuNPs can more efficiently carry poly(I:C) (Figure 1) into tumor cells (Figure 2A), where it directly binds to receptors in the cytoplasm instead of on immune cells to increase the levels of IFN-I (Figure 2B and C), which is consistent with the results of another study on the transfection of cells with poly(I:C).14 Previous studies have indicated that systemic administration of poly(I:C) inhibits tumor cell proliferation and induces apoptosis instead of inducing cytokine production.12,34 Recently, Aznar et al35 demonstrated that intratumorally delivered poly(I:C) nanoformulations induce ICD in a fraction of tumor cells and exert potent anti-tumor activity. Using osmotic micropumps, Shir et al delivered epidermal growth factor receptor (EGFR)-targeted poly(I:C) into the brain and induced the complete regression of pre-established intracranial tumors in nude mice.36 However, this method is invasive and not suitable for clinical applications. In this study, for the first time, a novel non-invasive and simple technique was employed to deliver poly(I:C) to the brain, bypassing the BBB, to treat glioma (Figure 3A). Poly(I:C) carried by Au@PP was directly administered to intracranial gliomas via the IN route, avoiding the degradation of nucleic acids associated with systemic delivery. Our results showed that IN administration of Au@PP/poly(I:C) combined with IG administration of TMZ significantly prolonged the survival of mice compared with other treatments (Figure 3E). Further animal experiments and clinical trials are required to verify the effects of IN administration of Au@PP carrying other nucleic acids, such as CpG oligonucleotides, on glioma.
It has been demonstrated that endogenous IFN-I is a hallmark of ICD. Some anti-tumor therapies, such as anthracyclines, oxaliplatin, and radiotherapy, not only induce tumor cell death but also stimulate the production of IFN-I by dying tumor cells.2 Hence, these treatments can induce ICD and thereby elicit effective immune responses.2 However, our study revealed that TMZ alone could not induce IFN-I production in vitro or ICD in vivo. Genome-wide transcriptome analyses and IHC assays revealed that Au@PP/poly(I:C) combined with TMZ successfully induced IFN-I production and CD8a T-cell infiltration in the tumor microenvironment (Figures 4–5). Therefore, this combination treatment resulted in increased survival due to IFN-I activation. In addition, a clinical trial demonstrated that combination treatment involving TMZ and the cytokines IFN-α/β did not significantly improve the overall prognosis of glioma patients.37 In the present study, after poly(I:C) was delivered to the brain by the IN route, IFN-I production peaked on day 13 and remained at a high level until day 21 (Figure 4B–D), and anti-tumor immunity was ultimately activated. This finding implies that continuous cancer cell-autonomous IFN-I signaling is required for ICD.
Interestingly, the mice in the combination treatment group had the longest survival time, including compared with the mice treated with TMZ alone, which is currently a clinical treatment for glioma (Figure 3E). To investigate the therapeutic mechanism, RNA sequencing was performed to analyze the downregulated and upregulated genes in the glioma cells after various treatments. The data show that combination treatment upregulated immunosuppressive genes such as PD-1/PD-L1 and Ctla-4 in tumors (Figures 4C and 5C and D). These results are consistent with a recent report that demonstrated that PD-1 blockade represents a major therapeutic avenue in anticancer immunotherapy.38 In the present study, the mice in the combination treatment group did not exhibit much longer survival compared with those in the TMZ group (Figure 5B). This unsatisfactory effect of IN administration of Au@PP/poly(I:C) in the combination treatment group may be due to the upregulation of immunosuppressive genes at day 28.
Recently, Emami et al demonstrated that AuNPs could also be used as carriers for PD-L1 antibodies.39 A previous study40 showed that AuNPs have a certain immune regulation ability, and the immunogenicity of Au@PP cannot be ruled out in this study. Therefore, the therapeutic effects of IN administration of AuNPs conjugated with PD-L1 antibodies and poly(I:C) on intracranial glioma are worth investigating in the future.
In conclusion, IN administration of Au@PP/poly(I:C) combined with conventional TMZ successfully induced IFN-I production and T-cell infiltration in intracranial gliomas. These effects inhibited glioma growth and prolonged mouse survival. This new immunotherapy is a promising treatment for intracranial tumors, and its use will likely improve the efficacy of chemotherapy for glioma patients in clinical settings.
Data Statement
The processed data required to reproduce these findings cannot be shared at this time as the data also form part of an ongoing study.
Acknowledgments
We thank Medical Imaging Center of the JNU First Affiliated Hospital for providing imaging facilities.
Author Contributions
All authors contributed to data analysis, drafting or revising the article, gave final approval of the version to be published, and agree to be accountable for all aspects of the work.
Funding
This work was supported by the National Natural Science Foundation of China (Grant Nos. 81872893 to BD; 81903546 to XWL), the Fundamental Research Fund for the Central Universities (Grant Nos. 21617462) the Guangzhou Science Technology and Innovation Commission (Grant Nos. 201707010099) and the College Students’ Innovative Entrepreneurial Training Plan Program (Grant Nos. S201910559050).
Disclosure
The authors declare that they have no conflicts of interest in this work.
References
1. Hammerich L, Bhardwaj N, Kohrt HE, Brody JD. In situ vaccination for the treatment of cancer. Immunotherapy. 2016;8:315. doi:10.2217/imt.15.120
2. Zitvogel L, Galluzzi L, Kepp O, Smyth MJ, Kroemer G. Type I interferons in anticancer immunity. Nat Rev Immunol. 2015;15:405. doi:10.1038/nri3845
3. Kroemer G, Galluzzi L, Kepp O, Zitvogel L. In: Littman DR, Yokoyama WM, editors. Immunogenic Cell Death in Cancer Therapy. Annual Review of Immunology. Vol. 31. 2013:51.
4. Zitvogel L, Kepp O, Kroemer G. Immune parameters affecting the efficacy of chemotherapeutic regimens. Nat Rev Clin Oncol. 2011;8:151. doi:10.1038/nrclinonc.2010.223
5. Stupp R, Mason WP, van den Bent MJ, et al. Radiotherapy plus concomitant and adjuvant temozolomide for glioblastoma. N Engl J Med. 2005;352:987. doi:10.1056/NEJMoa043330
6. Omuro A. Glioblastoma and other malignant gliomas. JAMA. 2013;310:1842. doi:10.1001/jama.2013.280319
7. Natsume A, Ishii D, Wakabayashi T, et al. IFN-β down-regulates the expression of DNA repair gene MGMT and sensitizes resistant glioma cells to temozolomide. Cancer Res. 2005;65:7573. doi:10.1158/0008-5472.CAN-05-0036
8. Matsumoto M, Seya T. TLR3: interferon induction by double-stranded RNA including poly(I:C)☆. Adv Drug Deliv Rev. 2008;60:805. doi:10.1016/j.addr.2007.11.005
9. Huang CH, Chen SC, Zhang T, et al. Fish Cholesterol 25-hydroxylase inhibits virus replication via regulating interferon immune response or affecting virus entry. Front Immunol. 2019;10.
10. Gitlin L, Barchet W, Gilfillan S, et al. Essential role of mda-5 in type I IFN responses to polyriboinosinic:polyribocytidylic acid and encephalomyocarditis picornavirus. Proc Natl Acad Sci U S A. 2006;103:8459. doi:10.1073/pnas.0603082103
11. Chin AI, Miyahira AK, Covarrubias A, et al. Toll-like receptor 3–mediated suppression of TRAMP prostate cancer shows the critical role of Type I interferons in tumor immune surveillance. Cancer Res. 2010;70:2595. doi:10.1158/0008-5472.CAN-09-1162
12. Salaun B, Coste I, Rissoan M-C, Lebecque SJ, Renno T. TLR3 can directly trigger apoptosis in human cancer cells. The Journal of Immunology. 2006;176:4894. doi:10.4049/jimmunol.176.8.4894
13. Martins KA, Bavari S, Salazar AM. Vaccine adjuvant uses of poly-IC and derivatives. Expert Rev Vaccines. 2015;14:447. doi:10.1586/14760584.2015.966085
14. Palchetti S, Starace D, De Cesaris P, Filippini A, Ziparo E, Riccioli A. Transfected Poly(I:C) activates different dsRNA receptors, leading to apoptosis or immunoadjuvant response in androgen-independent prostate cancer cells. J Biol Chem. 2015;290:5470. doi:10.1074/jbc.M114.601625
15. Giljohann DA, Seferos DS, Daniel WL, Massich MD, Patel PC, Mirkin CA. Gold nanoparticles for biology and medicine. Angew Chem Int Ed Engl. 2010;49:3280. doi:10.1002/anie.200904359
16. Elbakry A, Zaky A, Liebl R, Rachel R, Goepferich A, Breunig M. Layer-by-layer assembled gold nanoparticles for siRNA delivery. Nano Lett. 2009;9:2059. doi:10.1021/nl9003865
17. Ding Y, Jiang Z, Saha K, et al. Gold nanoparticles for nucleic acid delivery. Mol Ther. 2014;22:1075. doi:10.1038/mt.2014.30
18. Sela CH, Cohen H, Elia P, Zach R, Karpas Z, Zeiri Y. Spontaneous penetration of gold nanoparticles through the blood brain barrier (BBB). J Nanobiotechnology. 2015;13. doi:10.1186/s12951-015-0133-1
19. Enea M, Peixoto M, de Almeida P, et al. A Multiparametric Study of Gold Nanoparticles Cytotoxicity, Internalization and Permeability Using an in vitro Model of Blood-Brain Barrier. Influence of Size, Shape and Capping AgentNanotoxicology. 2019;1.
20. Kang CJ, Yt K. J Drug Target. 2019;27:8. doi:10.1080/1061186X.2018.1497037
21. Erdo F, Bors LA, Farkas D, Bajza A, Gizurarson S. Evaluation of intranasal delivery route of drug administration for brain targeting. Brain Res Bull. 2018;143:155. doi:10.1016/j.brainresbull.2018.10.009
22. Chauhan MB, Chauhan NB. Brain uptake of neurotherapeutics after intranasal delivery in mice. J Neurol Neurosurg. 2015;2. doi:10.19104/jnn.2015.91
23. Yeh YC, Creran B, Rotello VM. Gold nanoparticles: preparation, properties, and applications in bionanotechnology. Nanoscale. 2012;4:1871. doi:10.1039/C1NR11188D
24. Lasagna-reeves C, Gonzalez-romero D, Barria MA, et al. Bioaccumulation and toxicity of gold nanoparticles after repeated administration in mice. Biochem Biophys Res Commun. 2010;393:649. doi:10.1016/j.bbrc.2010.02.046
25. Lodato NJ, Rampersaud A, Waxman DJ. Impact of CAR agonist ligand TCPOBOP on mouse liver chromatin accessibility. Toxicol Sci. 2018;164:115. doi:10.1093/toxsci/kfy070
26. Jahan N, Talat H, Curry WT. Agonist OX40 immunotherapy improves survival in glioma-bearing mice and is complementary with vaccination with irradiated GM-CSF–expressing tumor cells. Neuro-Oncology. 2018;20:44. doi:10.1093/neuonc/nox125
27. Han X, Li Y, Xu Y, et al. Reversal of pancreatic desmoplasia by re-educating stellate cells with a tumour microenvironment-activated nanosystem. Nat Commun. 2018;9:3390. doi:10.1038/s41467-018-05906-x
28. Tsai SY, Segovia JA, Chang TH, et al. Regulation of TLR3 Activation by S100A9. J Immunol. 2015;195:4426. doi:10.4049/jimmunol.1500378
29. Velasco-aguirre C, Morales F, Gallardo-toledo E, et al. Peptides and proteins used to enhance gold nanoparticle delivery to the brain: preclinical approaches. Int J Nanomedicine. 2015;10:4919.
30. Sukumar UK, Bose RJC, Malhotra M, et al. Intranasal delivery of targeted polyfunctional gold–iron oxide nanoparticles loaded with therapeutic microRNAs for combined theranostic multimodality imaging and presensitization of glioblastoma to temozolomide. Biomaterials. 2019;218:119342. doi:10.1016/j.biomaterials.2019.119342
31. Antonios JP, Soto H, Everson RG, et al. PD-1 blockade enhances the vaccination-induced immune response in glioma. Jci Insight. 2016;1. doi:10.1172/jci.insight.87059
32. Tawbi HA, Forsyth PA, Algazi A, et al. Combined nivolumab and ipilimumab in melanoma metastatic to the brain. N Engl J Med. 2018;379:722. doi:10.1056/NEJMoa1805453
33. Rosenfeld MR, Chamberlain MC, Grossman SA, et al. A multi-institution Phase II study of poly-ICLC and radiotherapy with concurrent and adjuvant temozolomide in adults with newly diagnosed glioblastoma. Neuro-Oncology. 2010;12:1071. doi:10.1093/neuonc/noq071
34. Chuang JH, Lin TK, Tai MH, et al. Preferential involvement of mitochondria in Toll-like receptor 3 agonist-induced neuroblastoma cell apoptosis, but not in inhibition of cell growth. Apoptosis. 2012;17:335. doi:10.1007/s10495-011-0686-x
35. Aznar MA, Planelles L, Perez-olivares M, et al. Immunotherapeutic effects of intratumoral nanoplexed poly I:C. J Immunother Cancer. 2019;7:116. doi:10.1186/s40425-019-0568-2
36. Shir A, Ogris M, Wagner E, Levitzki A. EGF receptor-targeted synthetic double-stranded RNA eliminates glioblastoma, breast cancer, and adenocarcinoma tumors in mice. PLoS Med. 2006;3:e6. doi:10.1371/journal.pmed.0030006
37. Shen D, Guo CC, Wang J, et al. Interferon-α/β enhances temozolomide activity against MGMT-positive glioma stem-like cells. Oncol Rep. 2015;34:2715. doi:10.3892/or.2015.4232
38. Jacquelot N, Yamazaki T, Roberti MP, et al. Sustained Type I interferon signaling as a mechanism of resistance to PD-1 blockade. Cell Res. 2019;29(10):846–861.
39. Emami F, Banstola A, Vatanara A, et al. Doxorubicin and anti-PD-L1 antibody conjugated gold nanoparticles for colorectal cancer photochemotherapy. Mol Pharm. 2019;16:1184. doi:10.1021/acs.molpharmaceut.8b01157
40. Dykman LA, Khlebtsov NG. Immunological properties of gold nanoparticles. Chem Sci. 2017;8:1719. doi:10.1039/C6SC03631G
 © 2020 The Author(s). This work is published and licensed by Dove Medical Press Limited. The full terms of this license are available at https://www.dovepress.com/terms.php and incorporate the Creative Commons Attribution - Non Commercial (unported, v3.0) License.
By accessing the work you hereby accept the Terms. Non-commercial uses of the work are permitted without any further permission from Dove Medical Press Limited, provided the work is properly attributed. For permission for commercial use of this work, please see paragraphs 4.2 and 5 of our Terms.
© 2020 The Author(s). This work is published and licensed by Dove Medical Press Limited. The full terms of this license are available at https://www.dovepress.com/terms.php and incorporate the Creative Commons Attribution - Non Commercial (unported, v3.0) License.
By accessing the work you hereby accept the Terms. Non-commercial uses of the work are permitted without any further permission from Dove Medical Press Limited, provided the work is properly attributed. For permission for commercial use of this work, please see paragraphs 4.2 and 5 of our Terms.