")
Back to Journals » Cancer Management and Research » Volume 13
Intra-Tumor Heterogeneity of Colorectal Cancer Necessitates the Multi-Regional Sequencing for Comprehensive Mutational Profiling
Authors Guo S, Ye Y, Liu X, Gong Y, Xu M, Song L , Liu H
Received 14 August 2021
Accepted for publication 1 December 2021
Published 16 December 2021 Volume 2021:13 Pages 9209—9223
DOI https://doi.org/10.2147/CMAR.S327596
Checked for plagiarism Yes
Review by Single anonymous peer review
Peer reviewer comments 3
Editor who approved publication: Professor Seema Singh
Shaohua Guo,1,2,* Yumeng Ye,3,* Xinyi Liu,4 Yuan Gong,5 Mingyan Xu,4 Lele Song,4,6 Hongyi Liu1
1Department of General Surgery, The First Medical Center of the Chinese PLA General Hospital, Beijing, People’s Republic of China; 2Department of General Surgery, The Eighth Medical Center of the Chinese PLA General Hospital, Beijing, People’s Republic of China; 3Department of Experimental Pathology, Beijing Institute of Radiation Medicine, Beijing, People’s Republic of China; 4Department of Medical Division, HaploX Biotechnology, Shenzhen, People’s Republic of China; 5Department of Gastroenterology, The Second Medical Center of the Chinese PLA General Hospital, Beijing, People’s Republic of China; 6Department of Radiotherapy, The Eighth Medical Center of the Chinese PLA General Hospital, Beijing, People’s Republic of China
*These authors contributed equally to this work
Correspondence: Hongyi Liu
Department of General Surgery, The First Medical Center of the Chinese PLA General Hospital, Beijing, People’s Republic of China
Tel +86-10-66937533
Email [email protected]
Lele Song
Department of Radiotherapy, The Eighth Medical Center of the Chinese PLA General Hospital, Beijing, People’s Republic of China
Tel +86-13240149188
Email [email protected]
Background: The panorama and details of quantitative intratumor heterogeneity have not been fully investigated in colorectal cancer (CRC) patients with solitary lesion without distal metastasis, and its influences on sequencing interpretation and therapeutic strategies have not been explored.
Methods: Cancer tissues and matched blood from 70 sporadic CRC patients were collected and were divided into two cohorts. Four individual tissue biopsies were obtained from each of the 47 patients (multi-sample cohort). One random cancer tissue biopsy was obtained from each of the rest 23 patients (single-sample cohort). A 10 mL of blood was collected from all patients and the circulating cell-free DNA (cfDNA) was extracted. A 605-gene panel was used for targeted sequencing with tissue and paired blood.
Results: Mutational landscape revealed significantly higher mutational frequency in APC, CARD11 and CSMD3 in multi-sample cohort than single-sample cohort (P< 0.05). The number of mutations and the ratio of trunk, shared and branch mutations showed extensive heterogeneity in multi-sample cohort, and the percentage of trunk mutations in major driver genes, including APC, TP53 and KRAS, was higher than 70%. A total of 929 mutations were detected in tissue/blood in multi-sample group, with 921(99.1%) from tissue and 472(50.8%) from blood (464 common mutations,49.9%). In contrast, 394 mutations were detected in tissue/blood in single-sample group, with 231 (58.6%) from tissue and 219 (55.6%) from blood (56 common mutations, 11.9%). The number of mutations of major driver genes detected in tissue was higher than that in blood in the multi-sample cohort, while it was similar in the single-sample group. Quantification analysis revealed differential correlation between tissue and blood VAF in trunk, shared and branch mutations. Meanwhile, VAF of trunk mutations was significantly higher than shared mutations and branch mutations. VAF exhibited significant differences among distinct stages, locations, differentiation and sex status.
Conclusion: Characteristic extensive heterogeneity was revealed for solitary CRC without distal metastasis. Multi-regional biopsy was necessary for comprehensive mutation detection in CRC.
Keywords: colorectal cancer, multi-region sequencing, intra-tumor heterogeneity, circulating tumor DNA, ctDNA, APC, KRAS, TP53
Introduction
Colorectal cancer (CRC) is one of the major causes of cancer-related mortality worldwide. The genetic mutation landscape of CRC has been elucidated via several large-scale sequencing projects in recent years.1,2 Although CRC has been recognized to harbor driver gene mutations such as APC, TP53 and KRAS, a considerable intertumor and intratumor heterogeneity has been revealed.3–5 For better understanding of the carcinogenesis and development of CRC for treatment purpose, molecular subtypes based on tumor mutational landscape had been proposed, and different subtypes exhibited distinct prognosis.6,7 Previous studies proved that specific genetic alterations were associated with the prognosis of CRC patients, suggesting the value of tumor genetic test in guiding therapies.3–7 However, the intratumor heterogeneity (ITH) complicated the interpretation of genetic alterations, since intratumor high genetic variation, sampling bias and tumor evolution under selective pressure following therapy all contribute to inconsistent test results. Studies with multiple region sequencing have described the cancer evolution principles and developed possible theories for intratumor heterogeneity.3,5 However, accurate measurement of ITH in tumors is still a challenge technically and methodologically. This is mainly due to the complicated nature of ITH, in which variations of genetic alterations exist in time and space. Therefore, it is difficult to track the real-time changes of genetic alterations in tumors, and most ITH studies so far were cross-sectional. The advent of next-generation sequencing (NGS) technology not only facilitated the clinical diagnosis and therapy but also brought further challenges. Whether the targeted sequencing performed on resected tumor tissues and blood ctDNA could present complete mutational landscape still requires evidence from large samples. It is also doubtful whether a single sampling is enough for comprehensive examination of cancer genetic alterations.
Although intratumor heterogeneity has been investigated in cancer including CRC, the panorama and details of heterogeneity in solitary CRC with no distal metastasis have not been revealed. The quantitative measurement of heterogeneity in CRC has not been performed, and its relationship with blood detection results has not been revealed. To tackle these issues, we performed a cohort study to investigate the intratumor heterogeneity of solitary CRC with no distal metastasis with paired tissue and blood ctDNA samples using NGS-based panel sequencing techniques. By sequencing 188 multi-region tumor tissues from 47 CRC patients and comparing with 23 single-region tumor tissues from 23 CRC patients, we aimed to investigate the status of intratumor and intertumor heterogeneity in his population, and compare it with that from the blood cfDNA. We hope to provide evidence for the necessity of comprehensive multi-region tissue sequencing with blood cfDNA sequencing in companion diagnosis.
Materials and Methods
Ethics Approval
The study plans and protocols were submitted to the ethics committee of the Chinese PLA general hospital for review. Approval was granted by the ethics committee before the start of the clinical study. Since retrospective samples were used, written informed consent was waived for the study. All procedures and personnel training were carried out in accordance with guidelines and regulations for clinical studies of the hospital.
Patients and Samples
This study was a retrospective cohort study and was implemented in the Chinese PLA general hospital. Blood samples and frozen tumor tissues were collected in the hospital. Patient information was kept anonymous for confidentiality. The main inclusion criteria include 1) adults over 18 years old; 2) patients with complete clinicopathological information; 3) patients with confirmed diagnosis of CRC with no distal metastasis (stage I–III) by imaging examination (including endoscopy, ultrasound, MRI, CT, etc.) and/or subsequent pathological examination; 4) subjects should have only one measurable tumor (solitary CRC lesion) confirmed by imaging examination and subsequent surgery. The main exclusion criteria include 1) pregnant woman; 2) subjects with history of cancers other than CRC, or history of therapy on other cancers; 3) patients with multiple CRC lesions; 4) patients with no blood and/or tissue samples; 5) patients with incomplete clinical information. As a result, a total of 70 patients with stage I–III CRC were enrolled into the study. The patients were divided into two cohorts, including one multiple sample cohort containing 47 patients, in which four biopsies were obtained from the tumor tissue of each patient, and each biopsy was tested independently by a NGS-based 605 cancer-related gene panel test (gene list is provided in Supplementary Table 1). Four spatially isolated tumor specimens were obtained per patient with each primary tumor at least 0.5cm away from each other. For nearly round tumor tissues, four samples were collected from each of the four directions 0.5–1cm away from the center of the tissue. For long tumor tissues, four samples were collected at nearly identical distance based on the longitudinal distribution. The other single sample cohort included 23 patients, in which only one sample from the resected cancer tissue was tested. Blood samples from all patients were collected before any therapy and tested for ctDNA mutations using the same NGS panel. The clinicopathological information of all patients is presented in Table 1.
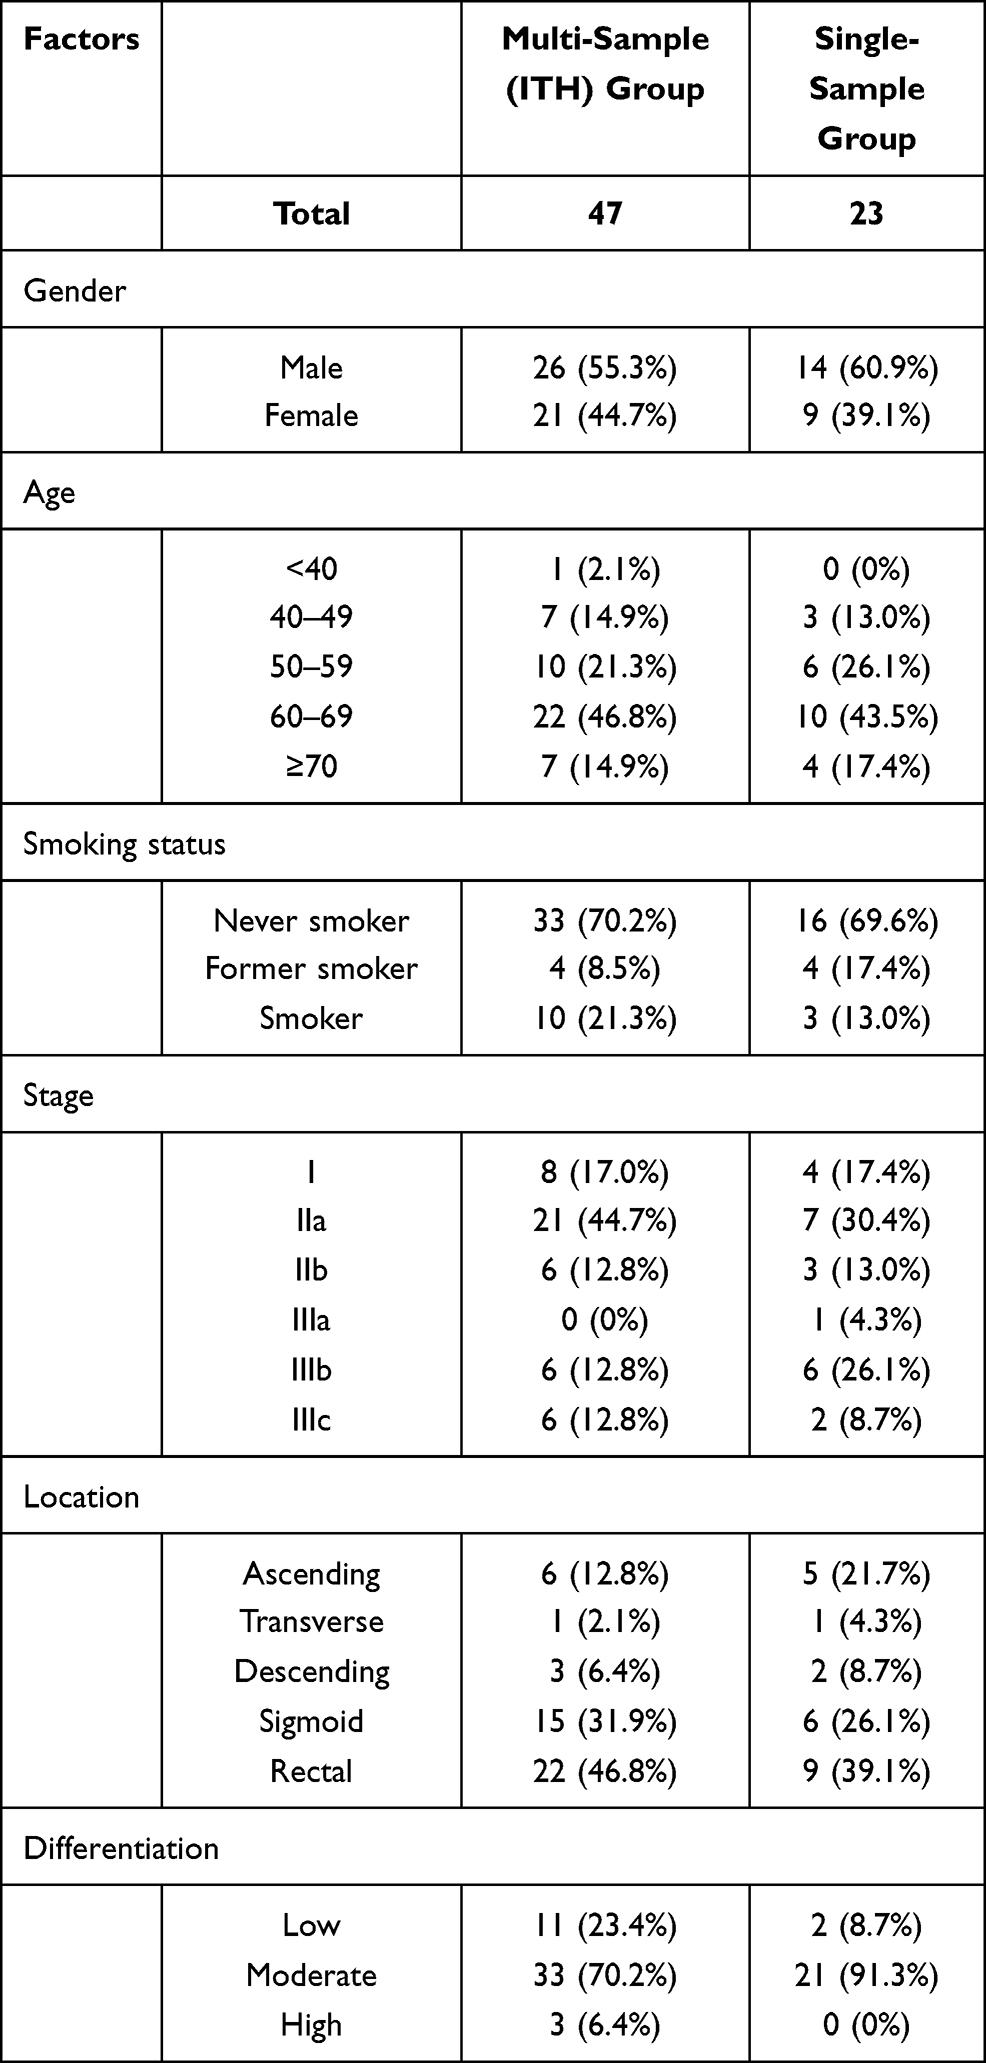 |
Table 1 Clinicopathological Information for Patients in This Study |
DNA Extraction and Quantification
DNA was extracted from tissue samples and circulating free DNA was extracted from blood samples. The extraction and quantification of DNA were performed following the methods previous described.8 In brief, tissue samples with tumor components >10% were used for NGS tests. DNA from frozen tissue samples was extracted using the EasyPure® Genomic DNA Kit (Beijing TransGen Biotech, Beijing, China). Blood samples from patients were collected in 10 mL tubes with anticoagulation reagent (EDTA). All blood samples were centrifuged at 1600g for 10 minutes and at 4 °C. The supernatants were further centrifuged at 10,000g for 10 min at 4°C. The plasma (supernatant) was harvested and stored at −80°C until further use, and the blood cells in the cell sediment were also collected separately. The circulating cell-free DNA (cfDNA) was extracted from 3.5 mL plasma using the QIAamp Circulating Nucleic Acid kit (Qiagen, Inc., Valencia, CA, USA) according to the manufacturers’ instructions. Genomic DNA from peripheral blood lymphocytes (PBLs) was extracted using the RelaxGene blood DNA system (Tiangen Biotech) and used as the normal control for mutation calling from cancer tissues and cfDNA. The quality control of the DNA was performed using Qubit 2.0 (Thermo Fisher Scientific) according to manufacturer’s instructions.
Library Construction and Sequencing
A NGS sequencing panel of 605 genes targeting the exome regions was used in this study. Library was constructed and sequencing was performed following the procedure previously described.8 In brief, DNA from tissue or blood samples was cleaved using a double-stranded DNA Fragmentase (Roche Sequencing and Life Science, Indianapolis, IL 46250, USA). DNA library was constructed using the KAPA Library preparation kit (KAPA Biosystems, Wilmington, MA 01887, USA). 7‑8 polymerase chain reaction (PCR) cycles, depending on the amount of DNA input, were performed on Pre‑LM‑PCR Oligos (Kapa Biosystems, Inc.) in 50μL reactions. A NGS panel targeting the exome regions of 605 genes was used to identify mutations. DNA sequencing was then performed on the Illumina Novaseq 6000 system according to the manufacturer’s instructions, with an average depth of 2000× for tissue DNA and 5000× for cfDNA. Data which meet the following criteria were chosen for subsequent analysis: the ratio of remaining data filtered by fastq in raw data is ≥85%; the proportion of Q30 bases is ≥85%; the ratio of reads on the reference genome is ≥85%; target region coverage ≥98%; The called somatic variants need to meet the following criteria: the read depth at a position is ≥20×; the variant allele frequency (VAF) is ≥2% for tissue DNA and ≥0.05% for cfDNA from blood; somatic-P value ≤ 0.01; strand filter ≥ 1. Analyses of genomic alterations including single nucleotide variants (SNVs) and insertion/deletion (Indels) were performed.
Statistical Analysis
Analysis of sequencing data was performed and relevant figures (Figure 1A and B and Figure 3A and B) were plotted using the ComplexHeatmaps’ package of the R software (https://www.r-project.org/). All charts and statistical analyses were performed using the GraphPad RRISM 5.0 software. The significance of difference between groups was determined by nonparametric test (Mann–Whitney U-test). The significance between ratios or percentage was determined by Chi-square test, adjusted Chi-square test or Fisher’s exact test. Data was represented with 95% confidence interval. *: P<0.05; **: P<0.01; ***: P<0.001.
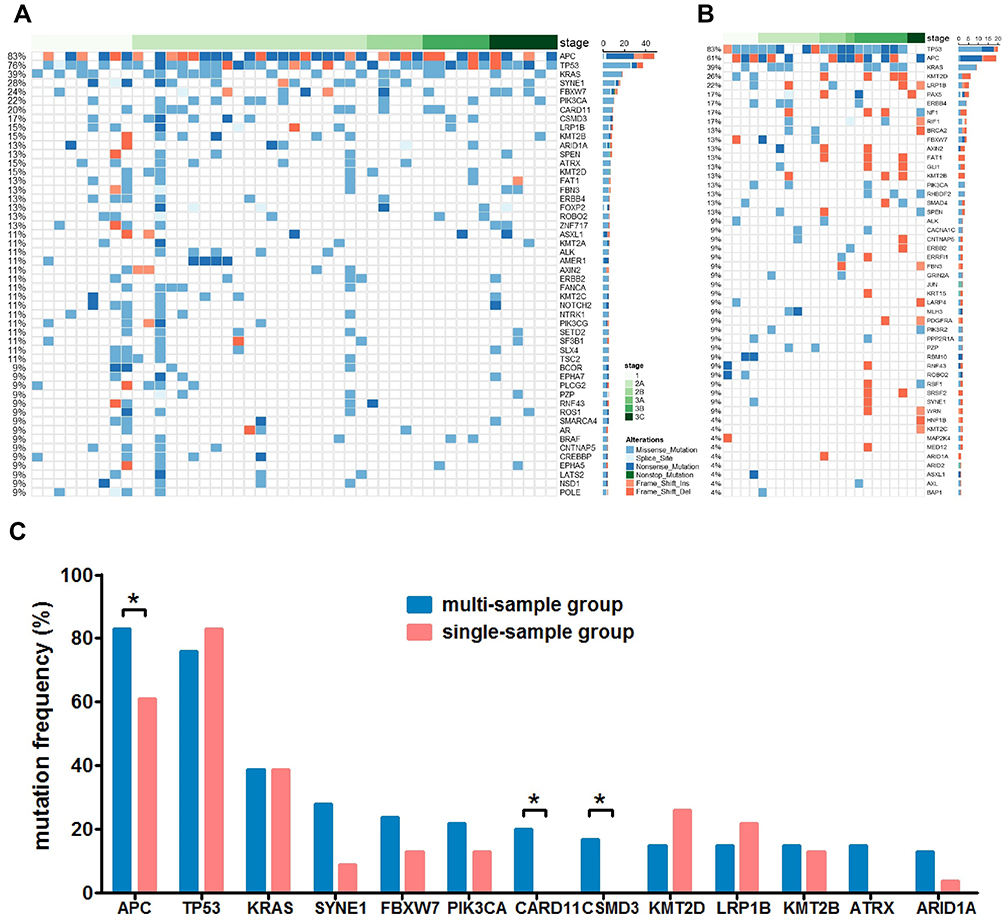 |
Figure 1 The mutational status of multi-sample group and single-sample group. Panel (A) the mutational status of the top 50 mutated genes of the multi-sample group. Genes with mutations from all samples are shown. Panel (B) the mutational status of the top 50 mutated genes of the single-sample group. Panel (C) a comparison of the mutation frequency of main driver genes between the multi- and the single-sample group. *P<0.05. |
Results
The Mutational Status and Intratumor Heterogeneity of Solitary Non-Metastatic CRC
In order to investigate the heterogeneity of solitary CRC and the effect of tissue sampling on mutation detection, the mutational landscape of the multi-sample cohort and the single-sample cohort was established first. Figure 1A and B show the mutational landscape of top 50 mutated genes of 47 CRC patients from the multi-sample cohort and 23 CRC patients from the single-sample cohort, respectively. It can be observed that APC, TP53, KRAS were the top three mutated genes for both cohorts, while the order of other less frequently mutated genes varied substantially. Further analyses on major high-frequency mutated driver genes showed that the mutational frequency of APC (Chi-square test, P=0.043), CARD11 (Fisher’s exact test, P=0.025) and CSMD3 (Fisher’s exact test, P=0.046) in the multi-sample cohort was significantly higher than that of the single-sample cohort, while no significant difference was found with other genes (Figure 1C). Particularly, the mutational rate of APC in the single-sample cohort was more than 20 percentage point lower than that of the multi-sample cohort. This observation suggested that not all driver gene mutations can be detected by single sampling, which may lead to underestimation of mutational frequency of major driver genes in CRC.
The heterogeneity of solitary CRC was further investigated by testing the four samples individually from the same patients in multi-sample cohort. Mutations were categorized into trunk, shared and branch mutations based on the presence of mutations among the four samples. Trunk mutation is defined as mutations present in all four samples, shared mutation is defined as mutations present in 2 or 3 out of four samples, and branch mutations is defined as mutations found in only one out of the four samples. Figure 2A shows the number of mutations and the ratio of trunk, shared and branch mutations in each sample of the 47 patients from the multi-sample cohort. The total number of mutations and the corresponding trunk, shared and branch mutation ratio are shown in Figure 2B. It can be seen from Figure 2A and B that extensive variation existed on the number of mutations across the patients, among whom four patients exhibited substantially higher number of mutations than other patients in this cohort, representing the subgroup of hypermutated CRC previous described1 (two patients exhibited hypermutation in the single-sample cohort). The percentage of trunk, shared and branch mutations for each patient is shown in Figure 2C (detailed percentage is included in Supplementary Table 2), in which huge variation can be observed across all patients. Four patients (the leftmost four columns) exhibited trunk mutations only without any shared or branch mutations, suggesting 100% homogeneity. In contrast, four patients (the rightmost four columns) exhibited no trunk mutations but only shared and branch mutations. Other patients exhibited both trunk and shared and/or branch mutations. Heterogeneity can also be found across genes. The percentage of trunk, shared and branch mutations for major mutated genes is shown in Figure 2D. High ratio of trunk mutations was found in high-frequency mutated genes. The percentage of trunk mutations for APC, TP53 and KRAS was 70.7%, 72.5% and 90.0%, respectively, while the percentage of trunk mutations varied a lot in other less frequently mutated genes. These results showed extensive variation in the ratio of potential clonal and subclonal mutations in non-metastatic solitary CRC, suggesting the presence of strong heterogeneity.
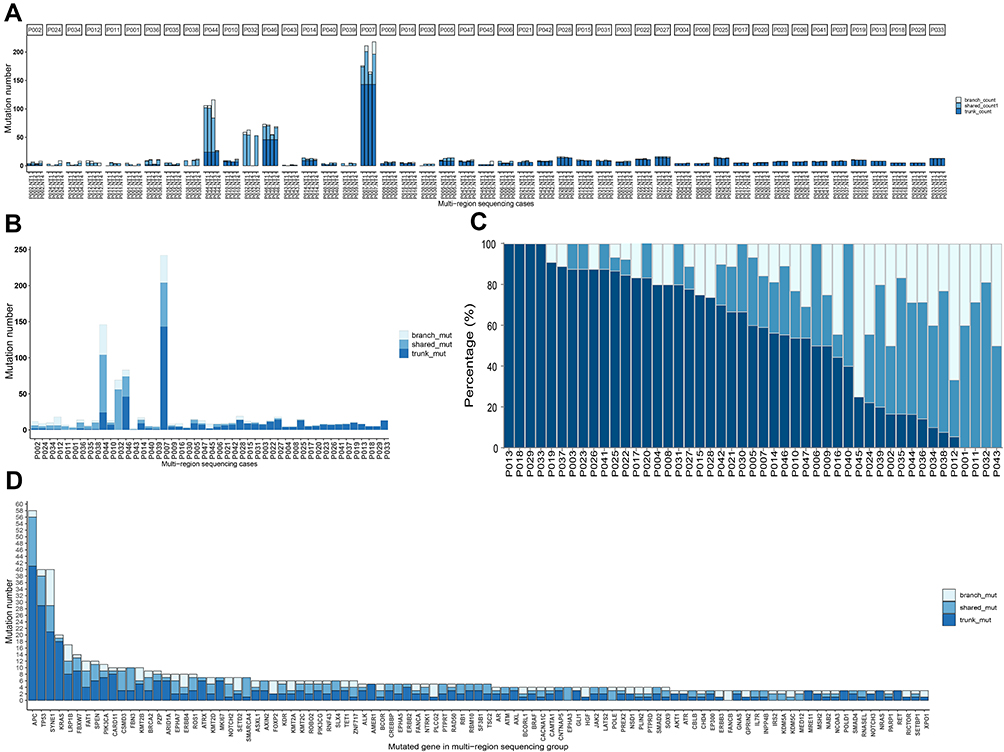 |
Figure 2 Stage I–III CRC exhibited high heterogeneity by measurement of mutational status from multiple samples of the same patient. Panel (A) the number of mutations categorized by trunk, shared and branch mutations for four samples from each patient. Panel (B) the number of mutations categorized by trunk, shared and branch mutations for each patients with four samples combined. Panel (C) the percentage of trunk, shared and branch mutations for each patient, ranked by the ratio of trunk mutations from high to low. Panel (D) the number of trunk, shared and branch mutations for individual genes, ranked by the total number of mutations. |
The Quantitative Tissue/Blood Mutational Concordance Reflected the Necessity of Multiple Tissue Biopsy
In order to investigate the concordance of tissue and blood test results in the background of tissue multiple or single sampling, and study the heterogeneity across tissue and blood, we established the mutational landscape of tissue and blood, ranked by the frequency of individual mutations. Figure 3A and B show the mutational landscape of top 20 mutated sites from tissue and blood in multi-sample and single-sample cohorts, respectively. Blood ctDNA from five patients in each cohort failed to pass the quality control and were therefore excluded from this analysis. It can be observed in the multi-sample cohort that the majority of mutations detected in blood were also detected in tissue, while many mutations were only detected in tissue but not blood (Figure 3A). In contrast, both tissue-unique and blood-unique mutations were detected in the single-sample cohort, while some common mutations can be observed (Figure 3B). The numbers of unique and common mutations are shown in Figure 3C and D for the multi-sample and single-sample cohorts, respectively. A total of 929 mutations were detected in tissue/blood in multi-sample group, in which 921 (99.1%) were detected in tissue and 472 (50.8%) were detected in blood, with 464 common mutations (49.9%) (Figure 3C). In contrast, a total of 394 mutations were detected in tissue/blood in single-sample group, in which 231 (58.6%) were detected in tissue and 219 (55.6%) were detected in blood, with 56 common mutations (11.9%) (Figure 3D). It appeared that mutations detected in tissue contained the majority of mutations detected in blood in the multi-sample cohort, with only 8 blood-unique mutations (Figure 3C), while only 56 common mutations were found in the single-sample cohort, and 175 and 163 mutations were unique for tissue and blood, respectively (Figure 3D). The cumulative numbers of mutations of key driver genes detected in tissue and blood, including APC, TP53, KRAS, PIK3CA, NRAS and BRAF were studied in detail and compared. In the multi-sample cohort (Figure 3E), substantially higher numbers of mutations were detected in tissue than blood for these genes, in which all mutations detected in blood were also detected in tissue. In contrast, similar numbers of mutations were detected in blood and tissue in the single-sample cohort (Figure 3F). Interestingly, no BRAF or EGFR mutations were detected by blood in both cohorts, suggesting the necessity of tissue test for BRAF and EGFR mutations. Substantially higher average numbers of mutations per patient were found in the multi-sample cohort for these genes. An average of 4.19, 2.72, 1.47, 0.74, 0.26, 0.17 and 0.09 mutations per patient was found for APC, TP53, KRAS, PIK3CA, NRAS, BRAF and EGFR, respectively in the multi-sample cohort, corresponding to an average of 1.91, 1.83, 0.78, 0.22, 0, 0.09 and 0.04 mutations in the single-sample cohort. However, no significant difference in the mean number of mutations was found in blood between the two cohorts. These observations indicated that tissue multi-sampling covered most mutations detected in blood and detected substantially higher number of mutations than single-sampling.
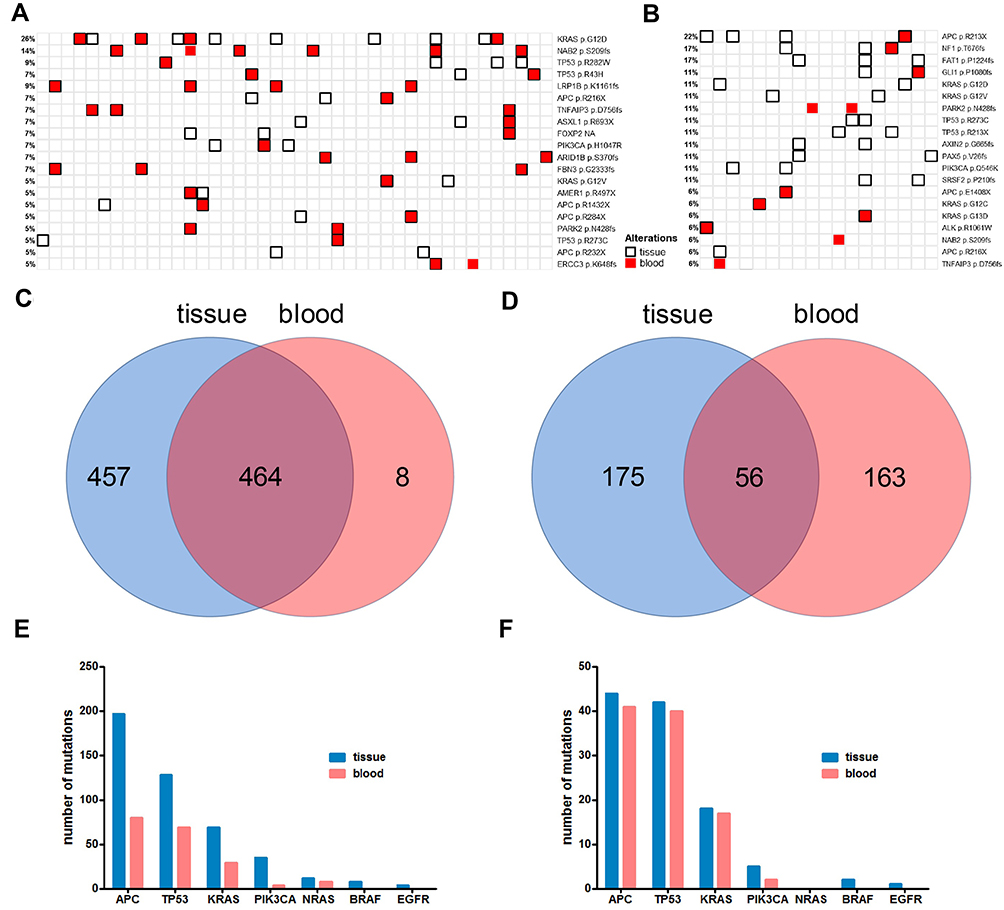 |
Figure 3 The concordance and correlation of tissue and blood ctDNA mutations of the multi- and single-sample groups. Panel (A) the concordance and correlation of mutations detected from tissue and blood from the multi-sample group (46 patients with paired tissue/blood sample). Panel (B) the concordance and correlation of mutations detected from tissue and blood from the single-sample group (18 patients with paired tissue/blood sample). Panel (C) Venn diagram shows the number of exclusive and common mutations of tissue and blood from the multi-sample group. Panel (D) Venn diagram shows the number of exclusive and common mutations of tissue and blood from the single-sample group. Panel (E) the number of mutations detected in tissue and blood in APC, TP53, KRAS, PIK3CA, NRAS, BRAF and EGFR from the multi-sample group. Panel (F) the number of mutations detected in tissue and blood in APC, TP53, KRAS, PIK3CA, NRAS, BRAF and EGFR from the single-sample group. |
We finally studied the correlation between tissue and blood VAF in terms of trunk, shared and branch mutations. It can be seen from the dot plot and Box and Whisker’s plot in Figure 4 that blood VAF was significantly lower than tissue VAF in trunk, shared and branch mutations. The mean VAF of trunk mutations in tissue (13.8%, 95% CI: 12.6%~15.0%) was 69.0 time higher than that in blood (0.20%, 95% CI: 0.17%~0.23%). The mean VAF of shared mutations in tissue (10.0%, 95% CI: 9.1%~10.9%) was 18.2 time higher than that in blood (0.55%, 95% CI:0.44%~0.68%). The mean VAF of branch mutations in tissue (5.4%, 95% CI:3.6%~8.2%) was 14.2 time higher than that in blood (0.38%, 95% CI:0.20%~0.73%). It appeared that trunk mutations had the highest tissue VAF but lowest blood VAF, showing the biggest difference in VAF between tissue and blood.
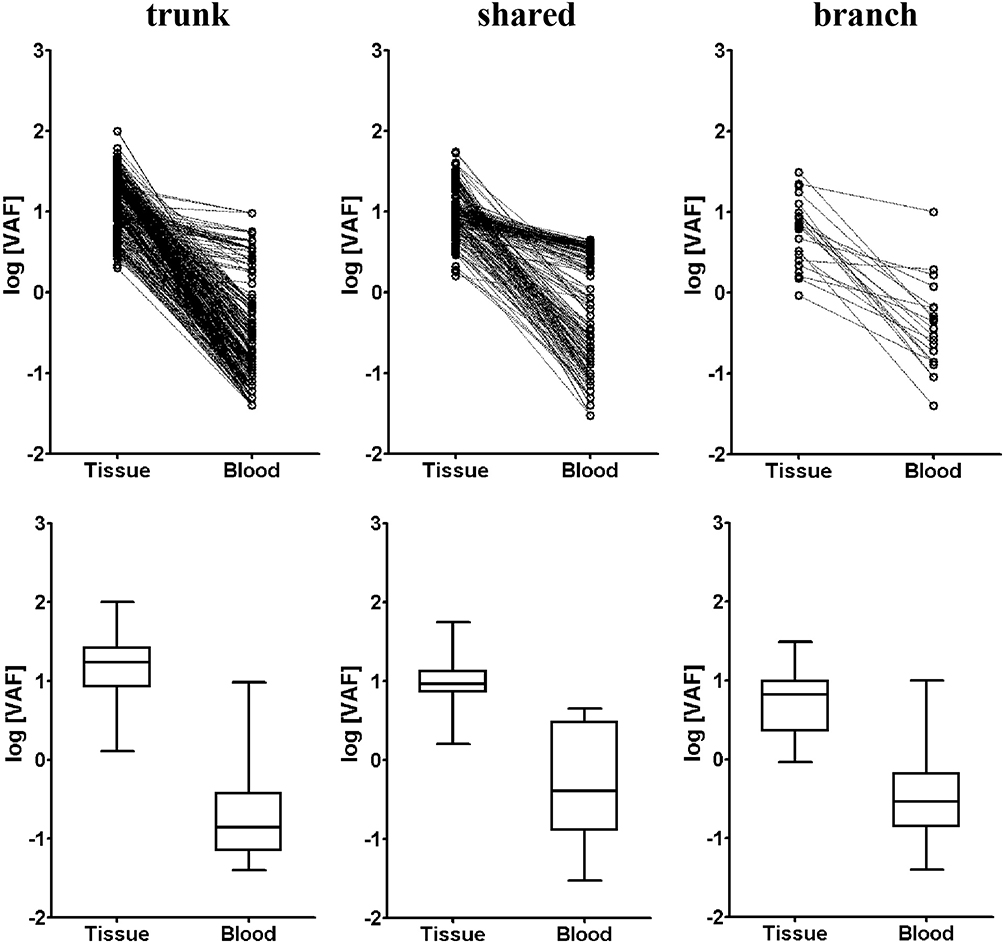 |
Figure 4 The variant allele frequency (VAF) for trunk, shared and branch mutations from tissue and blood of the multi-sample group. Dot plot (top row) and box and whisker’s plot (bottom row) are shown for trunk, shared and branch mutations of the multi-sample group. |
Interestingly, trunk mutations exhibited significantly higher VAF than shared mutations (P<0.001), and shared mutations exhibited significantly higher VAF than branch mutations in tissues (P<0.001) (Figure 5A leftmost panel). The trend was true for patients from stage I, II and III (Figure 5A). However, patients from stage II showed significantly higher VAF than stage I (P<0.001) and stage III patients (P<0.05) (Figure 5B leftmost panel), and this trend seemed to be true for shared and branch mutations, but not for trunk mutations (Figure 5B). These observations suggested that tissue VAF possibly correlated with the clonality of mutations in CRC, and stage II CRC could exhibit higher clonal expansion than stage I and III.
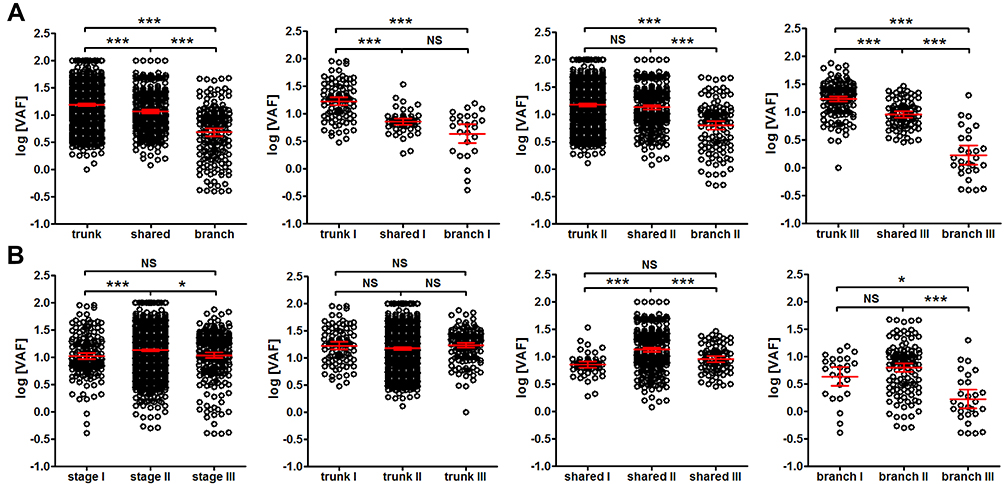 |
Figure 5 Comparison of VAF from trunk, shared and branch mutations of different stages. Panel (A) the comparison of VAF from trunk, shared and branch mutations for all patients (1st panel from the left) and for patients at stage I (2nd panel from the left), stage II (3rd panel from the left) and stage III (4th panel from the left). Panel (B) the comparison of VAF from all mutations (1st panel from the left), trunk (2nd panel from the left), shared (3rd panel from the left) and branch mutations (4th panel from the left) at each stage (stage I, II and III, as labeled in each panel). *P<0.05; ***P<0.001. Abbreviation: NS, not significant. |
We further compared the tissue mutation VAF among different clinicopathological conditions. The VAF difference between left-sided and right-sided cancer was examined first. Figure 6A shows that in left-sided cancer, trunk mutations had significantly higher VAF than shared mutations, and shared mutations exhibited significantly higher VAF than branch mutations. Similar trend can also be found in right-sided cancer. In trunk mutations, left-sided cancer exhibited significantly higher VAF than right-sided cancer, while the trend was reversed in shared mutations, and no difference was found in branch mutations (Figure 6B). These results indicated a distinct VAF distribution between left- and right-sided CRC.
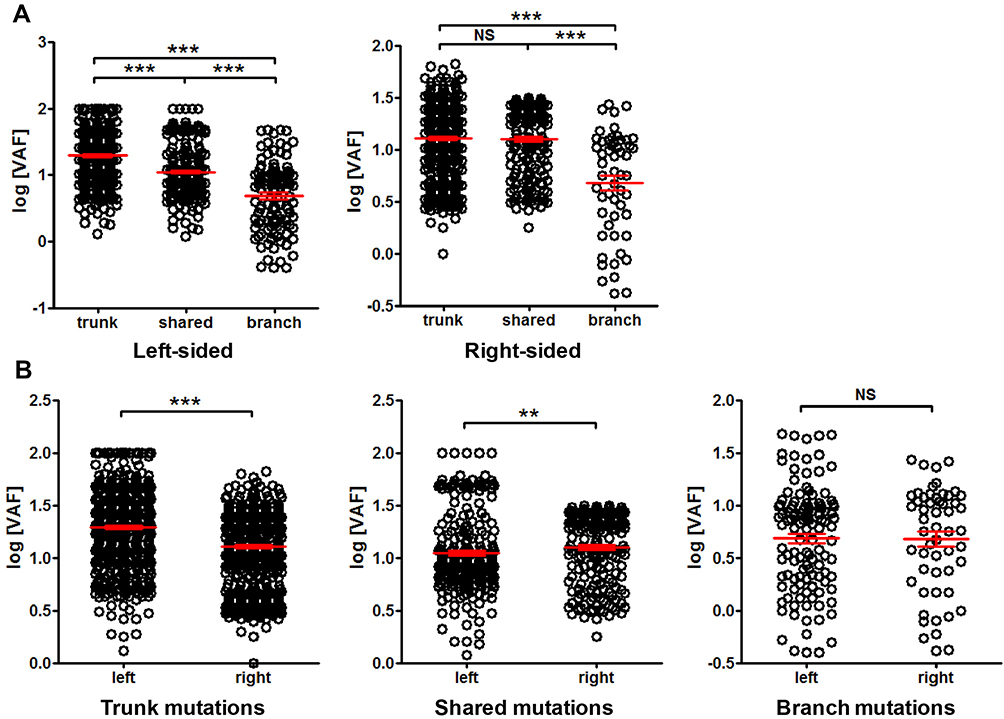 |
Figure 6 Comparison of mutation VAF between left-sided and right-sided cancer. Panel (A) comparison of trunk, shared and branch mutation VAF within left-sided or right-sided cancer. Panel (B) comparison of VAF between left- and right-sided cancer for trunk, shared and branch mutations, as indicated. **P<0.01; ***P<0.001. Abbreviation: NS, not significant. |
The VAF among different differentiation status was also compared. No difference among trunk, shared and branch mutation VAF was observed in highly differentiated cancer, while the VAF of trunk mutations was significantly higher than shared mutations, and the VAF of shared mutations was significantly higher than branch mutations in moderately differentiated cancer. Similar trend can be observed with poorly differentiated cancer (Figure 7A). Interestingly, highly differentiated cancer exhibited significantly lower VAF than moderately differentiated cancer, and moderately differentiated cancer exhibited significantly lower VAF than poorly differentiated cancer (Figure 7B). This observation suggested that mutation VAF was related to cancer differentiation status, and better differentiation correlated with lower VAF.
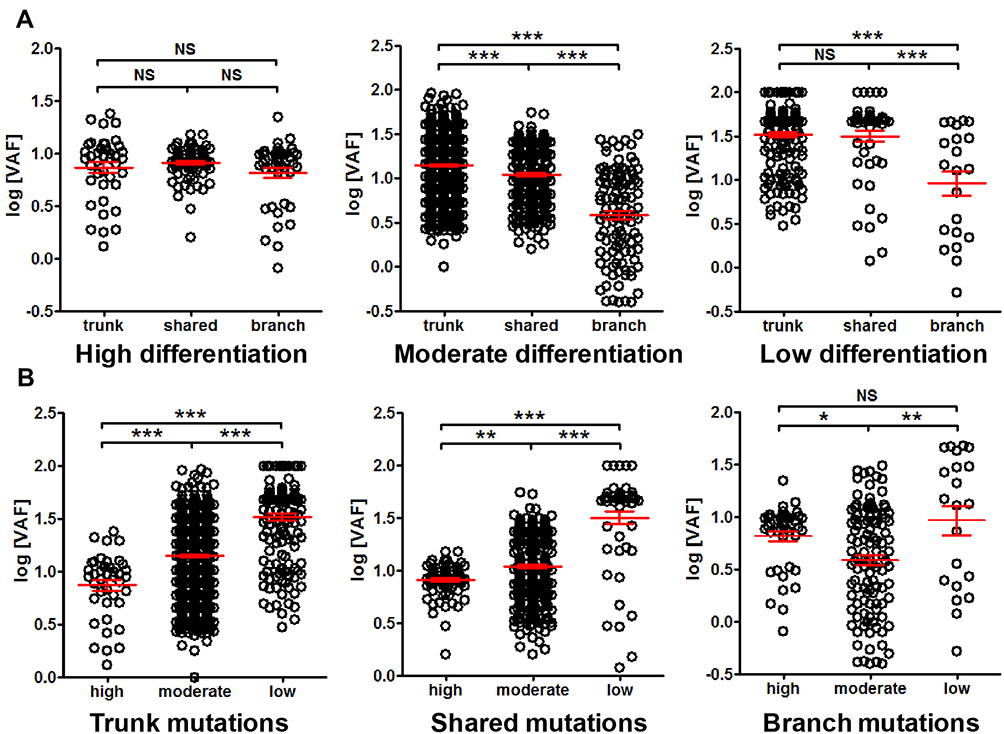 |
Figure 7 Comparison of mutation VAF among cancer differentiation status. Panel (A) comparison of trunk, shared and branch mutation VAF in high, moderate and low differentiated cancer. Panel (B) comparison of VAF of high, moderate and low differentiated cancers for trunk, shared and branch mutations, respectively. *P<0.05; **P<0.01; ***P<0.001. Abbreviation: NS, not significant. |
The difference between sexes was also investigated. No substantial difference in trend was found in male or female when trunk, shared and branch mutation VAF was compared (Figure 8A). No difference in VAF was found between male and female in trunk mutations, while significantly lower VAF was found in male than female when VAF of shared or branch mutations was compared (Figure 8B), suggesting sex-related difference in VAF.
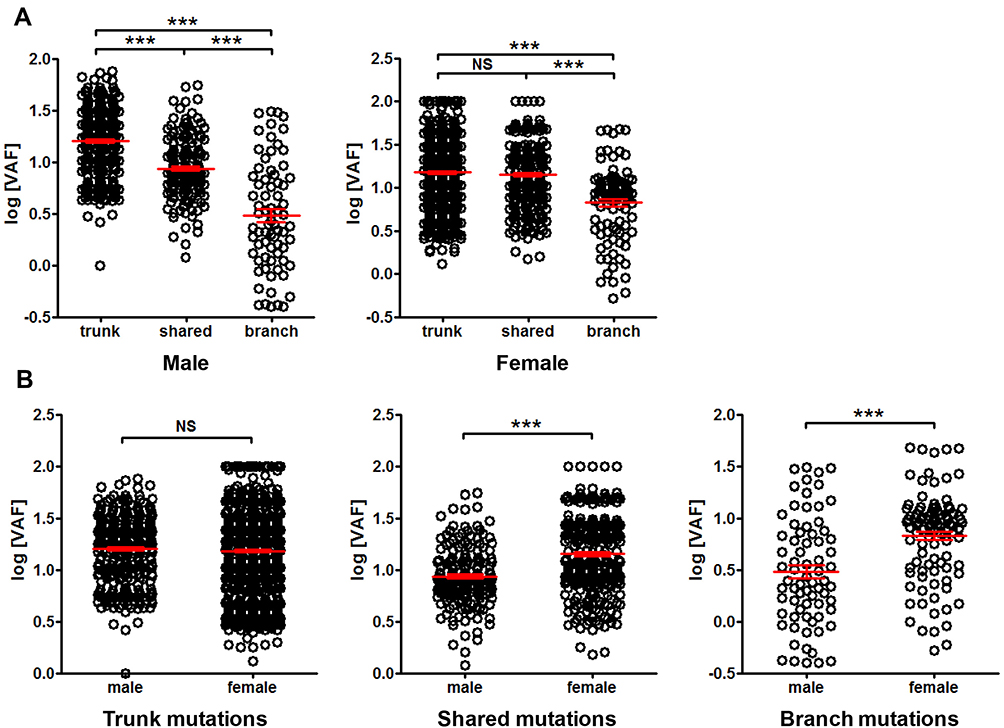 |
Figure 8 Comparison of mutation VAF between male and female patients. Panel (A) comparison of trunk, shared and branch mutation VAF in male or female. Panel (B) comparison of mutation VAF between male and female in trunk, shared and branch mutations, respectively. ***P<0.001. Abbreviation: NS, not significant. |
Discussion
The Status of Heterogeneity in CRC Tissues and Its Indication for Cancer Therapy and Prognosis
The heterogeneity of cancers has always been a focus in cancer research, and many studies have reported the status of heterogeneity in various cancers and its implications for targeted therapy.4,9 Heterogeneity of cancers at many levels has been investigated, including histological level, cellular level, protein level, RNA level and DNA level.4,9 It appears that the heterogeneity at DNA level is closely related to the therapy of CRC, as the application of targeted drugs for locally advanced and metastatic CRC requires the detection of mutational status of KRAS, NRAS, BRAF and PIK3CA, etc.10–12 More recently, the rapid development of immunotherapy expanded the requirement for precision test of tumor mutational burden (TMB), microsatellite instability (MSI), mismatch repair (MMR) and other response-related biomarkers.13–15 The rapid progress of therapeutic strategies facilitated the necessity for accurate test of tumor alteration status. Targeted therapy and immunotherapy may not be restricted to locally advanced and metastatic CRC, but may be expanded to earlier stages of CRC as adjuvant therapies, which requires accurate and reliable test for earlier stage CRC. Our study focused on CRC without distal metastasis to investigate the intratumor heterogeneity of solitary tumor, and aimed to clarify the status of mutational distribution and expansion at both clonal and subclonal levels, and to provide useful information for guiding mutation detection based on NGS test.
In this study, we performed individual sequencing tests with four tumor samples from each patient and found extensive heterogeneity. In order to eliminate the effect of distal metastasis in heterogeneity study, especially on blood mutation detection, patients with no distal metastasis were involved in this study. The heterogeneity can be reflected in several aspects. Firstly, the number of mutations per patient and per sample varied greatly. Hypermutated patients represented those with remarkably higher number of mutations than other patients. It was reported that 16% of CRC was found to be hypermutated, in which three-quarters had high MSI, usually with hypermethylation and MLH1 silencing, and one-quarter had somatic MMR gene or POLE mutations.1 These patients generally responded well to immunotherapy, since evidence has shown that locally advanced or metastatic CRC with MSI-H and high TMB exhibited better response.13–15 Therefore, immunotherapy can be recommended for these patients with dMMR/MSI-H, while chemotherapy and/or targeted therapy are recommended for those with pMMR/MSS. It is interesting that the very recent evidence suggested that immunotherapy may be used as perioperative neoadjuvant or adjuvant therapy,16,17 which may benefit those with earlier stage CRC.
Secondly, patients exhibited huge variation in the distribution and percentage of trunk, shared and branch mutations, from 100% trunk mutation to 0% trunk mutation among the four samples. Different ratio and distribution of actionable driver gene mutations may affect the response to therapy and induce distinct resistance or relapse.9 Therefore, comprehensive examination of baseline mutational status may be important for guiding the long-term therapy and monitoring of disease progress, not only for late-stage patients undergoing systematic therapy, but also for the early-stage patients undergoing neoadjuvant or adjuvant therapy. In this study, we identified a trend that trunk mutations exhibited higher VAF than shared mutations, and shared mutations exhibited higher VAF than branch mutations in stage I, II and III CRC, and stage II appeared to have higher overall VAF than stage I and III. These observations suggested that trunk mutations may be present in the majority of cancer cells, possibly due to the fact that the majority of trunk mutations were clonal mutations acquired before the cancer formation or at the early stage of cancer development. The higher VAF at stage II possibly suggested the active expansion of subclonal mutations. Interestingly, VAF exhibited not only stage-related differences, but also location, differentiation, and sex-related differences. Inconsistent trend was found in trunk, shared and branch mutations between left-sided and right-sided CRC, suggesting the presence of huge heterogeneity between the locations. It was well-known that right-sided cancer exhibited worse prognosis than left-sided cancer, and significantly higher VAF in shared mutations may suggest higher level of clonality for right-sided cancer. Meanwhile, a clear trend of correlation between worse differentiation and higher VAF was found, possibly suggesting that poor differentiation was related to high clonal evolution and high expansion of mutations. Indeed, poorly differentiated cancers generally exhibit bad prognosis, and clonality and diversity of mutations may also be indicators for the degree of malignancy and the prognosis of patients. No sex-related difference in mutational landscape of CRC has been found, however, our observation that female exhibited higher VAF in shared and branch mutations but not trunk mutations indicated a higher degree of clonal expansion of mutations in female. This could be due to the fact that higher ratio of female patients was found in stage II in this study, which exhibited higher VAF than stage I and III.
Multiple Tissue Biopsies with Blood Tests May Be Necessary for Comprehensive Assessment of Genetic Alterations for CRC Treatment Guidance
Theories of cancer heterogeneity and evolution have been established by several previous studies. The popular “big-bang” theory postulated that most driver gene (mainly including APC, KRAS, and TP53) mutations and most subclonal mutations occurred before or early after the malignant transition to carcinoma.18 Early expansion of clonal and subclonal mutations followed the Darwinian evolution model,19 while subsequent mutations that accumulated were functionally neutral. Neutral evolution can be developed possibly because the cancer growth broke through the evolutionary bottleneck that established all driver clonal mutations, and branches into numerous subclones in neutral manner.3 As a result, mutations in APC, KRAS and TP53 were present in the vast majority of cancer cells (clonal), whereas mutations in BRAF and PIK3CA were present in only a subset of cancer cells (subclonal).20 Our observations in solitary CRC with no distal metastasis appeared to support the “big-bang” theory and the Darwinian and neutral evolution models.
Furthermore, mutations detected in blood appeared to have huge heterogeneity compared with tissue. We found that for stage I–III CRC patients, blood ctDNA test was not potent enough for detecting all possible actionable mutations compared with multi-regional tissue test, but appeared to be comparable with and complementary to single-sample tissue test. The average number of mutations detected per patient from blood and single-sample tissue was still significantly less than that from multi-regional tissue detection. Previous studies suggested that mutations appeared in tissue may not be detected in blood due to limited detection capability, low VAF and distinct tumor growth pattern, while mutations appeared in blood may not be detected in tissue due to tissue heterogeneity.21–23 This makes it difficult to detect all mutations by merely testing tissue or blood, but testing both tissue and blood. This was supported by our findings that even the mutation frequency from multiple and single sample tests showed difference in APC, CARD11 and CSMD3, not to mention the detection of individual mutation sites in APC, TP53, KRAS, PIK3CA, NRAS, BRAF and EGFR. Our four-sample test proved that mutations could be maximally detected if enough tissue sampling was performed. Together with previous observations, our data suggested that a single test of tissue or blood or combined was still not sufficient for detecting all possible actionable mutations, while multi-regional tissue test may be the choice for more comprehensive detection.
The detection of cfDNA mutations by NGS method faces some challenges. One of them is the contamination of cfDNA by genomic DNA from white blood cells or circulating tumor cells. By performing one centrifugation at 1600g for 10 min and subsequent centrifugation at 10000g for 10 min (method section), all cell fractions should be spun down and no cell components should be in the plasma. Therefore, sequencing of plasma cfDNA (ctDNA) only examines the cell-free DNA, but not the DNA from white blood cells or tumor cells in the circulation. Currently, the cfDNA sequencing method is widely used in research and clinical tests. Furthermore, cfDNA sequencing aims at cfDNA with average length of 160 bp. The length of genomic DNA from blood cells or circulating tumor cells is far longer than this and is excluded during cfDNA quality control before library construction. Therefore, current NGS procedures minimize the possibility of genomic DNA contamination in cfDNA sequencing.
People may doubt about the feasibility of multiple tissue sampling, since four deep targeted sequencing for each patient may be costly, and redundant information on non-actionable mutations may not be helpful for patients. We suppose that this argument may be partially reasonable for potential candidates of TKI-related therapies. However, in the background of immunotherapy (such as the requirement for TMB) and with the growing demand for response monitoring, high throughput tests with gene panels are becoming more and more popular and can provide useful information for timely strategy selection and prognosis prediction. With the rapid decline of NGS costs, package of multiple NGS panel tests involving both tissue and blood tests can be offered to patients as an option for companion diagnosis, response assessment and monitoring.
Our observations in this study were comparable with previous studies on similar population using the similar methods. Similar degree of heterogeneity (ie similar somatic mutational landscape and similar ratio and distribution of trunk, shared and branch mutations) was reported in our study compared with several previous studies.3,24,25 Our study highlighted the differences between multiple tissue biopsies and single tissue biopsy, and directly compared the results between tissue and blood tests. These comparisons provided strong evidence for the necessity of comprehensive mutation detection by multiple tissue sequencing and blood cfDNA sequencing.
In conclusion, we found extensive intratumoral heterogeneity for solitary CRC with no distal metastasis, which was mainly reflected in the number of mutations and the distribution and ratio of trunk, shared and branch mutations, supporting the current theory for early tumor evolution. Our observations also supported routine multiple sampling of cancer tissue for comprehensive mutation profiling to facilitate the selection of therapeutic strategies.
Data Sharing Statement
The datasets used and/or analysed during the current study are available from the corresponding author on reasonable request. Please contact Dr Lele Song for dataset availability issues.
Ethics Statement
This study was approved by the Chinese PLA General Hospital Ethics Committee and conducted in accordance with the hospital’s guiding principles. Written informed consent and consent to publication were waived for the use of the clinical samples as retrospective samples were used in this study, and the fact that the study only revealed statistical data without disclosing any personal, clinical or sequencing data. Patient data were kept confidential, and the study was performed in compliance with the Declaration of Helsinki.
Author Contributions
All authors made a significant contribution to the work reported, whether that is in the conception, study design, execution, acquisition of data, analysis and interpretation, or in all these areas; took part in drafting, revising or critically reviewing the article; gave final approval of the version to be published; have agreed on the journal to which the article has been submitted; and agree to be accountable for all aspects of the work.
Funding
This study was supported by the Special Funds for Strategic Emerging Industry Development of Shenzhen (Grant Number 20170922151538732), and the Science and Technology Project of Shenzhen (Grant Number JSGG20180703164202084). This study was also supported by the Special health research projects of 2019 funded by the Chinese PLA general hospital, under the project “Screening of early-stage CRC and adenoma by combined methylated SEPT9 and FIT assays in military aging population” (NLBJ-2019003). All funders did not participate in the study design, study implementation, data collection, data analysis, data interpretation and manuscript writing of the study.
Disclosure
Xinyi Liu, Mingyan Xu and Lele Song were employees of HaploX Biotechnology, who performed the NGS sequencing and data analysis in this study. Other authors declare no conflicts of interest in this study.
References
1. Cancer Genome Atlas Network. Comprehensive molecular characterization of human colon and rectal cancer. Nature. 2012;487(7407):330–337. doi:10.1038/nature11252.
2. Alexandrov LB, Nik-Zainal S, Wedge DC, et al. Signatures of mutational processes in human cancer. Nature. 2013;500(7463):415–421. doi:10.1038/nature12477
3. Saito T, Niida A, Uchi R, et al. A temporal shift of the evolutionary principle shaping intratumor heterogeneity in colorectal cancer. Nat Commun. 2018;9(1):2884. doi:10.1038/s41467-018-05226-0
4. Punt CJ, Koopman M, Vermeulen L. From tumour heterogeneity to advances in precision treatment of colorectal cancer. Nat Rev Clin Oncol. 2017;14(4):235–246. doi:10.1038/nrclinonc.2016.171
5. Uchi R, Takahashi Y, Niida A, et al. Integrated multiregional analysis proposing a new model of colorectal cancer evolution. PLoS Genet. 2016;12(2):e1005778. doi:10.1371/journal.pgen.1005778
6. Bramsen JB, Rasmussen MH, Ongen H, et al. Molecular-subtype-specific biomarkers improve prediction of prognosis in colorectal cancer. Cell Rep. 2017;19(6):1268–1280. doi:10.1016/j.celrep.2017.04.045
7. Phipps AI, Limburg PJ, Baron JA, et al. Association between molecular subtypes of colorectal cancer and patient survival. Gastroenterology. 2015;148(1):77–87.e2. doi:10.1053/j.gastro.2014.09.038
8. Cao H, Liu X, Chen Y, et al. Circulating tumor DNA is capable of monitoring the therapeutic response and resistance in advanced colorectal cancer patients undergoing combined target and chemotherapy. Front Oncol. 2020;10:466.
9. Kyrochristos ID, Roukos DH. Comprehensive intra-individual genomic and transcriptional heterogeneity: evidence-based Colorectal Cancer Precision Medicine. Cancer Treat Rev. 2019;80:101894. doi:10.1016/j.ctrv.2019.101894
10. Evaluation of Genomic Applications in Practice and Prevention (EGAPP) Working Group. Recommendations from the EGAPP Working Group: can testing of tumor tissue for mutations in EGFR pathway downstream effector genes in patients with metastatic colorectal cancer improve health outcomes by guiding decisions regarding anti-EGFR therapy? Genet Med. 2013;15(7):517–527. doi:10.1038/gim.2012.184.
11. Therkildsen C, Bergmann TK, Henrichsen-Schnack T, Ladelund S, Nilbert M. The predictive value of KRAS, NRAS, BRAF, PIK3CA and PTEN for anti-EGFR treatment in metastatic colorectal cancer: a systematic review and meta-analysis. Acta Oncol. 2014;53(7):852–864. doi:10.3109/0284186X.2014.895036
12. De Roock W, Claes B, Bernasconi D, et al. Effects of KRAS, BRAF, NRAS, and PIK3CA mutations on the efficacy of cetuximab plus chemotherapy in chemotherapy-refractory metastatic colorectal cancer: a retrospective consortium analysis. Lancet Oncol. 2010;11(8):753–762. doi:10.1016/S1470-2045(10)70130-3
13. Schrock AB, Ouyang C, Sandhu J, et al. Tumor mutational burden is predictive of response to immune checkpoint inhibitors in MSI-high metastatic colorectal cancer. Ann Oncol. 2019;30(7):1096–1103. doi:10.1093/annonc/mdz134
14. Parikh AR, He Y, Hong TS, et al. Analysis of DNA damage response gene alterations and tumor mutational burden across 17,486 tubular gastrointestinal carcinomas: implications for therapy. Oncologist. 2019;24(10):1340–1347. doi:10.1634/theoncologist.2019-0034
15. Picard E, Verschoor CP, Ma GW, Pawelec G. Relationships between immune landscapes, genetic subtypes and responses to immunotherapy in colorectal cancer. Front Immunol. 2020;11:369. doi:10.3389/fimmu.2020.00369
16. Chalabi M, Fanchi LF, Dijkstra KK, et al. Neoadjuvant immunotherapy leads to pathological responses in MMR-proficient and MMR-deficient early-stage colon cancers. Nat Med. 2020;26(4):566–576. doi:10.1038/s41591-020-0805-8
17. Cohen R, Shi Q, André T. Immunotherapy for early stage colorectal cancer: a glance into the future. Cancers (Basel). 2020;12(7):1990. doi:10.3390/cancers12071990
18. Sottoriva A, Kang H, Ma Z, et al. A Big Bang model of human colorectal tumor growth. Nat Genet. 2015;47(3):209–216. doi:10.1038/ng.3214
19. Graham TA, Sottoriva A. Measuring cancer evolution from the genome. J Pathol. 2017;241(2):183–191. doi:10.1002/path.4821
20. Normanno N, Rachiglio AM, Lambiase M, et al. Heterogeneity of KRAS, NRAS, BRAF and PIK3CA mutations in metastatic colorectal cancer and potential effects on therapy in the CAPRI GOIM trial. Ann Oncol. 2015;26(8):1710–1714. doi:10.1093/annonc/mdv176
21. Maron SB, Chase LM, Lomnicki S, et al. Circulating tumor DNA sequencing analysis of gastroesophageal adenocarcinoma. Clin Cancer Res. 2019;25(23):7098–7112. doi:10.1158/1078-0432.CCR-19-1704
22. Li G, Pavlick D, Chung JH, et al. Genomic profiling of cell-free circulating tumor DNA in patients with colorectal cancer and its fidelity to the genomics of the tumor biopsy. J Gastrointest Oncol. 2019;10(5):831–840. doi:10.21037/jgo.2019.05.05
23. Zhang Y, Chang L, Yang Y, et al. Intratumor heterogeneity comparison among different subtypes of non-small-cell lung cancer through multi-region tissue and matched ctDNA sequencing. Mol Cancer. 2019;18(1):7. doi:10.1186/s12943-019-0939-9
24. Wu H, Zhang XY, Hu Z, et al. Evolution and heterogeneity of non-hereditary colorectal cancer revealed by single-cell exome sequencing. Oncogene. 2017;36(20):2857–2867. doi:10.1038/onc.2016.438
25. Liu M, Liu Y, Di J, et al. Multi-region and single-cell sequencing reveal variable genomic heterogeneity in rectal cancer. BMC Cancer. 2017;17(1):787. doi:10.1186/s12885-017-3777-4
 © 2021 The Author(s). This work is published and licensed by Dove Medical Press Limited. The full terms of this license are available at https://www.dovepress.com/terms.php and incorporate the Creative Commons Attribution - Non Commercial (unported, v3.0) License.
By accessing the work you hereby accept the Terms. Non-commercial uses of the work are permitted without any further permission from Dove Medical Press Limited, provided the work is properly attributed. For permission for commercial use of this work, please see paragraphs 4.2 and 5 of our Terms.
© 2021 The Author(s). This work is published and licensed by Dove Medical Press Limited. The full terms of this license are available at https://www.dovepress.com/terms.php and incorporate the Creative Commons Attribution - Non Commercial (unported, v3.0) License.
By accessing the work you hereby accept the Terms. Non-commercial uses of the work are permitted without any further permission from Dove Medical Press Limited, provided the work is properly attributed. For permission for commercial use of this work, please see paragraphs 4.2 and 5 of our Terms.