")
Back to Journals » Diabetes, Metabolic Syndrome and Obesity » Volume 12
Interaction between dietary patterns and TCF7L2 polymorphisms on type 2 diabetes mellitus among Uyghur adults in Xinjiang Province, China
Authors Cai J, Zhang Y, Nuli R, Zhang Y, Abudusemaiti M, Kadeer A, Tian X, Xiao H
Received 22 October 2018
Accepted for publication 22 December 2018
Published 14 February 2019 Volume 2019:12 Pages 239—255
DOI https://doi.org/10.2147/DMSO.S191759
Checked for plagiarism Yes
Review by Single anonymous peer review
Peer reviewer comments 3
Editor who approved publication: Dr Konstantinos Tziomalos
Junxiu Cai,1,2,* Yan Zhang,3,* Rebiya Nuli,4 Yangyi Zhang,5 Manfutong Abudusemaiti,5 Aizhatiguli Kadeer,6 Xiaoli Tian,5 Hui Xiao5
1Department of Occupational and Environmental Health, School of Public Health, Xinjiang Medical University, Urumqi 830011, Xinjiang Uygur Autonomous Region, China; 2Medical Department, Fifth Affiliated Hospital, Xinjiang Medical University, Urumqi 830011, Xinjiang Uygur Autonomous Region, China; 3Department of Pathology, Basic Medical Science Institute, International Education College, Xinjiang Medical University, Urumqi 830011, Xinjiang Uygur Autonomous Region, China; 4Department of Human Parasitology, Basic Medical Science Institute, Xinjiang Medical University, Urumqi 830011, Xinjiang Uygur Autonomous Region, China; 5Department of Nutrition and Food Hygiene, School of Public Health, Xinjiang Medical University, Urumqi 830011, Xinjiang Uygur Autonomous Region, China; 6Department of Epidemiology and Statistics, School of Public Health, Xinjiang Medical University, Urumqi 830011, Xinjiang Uygur Autonomous Region, China
*These authors contributed equally to this work
Purpose: This study aimed to characterize dietary patterns in the Uyghur population and examined the relationship between dietary pattern, TCF7L2 single-nucleotide polymorphisms (SNPs), and the risk of type 2 diabetes mellitus (T2DM).
Patients and methods: Dietary patterns were defined using factor analysis, and associations between dietary patterns were evaluated using multivariate logistic regression analyses. Genotyping of seven SNPs of TCF7L2 (rs11196205, rs12255372, rs12573128, rs4506565, rs7895340, rs7901695, and rs7903146) was conducted, and the association between these seven SNPs and the risk of T2DM was evaluated. Interactions between SNPs, homeostasis model assessment-insulin resistance, and dietary patterns were also analyzed.
Results: A total of 828 participants were enrolled in this study, including 491 people with T2DM and 337 healthy controls. Five dietary patterns were defined, and the results indicated that the “fruit” and “vegetables” dietary patterns were associated with a significant decrease in the risk of T2DM, whereas the “meats” and “grains” dietary patterns were associated with an increased risk of T2DM. Moreover, the “dairy product” dietary pattern showed no association with the risk of T2DM. Furthermore, our results revealed that the TCF7L2 SNP, rs12573128, is associated with an increased risk of T2DM. SNPs rs4506565 and rs7903146 significantly interacted with dietary pattern.
Conclusion: Our studies suggest that dietary pattern and genetic polymorphisms of TCF7L2 are associated with the development of T2DM in the Uyghur population of China.
Keywords: type 2 diabetes mellitus, dietary patterns, TCF7L2, polymorphism, Uyghur
Introduction
Type 2 diabetes mellitus (T2DM) is a chronic metabolic disorder that is characterized by high blood sugar, insulin resistance, and a relative lack of insulin.1 Although T2DM is not life-threatening, it can cause numerous complications and reduce the quality of life.2,3 The morbidity rate due to T2DM is also growing every year. T2DM is the result of interactions between genetic and lifestyle factors.4 Therefore, it is important to explore population-specific genetic factors and lifestyle risk factors in the context of T2DM.
Dietary patterns, which reflect the complexity of dietary intake, are considered an alternative method to human diet alone for investigating the association between diet and risk of disease.5 Although there have been studies on the association between dietary pattern and the risk of T2DM in different countries,6–10 data for the Chinese population are limited, and the majority of them were focused on eastern Chinese and Han nationalities.6,11,12 Uyghur people live primarily in Xinjiang Province of China and have their own genetic background, lifestyle, and dietary habits.13,14 They eat a lot of carbohydrates, including pasta, naan, noodles, and roasted buns. Milk and dairy products, beef, and mutton are also consumed a lot. These significant differences between the dietary patterns of the Uyghur and Han populations mean that there is a need to investigate the association between dietary pattern and the risk of T2DM in the Uyghur population.
Several studies have been conducted to assess the relationship between genetic risk factors and T2DM risk in Chinese minority ethnicities, including the Uyghur,15,16 Hui,17 and Dong18 ethnic populations. TCF7L2, formerly known as TCF4, is a member of the TCF family that affects the expression of pro-glucagon and consequently blood glucose regulation.19 In previous studies, strong associations between TCF7L2 single-nucleotide polymorphisms (SNPs) and the risk of T2DM have been found in different ethnic populations.20–24 However, only one study was conducted on Uyghur people, and only two TCF7L2 SNPs (rs12255372 and rs7901695) were investigated in that study.14
Recent studies have begun to pay attention to the relationship between genetic factors and lifestyle factors, such as diet and physical activity, on the risk of T2DM. The current study aimed to define the dietary patterns for the Uyghur population and to examine the association between dietary patterns and risk of T2DM. We also examined the polymorphisms of TCFL2 gene in the Uyghur population and sought to determine whether the association between genetic variants of TCFL2 and T2DM risk is affected by the dietary pattern.
Patients and methods
Study population
This study was conducted on Uyghur national residents in Urumqi, the capital of Xinjiang Province, China from November 2016 to February 2018. Participants were selected from six Community Health Centers in Tianshan and Saybagh districts using a stratified cluster random-sampling method. Physical examination records of the community health centers were reviewed, and individuals who conformed to the following inclusion criteria were selected: 1) fasting plasma glucose (FPG) ≥7.0 mmol/L but without T2DM history; 2) no diagnosis of DM or other diseases that could affect their dietary habits; 3) no diseases related to blood glucose and insulin metabolism, such as abnormal thyroid function and severe obesity, and no other severe diseases of the gastrointestinal tract, cardiovascular, kidney, liver, or pancreas; 4) no history of taking drugs that affect blood glucose metabolism; and 5) Uyghur nationality. Participants with mental disease, who had difficulty in moving or communicating, and women who were pregnant or breast-feeding were also excluded. Selected participants were invited to our center and an oral glucose tolerance test (OGTT) was conducted to confirm the diagnosis. T2DM was defined using the diagnostic criteria of American Diabetes Association standards 2016 (FPG ≥7.0 mmol/L and OGTT ≥11.1 mmol/L).25 For the normal control group, participants were selected from people who were assessed during the same physical examination period. This study was approved by the Ethics Committee of the Fifth Affiliated Hospital of Xinjiang Medical University. It was conducted in accordance with the Declaration of Helsinki, and all participants provided written informed consent to be included in this study.
Dietary intake investigation
In accordance with the dietary characteristics of Uyghur national residents in Urumqi, a specific semi-quantitative food frequency questionnaire (SQFFQ), comprising 84 items in 17 food groups (Table 1), was designed. The validity and reliability of the SQFFQ was evaluated via a preliminary survey conducted within the same region from September 2016 to October 2016. One hundred and fifty participants who had undergone physical examination were randomly selected, and three 24-hour dietary reports (two working days and one rest day) were compared with the results of the SQFFQ. After eliminating incomplete data, results from 137 participants were analyzed. The average Pearson correlation coefficients (PCCs) between the SQFFQ and dietary reports ranged from 0.19 to 0.83, with an average value of 0.45 for the major food groups. Results showed that the SQFFQ provided a reasonably valid measurement of dietary intakes. The interscorer reliability of the SQFFQ was evaluated after 4 weeks. Ninety-eight of the 110 participants completed the test. Pearson correlation analysis showed that the PCCs between dietary intake of all food groups from the second survey and those from the first survey ranged from 0.52 to 0.91, with an average of 0.73. This indicates that the inter-scorer reliability of the SQFFQ is relatively high.
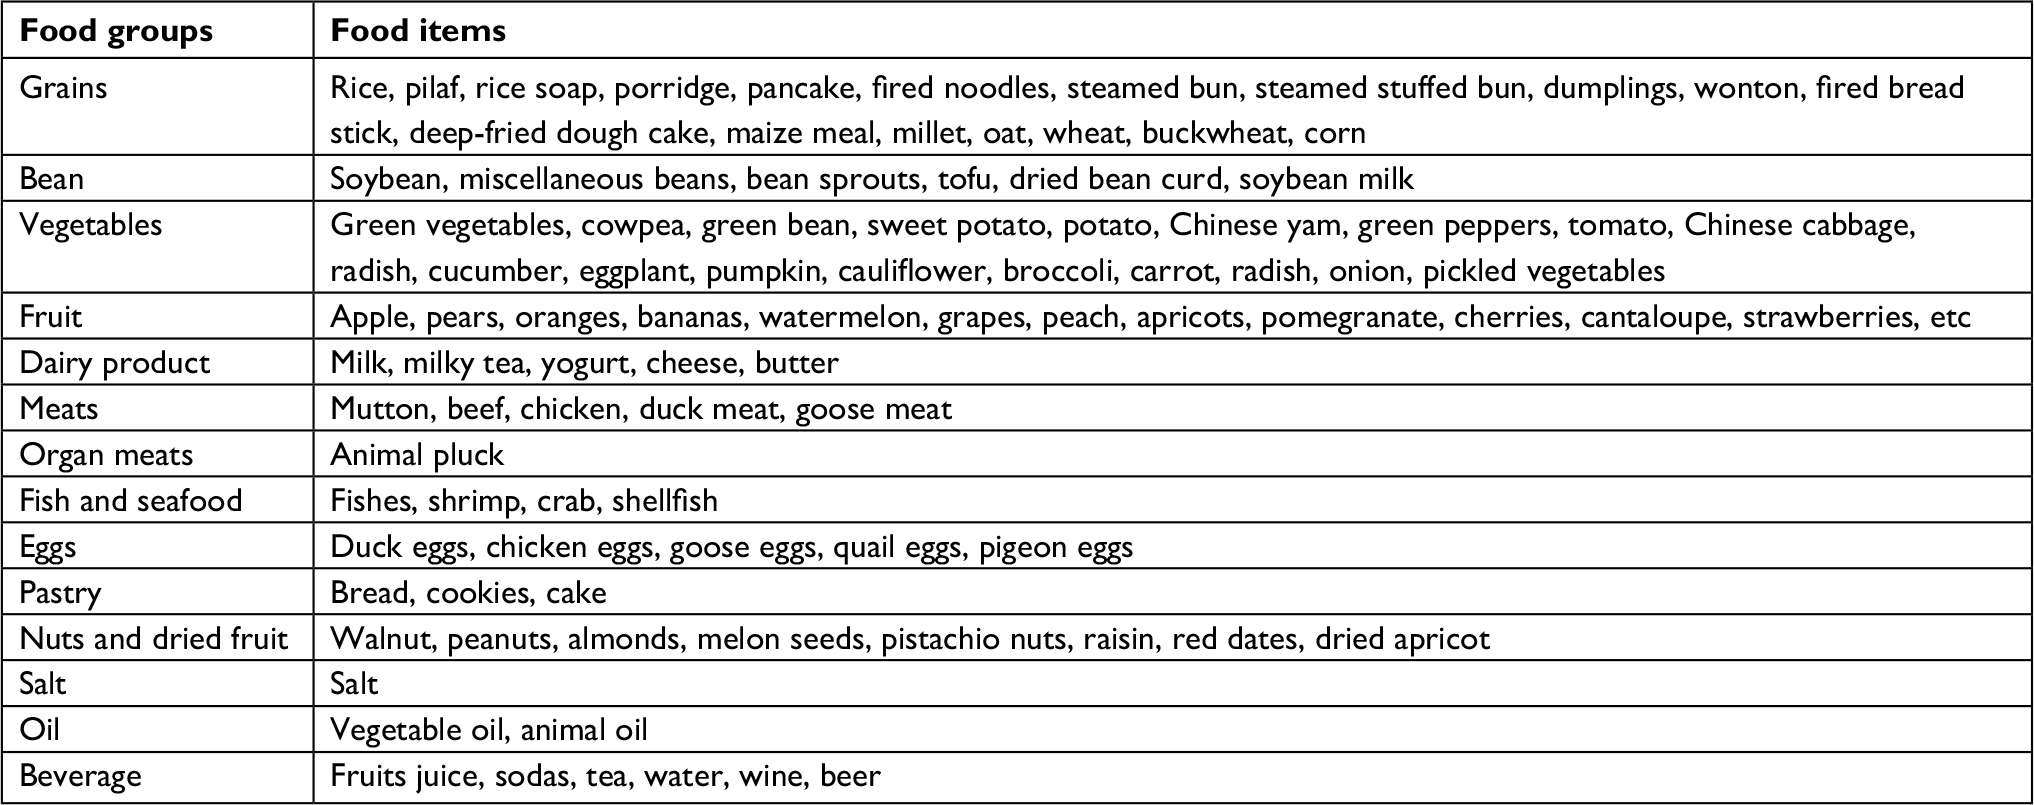 | Table 1 Food grouping used in the dietary pattern analyses |
Participants were invited to a separate air-conditioned room after breakfast. For nutrition assessment, ten professional investigators, who majored in medicine and nutrition and were fluent in the local language, were trained using a combination of theoretical teaching and practical operation prior to the investigation. Participants were asked to recall the frequencies (per day, per week, per month, per year) and portion sizes of all food consumed within the previous 12 months, with the help of visual measurement aids. Answers were transformed to an average daily intake (grams) for all subsequent analyses. One specific person was responsible for quality control of the dietary survey, including checking for errors, missed items, and unclear items, all of which were corrected in a timely manner.
Dietary pattern identification
Dietary patterns were identified using factor analysis (principal component analysis) in dimensionality reduction analysis of SPSS 21.0 as described elsewhere.26 Briefly, factors were rotated using varimax rotation to ensure that there was no association between factors and to improve interpretability. Factors were extracted by combing eigenvalue, interpretability, and scree plot. Factor groups with factor loading ≥|0.5| were considered to contribute significantly and served as a reference for labeling the dietary patterns.27 Factor scores were categorized into quartiles (Q1–Q4), and differences between Q1 and Q4 in every dietary pattern were compared by single factor difference analysis. Multivariate logistic regression analysis was used to examine the association between dietary patterns and T2DM by adjusting for sex, age, education level (primary and lower, junior, senior, and college and higher), physical activity level (light, moderate, and heavy), smoking status (never, current, and former), body mass index (BMI), and total energy intake.
Physical activity assessment
The physical activity level of all participants was evaluated using the validated international physical activity questionnaire (Chinese version, IPAQ).28,29 Participants were divided into vigorously active, moderately active, or sedentary groups according to their physical activity over the past 7 days.
Anthropometric and laboratory measurement
Demographic and anthropometric data were collected for all participants. Demographic data including age, gender, smoking status, alcohol consumption, marital status, education, occupation, household income, and disease history were collected via an interviewer-administered questionnaire. Anthropometric data including height (mm), weight (kg), diastolic blood pressure (DBP, mmHg), systolic blood pressure (SBP, mmHg), waist circumference (WC, cm), and hip circumstance (HC, cm) were measured in an air-conditioned room with participants wearing light clothing and no shoes. BMI was calculated as weight divided by height squared (kg/m2). Waist–hip ratio (WHR) was calculated as WC/HC. Blood samples were obtained from all participants in the morning after 12 hours of fasting. Total cholesterol (TC, mmol/L), triglycerides (TG, mmol/L), low-density lipoprotein-cholesterol (LDL-C, mmol/L), high-density lipoprotein-cholesterol (HDL-C, mmol/L), and FPG (mmol/L) were measured using a Beckman Coulter AU5800 clinical chemistry system (Beckman, Newark, NJ, USA). Fasting insulin (FINS, pmol/L) was measured using a Roche Diagnostics Kit and a Roche Cobas e-601 analyzer (GmbH, Mannheim, Germany). Homeostasis model assessment-insulin resistance (HOMA-IR) was calculated as (FINS× FPG)/22.5.
SNP genotyping
TCF7L2 SNPs were searched for on the NCBI database (http://www.ncbi.nlm.nih.gov/SNP) and 1000 Genomes database (http://www.internationalgenome.org/) by referencing genomes obtained from Chinese Han and European populations. SNP information was imported into Haploview 4.2 software and seven SNPs (rs11196205, rs12255372, rs12573128, rs4506565, rs7895340, rs7901695, and rs7903146) were selected based on the criteria of linkage disequilibrium parameter r2≥0.8 and minimum allele frequency ≥0.05. DNA was extracted from whole blood using a TIANamp Genomic DNA Kit (Tiangen, Beijing, China), and TCF7L2 genotyping was performed using improved multiplex ligation detection reaction (iMLDR, Genesky, Shanghai, China) as previously described.30 Quality control procedures, including internal consistency and external validation, were applied to ensure accurate genotyping results. Approximately 5% of samples were randomly selected in duplicate with an internal consistency rate of 100%, and another 5% were randomly selected for Sanger sequencing. Genotyping results showed 100% reproducibility.
Statistical analysis
All statistical analyses were conducted using the SPSS 21.0 software (IBM Corporation, Armonk, NY, USA). Normal distribution of quantitative data was examined using a one-sample Shapiro–Wilk test. Data following a normal distribution were expressed as mean ± SD, and data that did not follow a normal distribution were expressed as median and quartile range. Differences between two groups were compared by independent-sample t-test or Mann–Whitney U test where appropriate. Qualitative data were expressed as frequencies (percentages) and compared using the chi-squared test or Fisher’s exact test. Dietary patterns were extracted by factor analysis. OR and 95% CIs were calculated by multivariable logistic regression to assess the association between dietary pattern and risk of T2DM. Genotype frequencies between T2DM participants and control participants, as well as Hardy–Weinberg equilibrium (HWE), were assessed using a chi-squared test. Interaction analyses between SNPs and dietary factors/physical activity were carried out using Spearman correlation analysis and logistic regression models. P<0.05 was regarded as statistically significant.
Results
Demographic and clinical characteristics
A total of 932 participants were initially included in the study. After excluding participants with abnormal glucose tolerance, incomplete information of general conditions, physical examination, laboratory tests, and dietary data, as well as those with extreme physical activity and dietary energy identified during data processing, a final number of 828 participants were enrolled for subsequent analyses. Table 2 shows the demographic and clinical characteristics of patients with T2DM (n=337) and control participants (n=491). There was no significant difference in terms of age, gender, polyunsaturated fatty acids, marital status, monthly income, or alcohol intake (P>0.05), whereas BMI, WHR, SBP, DBP, TC, TG, LDL-C, FINS, HOMA-IR, energy, protein, fat, total fatty acids, saturated fatty acids (SFA), and monounsaturated fatty acids (MUFA) levels were significantly higher in patients with T2DM than in control participants (P<0.05). It is interesting to note that participants in the T2DM group on average had a higher level of education, a higher incidence of T2DM in the family, were less physically active, and tended to smoke less than those in the control group (all P<0.05).
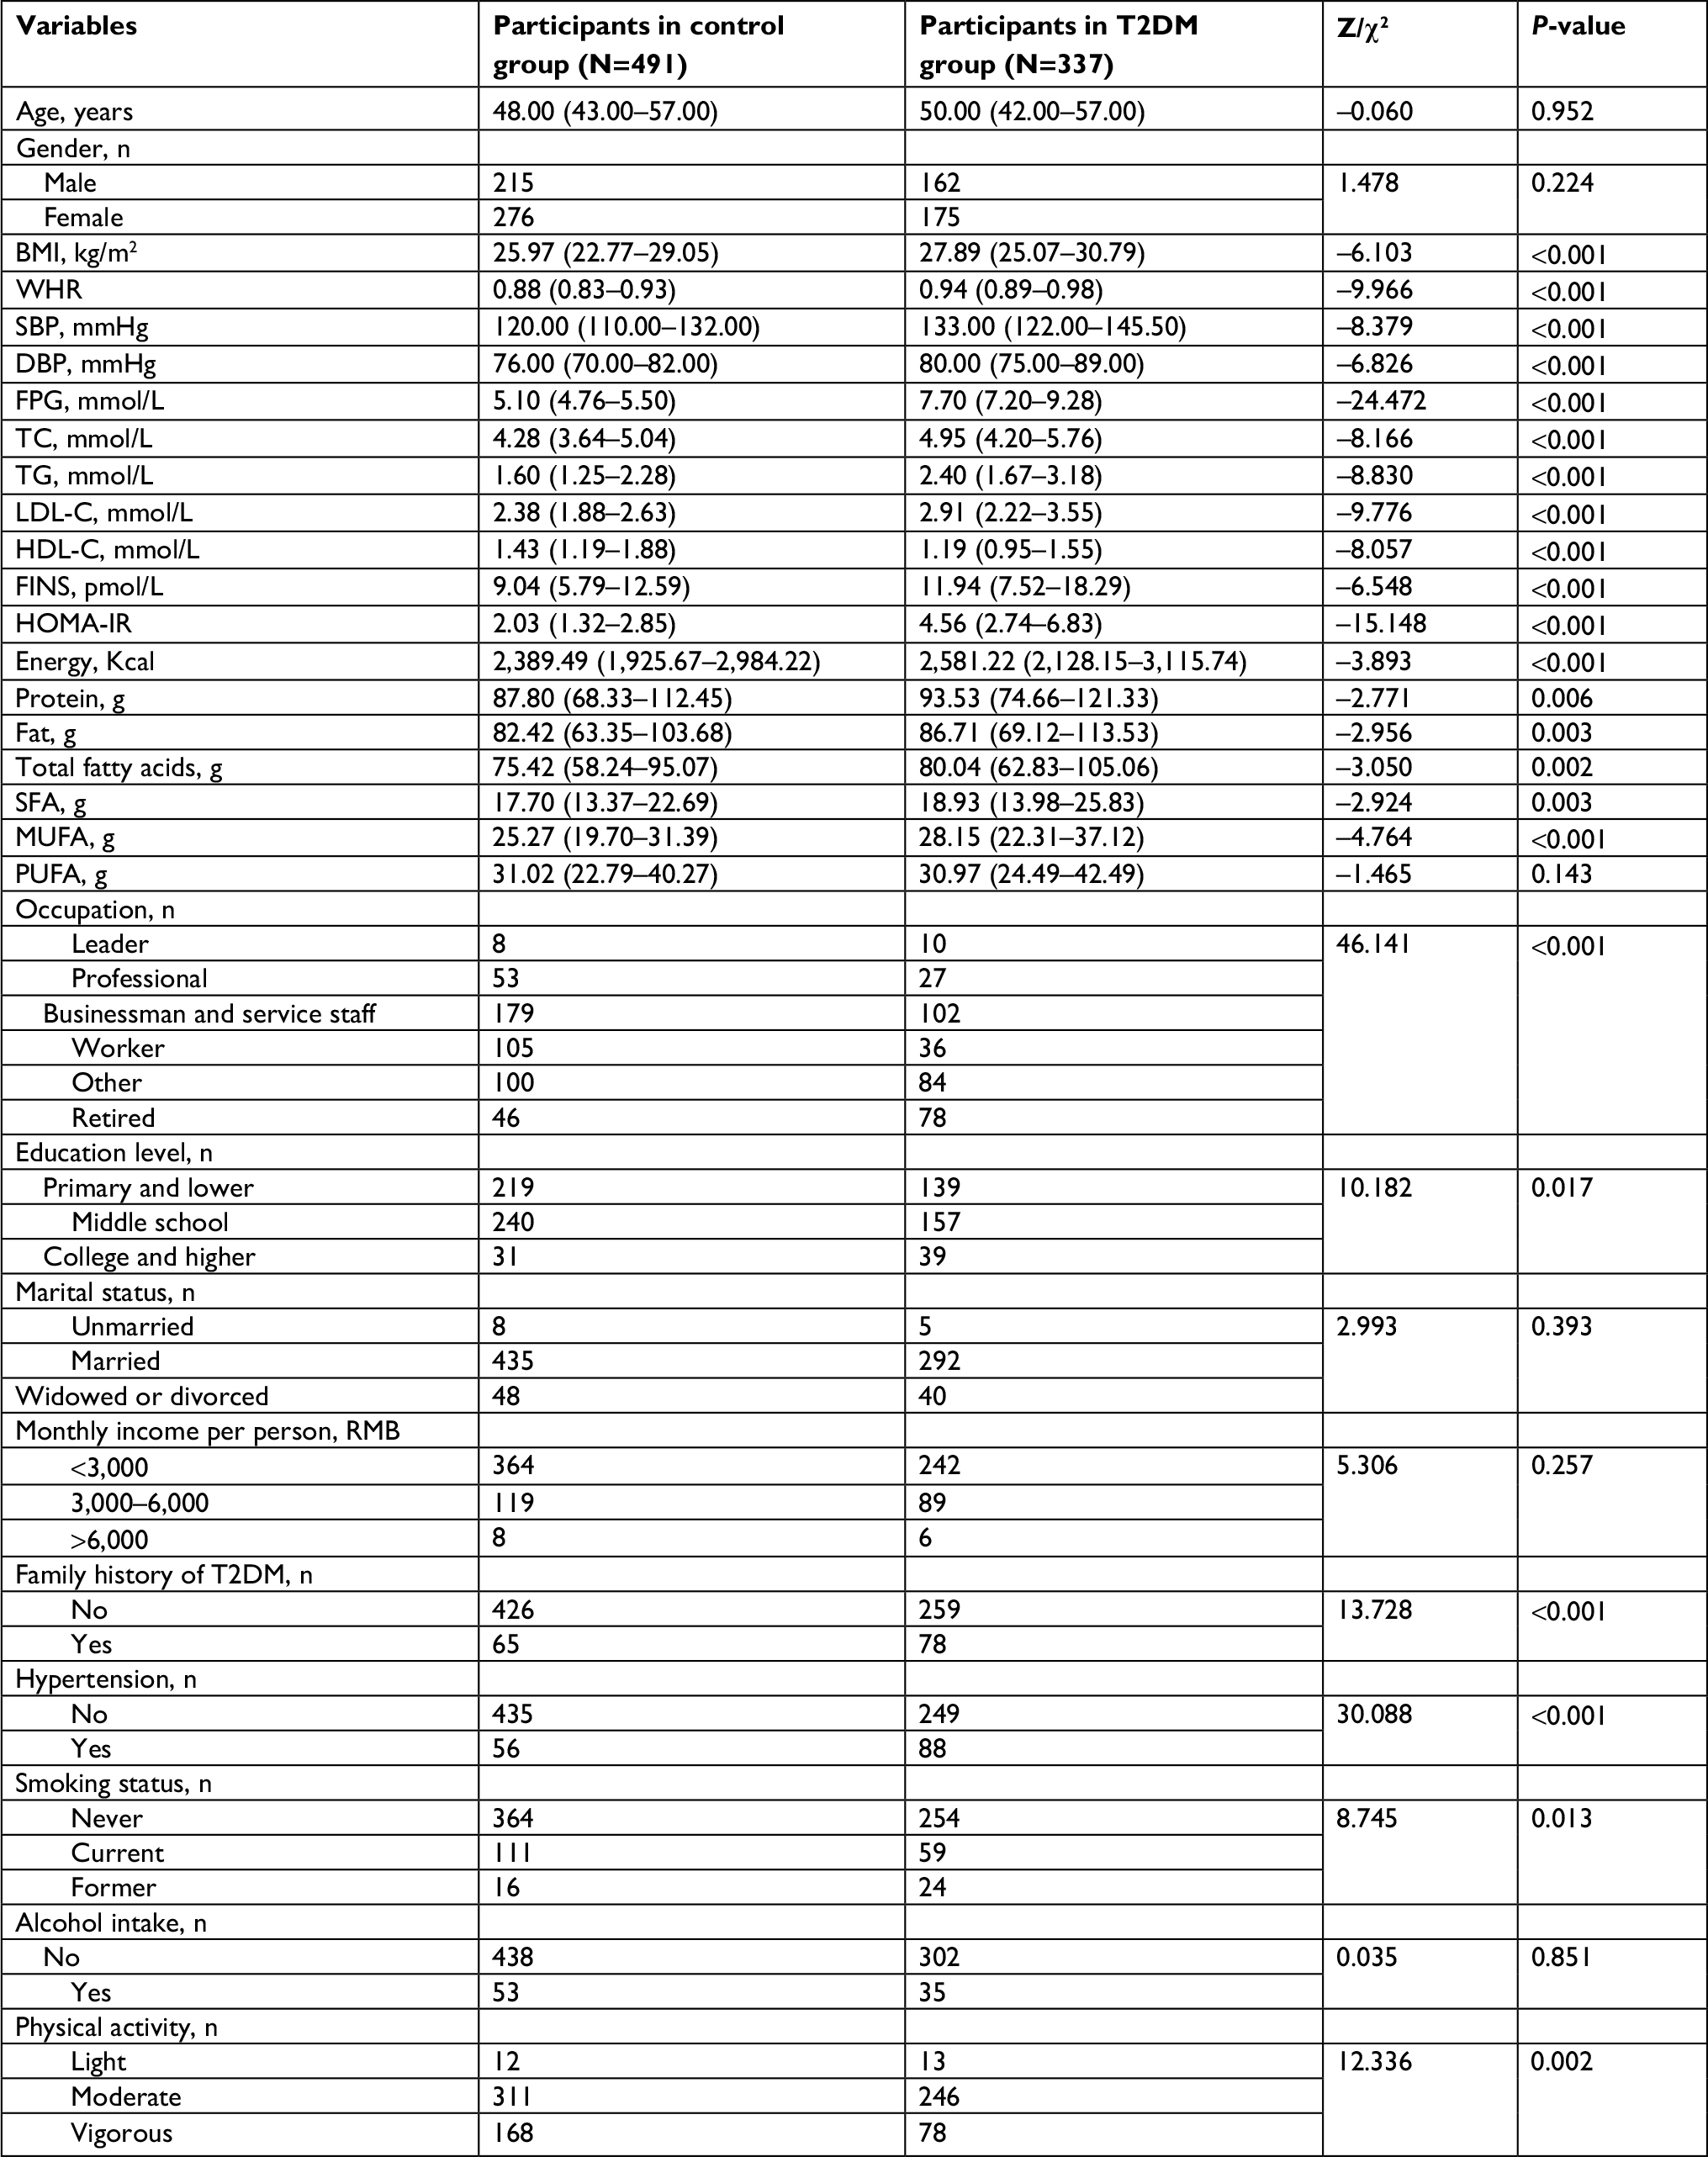 | Table 2 Demographic and clinical characteristics of participants with and without T2DM Notes: Smoker was defined as one who smokes more than 10 cigarettes per week for more than 6 months. Former smoker was defined as one who stopped smoking for more than 6 months. Alcohol intake was defined as one who drinks at least once a week, for more than 6 months. Differences between these two groups were compared by chi-squared test, and P<0.05 indicated statistically significant difference. Abbreviations: BMI, body mass index; DBP, diastolic blood pressure; FINS, fasting insulin; FPG, fasting plasma glucose; HDL-C, high-density lipoprotein-cholesterol; HOMA-IR, homeostasis model assessment-insulin resistance; LDL-C, low-density lipoprotein-cholesterol; MUFA, monounsaturated fatty acids; PUFA, polyunsaturated fatty acids; SBP, systolic blood pressure; SFA, saturated fatty acids; T2DM, type 2 diabetes mellitus; TC, total cholesterol; TG, triglycerides; WHR, waist–hip ratio. |
Definition of dietary patterns in the Uyghur population
The dietary intakes of all participants were analyzed using factor analysis. Kaiser–Meyer–Olkin index (KMO =0.703>0.5) and Bartlett’s test of sphericity (χ2=1,060.491, df =92, P<0.001) suggested the food groups were not independent but significantly correlated with each other and that a factor analysis was applicable.31 Five types of dietary pattern were derived from the principal component analysis, which accounted for 95.22% of the variance among food items (Table 3). The first pattern was named the “fruit” pattern and was characterized by a high intake of fruits, nuts and dried fruit, and a low intake of salt, oil, and beverages. The second pattern was termed the “meats” pattern and was characterized by a high intake of meat, animal pluck, fish, and seafood and a low intake of fruits and dairy products. The third pattern was named the “dairy product” pattern and was characterized by a high intake of dairy products and eggs, with a low intake of salt and beverages. The fourth pattern was named the “vegetables” pattern and was characterized by a high intake of vegetables, and a low intake of salt, meat, oil, and beverages. The final pattern was called the “grains” pattern and was characterized by a high intake of grains.
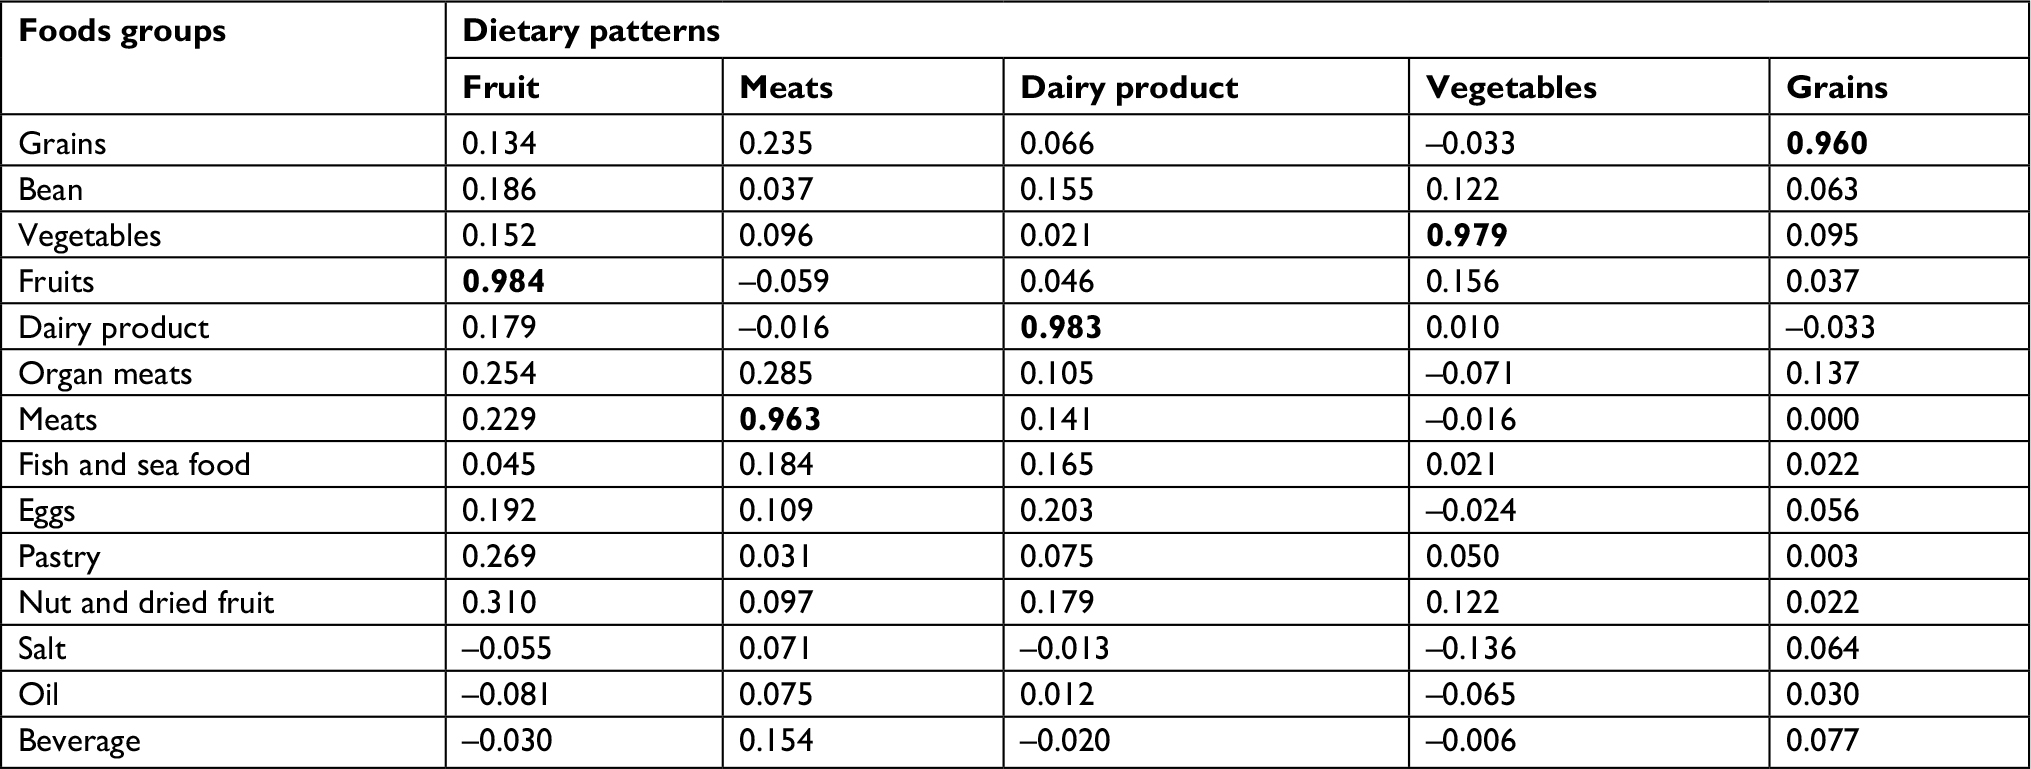 | Table 3 Factor loadings and explained variations of dietary patterns from principal component analysis Note: The bold number indicates the largest component in principal component analysis. |
Association between dietary pattern and general characteristics
The general characteristics of all participants across quartile categories of dietary pattern scores are summarized in Table 4. Participants in the highest quartile of the “fruit” dietary pattern were mostly male, with lower FPG and TC, higher levels of energy, protein, fat, total fatty acids, SFA, MUFA, and polyunsaturated fatty acids (PUFA), and a lower incidence of T2DM and hypertension than those in the lowest quartile. Individuals in the highest quartile of the “meats” dietary pattern were more likely to be male, smokers, drinkers, and have higher WHR, FPG, TG, HOMA-IR, energy, protein, fat, total fatty acids, SFA, MUFA, and PUFA, lower levels of HDL-C, and a higher incidence of T2DM than those in the lower quartile. Subjects in the highest quartile of the “dairy product” pattern tended to have a lower BMI, WHR, and TG, a low family history of T2DM, higher levels of energy, protein, fat, total fatty acids, SFA, MUFA, and PUFA, and a higher education level and higher economic income than those in the lowest quartile. Participants in the highest quartile of the “vegetables” pattern were more likely to have a lower BMI, WHR, FPG, TC, TG, LDL-C, and HOMA-IR, a lower economic income, low incidence of T2DM and hypertension, and higher levels of HDL-C, energy, protein, fat, SFA, and PUFA than those in the lower quartile. Individuals in the highest quartile of the “grains” pattern were younger, more likely to be female, smokers, drinkers, had higher WHR, SBP, DBP, FPG, LDL-C, HOMA-IR, energy, protein, fat, total fatty acids, and MUFA, a higher economic income, and higher incidence of T2DM and hypertension, but lower levels of HDL-C than those in the lower quartile.
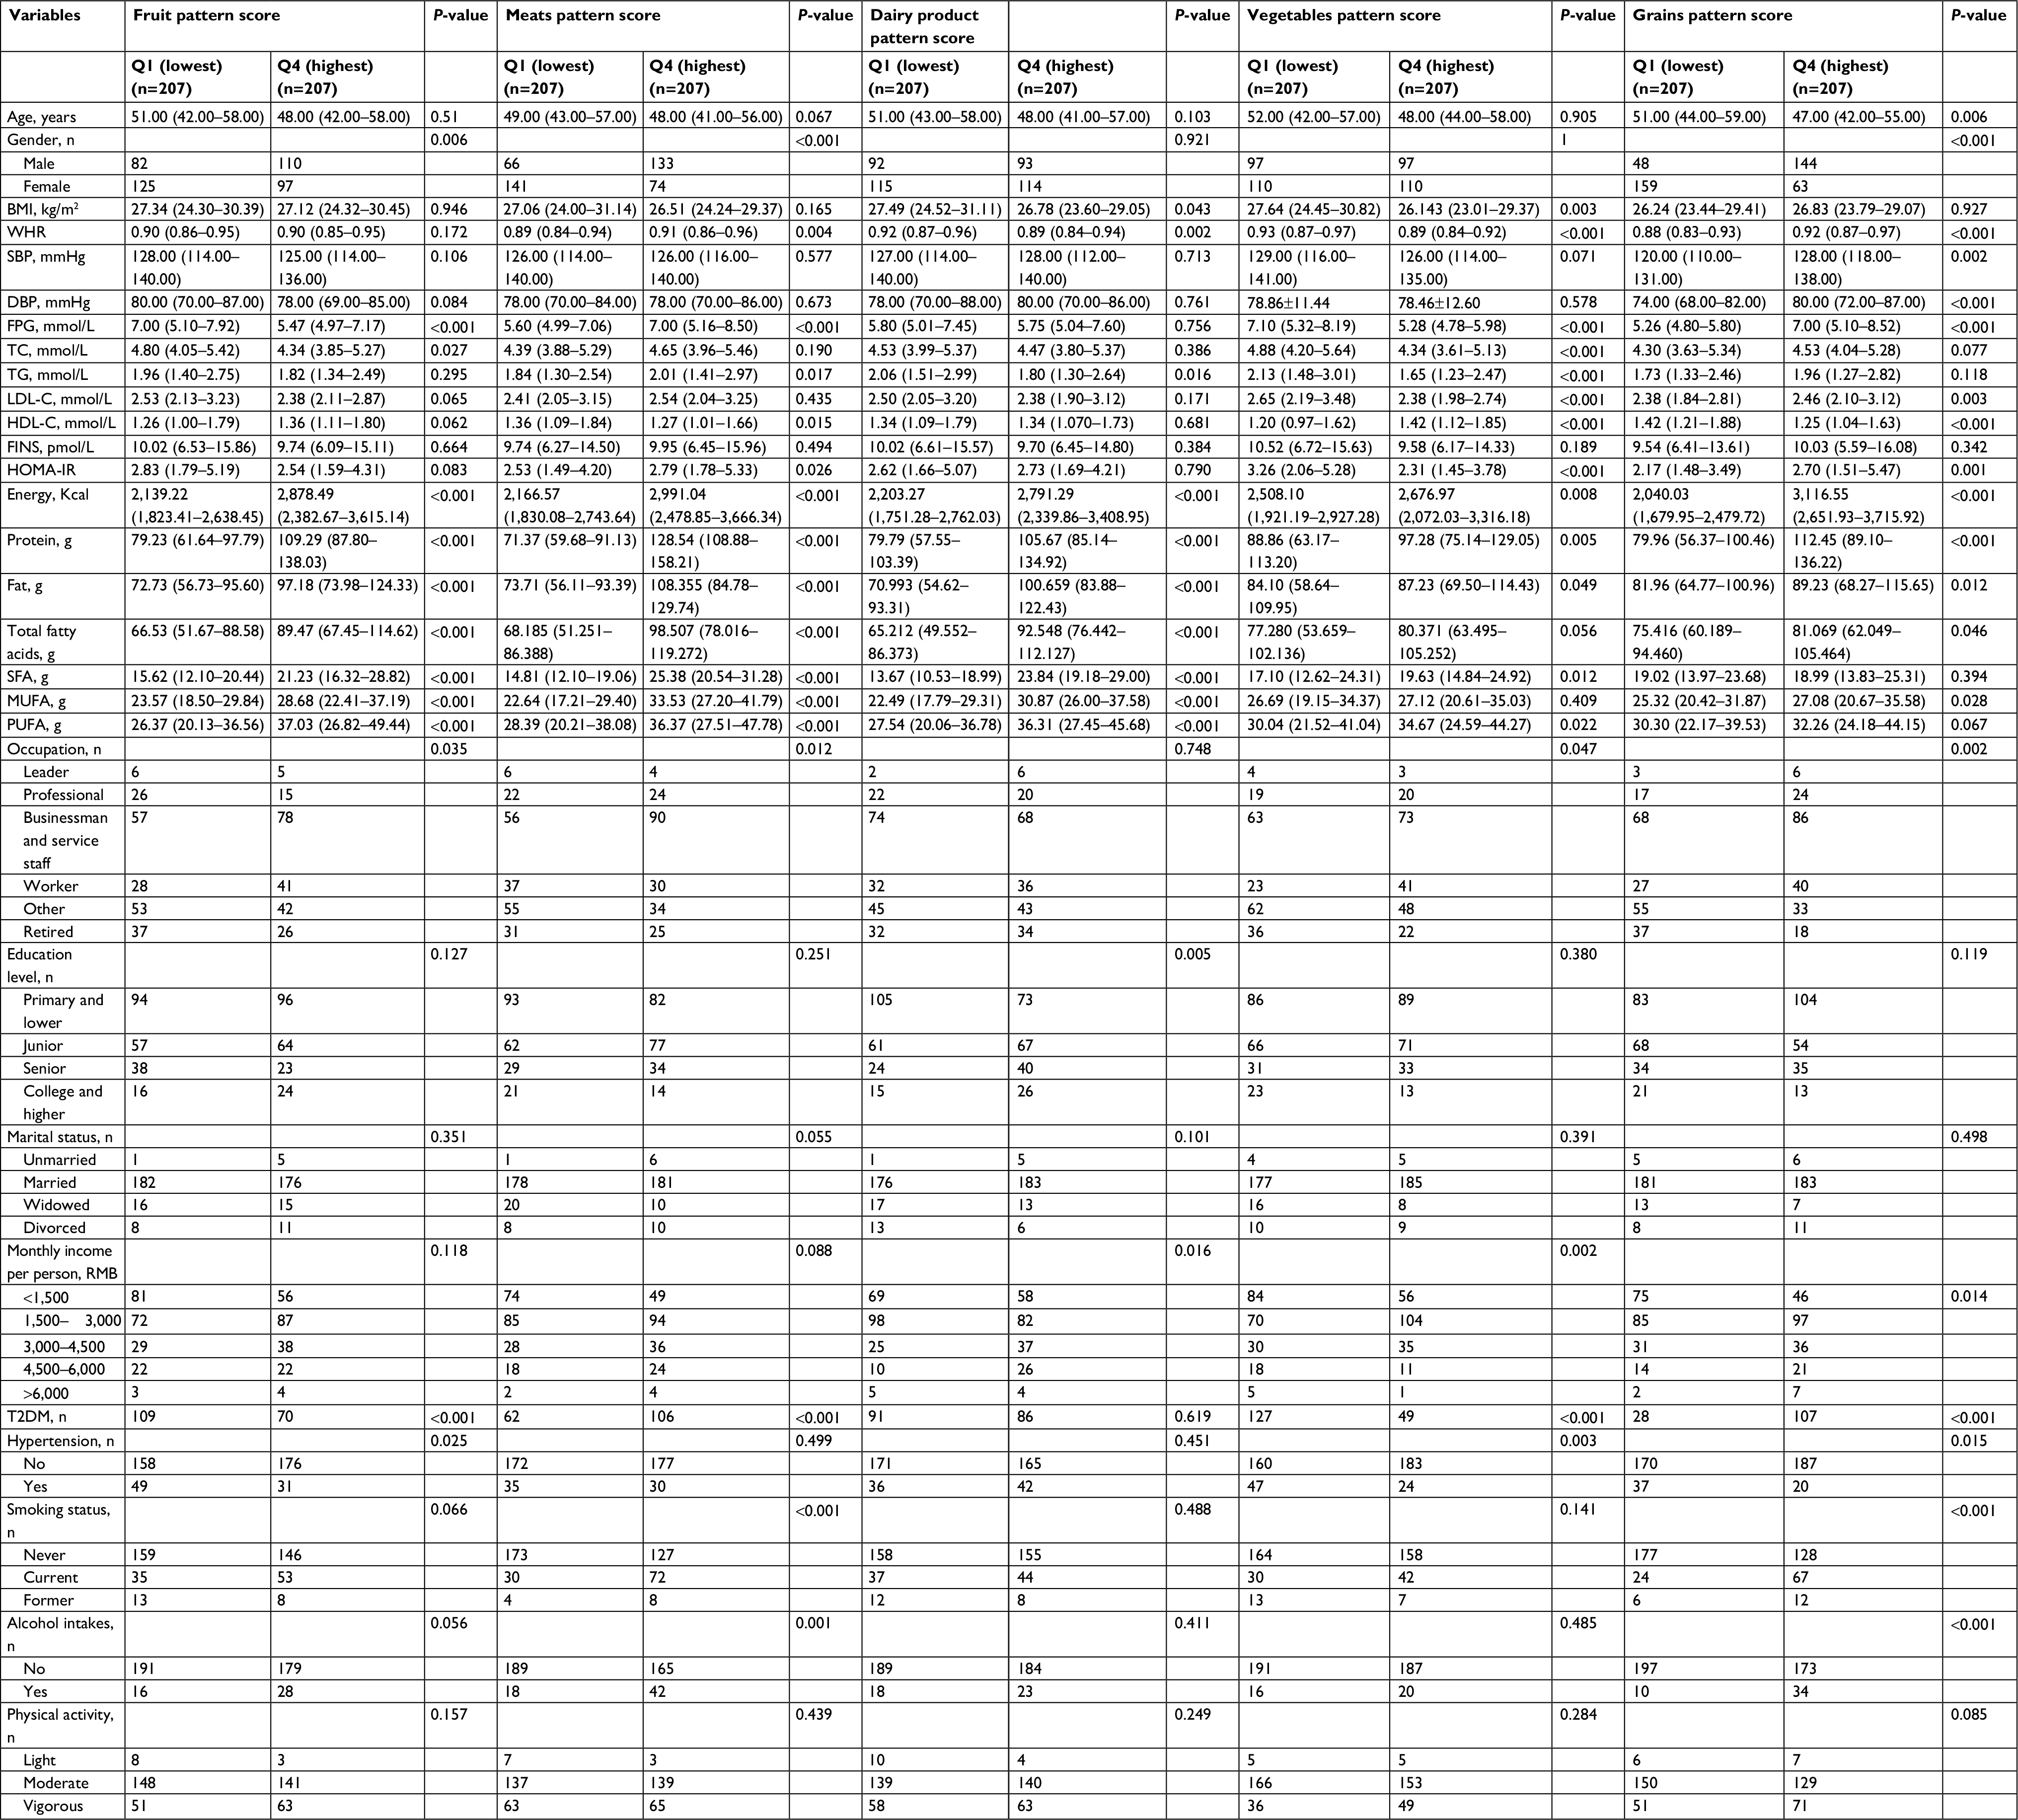 | Table 4 General characteristics of study participants for lowest and highest quartiles of the major dietary pattern scores Notes: Smoker was defined as one who smokes more than 10 cigarettes per week for more than 6 months. Former smoker was defined as one who stopped smoking for more than 6 months. Alcohol intake was defined as one who drinks at least once a week, for more than 6 months. Differences between these two groups were compared by chi-squared test, and P<0.05 indicated statistically significant difference. Abbreviations: BMI, body mass index; DBP, diastolic blood pressure; FINS, fasting insulin; FPG, fasting plasma glucose; HDL-C, high-density lipoprotein-cholesterol; HOMA-IR, homeostasis model assessment-insulin resistance; LDL-C, low-density lipoprotein-cholesterol; MUFA, monounsaturated fatty acids; PUFA, polyunsaturated fatty acids; SBP, systolic blood pressure; SFA, saturated fatty acids; T2DM, type 2 diabetes mellitus; TC, total cholesterol; TG, triglycerides; WHR, waist–hip ratio. |
Association between dietary pattern and T2DM risk
Multivariable logistic regression analysis was conducted to evaluate the relationship between dietary pattern and T2DM risk. As shown in Table 5, participants in the highest quartile of the “fruit” and “vegetables” dietary pattern scores had a lower incidence of T2DM than those in the lowest quartiles (OR =0.238; 95% CI: 0.144–0.395; P<0.001 and OR =0.187, 95% CI: 0.118–0.295; P<0.001, respectively), after adjustment for sex, age, education level, physical activity level, smoking status, BMI, and total energy intake. Subjects in the highest quartile of the “meats” and “grains” dietary pattern scores had a higher incidence of T2DM than those in the lowest quartiles (OR =2.389; 95% CI: 1.487–3.838; P<0.001 and OR =10.239; 95% CI: 5.142–20.388; P<0.001, respectively). The “dairy product” pattern showed no association with the risk of T2DM (OR =0.672; 95% CI: 0.423–1.066; P=0.091).
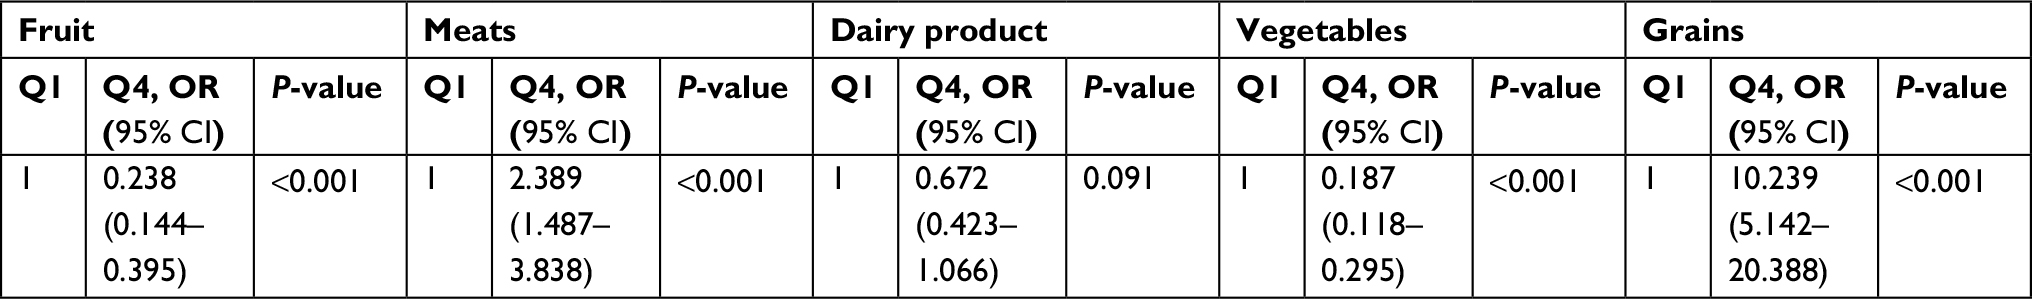 | Table 5 Multivariable regression analyses of dietary patterns and T2DM risk Notes: Multivariable regression analyses were adjusted for sex, age, education level (primary and lower, junior, senior, college and higher), physical activity level (light, moderate, and heavy), smoking status (never, current, and former), BMI, and total energy intake. Q4, the highest quartile of dietary patterns; Q1, the lowest quartile of dietary patterns (reference). Smoker was defined as one who smokes more than 10 cigarettes per week for more than 6 months. Former smoker was defined as one who stopped smoking for more than 6 months. Drinker was defined as one who drinks at least once a week, for more than 6 months. Abbreviations: BMI, body mass index; T2DM, type 2 diabetes mellitus. |
Association between TCF7L2 SNPs and T2DM risk
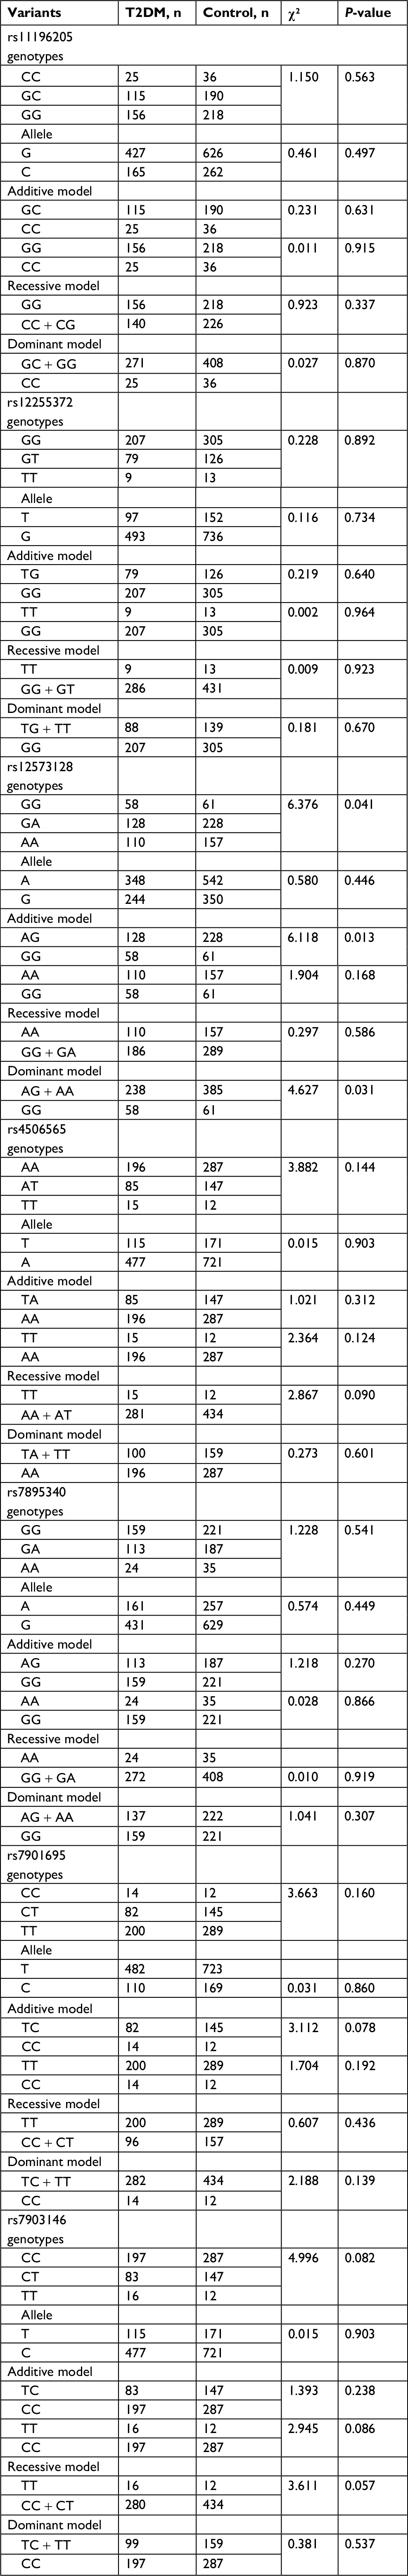
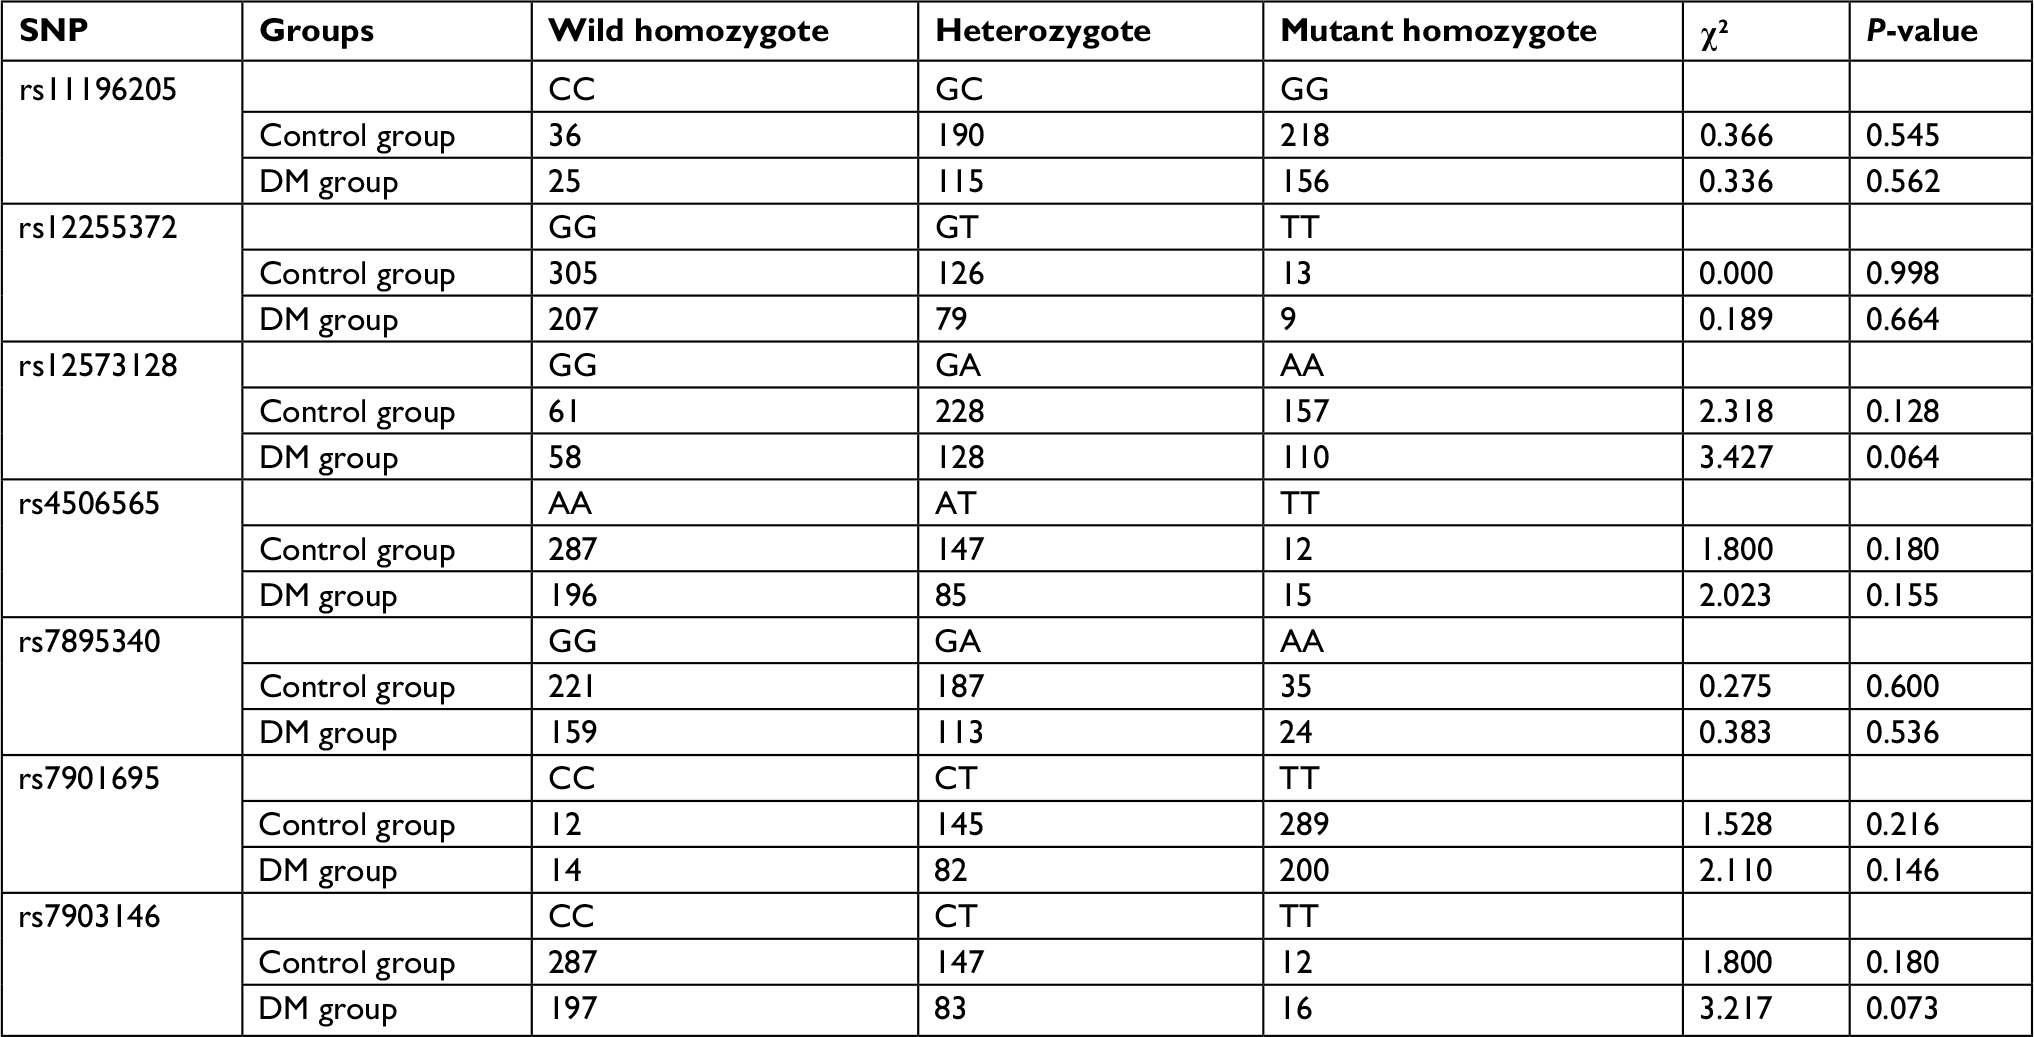
The genotypic distribution for all seven SNPs of the TCF7L2 gene was consistent with the predicted HWE (P>0.05 in both T2DM and control groups, Table S1). Table 6 shows the distribution of genotypes and alleles for the seven SNPs in the T2DM and control groups within the Uygur population. The distribution of rs12573128 genotyping (P=0.041), dominant model (AG + AA vs GG, P=0.031), and additive model (AG vs GG, P=0.013) showed a significant difference between the T2DM and control groups. However, the distribution of the other six SNPs showed no statistical significance between the two groups (P>0.05).
 | Table 6 Genotype and allele distributions in participants with and without T2DM Abbreviations: SNP, single-nucleotide polymorphism; T2DM, type 2 dietary mellitus. Differences between these two groups were compared by chi-squared test. |
Interaction between TCF7L2 SNPs and dietary pattern on T2DM risk
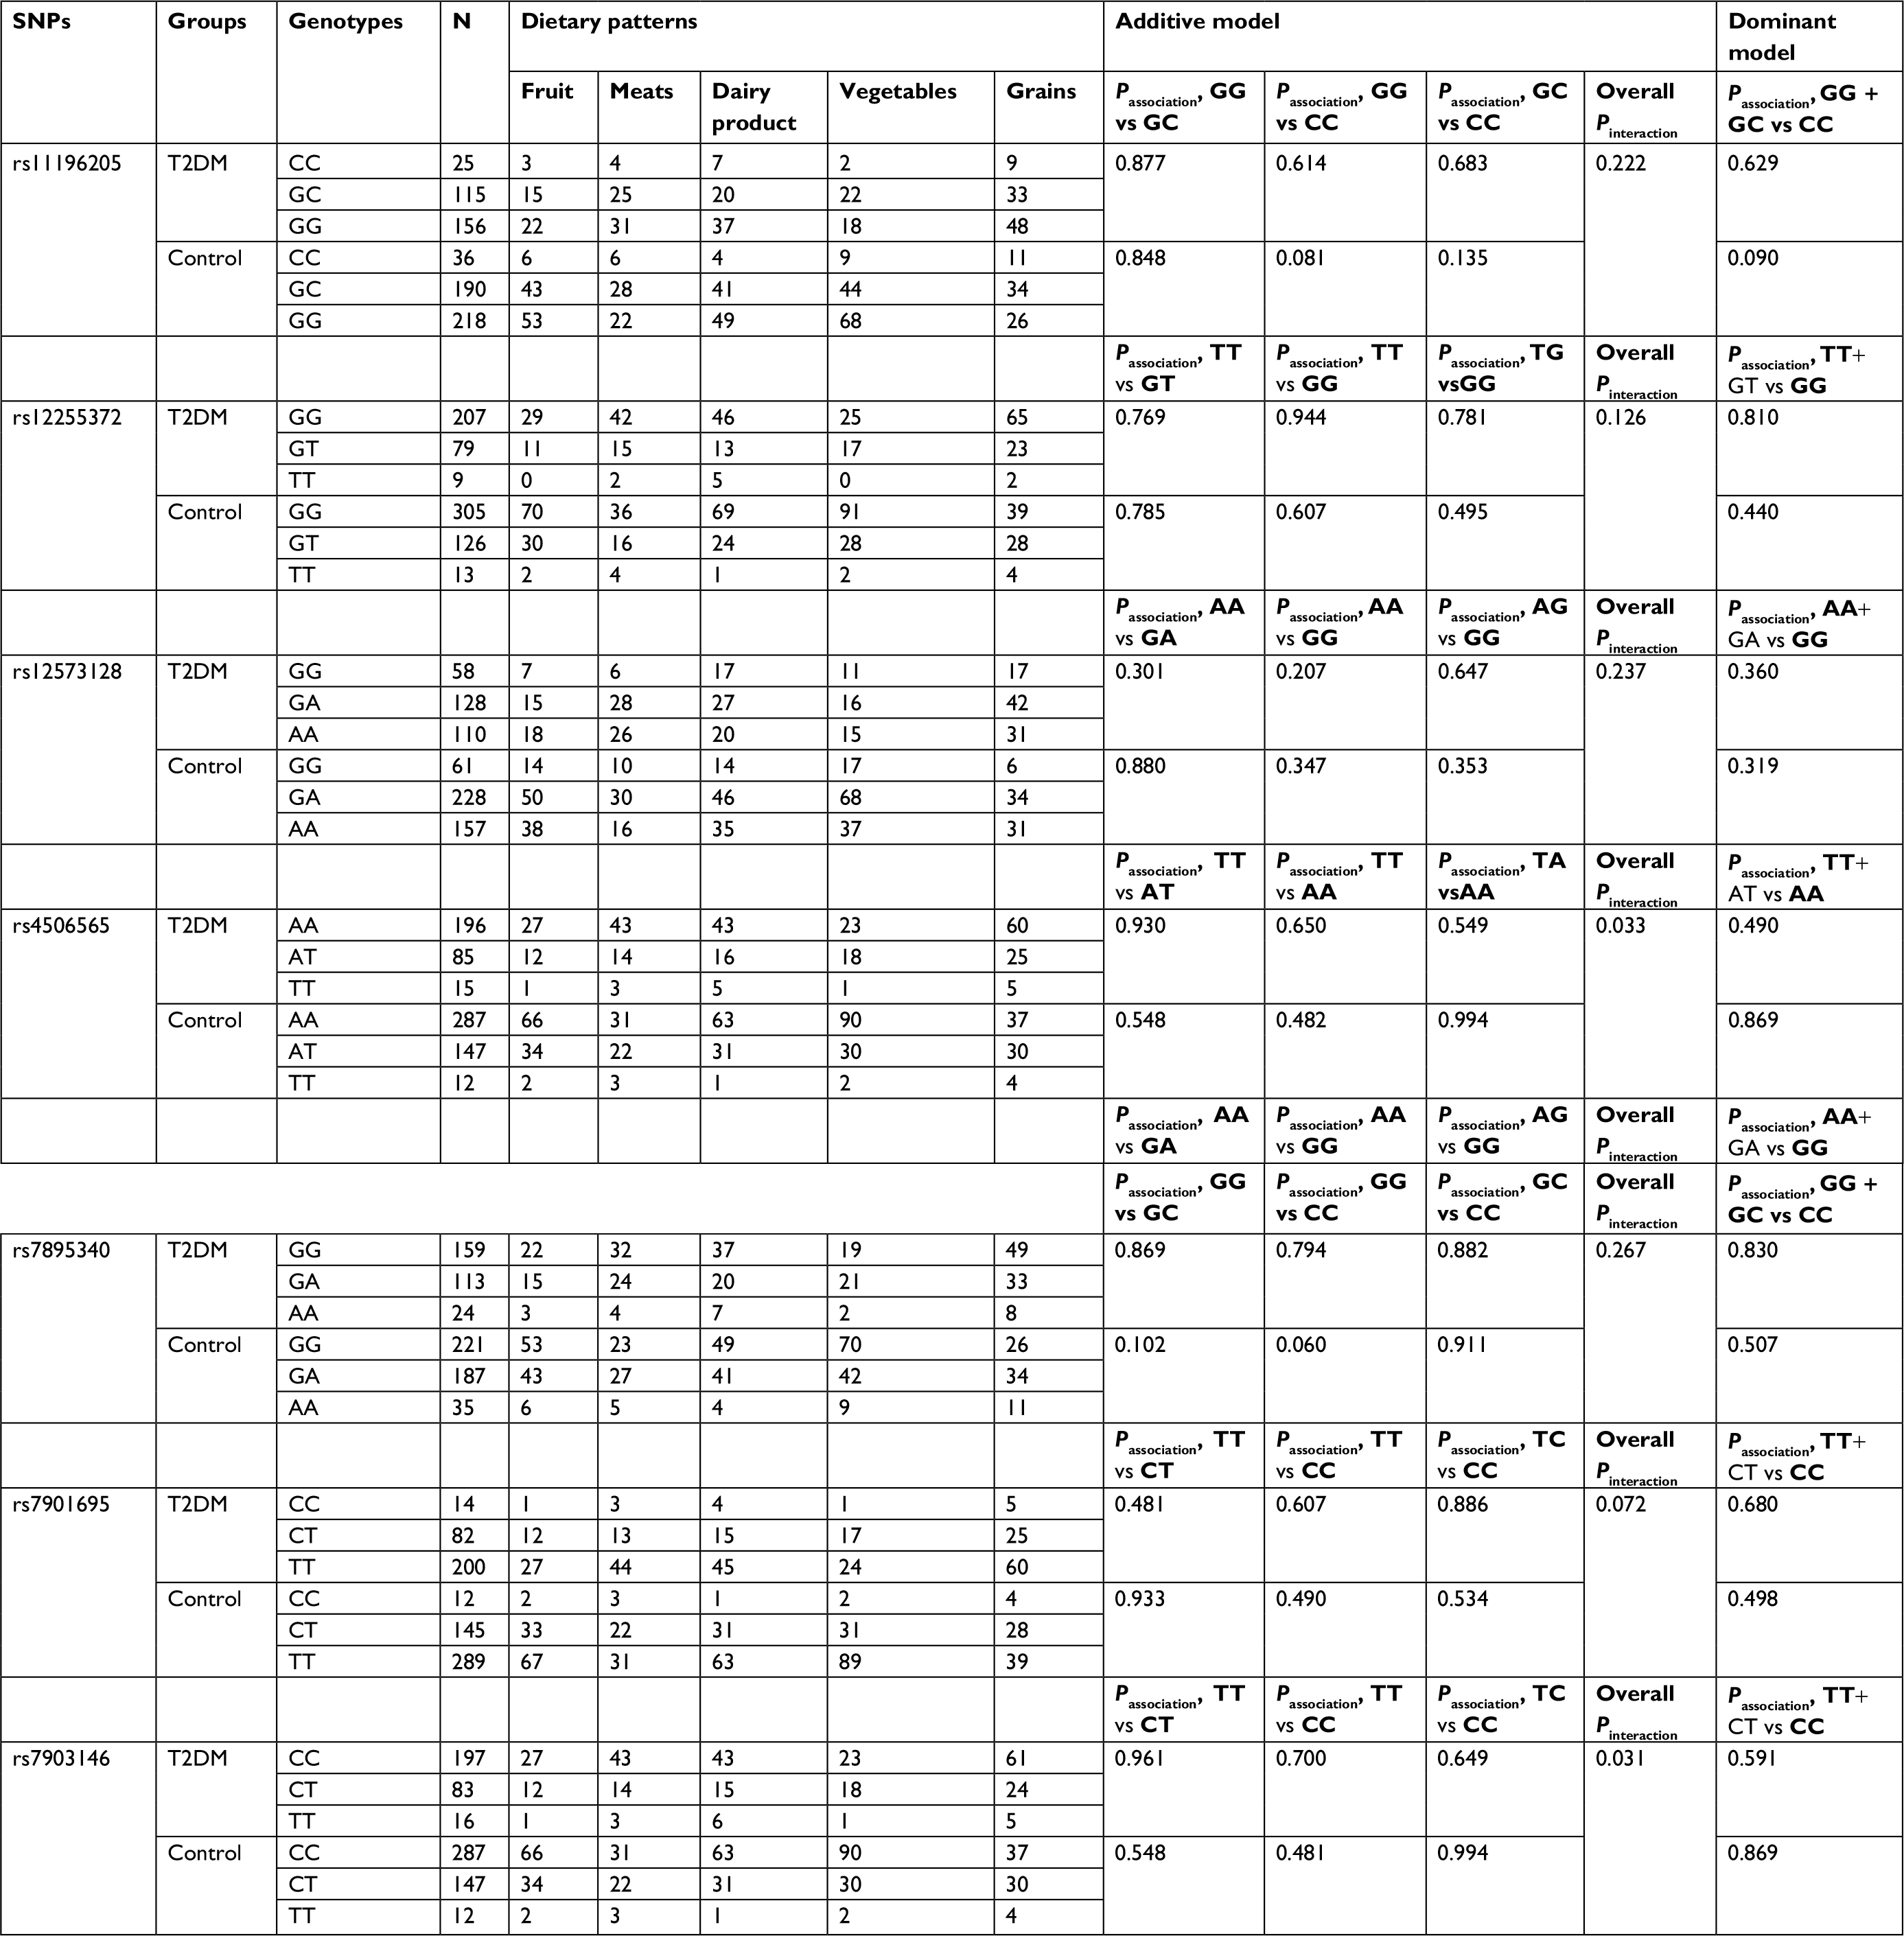
Next, interactions between the seven TCF7L2 SNPs and dietary pattern on T2DM risk were further assessed. As shown in Table 7, the interaction between the additive model of rs4506565 and dietary pattern, and between the additive model of rs7903146, were statistically significant (Pinteraction =0.033, Pinteraction =0.031, respectively). Conversely, the interaction between the dominant model of the seven SNPs and dietary pattern was not statistically significant (Pinteraction >0.05).
 | Table 7 Interactions of the seven TCF7L2 SNPs with dietary patterns under additive and a dominant model of analysis Abbreviations: SNP, single-nucleotide polymorphism; T2DM, type 2 dietary mellitus. |
Discussion
In this study, we defined five dietary patterns from the diet of the Uyghur population. Multivariable logistic regression analysis indicated that the “fruit” and “vegetables” dietary patterns were associated with a significantly decreased risk of T2DM, whereas the “meats” and “grains” dietary patterns were associated with an increased risk of T2DM. Moreover, the “dairy product” dietary pattern showed no association with the risk of T2DM. Given the limited research that has been conducted on the Uyghur population, our studies represent a unique contribution to the pathogenesis of T2DM in this nation.
Uyghur people live primarily in the Xinjiang Province located in west China, and they have their own genetic background, lifestyle, culture, language, and dietary habits.13,14 The traditional Uyghur dietary pattern involves a high consumption of wheat-based foods (such as naan and noodles) and animal products (such as mutton and beef, and milk products such as butter and cheese), but a low intake of fruits and vegetables.32 In accordance with these national food habits, three dairy patterns, “grains,” “meats,” and “dairy product,” were defined in the current study. Multivariable regression analysis revealed that the “meats” and “grains” dietary patterns were associated with a high risk of T2DM, whereas the “dairy product” pattern showed no association with the risk of T2DM. The positive association between the “meats” and “grains” pattern and T2DM could be due to unhealthy constituents, such as red meat. Naan and noodles are made of flour and contain a large amount of carbohydrates, and beef and mutton are rich in saturated fatty acids and cholesterol. These foods provide sufficient materials for the synthesis of fat in the body, which could result in a high risk for T2DM.32
In addition to the three traditional dietary patterns, we also defined two others, namely the “vegetables” and “fruit” patterns. The “fruit” pattern is characterized by a high intake of fruits, nuts, and dried fruit and low intake of salt, oil, and beverages. This is in line with the variety of fruits in Xinjiang Province, such as grapes and Hami melon, and a characteristic high consumption of dried fruits, such as raisins, walnuts, and red dates. Multivariable regression analysis suggested the “vegetables” and “fruit” dietary patterns are associated with a low risk of T2DM. This finding is consistent with previous studies that demonstrated a positive effect of “fruit” and “vegetables” in decreasing the risk of T2DM. The “fruit” and “vegetables” dietary patterns are similar to dietary patterns in loading structure termed “vegetable, fruit, and soy-rich pattern” in a Singapore Chinese population study,33 “prudent” in a Finnish study34 or a US study.35 All of these studies demonstrated an inverse association between dietary pattern and risk of T2DM. In another study in China, Shu et al identified three dietary patterns in the Zhejiang Province, and a traditional southern Chinese dietary pattern, which is characterized by a high intake of refined grains, vegetables, fruits, and pickled vegetables and has similarities to the “fruit” and “vegetables” patterns in the current study. However, in contrast to the current study, they found that this pattern was associated with the risk of T2DM. One reason for this could be that the traditional southern Chinese diet also includes a high intake of pickled vegetables, which contain a large amount of salt, known to cause hypertension and T2DM.36–38 Regardless of these differences, fruits and vegetables are abundant in dietary fiber, which are associated with a decreased risk of T2DM.39,40
TCF7L2 encodes a transcription factor that plays a key role in the canonical WNT signaling pathway. Previous studies have demonstrated that this pathway is important for β-cell proliferation and insulin secretion,41,42 and T2DM is known to be caused by impaired insulin secretion due to defective β-cell mass or function. In the current study, we assessed the association of seven TCF7L2 SNPs with T2DM risk in the Uygur population. To our knowledge, our study included the largest number of TCF7L2 SNPs ever investigated in this population. A previous study conducted by Yao et al demonstrated an association between two TCF7L2 SNPs (rs12255372 and rs7901695) and the risk of T2DM in the Uygur population. However, in our study, we did not find a significant association between these two SNPs and T2DM risk. Among the seven SNPs, only the distribution of rs12573128 genotypes (P=0.041), dominant model (AG + AA vs GG, P=0.031), and additive model (AG vs GG, P=0.013) showed a significant difference between the T2DM and control groups. Our study is consistent with previous work showing that TCF7L2 rs12573128 alone, or in combination with dietary fat intake, influenced insulin sensitivity, and glucose tolerance.43 Our result suggests that SNP rs12573128 affects WNT signaling to impact essential functions of TCF7L2 during insulin secretion and may also impact the maturity and proliferation of pancreatic β-cells associated with T2DM pathogenesis.
T2DM results from a combination of genetic and lifestyle factors, such as dietary pattern. However, few studies have investigated the relationship between SNPs and dietary patterns. In the present study, we assessed the interaction between the seven SNPs of TCF7L2 and dietary patterns. The results showed that two of the SNPs, rs4506565 and rs7903146, were significantly interact with dietary patterns. The genetic variants of TCF7L2 influence both insulin secretion and insulin sensitivity.44 Insulin secretion depends on blood glucose levels, which can be significantly affected by carbohydrates in the diet. Therefore, we speculate that the quality and quantity of carbohydrates may affect the relationship between TCF7L2 SNPs and the risk of T2DM.
There are some limitations to our study. First, the sample size was relatively small: only 828 participants were included in the full analysis, which may have led to weak statistical significance when estimating ORs. Second, the causal associations between dietary pattern and risk of T2DM could not be evaluated. Besides, although several confounding factors were adjusted in the statistical analyses, we could not completely eliminate the potential influence of other factors on our results. Further studies with larger sample sizes will be required to validate our findings.
Conclusion
In conclusion, our results identified five dietary patterns among the Uygur population in China. We found that the “fruit” and “vegetables” dietary patterns were associated with a significant decrease in the risk of T2DM, whereas the “meats” and “grains” dietary patterns were associated with an increased risk. Moreover, the “dairy product” dietary pattern showed no association with the risk of T2DM. In addition, our results indicate that SNP rs12573128 in the TCF7L2 gene is associated with an increased risk of T2DM in the Chinese Uygur population and could therefore potentially serve as a clinically important prediagnostic marker. The interactions between TCF7L2 rs4506565 and rs7903146 and dietary pattern were found to be statistically significant. Given the limited amount of research that has been done within the Uyghur population, our studies provide a unique contribution to the pathogenesis of T2DM in this nation.
Data availability
The data sets analyzed during the current study are available from the corresponding author on reasonable request.
Acknowledgments
The authors would like to thank all participants who generously gave their time to be part of the study. This study was supported by the Natural Science Foundation of the Xinjiang Uygur Autonomous Region (No. 2016D01C242) and the Key Discipline of the 13th Five-Year Plan in Xinjiang Uygur Autonomous Region - Public Health and Preventive Medicine (No. 99-11091113404#).
Author contributions
All authors contributed to data analysis, drafting and revising the article, gave final approval of the version to be published, and agree to be accountable for all aspects of the work.
Disclosure
The authors report no conflicts of interest in this work.
References
Defronzo RA, Bonadonna RC, Ferrannini E. Pathogenesis of NIDDM. A balanced overview. Diabetes Care. 1992;15(3):318–368. | ||
Ripsin CM, Kang H, Urban RJ. Management of blood glucose in type 2 diabetes mellitus. Am Fam Physician. 2009;79(1):29–36. | ||
Pasquier F. Diabetes and cognitive impairment: how to evaluate the cognitive status? Diabetes Metab. 2010;36(Suppl 3):S100–S105. | ||
GBD 2015 Disease and Injury Incidence and Prevalence Collaborators. Global, regional, and national incidence, prevalence, and years lived with disability for 310 diseases and injuries, 1990–2015: a systematic analysis for the global burden of Disease Study 2015. Lancet. 2016;388(10053):1545–1602. | ||
Hu FB, Fb H. Dietary pattern analysis: a new direction in nutritional epidemiology. Curr Opin Lipidol. 2002;13(1):3–9. | ||
Shu L, Shen XM, Li C, Zhang XY, Zheng PF. Dietary patterns are associated with type 2 diabetes mellitus among middle-aged adults in Zhejiang Province, China. Nutr J. 2017;16(1):81. | ||
Reeds J, Mansuri S, Mamakeesick M, et al. Dietary patterns and type 2 diabetes mellitus in a first Nations community. Can J Diabetes. 2016;40(4):304–310. | ||
Medina-Remón A, Kirwan R, Lamuela-Raventós RM, Estruch R. Dietary patterns and the risk of obesity, type 2 diabetes mellitus, cardiovascular diseases, asthma, and neurodegenerative diseases. Crit Rev Food Sci Nutr. 2018;58(2):262–296. | ||
Jeppesen C, Bjerregaard P, Jørgensen ME. Dietary patterns in Greenland and their relationship with type 2 diabetes mellitus and glucose intolerance. Public Health Nutr. 2014;17(2):462–470. | ||
Duc Son Lent, Hanh TT, Kusama K, et al. Anthropometric characteristics, dietary patterns and risk of type 2 diabetes mellitus in Vietnam. J Am Coll Nutr. 2005;24(4):229–234. | ||
Villegas R, Yang G, Gao YT, et al. Dietary patterns are associated with lower incidence of type 2 diabetes in middle-aged women: the Shanghai Women’s Health Study. Int J Epidemiol. 2010;39(3):889–899. | ||
Yu R, Woo J, Chan R, et al. Relationship between dietary intake and the development of type 2 diabetes in a Chinese population: the Hong Kong dietary survey. Public Health Nutr. 2011;14(7):1133–1141. | ||
Fu Z, Yang H, Ma Y, et al. Haplotype study of the CYP4A11 gene and coronary artery disease in Han and Uygur populations in China. Gene. 2013;512(2):510–516. | ||
Yao H, Wang Z, Wang T, et al. Association of TCF7L2 genetic polymorphisms with type 2 diabetes mellitus in the Uygur population of China. Int J Environ Res Public Health. 2015;12(9):11797–11814. | ||
Zhao F, Mamatyusupu D, Wang Y, et al. The Uyghur population and genetic susceptibility to type 2 diabetes: potential role for variants in CAPN10, apM1 and FUT6 genes. J Cell Mol Med. 2016;20(11):2138–2147. | ||
Song M, Zhao F, Ran L, et al. The Uyghur population and genetic susceptibility to type 2 diabetes: potential role for variants in CDKAL1, Jazf1, and IGF1 genes. OMICS. 2015;19(4):230–237. | ||
Yang Y, Xu JR, Wang YJ, Liu XM. Association of TCF7L2 gene polymorphisms with susceptibility to type 2 diabetes mellitus in a Chinese Hui population. Genet Mol Res. 2015;14(3):10064–10071. | ||
Liu L, Chen L, Li Z, et al. [Association of genetic variants in TOMM7 gene and gene environment interaction with type 2 diabetes in Chinese Dong population]. Zhong Nan Da Xue Xue Bao Yi Xue Ban. 2015;40(1):31–38. Chinese. | ||
Grant SF, Thorleifsson G, Reynisdottir I, et al. Variant of transcription factor 7-like 2 (TCF7L2) gene confers risk of type 2 diabetes. Nat Genet. 2006;38(3):320–323. | ||
Chang YC, Chang TJ, Jiang YD, et al. Association study of the genetic polymorphisms of the transcription factor 7-like 2 (TCF7L2) gene and type 2 diabetes in the Chinese population. Diabetes. 2007;56(10):2631–2637. | ||
Ng MC, Tam CH, Lam VK, So WY, Ma RC, Chan JC. Replication and identification of novel variants at TCF7L2 associated with type 2 diabetes in Hong Kong Chinese. J Clin Endocrinol Metab. 2007;92(9):3733–3737. | ||
Ren Q, Han XY, Wang F, et al. Exon sequencing and association analysis of polymorphisms in TCF7L2 with type 2 diabetes in a Chinese population. Diabetologia. 2008;51(7):1146–1152. | ||
Sale MM, Smith SG, Mychaleckyj JC, et al. Variants of the transcription factor 7-like 2 (TCF7L2) gene are associated with type 2 diabetes in an African-American population enriched for nephropathy. Diabetes. 2007;56(10):2638–2642. | ||
Lehman DM, Hunt KJ, Leach RJ, et al. Haplotypes of transcription factor 7-like 2 (TCF7L2) gene and its upstream region are associated with type 2 diabetes and age of onset in Mexican Americans. Diabetes. 2007;56(2):389–393. | ||
Chamberlain JJ, Rhinehart AS, Shaefer CF, Neuman A. Diagnosis and management of diabetes: synopsis of the 2016 American diabetes association standards of medical care in diabetes. Ann Intern Med. 2016;164(8):542–552. | ||
Shu L, Zheng PF, Zhang XY, et al. Association between dietary patterns and the indicators of obesity among Chinese: a cross-sectional study. Nutrients. 2015;7(9):7995–8009. | ||
Newby PK, Tucker KL. Empirically derived eating patterns using factor or cluster analysis: a review. Nutr Rev. 2004;62(5):177–203. | ||
Ren YJ, Su M, Liu QM, et al. Validation of the simplified Chinese-character version of the International Physical Activity Questionnaire-Long form in urban community-dwelling adults: a cross-sectional study in Hangzhou, China. Biomed Environ Sci. 2017;30(4):255–263. | ||
Macfarlane D, Chan A, Cerin E. Examining the validity and reliability of the Chinese version of the International Physical Activity Questionnaire, long form (IPAQ-LC). Public Health Nutr. 2011;14(3):443–450. | ||
Hu X, Peng W, Chen X, et al. No significant effect of ASAP1 gene variants on the susceptibility to tuberculosis in Chinese population. Medicine. 2016;95(21):e3703. | ||
Cunha DB, de Almeida RM, Sichieri R, Pereira RA. Association of dietary patterns with BMI and waist circumference in a low-income neighbourhood in Brazil. Br J Nutr. 2010;104(6):908–913. | ||
Li S, Guo S, He F, et al. Prevalence of diabetes mellitus and impaired fasting glucose, associated with risk factors in rural Kazakh adults in Xinjiang, China. Int J Environ Res Public Health. 2015;12(1):554–565. | ||
Odegaard AO, Koh WP, Butler LM, et al. Dietary patterns and incident type 2 diabetes in Chinese men and women: the Singapore Chinese Health Study. Diabetes Care. 2011;34(4):880–885. | ||
Montonen J, Knekt P, Härkänen T, et al. Dietary patterns and the incidence of type 2 diabetes. Am J Epidemiol. 2005;161(3):219–227. | ||
van Dam RM, Rimm EB, Willett WC, Stampfer MJ, Hu FB, Fb H. Dietary patterns and risk for type 2 diabetes mellitus in U.S. men. Ann Intern Med. 2002;136(3):201–209. | ||
Zheng PF, Shu L, Zhang XY, et al. Association between dietary patterns and the risk of hypertension among Chinese: a cross-sectional study. Nutrients. 2016;8(4):239. | ||
Nuñez-Cordoba JM, Alonso A, Beunza JJ, Palma S, Gomez-Gracia E, Martinez-Gonzalez MA. Role of vegetables and fruits in Mediterranean diets to prevent hypertension. Eur J Clin Nutr. 2009;63(5):605–612. | ||
Murakami K, Sasaki S, Okubo H, Takahashi Y, Hosoi Y, Itabashi M. Dietary fiber intake, dietary glycemic index and load, and body mass index: a cross-sectional study of 3931 Japanese women aged 18–20 years. Eur J Clin Nutr. 2007;61(8):986–995. | ||
Salmerón J, Manson JE, Stampfer MJ, Colditz GA, Wing AL, Willett WC. Dietary fiber, glycemic load, and risk of non-insulin-dependent diabetes mellitus in women. JAMA. 1997;277(6):472–477. | ||
Risérus U, Willett WC, Hu FB. Dietary fats and prevention of type 2 diabetes. Prog Lipid Res. 2009;48(1):44–51. | ||
Rulifson IC, Karnik SK, Heiser PW, et al. Wnt signaling regulates pancreatic beta cell proliferation. Proc Natl Acad Sci USA. 2007;104(15):6247–6252. | ||
Smith U. TCF7L2 and type 2 diabetes—we WNT to know. Diabetologia. 2007;50(1):5–7. | ||
Ruchat SM, Elks CE, Loos RJ, et al. Evidence of interaction between type 2 Diabetes susceptibility genes and dietary fat intake for adiposity and glucose homeostasis-related phenotypes. J Nutrigenet Nutrigenomics. 2009;2(4–5):225–234. | ||
Damcott CM, Pollin TI, Reinhart LJ, et al. Polymorphisms in the transcription factor 7-like 2 (TCF7L2) gene are associated with type 2 diabetes in the Amish: replication and evidence for a role in both insulin secretion and insulin resistance. Diabetes. 2006;55(9):2654–2659. |
Supplementary material
 | Table S1 The HWE test of the seven SNPs in DM group and control group Note: HWE was assessed by chi-squared test, and P>0.05 indicated the SNP obeyed HWE. Abbreviations: DM, diabetes mellitus; HWE, Hardy–Weinberg equilibrium; SNP, single-nucleotide polymorphism. |
 © 2019 The Author(s). This work is published and licensed by Dove Medical Press Limited. The full terms of this license are available at https://www.dovepress.com/terms.php and incorporate the Creative Commons Attribution - Non Commercial (unported, v3.0) License.
By accessing the work you hereby accept the Terms. Non-commercial uses of the work are permitted without any further permission from Dove Medical Press Limited, provided the work is properly attributed. For permission for commercial use of this work, please see paragraphs 4.2 and 5 of our Terms.
© 2019 The Author(s). This work is published and licensed by Dove Medical Press Limited. The full terms of this license are available at https://www.dovepress.com/terms.php and incorporate the Creative Commons Attribution - Non Commercial (unported, v3.0) License.
By accessing the work you hereby accept the Terms. Non-commercial uses of the work are permitted without any further permission from Dove Medical Press Limited, provided the work is properly attributed. For permission for commercial use of this work, please see paragraphs 4.2 and 5 of our Terms.