")
Back to Journals » Neuropsychiatric Disease and Treatment » Volume 12
Intelligence quotient discrepancy indicates levels of motor competence in preschool children at risk for developmental delays
Authors Yu T, Chen K , Chou W, Yang S, Kung S, Lee Y, Tung L
Received 24 November 2015
Accepted for publication 19 January 2016
Published 26 February 2016 Volume 2016:12 Pages 501—510
DOI https://doi.org/10.2147/NDT.S101155
Checked for plagiarism Yes
Review by Single anonymous peer review
Peer reviewer comments 2
Editor who approved publication: Professor Wai Kwong Tang
Tzu-Ying Yu,1 Kuan-Lin Chen,2,3 Willy Chou,4,5 Shu-Han Yang,4 Sheng-Chun Kung,4 Ya-Chen Lee,2 Li-Chen Tung4,6,7
1Department of Occupational Therapy, College of Medicine, I-Shou University, Kaohsiung, 2Department of Occupational Therapy, College of Medicine, National Cheng Kung University, Tainan, 3Department of Physical Medicine and Rehabilitation, National Cheng Kung University Hospital, College of Medicine, National Cheng Kung University, Tainan, 4Department of Physical Medicine and Rehabilitation, Chi-Mei Medical Center, Tainan, 5Department of Recreation and Health Care Management, Cha Nan University of Pharmacy and Science, Tainan, 6School of Medicine, Kaohsiung Medical University, Kaohsiung, 7School of Medicine, Chung Shan Medical University, Taichung, Taiwan
Purpose: This study aimed to establish 1) whether a group difference exists in the motor competence of preschool children at risk for developmental delays with intelligence quotient discrepancy (IQD; refers to difference between verbal intelligence quotient [VIQ] and performance intelligence quotient [PIQ]) and 2) whether an association exists between IQD and motor competence.
Methods: Children’s motor competence and IQD were determined with the motor subtests of the Comprehensive Developmental Inventory for Infants and Toddlers and Wechsler Preschool and Primary Scale of Intelligence™ – Fourth Edition. A total of 291 children were included in three groups: NON-IQD (n=213; IQD within 1 standard deviation [SD]), VIQ>PIQ (n=39; VIQ>PIQ greater than 1 SD), and PIQ>VIQ (n=39; PIQ>VIQ greater than 1 SD).
Results: The results of one-way analysis of variance indicated significant differences among the subgroups for the “Gross and fine motor” subdomains of the Comprehensive Developmental Inventory for Infants and Toddlers, especially on the subtests of “body-movement coordination” (F=3.87, P<0.05) and “visual-motor coordination” (F=6.90, P<0.05). Motor competence was significantly worse in the VIQ>PIQ group than in the NON and PIQ>VIQ groups. Significant negative correlations between IQD and most of the motor subtests (r=0.31–0.46, P<0.01) were found only in the VIQ>PIQ group.
Conclusion: This study demonstrates that 1) IQD indicates the level of motor competence in preschoolers at risk for developmental delays and 2) IQD is negatively associated with motor competence in preschoolers with significant VIQ>PIQ discrepancy. The first finding was that preschoolers with VIQ>PIQ discrepancy greater than 1 SD performed significantly worse on motor competence than did preschoolers without significant IQD and preschoolers with PIQ>VIQ discrepancy greater than 1 SD. However, preschoolers with significant PIQ>VIQ discrepancy performed better on motor competence than did preschoolers without significant IQD, though the difference was not statistically significant. The second finding was that preschoolers with larger VIQ>PIQ discrepancy had worse motor competence in visual-motor integration and body-movement coordination. Professionals should pay attention to the motor development of children with VIQ>PIQ discrepancy and evaluate children’s IQD along with their motor competence.
Keywords: IQ discrepancy, motor competence, child
Introduction
Intelligence quotient discrepancy (IQD) refers to the difference between measured verbal intelligence quotient (VIQ) and performance intelligence quotient (PIQ) obtained from the Wechsler Intelligence Scale.1 Intelligence quotient (IQ) is defined as the ability to understand complex ideas, adapt effectively to the environment, overcome obstacles, engage meaningfully in various forms of reasoning, and learn from experience.2 It is often measured with the Wechsler IQ Scale and used for the interpretation of intellectual strengths and weaknesses. It is also used for the diagnosis of clinical disorders. A large IQD, an atypical pattern of VIQ–PIQ differences, can be helpful in the diagnosis of children with autism3–6 and learning disability,7 as well as lateralized cerebral dysfunction.8–13 The study by Kalbfleisch and Loughan3 suggested that IQD is related to deficits of executive function in high-functioning autism. In the study by Joseph et al,14 discrepancies between verbal and nonverbal ability scores were found to occur at a significantly higher rate in both younger and older children with autism than in a normative sample. The study by D’Angiulli and Siegel7 also indicated that school-aged children with reading disabilities and arithmetic disability showed a significant IQD. Meulemans et al13 investigated the relationship between significant IQD and underlying neurological dysfunction in 49 children aged from 4 to 14 years with language, speech, or learning difficulties. Their results showed epilepsy to be the most common underlying neurological dysfunction in this specific population. The exploratory study by Liao et al15 showed that children with developmental delay were inclined to have a significant IQD. The above literature suggests that IQD exists in children with different developmental disabilities. In addition, the existing studies of IQD also indicate that a large IQD is related to the development of adaptive behavior, communication ability, and social impairment in children with autism.6,14,16 Based on the above implications in various well-defined groups, examining the IQD of a given individual can provide clinicians and educators with valuable information about the individual’s developmental strengths and weaknesses, along with suggestions for possible remediation.
Although IQD has been connected to several aspects of child development, including lateralized brain function, executive function, adaptive behavior, social skills, and communicative skills,3,6,8,13,14,16 no research has examined the association between IQD and motor competence. Motor competence can be defined as the quality of a person’s movement coordination when performing different motor skills on a continuum from gross to fine motor skills. Without proper motor competence development, children might struggle in school or might not participate in the appropriate amount of physical activity that promotes their health and prevents disease.17,18
Motor competence development is associated with a range of cognitive skills.19,20 In both research and clinical practice, motor delay is understood to be explained, at least in part, by intellectual abilities. In addition to substantial limitations in learning, reasoning and problem solving, and adaptive behavior,21 children with cognitive delay are also characterized by their compromised motor skills.22–24 PIQ seems crucial to motor function because spatial relations, visual sequencing, and other visual perceptual and visual-motor skills embedded in PIQ are needed for children to execute motor tasks.25,26 Therefore, when measuring motor difficulties or delays, clinicians and educators should consider children’s cognition when determining whether their poor motor performance is consistent with or below their intelligence and age. However, previous studies have focused more on the relations between motor competence and general cognitive delay. The difference between VIQ and PIQ, IQD, has been much less exhaustively investigated, especially in preschool-aged children. Therefore, the clinical value of IQD is unknown.
Kamphaus27 and Sattler28 posited that IQD could be related to motor competence. They hypothesized that one of the causes of IQD might be related to the development of visual-motor integration. They postulated that a PIQ<VIQ discrepancy (ie, PIQ points below VIQ points) may indicate limitations in visual-motor integration, and that PIQ>VIQ differences (ie, VIQ points below PIQ points) may present better visual-motor integration. However, they did not provide empirical evidence in support of their postulations. To the best of our knowledge, no published research has specifically examined the relationship between IQD and motor competence in children, even though some studies have found worse motor competence in people with cognitive delay.29,30
The lack of studies regarding IQD in children, especially in children of preschool age who are at risk for developmental delays, leaves clinicians with little guidance in this area. Therefore, in this study, we predefined groups of preschool children at risk for developmental delays according to the size of the discrepancy between the VIQ and PIQ to examine its association with motor competence. The objectives of the present study were to establish: 1) whether a group difference exists in the motor competence of preschool children at risk for developmental delays with IQ discrepancy and 2) whether an association exists between IQ discrepancy and motor competence in preschool children at risk for developmental delay. In this study, IQD is defined as discrepancy between VIQ and PIQ, with two directions of discrepancy: PIQ>VIQ and VIQ>PIQ.
Materials and methods
Participants
The participant data in this study were drawn from a retrospective chart review from the Child Development and Assessment Center of the Chi Mei Medical Center in Taiwan. The study was approved by the Institutional Review Board of the Chi Mei Medical Center. Informed consent was not obtained since de-identified data were analyzed and the retrospective study did not affect the health care of the included individuals. The participants were children at risk for developmental delays whose parents sought assessments after observing difficulties in daily or school activities. Inclusion criteria for the participants were a) age within the specified range of 2.5–6 years; b) absence of a diagnosed neurological, psychiatric, or disabled learning condition; and c) a measured full scale IQ (FSIQ) ≥70 indicating no intellectual disability. The total cohort consisted of 291 children (204 boys and 87 girls) with a mean age of 54.73 months (range: 30–72 months; standard deviation [SD] =10.66 months). There were 44 preterm children (15%). Of these 291 children, eight (3.1%) had very low birth weights (<1,500 g), 34 children (17%) had low birth weights (1,500 to <2,500 g), and 249 children (79.9%) had normal birth weights (≥2,500 g). The average ages of the fathers and mothers of the participating children were 37.8 (ranging from 21 to 61) and 34.0 (ranging from 20 to 48) years, respectively. The education levels of the mothers were categorized as follows: 1.1%, less than 6 years; 4.2%, 6 years (elementary-school graduate); 12.6%, 7–9 years (junior high school); 43.3%, 10–12 years (senior high school); 36.8%, 13–16 years (some college or technical school); and 1.9%, 17 years or greater (postgraduate). Demographic characteristics of all participants are shown in Table 1.
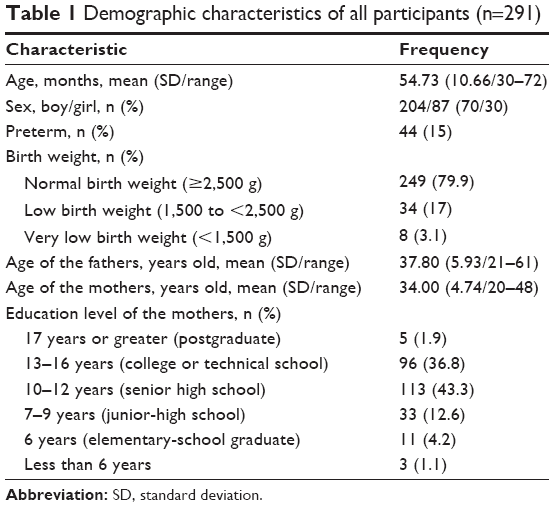 | Table 1 Demographic characteristics of all participants (n=291) |
Instruments
The Comprehensive Developmental Inventory for Infants and Toddlers
The motor subtests of the Comprehensive Developmental Inventory for Infants and Toddlers (CDIIT)31 were used for measuring the motor performance of the children in this study. The CDIIT, a norm-referenced measurement used for developmental assessment in children aged 3–72 months, is commonly used in Taiwan for developmental diagnosis.31,32 The CDIIT consists of five subtests assessing performance in the domains of cognition (81 items), motor (97 items), language (62 items), self-help (47 items), and social development (56 items).31 The motor subtest (motor domain) is divided into gross motor and fine motor. The gross motor subdomain includes “gravity compensation,” “locomotion,” and “body-movement coordination.” The fine motor subdomain includes “basic hand use” and “visual-motor coordination.” Wang et al31 constructed the motor subtest to measure fine and gross motor skills, and eye–hand coordination for purposeful, goal-orientated tasks in everyday life, based on the general recommendation that a child’s motor competence should be assessed from diverse perspectives with multiple measures.33
Each CDIIT item is scored 0 or 1, where 1 indicates success either during the test or according to the observations of the caregiver. The CDIIT raw scores can be transformed into developmental quotients (DQs). The CDIIT provides DQs for the aforementioned five subtests, 19 subdomains, and the whole test, with a mean of 100 and an SD of 15. DQs of the CDIIT were calculated from the norm with a 1-month interval for children younger than 24 months. After 24 months, DQs were obtained according to the norm of 3-month increments.31 DQs of ≥85 mean development within the normal range. Previous studies have shown that the CDIIT has acceptable reliability and validity.31,32,34–36 The CDIIT has shown acceptable test–retest reliability (intraclass correlation coefficient =0.76–1.00, P<0.01), inter-rater reliability (intraclass correlation coefficient =0.76–1.00, P<0.01),35 and internal consistency (Cronbach’s α =0.75–0.99).31 The validity for decisions has also been established.31,32,35,37–39 In terms of the validity of the CDIIT, the content validity,31 concurrent validity with the Bayley Scale of Infant Development – second edition,32,36 predictive validity for special education status,37 and the construct validity of the CDIIT34 have all been established.
Wechsler Preschool and Primary Scale of Intelligence™ – Fourth Edition
The Wechsler Preschool and Primary Scale of Intelligence™ – Fourth Edition (WPPSI™-IV),40 which measures general intelligence, yields verbal, performance, and total IQ scores.40 The WPPSI™-IV is an individually administered intelligence test that assesses a child’s current cognitive abilities in both verbal and nonverbal areas for children between the ages of 2 years 6 months to 7 years and 7 months. Younger children take fewer subtests than older children. In this study, we used the WPPSI™-IV to determine each child’s VIQ, PIQ, and FSIQ.
The VIQ test primarily assesses conceptual and logical reasoning, vocabulary, and information through the verbal mode. Questions are asked verbally by the rater and answered verbally by the child. The PIQ test evaluates spatial relations, visual sequencing, and other visual perceptual and visual-motor skills, largely in a nonverbal format. Together, the VIQ and PIQ give the FSIQ for presenting an overall measure of cognitive competence. An average IQ on the psychometric curve is demarcated at an FSIQ of 100. SDs are significant at 15 (P<0.01) and denote mild intellectual disability at 55–70, borderline intelligence at 70–85, normal intelligence at 85 or above, above average intelligence at 115–129, and superior intelligence at 130 or above.
The WPPSI™-IV has been shown to be highly reliable in terms of split-half reliability (0.77–0.87), inter-rater reliability (0.84–0.94), and test–retest reliability (0.86–0.91).40,41 The WPPSI™-IV also shows good validity with studies related to concurrent validity with the Standford–Binet, Wechsler Intelligence Scale for Children, and Wechsler Intelligence Scale for Children-R, predictive validity to achievement test scores, and construct validity based on factor analytic methods.41,42
Data analysis
First, we divided the participants into three subgroups based on the size of the discrepancy. IQD is defined as the absolute point value of the difference between VIQ and PIQ.1 When the discrepancy is greater than 15 points (ie, a 15-point discrepancy is required at the 1% level of significance),41,43 IQD is applied to illustrate statistical differences in typical populations, or clinical significance. Thus, we demarcated three subgroups based on the size of the discrepancy, identifying 1) a “NON IQ group (equivalent IQ),” comprising those with a discrepancy within 1 standard deviation (SD) (within 15 points, indicating no significant IQD), 2) a “VIQ>PIQ group,” and 3) a “PIQ>VIQ group,” comprising those with a discrepancy of greater than 1 SD (15 points or higher, indicating a significant IQD) to examine the impact greater IQD has on motor competence. The VIQ>PIQ group indicates PIQ points significantly below VIQ points (by more than 15 points); the PIQ>VIQ group indicates VIQ points significantly below PIQ points (by more than 15 points). The differences in basic clinical characteristics (ie, age, FSIQ, sex, birth weight, mother’s education, father’s and mother’s age, and preterm) among the three subgroups were tested by the analysis of variance (ANOVA) F-test for continuous variables and by overall chi-square tests for dichotomous variables.
A power analysis was conducted using GPower version 3.1.9.244 for the ANOVA analysis. Based on prior literature,36,45 the assessment measures of motor competence produced a small to medium effect size of 0.2. Therefore, in order to achieve a power of 0.85 to detect a small to medium effect size of 0.2 with an α level of 0.05, the minimum number of participants required was 279.
In order to test whether a statistical difference between the subgroups existed, a one-way ANOVA was used after testing the homoscedasticity with Levene’s test.46 When the Levene’s test results indicated that the homoscedasticity assumption was not met, Welch’s test was employed to account for data heteroscedasticity.46 When significant differences were identified, one-way ANOVA with post hoc analysis based on Games–Howell post hoc comparisons46 was performed to account for differences in the DQ of the motor subtests in the CDIIT between the subgroups.
Finally, Pearson correlation coefficients (r)46 were used to examine the relationships between the IQD and motor subtests of the CDIIT in each subgroup. For all tests, P-values <0.05 were taken as significant. PASW (formerly SPSS)47 version 18 was used for all statistical analyses.
Results
A total of 291 participants, including 213 children in the NON group, 39 children in the VIQ>PIQ group, and 39 children in the PIQ>VIQ group, participated in this study. Our sample size (N=291) in the study was modest for achieving a power of 0.85 to detect a small to medium effect size of 0.2 with an α level of 0.05. Descriptive data for the three groups (NON, VIQ>PIQ, and PIQ>VIQ groups) are provided in Table 2. There were no significant group differences in age (F(2,288)=0.024, P=0.197), FSIQ (F(2,288)=0.567, P=0.568), sex (P=0.966, Pearson chi-square test), birth weight (F(2,251)=0.259, P=0.772), mother’s education (F(2,258)=1.086, P=0.34), father’s (F(2,271)=2.784, P=0.07) and mother’s age (F(2,268)=2.298, P=0.09), or preterm birth (P=0.258, Pearson chi-square test). These results indicated that the characteristics did not differ among subgroups. The average FSIQ of all participants was 85.5 (SD =10.62, ranged from 71 to 131), and the average FSIQs of the three subgroups ranged from 85.02 to 86.69 (SD ranged from 9.68 to 10.82). These FSIQs were below the FSIQ of 100 in the psychometric curve, indicating that a significant portion of the sample fell into the borderline category of intelligence. The FSIQs of all the participants ranged from 71 to 131 (FSIQ >70), showing that they had different levels of intelligence, including borderline intelligence, normal intelligence, and above average intelligence.
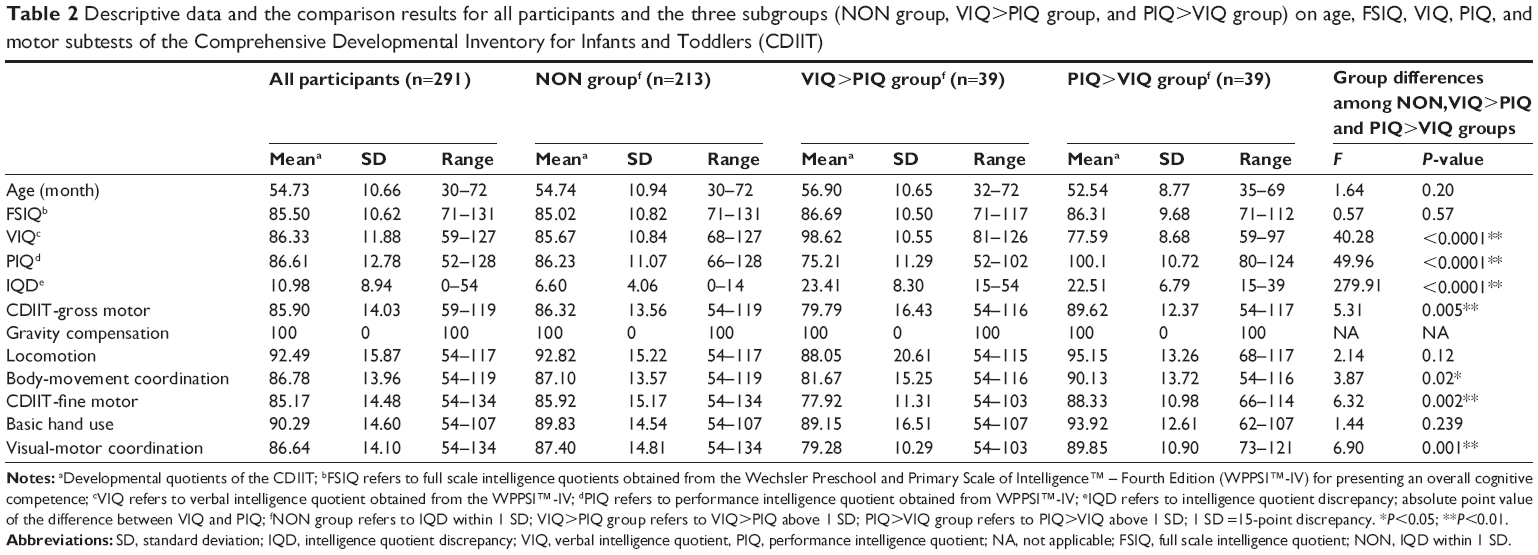 | Table 2 Descriptive data and the comparison results for all participants and the three subgroups (NON group, VIQ>PIQ group, and PIQ>VIQ group) on age, FSIQ, VIQ, PIQ, and motor subtests of the Comprehensive Developmental Inventory for Infants and Toddlers (CDIIT) |
All participants gained the highest score on the “gravity compensation” subtest of the CDIIT. The reason is that the “gravity compensation” subtest contains items related to standing and sitting balance, which were much easier for our sample, who were children at risk for developmental delays without any identified diagnosis. Therefore, we excluded the “gravity compensation” subtest in the following analyses because of its ceiling effect.
The differences in motor competence among the subgroups with different IQD
The assumption of equal variances for variables of the study was not met, according to Levene’s test (“locomotion” subtest, P<0.001; “fine motor” subdomain, P=0.03; “hand-use” subtest, P=0.03; “visual-motor coordination” subtest, P=0.02), so Welch’s test and one-way ANOVA were employed. The results of the ANOVA indicated differences among the three subgroups with statistical significance (P<0.05) for the four DQs of the motor subdomains and the subtests of the CDIIT, including the “gross motor” subdomain, especially in the “body-movement coordination” subtest, and the “fine motor” subdomain, especially in the “visual-motor coordination” subtest (F=5.31, P=0.005; F=3.87, P=0.02; F=6.32, P=0.002; F=6.90, P=0.001, respectively) (Table 2).
In order to further examine the group differences between pairs of subgroups (VIQ>PIQ vs NON; VIQ>PIQ vs PIQ>VIQ; PIQ>VIQ vs NON), we next performed post hoc Games–Howell tests to compare the motor subtest scores of the CDIIT with statistically significant group differences (Table 3). The scores of all the motor subtests of the CDIIT in the VIQ>PIQ group were lower than those of both the NON and PIQ>VIQ groups. Most of the differences were statistically significant in the “gross motor” subdomain (P=0.05 with NON group; P=0.01 with PIQ>VIQ group), especially in the “body-movement coordination” subtest (P=0.03 with PIQ>VIQ group), and in the “fine motor” subdomain (P=0.001 with NON group; P<0.001 with PIQ>VIQ group), especially in the “visual-motor coordination” subtest (P<0.001 with NON group; P<0.001 with PIQ>VIQ group). No group differences were found in the motor subtests of the CDIIT between the NON and PIQ>VIQ groups.
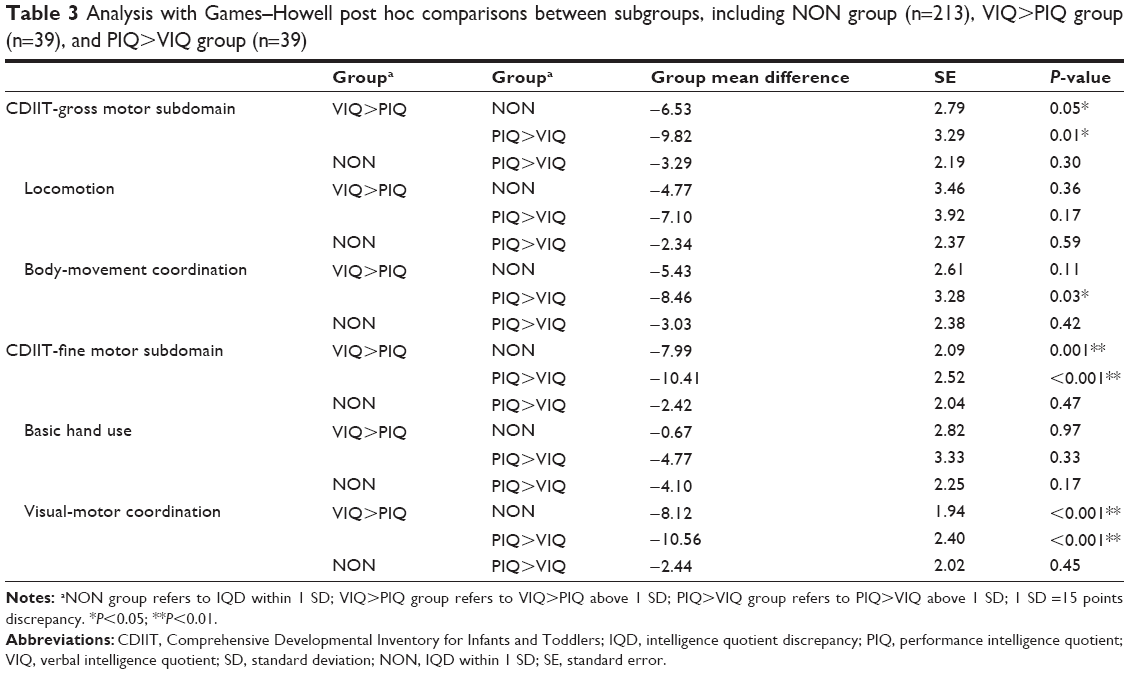 | Table 3 Analysis with Games–Howell post hoc comparisons between subgroups, including NON group (n=213), VIQ>PIQ group (n=39), and PIQ>VIQ group (n=39) |
The relationships between IQD and motor competence within each subgroup
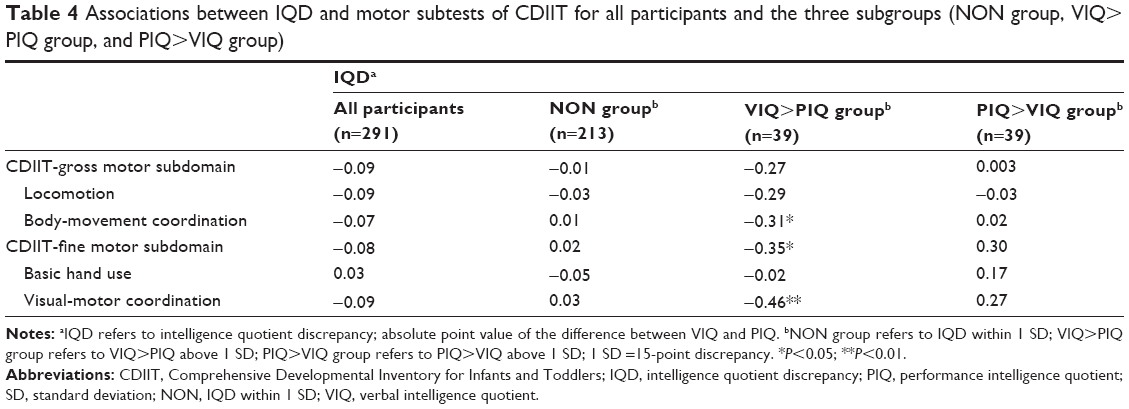
Table 4 shows the correlational results between IQD and motor competence for the NON, VIQ>PIQ, and PIQ>VIQ groups, as well as for all participants. Only in the VIQ>PIQ group did IQD have negative significant correlations with the “body-movement coordination” subtest (r=−0.31, P=0.05), the “fine motor” subdomain (r=−0.35, P=0.027), and the “visual-motor coordination” subtest (r=−0.46, P=0.003).
 | Table 4 Associations between IQD and motor subtests of CDIIT for all participants and the three subgroups (NON group, VIQ>PIQ group, and PIQ>VIQ group) |
In the PIQ>VIQ group, IQD had weak positive correlations with the “fine motor” subdomain (r=0.30, P=0.06) and the “visual-motor coordination” subtest (r=0.27, P=0.08) of the CDIIT; however, they were not significant. In all participants and the NON group, IQD showed no significant correlations with any motor subtests of the CDIIT.
Discussion
This study was the first to explore the association between IQD and motor competence. This current study examined whether children with different levels of IQD have differences in motor competence and whether a correlation exists between IQD and motor competence in preschool-age children at risk for developmental delays. This study has two important findings. First, the results of the study revealed significant differences in the DQs of the motor subtests of the CDIIT among children with different types of IQD (ie, VIQ>PIQ, NON, and PIQ>VIQ discrepancies), which reveals that IQD may be able to differentiate different levels of motor competence in fine motor and gross motor skills. Specifically, children with VIQ>PIQ discrepancy greater than 1 SD performed significantly worse on motor competence than children without significant IQD and children with PIQ>VIQ discrepancy greater than 1 SD. Although children with PIQ>VIQ discrepancy greater than 1 SD performed significantly better on motor competence than children with VIQ>PIQ discrepancy greater than 1 SD, they did not perform significantly better than children without significant IQD. Second, the findings of the study confirmed that the IQD of children with VIQ>PIQ discrepancy greater than 1 SD is significantly and negatively correlated with their motor competence on the “body-movement coordination” subtests, as well as on the “fine motor” subdomain, specifically on the “visual-motor coordination” subtests of the CDIIT. The results of this study should encourage clinicians, educators, and researchers to take VIQ>PIQ discrepancy into consideration when examining children’s motor function to identify the patterns of motor competence in preschool children at risk for developmental delays.
Regarding the finding of significant differences in motor competence among children with different levels of IQD, we found that the children at risk for developmental delay performed differently on the gross motor and fine motor tasks. Furthermore, the scores of the VIQ>PIQ group in the “gross motor” and “fine motor” subdomains of the CDIIT were significantly lower than those of both the NON and PIQ>VIQ groups, demonstrating that the body-movement coordination and visual-motor coordination of the children with significant VIQ>PIQ discrepancy were worse than those of children without significant IQD or significant PIQ>VIQ discrepancy. This finding indicates that VIQ>PIQ discrepancy greater than 1 SD may strongly relate to the development of motor competence in preschool children, especially in the development of both fine motor coordination and gross motor coordination. This finding also reveals that when children have VIQ>PIQ discrepancy greater than 1 SD, more attention should be paid to their motor development in terms of body-movement coordination and visual-motor coordination.
On the other hand, the body-movement coordination and visual-motor coordination of children with significant PIQ>VIQ discrepancy were better than those of children with significant VIQ>PIQ, but not significantly better than those of children without IQD. Our findings verify the suggestion by previous researchers27,28 that a VIQ>PIQ discrepancy indicates limitations in visual-motor integration; however, they do not verify that children with PIQ>VIQ discrepancy have better visual-motor integration. Our findings support and provide empirical evidence that a VIQ>PIQ discrepancy implies limitations in visual-motor integration and body-movement coordination.
A possible explanation for the aforementioned results on the relationship between IQD and motor competence is the longstanding clinical belief that IQD is correlated with neurological dysfunction. Satz,48 for example, reported that VIQ was lower than PIQ in patients with left hemisphere damage and that VIQ was higher than PIQ in patients with right hemisphere damage. The VIQ>PIQ group of children in our study with relatively higher VIQ and lower PIQ may have had undetermined motor dysfunction and thus performed poorly on motor competence. The results of this study imply that VIQ>PIQ discrepancy may be a crucial indicator for children at risk for developmental delay, as it may detect their underlying neurological dysfunction. In the subgroups of children with no significant IQD and children with significant PIQ>VIQ discrepancy, their PIQ may have been adequate for them to execute the general fine motor and gross motor tasks of the CDIIT motor assessment used in this study. If instead of general motor tasks, the children were asked to execute more complicated or difficult motor tasks, such as exercise, basketball game, or handwriting, the PIQ>VIQ group of children might show significantly better motor competence than the other two groups because of their higher PIQ. Further research is needed to explore the relationships between IQD and advanced motor competence by using assessments with more difficult motor tasks. It is also crucial for future studies to investigate further the relationships between measured IQD and motor skill, as well as to evaluate the impact of each IQD on daily participation, academic achievement, social participation, and other longer-term outcomes.
Regarding the second finding that VIQ>PIQ discrepancy is negatively correlated with children’s motor competence, the VIQ>PIQ group had negative correlations among IQD and the subtest scores of the CDIIT, including the “body-movement coordination” subtest and “fine motor” subdomain, especially on the “visual-motor coordination” subtest. This result demonstrates that as VIQ>PIQ discrepancy increases, children’s motor subtest scores of the CDIIT decrease; in other words, when children have a larger VIQ>PIQ discrepancy, they perform worse on motor competence. Furthermore, the PIQ>VIQ discrepancy was positively correlated with most of the motor subtests of the CDIIT, though the correlations were not significant. These findings are consistent with the results of between-group comparisons in this study, demonstrating that VIQ>PIQ discrepancy and PIQ>VIQ discrepancy have a special relationship with motor competence, one which is more obvious in children whose VIQ is greater than their PIQ by more than 1 SD.
In addition, for the participants in the study overall, FSIQ (r=0.16–0.32, P<0.01) and PIQ (r=0.16–0.40, P<0.01) were significantly and positively correlated with all motor subdomains and subtests of the CDIIT. Their VIQ (r=0.14–0.18, P<0.01) was significantly and positively correlated with all motor subdomains and subtests of the CDIIT except the subtests of “locomotion” and “hand use.” FSIQ and PIQ had significantly higher correlations with motor competence than VIQ. This result suggests that better PIQ or FSIQ may be related to better motor competence. These findings are consistent with studies by Liao et al29 and Chen,30 which illustrated the relation of intelligence to motor skills in a cognitive delay group. Liao et al29 investigated the motor competence of 53 children aged 8–99 months and diagnosed with nonspecific cognitive delay. They concluded that the delay in motor competence was greater in children with severe cognitive delay than in those with mild to moderate cognitive delay. Chen’s30 study compared balance control in 20 children with cognitive delay and 20 mentally normal children. The results of this study showed that children with normal intelligence performed significantly better than those with cognitive delay. While the study by Liao et al29 only confirmed that intelligence is related to motor competence in children with cognitive delay and Chen’s30 study only supported that the performance of balance control differed between children with normal mentality and those with cognitive delay, the findings of the present study confirm that a significantly positive association exists between PIQ/FSIQ and motor competence and further establishes the association of IQD with motor competence in preschool children at risk for developmental delays.
The findings of this study suggest important implications for clinicians and educators working with preschool-aged children who have trouble mastering motor skills. Any professional who works with children with fine motor or gross motor difficulties should consider all the factors that may be related to their motor competence, including the factor of IQD identified in this article. The results of this study demonstrate significant differences in the motor competence of children with different levels of IQD, as well as an association between VIQ>PIQ discrepancy and the motor subtests of the CDIIT, supporting the relationship of VIQ>PIQ discrepancy to motor competence. Since children with motor difficulties may have VIQ>PIQ discrepancy, we suggest that professionals evaluate children’s IQD when evaluating their motor competence and intelligence. Based on the negative correlations between VIQ>PIQ discrepancy and body-movement coordination/visual-motor coordination, it appears that in children with significant VIQ>PIQ discrepancy, those having a smaller IQD will demonstrate better motor competence, and those having a larger IQD will demonstrate worse motor performance. Our results also show that for children with significant PIQ>VIQ discrepancy, IQ discrepancy and motor competence are positively, but not significantly, correlated. Further investigation for the association between IQD and motor performance in children with PIQ>VIQ discrepancy is suggested, and professionals should look for alternative contributing factors for their motor competence.
Several limitations of the present study should be recognized. First, a larger sample size of VIQ>PIQ and PIQ>VIQ children with superior intellectual function could increase the understanding of the preliminary findings reported here. The most significant correlations and most significant group differences on the motor subtests of the CDIIT that emerged came from the VIQ>PIQ group, which had a comparably small sample size (39). However, the correlations did persist across the groups as a whole, albeit at more modest but still significant values. Second, the subtest “gravity compensation” of the CDIIT was not appropriate for use in our sample because of the ceiling effect. This study investigated the association between IQD and motor competence as assessed by the motor subtests of the CDIIT, which is a developmental test used in clinics for the early identification of developmental delays in infants and toddlers. While this gave us preliminary evidence on how motor subskills are correlated to IQD, the subtest “gravity compensation” was not appropriate for assessing our sample because it was too easy for all the participants. Other comprehensive motor-focused assessment tools may lead to a specific insight about how these motor skills emerge and develop in preschool children. Third, the average FSIQ of our sample was below the average FSIQ of 100 in the psychometric curve. Because of the impact of IQD on motor competence in preschool children, particular attention should be paid to preschool-aged children in the lower part (mean FSIQ =85.5, SD =10.62, range from 71 to 131) of the psychometric intelligence curve. Fourth, while the findings support an association between IQD and motor competence, they cannot be interpreted to suggest causality.
Conclusion
This study yielded a noteworthy finding: Preschool-age children at risk for developmental delays with different types of IQD have differences in motor competence. Especially, children with significant VIQ>PIQ perform worse on motor competence than children without significant IQD and children with significant PIQ>VIQ. It is likely that IQD is significantly associated with preschool-age children’s motor competence in children with significant VIQ>PIQ. It is important to assess IQD and its relationship with motor competence. Professionals should pay more attention to the motor skills of children with IQD. Especially, when working with children with VIQ>PIQ discrepancy, professionals should pay attention to their IQD. Understanding IQD in preschool children at risk for developmental delays could benefit therapists, parents, teachers, and primary care providers and allow them to offer assistance that might prove helpful for children with motor skill difficulties.
Disclosure
The authors report no conflicts of interest in this work.
References
Seashore HG. Differences between verbal and performance IQs on the Wechsler Intelligence Scale for children. J Consult Psychol. 1951;15(1):62–67. | ||
Matthews DJ, Foster JF. Beyond Intelligence: Secrets for Raising Happily Productive Kids. Toronto, Ontario: House of Anansi Press; 2014. | ||
Kalbfleisch ML, Loughan AR. Impact of IQ discrepancy on executive function in high-functioning autism: Insight into twice exceptionality. J Autism Dev Disord. 2012;42(3):390–400. | ||
Lincoln AJ, Courchesne E, Kilman BA, Elmasian R, Allen M. A study of intellectual abilities in high-functioning people with autism. J Autism Dev Disord. 1988;18(4):505–524. | ||
Siegel DJ, Minshew NJ, Goldstein G. Wechsler IQ profiles in diagnosis of high-functioning autism. J Autism Dev Disord. 1996;26(4):389–406. | ||
Black D, Wallace G, Sokoloff J, Kenworthy L. Brief report: IQ split predicts social symptoms and communication abilities in high-functioning children with autism spectrum disorders. J Autism Dev Disord. 2009;39(11):1613–1619. | ||
D’Angiulli A, Siegel LS. Cognitive functioning as measured by the WISC-R: Do children with learning disabilities have distinctive patterns of performance? J Learn Disabil. 2003;36:48–58. | ||
Blackburn LB, Lee GP, Westerveld M, Hempel A, Park YD, Loring DW. The verbal IQ/performance IQ discrepancy as a sign of seizure focus laterality in pediatric patients with epilepsy. Epilepsy Behav. 2007;10(1):84–88. | ||
Hermann BP, Gold J, Pusakulich R, et al. Wechsler Adult Intelligence Scale-revised in the evaluation of anterior temporal lobectomy candidates. Epilepsia. 1995;36:480–487. | ||
Kim H, Yi S, Son EI, Kim J. Differential effects of left versus right mesial temporal lobe epilepsy on Wechsler intelligence factors. Neuropsychology. 2003;17:556–565. | ||
Sattler JM. Assessment of Children’s Intelligence. Philadelphia: Saunders; 1974. | ||
Zimmerman IL, Woo-Sam J. Research with the Wechsler Intelligence Scale for Children: 1960–1970. Psychol Sch. 1972;9:232–271. | ||
Meulemans J, Goeleven A, Zink I, Loyez L, Lagae L, Debruyne F. Underlying neurological dysfunction in children with language, speech or learning difficulties and a verbal IQ-performance IQ discrepancy. B-ENT. 2012;8(2):71–76. | ||
Joseph RM, Tager-Flusberg H, Lord C. Cognitive profiles and social-communicative functioning in children with autism spectrum disorder. J Child Psychol Psychiatry. 2002;43(6):807–821. | ||
Liao SF, Liu JC, Hsu CL, Chang MY, Chang TM, Cheng H. Cognitive development in children with language impairment, and correlation between language and intelligence development in kindergarten children with developmental delay. J Child Neurol. 2015;30(1):42–47. | ||
Klin A, Saulnier CA, Sparrow SS, Cicchetti DV, Volkmar FR, Lord C. Social and communication abilities and disabilities in higher functioning individuals with autism spectrum disorders: The Vineland and the ADOS. J Autism Dev Disord. 2007;37(4):748–759. | ||
Bushnell EW, Boudreau JP. Motor competence and the mind: The potential role of motor abilities as a determinant of aspects of perceptual development. Child Dev. 1993;64:1005–1021. | ||
Davies D. Child Development: A Practitioner’s Guide. 2nd ed. New York: Guilford Press; 2004. | ||
Campos JJ, Anderson DI, Barbu-Roth MA, Hubbard EM, Hertenstein MJ, Witherington D. Travel broadens the mind. Infancy. 2000;1(2):149–219. | ||
Piek JP, Dawson L, Smith LM, Gasson N. The role of early fine and gross motor development on later motor and cognitive ability. Hum Mov Sci. 2008;27(5):668–681. | ||
Schalock RL, Borthwick-Duffy SA, Bradley VJ, et al. Intellectual Disability: Definition, Classification, and Systems of Supports. 11th ed. Washington, DC: American Association on Intellectual and Developmental Disabilities; 2010. | ||
Frey GC, Chow B. Relationship between BMI, physical fitness, and motor skills in youth with mild intellectual disabilities. Int J Obes (Lond). 2006;30(5):861–867. | ||
Simons J, Daly D, Theodorou F, Caron C, Andoniadou E. Validity and reliability of the TGMD-2 in 7–10-year-old Flemish children with intellectual disability. Adapt Phys Activ Q. 2008;25(1):71–82. | ||
Smits-Engelsman B, Hill EL. The relationship between motor coordination and intelligence across the IQ range. Pediatrics. 2012;130(4):e950–e956. | ||
Carroll JB. Human Cognitive Abilities: A Survey of Factor-Analytic Studies. Cambridge, England: Cambridge University Press; 1993. | ||
Carroll JB. The three-stratum theory of cognitive abilities. In: Flanagan DP, Genshaft JL, Harrison PL, editors. Contemporary Intellectual Assessment: Theories, Tests, and Issues. New York: Guilford Press; 1997:122–130. | ||
Kamphaus RW. Clinical Assessment of Children’s Intelligence: A Handbook for Professional Practice. Boston, MA: Allyn and Bacon; 1993. | ||
Sattler JM. Assessment of Children’s Intelligence. Revised and Updated 3rd ed. San Diego, CA: Jerome Sattler; 1992. | ||
Liao HF, Lee SC, Lien IN. [The motor development of children with non-specific mental retardation and analysis of the related factors]. J Phys Ther Assoc R.O.C. 1991;16(2):133–145. Chinese. | ||
Chen JL. [Comparison of balance control between mental retardation and normal students]. J Phys Educ Sport. 2006;17(1):45–57. Chinese. | ||
Wang TM, Su CW, Liao HF, Lin LY, Chou KS, Lin SH. [The standardization of the Comprehensive Developmental Inventory for Infants and Toddlers]. Psychol Test. 1998;45:19–46. Chinese. | ||
Liao HF, Wang TM, Yao G, Lee WT. Concurrent validity of the Comprehensive Developmental Inventory for Infants and Toddlers with the Bayley Scales of Infant Development-II in preterm infants. J Formos Med Assoc. 2005;104:731–737. | ||
Bayley N. Bayley Scales of Infant and Toddler Development. 3rd ed. San Antonio, TX: Harcourt Assessment; 2006. | ||
Hwang AW, Weng LJ, Liao HF. Construct validity of the Comprehensive Developmental Inventory for Infants and Toddlers. Pediatr Int. 2010;52:598–606. | ||
Liao HF, Pan YL. Test-retest and inter-rater reliability for the Comprehensive Developmental Inventory for Infants and Toddlers diagnostic and screening tests. Early Hum Dev. 2005;81(11):927–937. | ||
Liao HF, Yao G, Wang TM. Concurrent validity in Taiwan of the Comprehensive Developmental Inventory for Infants and Toddlers who were full term infants. Percept Mot Skills. 2008;107:29–44. | ||
Wang TM. [Predictive validity of Comprehensive Developmental Inventory for Infants and Toddlers (CDIIT)]. Bull Spec Educ. 2005;29:1–24. Chinese. | ||
Wang TM, Liao HF. [Assessment accuracy and cut-off points of Comprehensive Developmental Inventory for Infants and Toddlers (CDIIT)]. Bull Spec Educ. 2007;32:1–15. Chinese. | ||
Wu HY, Liao HF, Yao G, Lee WT, Wang TM, Hsieh JY. Diagnostic accuracy of the motor subtest of Comprehensive Developmental Inventory for Infants and Toddlers and the Peabody Developmental Motor Scales-Second Edition. J Formos Med Assoc. 2005;9:312–322. | ||
Wechsler D. Wechsler Intelligence Scale for Children. 4th ed. San Antonio, TX: Psychological Corporation; 2003. | ||
Wechsler D. Manual for the Wechsler Preschool and Primary Scale of Intelligence-Revised (WPPSI). San Antonio, TX: Psychological Corporation; 1967. | ||
Anastasi A. Psychological Testing. New York: Macmillan; 1988. | ||
Kaufman AS. Assessing Adolescent and Adult Intelligence. Needham, MA: Allyn and Bacon; 1990. | ||
Faul F, Erdfelder E, Lang AG, Buchner A. G*Power 3: a flexible statistical power analysis program for the social, behavioral, and biomedical sciences. Behav Res Methods. 2007;39(2):175–191. | ||
Wang HH, Liao HF, Hsieh CL. Reliability, sensitivity to change, and responsiveness of the Peabody Developmental Motor Scales-Second Edition for children with cerebral palsy. Phys Ther. 2006;86(10):1351–1359. | ||
Field AP. Discovering Statistics Using SPSS. London: Sage Publications Ltd; 2009. | ||
PASW. PASW [Computer Software]. 18 ed. Chicago: SPSS; 2009. | ||
Satz P. Specific and nonspecific effects of brain lesions in man. J Abnorm Psychol. 1966;71(1):65–70. |
 © 2016 The Author(s). This work is published and licensed by Dove Medical Press Limited. The full terms of this license are available at https://www.dovepress.com/terms.php and incorporate the Creative Commons Attribution - Non Commercial (unported, v3.0) License.
By accessing the work you hereby accept the Terms. Non-commercial uses of the work are permitted without any further permission from Dove Medical Press Limited, provided the work is properly attributed. For permission for commercial use of this work, please see paragraphs 4.2 and 5 of our Terms.
© 2016 The Author(s). This work is published and licensed by Dove Medical Press Limited. The full terms of this license are available at https://www.dovepress.com/terms.php and incorporate the Creative Commons Attribution - Non Commercial (unported, v3.0) License.
By accessing the work you hereby accept the Terms. Non-commercial uses of the work are permitted without any further permission from Dove Medical Press Limited, provided the work is properly attributed. For permission for commercial use of this work, please see paragraphs 4.2 and 5 of our Terms.