")
Back to Journals » Cancer Management and Research » Volume 13
Integrated Proteomics and Bioinformatics to Identify Potential Prognostic Biomarkers in Hepatocellular Carcinoma
Authors Zhang Q, Xiao Z, Sun S, Wang K, Qian J, Cui Z, Tao T , Zhou J
Received 18 November 2020
Accepted for publication 28 January 2021
Published 11 March 2021 Volume 2021:13 Pages 2307—2317
DOI https://doi.org/10.2147/CMAR.S291811
Checked for plagiarism Yes
Review by Single anonymous peer review
Peer reviewer comments 2
Editor who approved publication: Professor Harikrishna Nakshatri
Qifan Zhang,1,* Zhen Xiao,2,* Shibo Sun,1 Kai Wang,1 Jianping Qian,1 Zhonglin Cui,1 Tao Tao,3 Jie Zhou1
1Division of Hepatobiliopancreatic Surgery, Department of General Surgery, Nanfang Hospital, Southern Medical University, Guangzhou, Guangdong Province, 510515, People’s Republic of China; 2College of Life Sciences, Shanghai Normal University, Shanghai, 200234, People’s Republic of China; 3Department of Anesthesiology, Central People’s Hospital of Zhanjiang, Zhanjiang, Guangdong Province, 524045, People’s Republic of China
*These authors contributed equally to this work
Correspondence: Tao Tao; Jie Zhou Email [email protected]; [email protected]
Background: Liver hepatocellular carcinoma (HCC) is the third most common cause of death by cancer and has a high mortality world-widely. Approximately 75– 85% of primary liver cancers are caused by HCC. Uncovering novel genes with prognostic significance would shed light on improving the HCC patient’s outcome.
Objective: In this research, we aim to identify novel prognostic biomarkers in hepatocellular carcinoma.
Methods: Integrated proteomics and bioinformatics analysis were performed to investigate the expression landscape of prognostic biomarkers in 24 paired HCC patients.
Results: As a result, eight key genes related to prognosis, including ACADS, HSD17B13, PON3, AMDHD1, CYP2C8, CYP4A11, SLC27A5, CYP2E1, were identified by comparing the weighted gene co-expression network analysis (WGCNA), proteomic differentially expressed genes (DEGs), proteomic turquoise module, The Cancer Genome Atlas (TCGA) cohort DEGs of HCC. Furthermore, we trained and validated eight pivotal genes integrating these independent clinical variables into a nomogram with superior accuracy in predicting progression events, and their lower expression was associated with a higher stage/risk score. The Gene Set Enrichment Analysis (GSEA) further revealed that these key genes showed enrichment in the HCC regulatory pathway.
Conclusion: All in all, we found that these eight genes might be the novel potential prognostic biomarkers for HCC and also provide promising insights into the pathogenesis of HCC at the molecular level.
Keywords: hepatocellular carcinoma, HCC, proteomics, bioinformatics analysis, prognosis, biomarkers
Introduction
Liver hepatocellular carcinoma (HCC) has been extensively studied as one of the most common and devastating malignancies.1–3 Approximately 75–85% of primary liver cancers are caused by HCC and it is the third leading cause of death by cancer globally.4 The unclear molecular mechanism led to the poor progression of the HCC. Although numerous studies have a focus on the molecular understanding and treatment strategy of the HCC, patient survival remains at a dismally low rate which less than 8 months.5,6 It is important to uncover novel genes with prognostic significance that shed light on improving the HCC patient’s outcome. Therefore, exploring new targets for early diagnosis and treatment of HCC is of great meaning.
A single gene or protein or any biomolecule is not responsible for any disorder or disease. However, a collection of genes coordinating with each other leads to disease occurrence. The weighted gene co-expression network analysis (WGCNA) was widely performed as an analysis method for large-scale data sets and find highly relevant gene modules, which are used to construct a free-scale gene co-expression network.7,8 Related module detection helps in integrating various networks with varied molecular profiles to identify candidate biomarkers or therapeutic targets in many diseases,9 such as depressive order10 and chronic kidney disease.11 Lau et al established an unfolding gene–gene relationship network based on differentially regulated genes of HCC.12 In the current, network-based analysis has been widely employed to characterize specific physiological functions, signaling and metabolic networks, and genes with clinical significance in HCC.13
In this study, we aimed to profile a collection of novel genes as potential biomarkers for the diagnosis of HCC. We identified eight pivotal genes of HCC by the WGCNA, Protein-Protein Interaction (PPI), proteomic DEGs, TCGA cohort DEGs and TCGA cohort KM of HCC. The proposed algorithm was used in the development of module detection study specifically for co-expression network in HCC. An integrated methodological description highlights protein correlated to identify key genes for HCC, strengthening the experimental validation and drug therapeutics to diagnose and prognosis of HCC.
Methods
Patients and Tissue Samples
A total of 24 pairs of HCC and corresponding adjacent non-tumor specimens used for proteomics examination were simultaneously obtained from 24 HCC patients in Nanfang Hospital, Southern Medical University. All clinical samples in vitro were stored at -80 °C. Patients were not subjected to any neoadjuvant therapy before surgery. And the patients’ information was obtained from medical charts and follow-up. Informed consent was obtained from each patient. The study was approved by the Protection of Human Subjects Committee of Nanfang Hospital (approval no. NFEC-201801-K4). We obeyed the principles of the 1983 Declaration of Helsinki. All experiments in this paper obeyed this principle.
Data Independent Acquisition Proteomics
All the samples were lysed in 8 M urea-containing protease and phosphatase inhibitors (ThermoFisher Scientific, MA, USA). Protein concentration was determined by Bradford protein assay. Trypsin (Promega, Madison, WI) was added to digest the proteins at 37°C. DIA was performed with 45 isolation windows, and each window overlapped 1 m/z, total cycle time was 3.98 s. The DIA data were processed and analyzed by Spectronaut X (Biognosys, Schlieren, Switzerland) with default settings. The retention time prediction type was set to dynamic iRT. Spectronaut X determined the data extraction and the ideal extraction window dynamically depending on iRT calibration and gradient stability. FDR cutoff on precursor and protein level was lower than 1%. Decoy generation was set to mutated apply a random number of amino acid position swamps (min=2, max=length/2). Otherwise, all the selected fragment ions passing the filters were used for quantification.
Data Acquisition
Data were obtained from the following approaches: RNA sequencing data and clinical information (including gender, age, stage, clinical stage, pathological grade, tumor pathology subtype, overall survival time) for HCC data type and corresponding clinical features of 40 normal samples and 372 cancer samples were obtained from TCGA database (http://portal.gdc.cancer.gov).14
Differentially Expressed Genes (DEGs) Screening
In R 3.6.1 (R Foundation for Statistical Computing, Vienna, Austria), the optimal cutoff values for overall survival analysis of stromal score by maxstat package were used as the grouping criterion.15 Sequencing data were normalized and analyzed for differences. In order to reduce the false-positive rate, log2 |fold change (FC)| was corrected by the “ashr” method.16 |FC| > 2 and P < 0.05 were used as the screening criteria for DEGs.
Construction of Protein-Protein Interaction (PPI) Network
The genes related to clinical progression were imported into the STRING online database (https://string-db.org),17 and a PPI network was constructed with a mutual score greater than 0.4 as a threshold. The plug-in in Cytoscape v3.6.1 was used to screen the top 30 genes in the network as the central genes using five algorithms: betweenness, closeness, degree, Edge Percolated Component (EPC), and Maximal Clique Centrality (MCC).18,19 The genes obtained by various algorithms were intersected to obtain the hub genes.
Functional Enrichment Analysis
Gene Ontology (GO) analysis is to describe the biological and molecular functions of genes and to describe different levels and dimensions of cellular components.20,21 Kyoto Encyclopedia of Genes and Genomes (KEGG) pathway analysis can bring together genes that are highly similar in sequence and perform the same function.22 DAVID (https://david.ncifcrf.gov) provides a comprehensive set of functional annotation tools for investigators to understand the biological meaning behind a large list of genes.23 DEGs in the key module were put into DAVID for GO and KEGG analysis. P < 0.05 was set as the screening criteria for analysis results.
Weighted Gene Co-Expression Networks and Their Modules
A co-expression network targeting DEGs was established by using the R package Weighted gene co-expression networks and their modules (WGCNA) (version 1.68).24 WGCNA is a freely accessible R software package (version R 3.6.0), developed for the construction of weighted gene co-expression networks. Rather than focus only on differential gene expression, WGCNA uses information from the genome to identify a set of genes of interest and converts the association of thousands of genes with phenotypes into associations between several gene sets and phenotypes, eliminating the problem of multiple hypothesis test correction. The parameter β is a soft-thresholding power parameter that strengthens strong correlations and penalizes weak correlations between genes. A hierarchical clustering tree was constructed with different branches of the tree representing different gene modules. The adjacency matrix was transformed into a topological overlap matrix (TOM). Genes were divided into different gene modules based on the TOM-based dissimilarity measure.
Gene Set Enrichment Analysis (GSEA)
The GSEA was used to screen the significantly changed pathways.25 Pre-ranked GSEA was performed with 1000 permutations. The P-value was calculated by family-wise error rate (FWER), which is a robust method for multiples testing.26 The GSEA plots were visualized by limma R package.27
Statistical Analysis
Unpaired Student’s t-test was employed to perform the two-group comparison. t-test was utilized to analyze the difference between the T and P groups. A p-value <0.05 as well as |fold change| >2 was used to filter DEGs.
Results
Identification of DEGs Associated with the HCC and GO/KEGG Analysis
To identify the DEGs of HCC, we subjected sample from 24 pairs of samples including coupled HCC and adjacent non-tumorous tissues. As seen in Figure 1A, the heatmaps showed that 185 proteomic DEGs were significantly differentially expressed in carcinoma compared with adjacent non-tumor tissues (|FC|>2, p<0.05). What's more, 77 proteomic DEGs were significantly upregulated and 108 were downregulated. To analyze the biological functions of the highly significant module of 161 DEGs systematically, we constructed a PPI network based on STRING database and was visualized by Cytoscape 3.4.0 (Figure 1B). The PPI complex was filtered to obtain 152 nodes and 586 pairs of PPI relationships. Thereafter, to detect the fundamental function of DEGs, GO term and KEGG pathway enrichment analysis were performed. The results revealed that the red module was mainly enriched in the small molecule catabolic (GO: 0044282, P = 6.73e–19) and participated in the retinol metabolism pathway (hsa00830, P = 2.82e–15) (Figure 2).
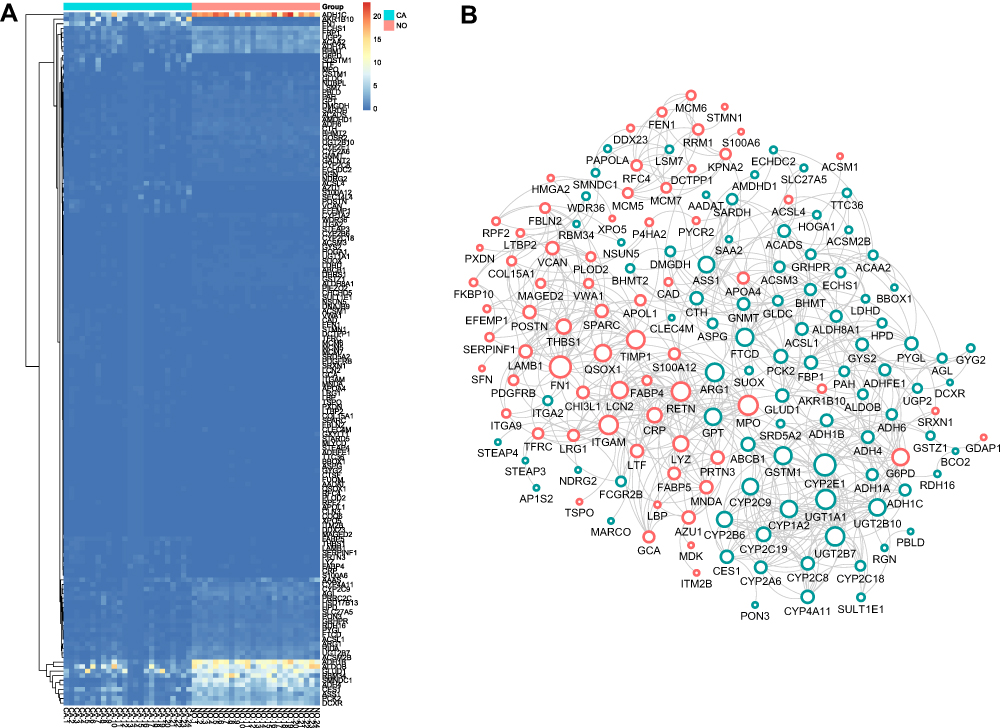 |
Figure 1 DEGs identification and Construction of the PPI network. (A) The heatmap of DEGs between the LIHC and adjacent non-tumorous tissues. (B) Protein-protein interaction (PPI) network of 185 common DEGs. Upregulated DEGs were labeled in red and down-regulated were labeled in blue; p-value and fold change were log-transformed, and applied as the bolder with and node fill color; topological degree was used as the criteria for node size. |
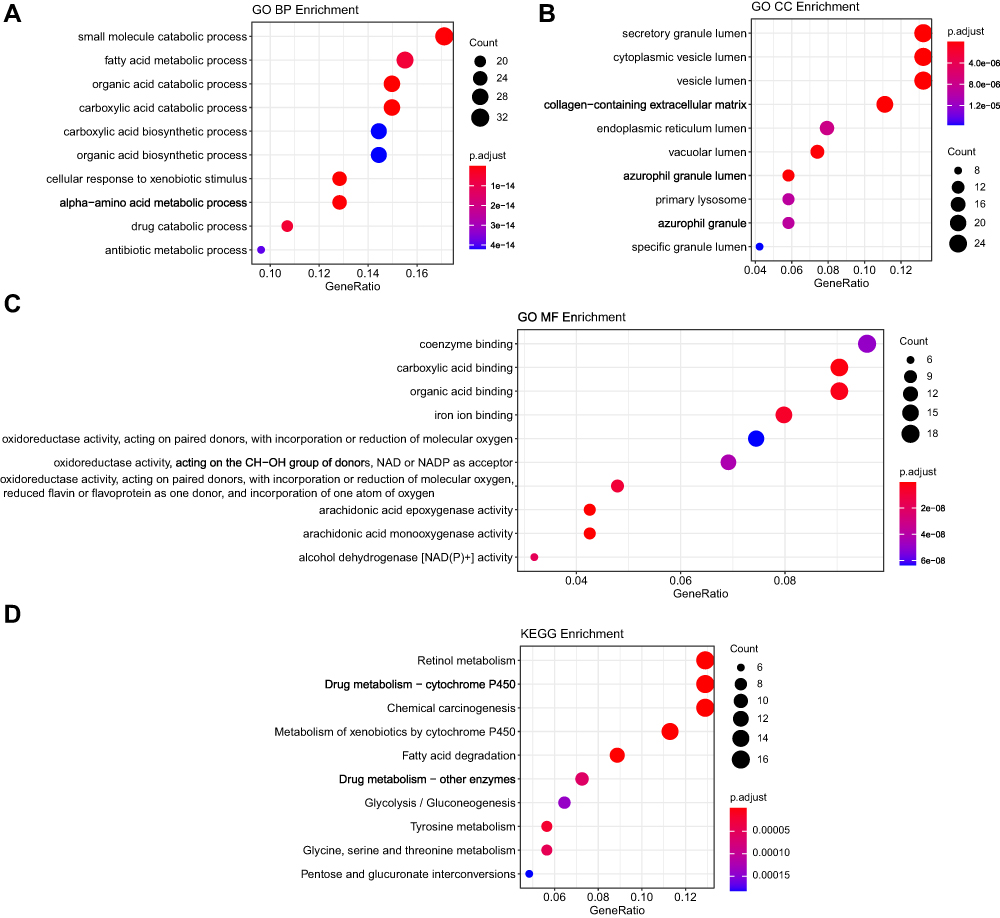 |
Figure 2 Functional analysis of common DEGs. (A) The top 10 significantly enriched GO-biological processes of the 185 DEGs; (B) The top 10 significantly enriched GO-cellular component of the 185 DEGs; (C) The top 10 significantly enriched GO-molecular function of the 185 DEGs; (D) The top 10 significantly enriched KEGG pathway enrichment analysis of the 185 DEGs. |
Construction of a Weighted Gene Co-Expression Network
To decipher the biological network of HCC, co-expression modules of genes and the relationship between modules and pathogenesis of LIHC were performed by WGCNA analysis. As seen in Figure 3A, sample clustering was performed to detect variation and outliers of all data sets and no outlier was identified, indicating that all of the samples were used for the next step analysis. In the next step, we choose β = 7 as the soft threshold to construct a scale-free network (R2 = 0.950) (Figure 3B). The densely interconnected gene modules were identified based on average linkage hierarchical clustering on all data sets using the matrix above (Figure 3C). Visualization of the eigengene network representing the relationships among the modules and the clinical trait weight are shown in Figure 3D and E. The results revealed that DEGs could be divided into six modules (blue, brown, green, turquoise, yellow, grey) based on their overall functions. Among these six modules, the turquoise, yellow, and green modules showed positive correlations and blue and brown modules showed negative correlations. One module labelled with turquoise was significantly co-expressed (p = 4e–12) (Figure 3F), suggesting its important function of genes for HCC process in the module.
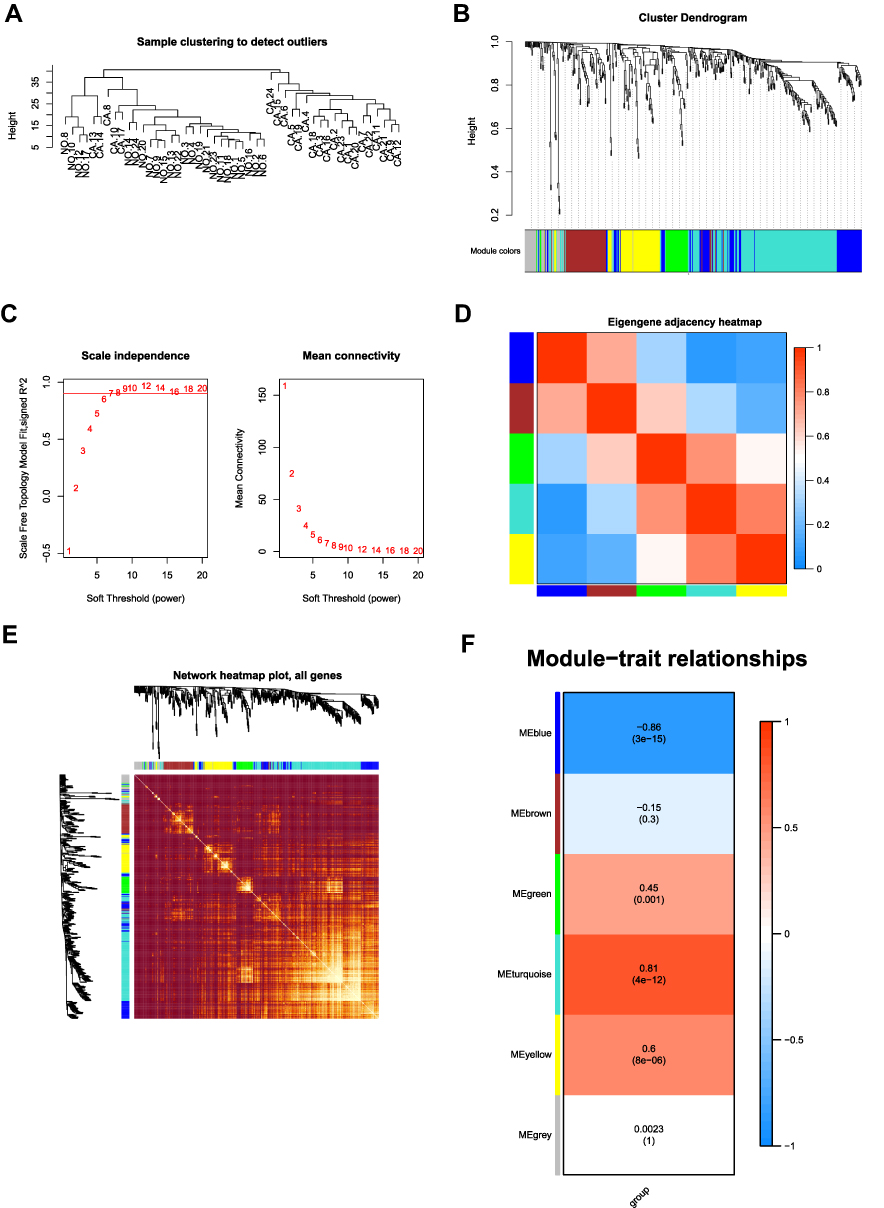 |
Figure 3 WGCNA analysis of the LIHC proteome profiling. (A) Samples clustering were conducted to detect outliers between the LIHC and adjacent non-tumorous tissues; (B) Analysis of the scale-free topology model fit index for soft threshold powers (β); (C) Cluster dendrogram was generated by hierarchical clustering to show the modules of highly interconnected groups of genes between LIHC and adjacent non-tumorous tissues; (D) Interactive relationship analysis of co-expression genes. The light color indicates topological overlap, while the darker color indicates a high topological overlap. (E) The heatmap shows the eigengene adjacency. (F) Heatmap of the correlation between module eigengenes and clinical traits. P-value is shown in each color cell coded by the correlation between modules and traits (red indicates positive correlation; blue indicates negative correlation). |
Identification of Pivotal Genes and Correlation Analysis with Clinical Characteristics
In the next step, we compared the proteomic DEGs, proteomic turquoise module, TCGA cohort DEGs and TCGA cohort KM of HCC. The results showed that eight common pivotal genes were identified (Figure 4A), including ACADS, HSD17B13, PON3, AMDHD1, CYP2C8, CYP4A11, SLC27A5, CYP2E1. We selected these eight genes with a hazard ratio (HR) <1 as the hub genes. We used these genes to build a prognostic prediction model. In addition, the module signature with other independent clinical variables integrated to establish a comprehensive model for monitoring progression in HCC (Table 1). We then choose seven independent risk features into our model consisting of age, tumor grade, pathological T stage, platelet count, weight, gender, stage and risk score for univariate (Figure 4B). The multivariate analysis showed that the HP of risk score, T stage and pathological T stage were greater than 1 (Figure 4C). The results suggesting that their higher expression was associated with a lower stage/risk score.
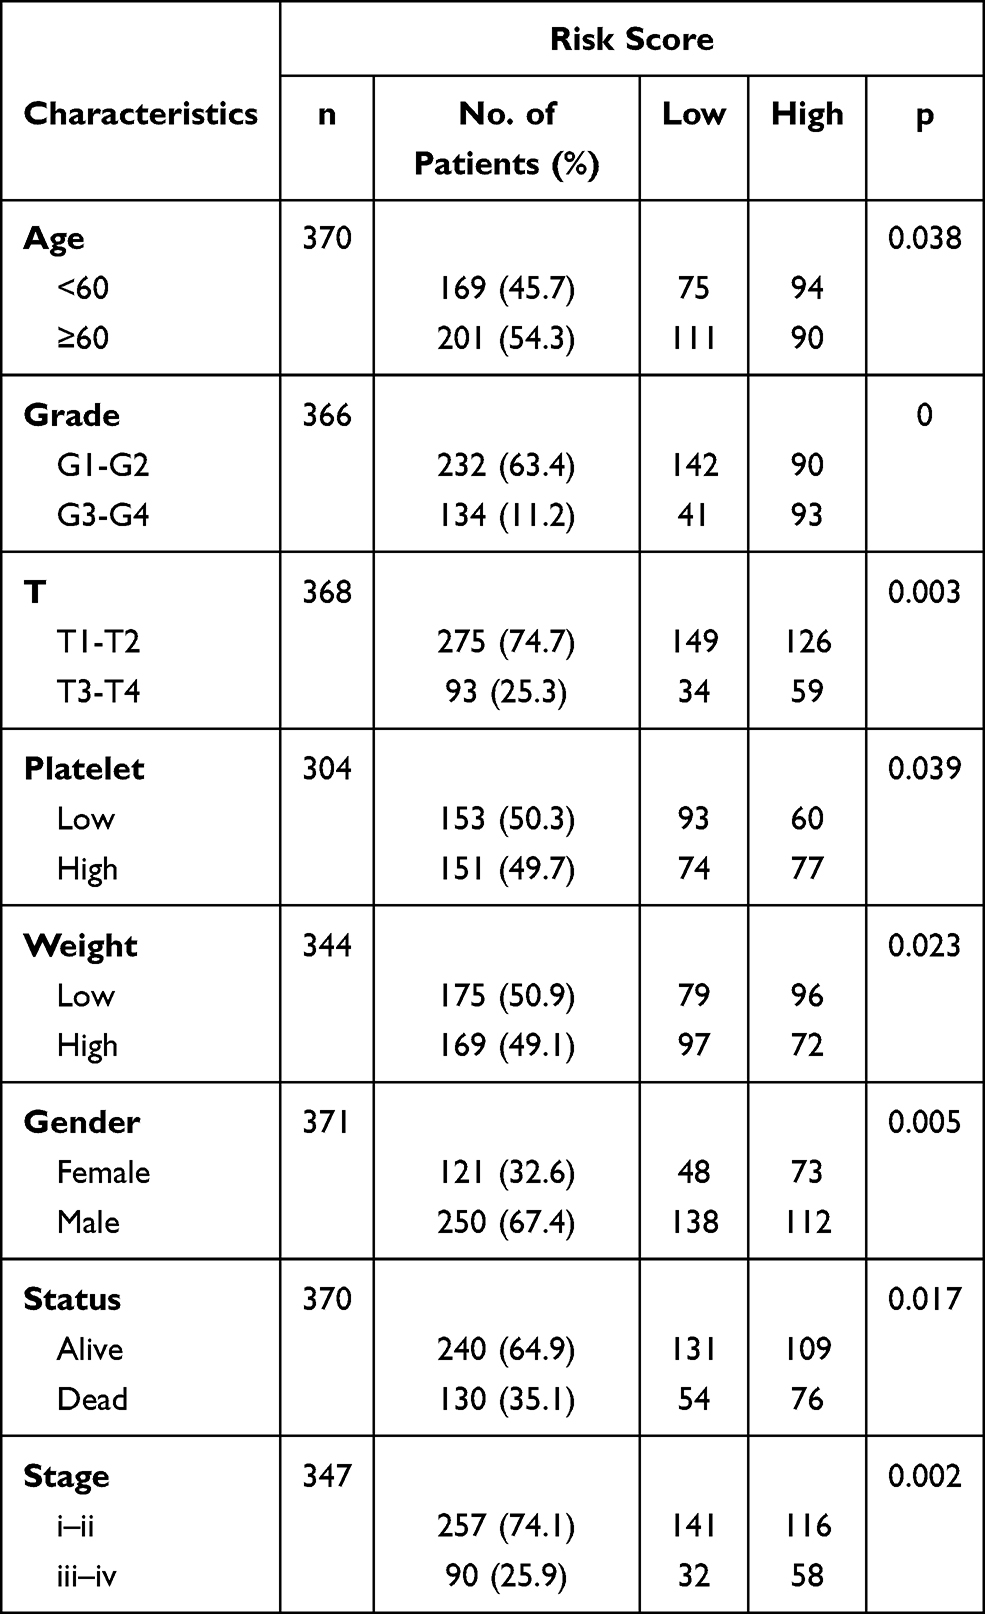 |
Table 1 Clinical Features of the Patients with LIHC |
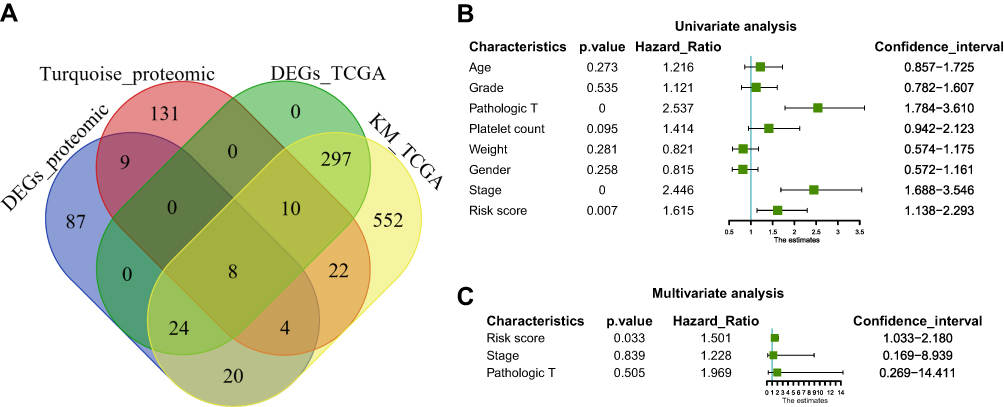 |
Figure 4 Construction and assessment of pivotal genes for predicting progression. (A) The common genes between our DEGs, proteomic turquoise module, TCGA cohort DEGs and TCGA cohort KM of LIHC. (B) Univariate-Cox regression analysis for screening appropriate and significant features into final nomogram model (C) Multivariate-Cox regression analysis for screening appropriate and significant features into final nomogram model. |
Risk Score Analysis and KEGG Analysis for the Validation of Prognostic Model
Based on the median risk score, HCC samples were divided into low-risk (n =136) and high-risk groups (n=136). The distribution of risk score and survival status are shown in Figure 5A and B. The transcriptome data of 372 HCC patients were selected for the gene set enrichment analysis (GSEA) procedure using the model nomogram scores as the reference phenotype. We found that DNA replication, spliceosome, the cell cycle, the cellular senescence and microRNAs in cancer were upregulated in the high-risk group. However, the carbon metabolism, neuroactive ligand–receptor interaction, peroxisome, PPAR signal pathways and complement and coagulation cascades were downregulated in the low-risk group (Figure 5C). All of these aberrant pathways were enriched for hallmarks of malignant tumors with a false discovery rate (FDR) of <0.05.
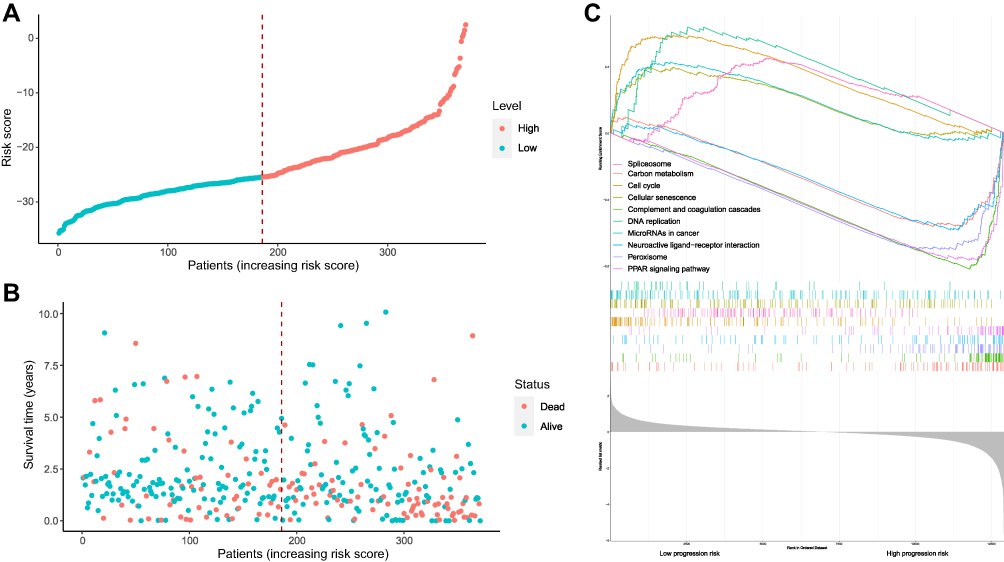 |
Figure 5 Risk score analysis, Kaplan–Meier analysis and time-dependent KEGG analysis for the validation of prognostic model. (A) Rank of risk score and distribution of groups. Patients with EC were divided into low- and high-risk subgroups based on the median value of the risk score calculated. (B) The survival status and survival time of patients with EC ranked by risk score. In (A and B), green dots represent for patients with a low level of risk score and red dots represent for patients with a high level of risk score. (C) KEGG pathway showed five positively correlated groups and five negatively correlated groups. |
Discussion
Cancer is increasingly a global problem, and primary liver carcinoma is the second top leading cancer with high mortality worldwide.28,29 As one of the main histological types of primary liver carcinoma, HCC accounts for approximately 90% of pathogenesis30 and leading to a much lower 5-year survival.31 Hence, it is significant to develop uncovering novel diagnostic and prognostic biomarkers of HCC, which would shed light on improving the HCC patient’s outcome. Up to now, some biomarkers have been verified to provide insights into disease outcomes. Lin et al elevated α-Fetoprotein (AFP) levels are useful prognostic factors for patients with hepatocellular carcinoma.32 Lee et al Identified that gamma-carboxy prothrombin (DCP) levels can predict prognosis in patients with HCC.33 However, due to the high heterogeneity of HCC, more prognosis biomarkers need to be discovered.
In our study, a comprehensive analysis of DEGs was conducted in 24 pairs of HCC tissues and adjacent tissues using WGCNA. Firstly, we established protein-protein networks to find 77 upregulated proteomic DEGs and 108 downregulated proteomic DEGs by calculating the degree in Cytoscape. Then, GO term and KEGG pathway enrichment analysis were performed and found that red module was mainly enriched in the small molecule catabolic and participated in the retinol metabolism pathway, which has been reported that was closely related to liver disease.34–36 Then the WGCNA analysis was performed to identify co-expression gene modules, verified the relationship between the gene network and phenotype, and found out key genes in the network. A module is defined as a group of genes that have separate function than other groups for a better understanding of molecular mechanisms of HCC. The expression levels of these key genes showed obvious differences among the significant modules. In the blue modules, these genes were significantly downregulated in HCC tissues, while upregulated in the green, turquoise and yellow module. Furthermore, the module labelled with turquoise was significantly co-expressed (P = 4e–12), suggesting its important function of genes for HCC process in the module.
Accordingly, we trained and validated eight pivotal genes related to prognosis, including ACADS, HSD17B13, PON3, AMDHD1, CYP2C8, CYP4A11, SLC27A5, CYP2E1. These genes were identified by the proteomic DEGs, WGCNA, PPI networks, TCGA cohort DEGs and TCGA cohort KM of HCC. It was reported that DNA methylation plays a key role in regulating ACADS which made it a potential therapeutic target for treating HCC.37 HSD17B13 is a kind of genetic variants in retinol metabolism, which is associated with liver injury progression.38 Lu et al found that HSD17B13 was a tumor suppressive gene that inhibits HCC cell glycolysis as revealed by glucose utilization, lactate production, and extracellular acidification ratio.39 PON3 is a member of Paraoxonase (PON) proteins primarily expressed in the liver, its expression and specific activities were found to negatively correlate with several inflammatory disorders and served as a prognostic predictor in HCC.40 Song et al identified AMDHD1 was as a novel tissue-specific gene in human and mouse liver tissues.41 CYP2C8, CYP4A11 and CYP2E1 are members of cytochrome P450 family which related iron ion binding and oxidoreductase activity and functioned in drug metabolism in the liver.42–44 Elevating cytochrome P450 gene expression has been linked to the aggravation of various cancers and affects various regulated metabolites.45 Zhu et al found that the expression levels of SLC27A5 responsible for the rate-limiting steps of fatty acid uptake.46 Gao et al firstly found that SLC27A5 expression is downregulated in HCC by DNA hypermethylation, and reduced SCL27A5 expression contributes to tumor progression and poor prognosis.47 Taken together, our findings indicate that the eight common genes in the turquoise modules are closely associated with the development of HCC and contribute to a common biological function of deciphering the biological network of HCC, including the growth, development and progression of HCC.
Furthermore, the prognostic signature with other independent clinical variables was integrated to establish a comprehensive model for monitoring progression in HCC. The univariate and multivariate analysis has shown that the HP of risk score, T stage and pathological T stage were greater than 1, indicating that these genes (ACADS, HSD17B13, PON3, AMDHD1, CYP2C8, CYP4A11, SLC27A5, CYP2E1) may be potentially new biomarkers to identify at-risk HCC patients when further validated. The higher expression was associated with a lower stage/risk score. A GSEA-based assessment of co-expression gene modules was conducted given the clinical significance of HCC, we sought to investigate the potential relationships among the co-expression gene modules with other clinical features. We found that DNA replication, spliceosome, the cell cycle, the cellular senescence and microRNAs in cancer were upregulated in the high-risk group, which are related to HCC tumor procession.48 The above results revealed that these genes might be the novel potential prognostic biomarkers for HCC.
Conclusion
In conclusion, we found novel biomarker genes (ACADS, HSD17B13, PON3, AMDHD1, CYP2C8, CYP4A11, SLC27A5, CYP2E1) to predict the prognosis of HCC using integrated proteomics and bioinformatics. Functional analysis of these key genes showed enrichment in the HCC regulatory pathway. Furthermore, the higher expression of these genes was associated with a lower stage/risk score of HCC. Therefore, these genes could be potential prognostic biomarkers for HCC. Further biological and basic studies are needed to validate our findings.
Abbreviations
HCC, hepatocellular carcinoma; WGCNA, weighted gene co-expression network analysis; DEGs, Differentially expressed genes; TCGA, The Cancer Genome Atlas; PPI, Protein-Protein Interaction; GO, Gene Ontology; KEGG, Kyoto Encyclopedia of Genes and Genomes; GSEA, the gene set enrichment analysis; FDR, false discovery rate.
Data Sharing Statement
All datasets generated for this study are included in the article.
Ethics Statement
Our study was approved by the Protection of Human Subjects Committee of Nanfang Hospital (approval no. NFEC-201801-K4). We obeyed the principles of the 1983 Declaration of Helsinki. All experiments in this paper obeyed this principle.
Funding
This work was supported by grants from the Guangdong Province Science and Technology Program (NO. 2017A030313684).
Disclosure
The authors declare that they have no competing interests.
References
1. Chen M, Cai X. Synthetic lethality is a novel and potential paradigm for precision medicine in advanced hepatocellular carcinoma. Liver Cancer. 2020;9(2):225–226. doi:10.1159/000503927
2. Kudo M. Scientific rationale for combination immunotherapy of hepatocellular carcinoma with Anti-PD-1/PD-L1 and Anti-CTLA-4 antibodies. Liver Cancer. 2019;8(6):413–426. doi:10.1159/000503254
3. Liu S, Yang Z, Li G, et al. Multi-omics analysis of primary cell culture models reveals genetic and epigenetic basis of intratumoral phenotypic diversity. Genomics Proteomics Bioinformatics. 2019;17(6):576–589. doi:10.1016/j.gpb.2018.07.008
4. Bray F, Ferlay J, Soerjomataram I, Siegel R, Torre L, Jemal A. Global cancer statistics 2018: GLOBOCAN estimates of incidence and mortality worldwide for 36 cancers in 185 countries. CA Cancer J Clin. 2018;68(6):394–424. doi:10.3322/caac.21492
5. Zhang C, Wei S, Sun W, et al. Super-enhancer-driven AJUBA is activated by TCF4 and involved in epithelial-mesenchymal transition in the progression of hepatocellular carcinoma. Theranostics. 2020;10(20):9066–9082. doi:10.7150/thno.45349
6. He T, Zheng K, Li G, Song B, Zhang Y. Identification of typical miRNAs and target genes in hepatocellular carcinoma by DNA microarray technique. Eur Rev Med Pharmacol Sci. 2014;18(1):108–116.
7. Huang K, Maruyama T, Fan G. The naive state of human pluripotent stem cells: a synthesis of stem cell and preimplantation embryo transcriptome analyses. Cell Stem Cell. 2014;15(4):410–415. doi:10.1016/j.stem.2014.09.014
8. Bao L, Guo T, Wang J, Zhang K, Bao M. Prognostic genes of triple-negative breast cancer identified by weighted gene co-expression network analysis. Oncol Lett. 2020;19(1):127–138. doi:10.3892/ol.2019.11079
9. Mitra K, Carvunis A, Ramesh S, Ideker T. Integrative approaches for finding modular structure in biological networks. Nat Rev Genet. 2013;14(10):719–732. doi:10.1038/nrg3552
10. Malki K, Tosto MG, Jumabhoy I, et al. Integrative mouse and human mRNA studies using WGCNA nominates novel candidate genes involved in the pathogenesis of major depressive disorder. Pharmacogenomics. 2013;14(16):1979–1990. doi:10.2217/pgs.13.154
11. Zuo Z, Shen JX, Pan Y, et al. Weighted Gene Correlation Network Analysis (WGCNA) detected loss of MAGI2 promotes Chronic Kidney Disease (CKD) by podocyte damage. Cell Physiol Biochem. 2018;51(1):244–261. doi:10.1159/000495205
12. Lau W, Lai PBS, Leung M, et al. Differential gene expression of hepatocellular carcinoma using cDNA microarray analysis. Oncol Res. 2000;12(2):59–69. doi:10.3727/096504001108747530
13. Liwei Z, Yun W, Jiwu H, et al. A network biology approach to discover the molecular biomarker associated with hepatocellular carcinoma. Biomed Res Int. 2014;2014:278956.
14. Chu A, Gordon R, Denise B, et al. Large-scale profiling of microRNAs for The Cancer Genome Atlas. Nucleic Acids Res. 2016;44(1):e3–e3. doi:10.1093/nar/gkv808
15. Lausen B, Schumacher M. Maximally selected rank statistics. Biometrics. 1992;48:73. doi:10.2307/2532740
16. Matthew S. False discovery rates: a new deal. Biostatistics. 2016;(2):2.
17. Szklarczyk D, Gable A, Lyon D, et al. STRING v11: protein-protein association networks with increased coverage, supporting functional discovery in genome-wide experimental datasets. Nucleic Acids Res. 2019;47:D607–D613. doi:10.1093/nar/gky1131
18. Chin C H, Chen S H, Wu H H, Ho C W, Ko M T, Lin C Y. cytoHubba: identifying hub objects and sub-networks from complex interactome. BMC Syst Biol. 2014;8(Suppl 4(S4)):S11. doi:10.1186/1752-0509-8-S4-S11
19. Shannon P, Markiel A, Ozier O, et al. Cytoscape: a software environment for integrated models of biomolecular interaction networks. Genome Res. 2003;13(11):2498–2504. doi:10.1101/gr.1239303
20. Mi H, Lazareva-Ulitsky B, Loo R, et al. The PANTHER database of protein families, subfamilies, functions and pathways. Nucleic Acids Res. 2005;33:D284–288. doi:10.1093/nar/gki078
21. Huaiyu M, Xiaosong H, Anushya M, et al. PANTHER version 11: expanded annotation data from gene ontology and Reactome pathways, and data analysis tool enhancements. Nucleic Acids Res. 2017;(D1):D183–D189.
22. Minoru K, Susumu G. KEGG: Kyoto Encyclopedia of Genes and Genomes. Nucleic Acids Res. 2000;(1):29–34.
23. Huang DW, Sherman BT, Lempicki RA. Systematic and integrative analysis of large gene lists using DAVID bioinformatics resources. Nat Protoc. 2009;4(1):44. doi:10.1038/nprot.2008.211
24. Langfelder P, Horvath S. WGCNA: an R package for weighted correlation network analysis. BMC Bioinform. 2008;9:559. doi:10.1186/1471-2105-9-559
25. Subramanian A, Tamayo P, Mootha VK, et al. Gene set enrichment analysis: a knowledge-based approach for interpreting genome-wide expression profiles. P Natl Acad Sci USA. 2005;102(43):15545–15550. doi:10.1073/pnas.0506580102
26. Benjamini Y, Hochberg Y. Controlling the false discovery rate - a practical and powerful approach to multiple testing. J R Stat Soc B. 1995;57(1):289–300.
27. Knopp-Sihota JA, Newburn-Cook CV, Homik J, Cummings GG, Voaklander D. Calcitonin for treating acute and chronic pain of recent and remote osteoporotic vertebral compression fractures: a systematic review and meta-analysis. Osteoporosis Int. 2012;23(1):17–38. doi:10.1007/s00198-011-1676-0
28. Wallace MC, Preen D, Jeffrey GP, Adams LA. The evolving epidemiology of hepatocellular carcinoma: a global perspective. Expert Rev Gastroenterol Hepatol. 2015;9(6):765–779. doi:10.1586/17474124.2015.1028363
29. Siegel RL, Miller KD, Jemal A. Cancer statistics, 2017. CA Cancer J Clin. 2017;67(1).
30. Martínez-Chantar M, Avila M, Lu S. Hepatocellular carcinoma: updates in pathogenesis, detection and treatment. Cancers. 2020;12:10. doi:10.3390/cancers12102729
31. Buonaguro L, Tagliamonte M, Petrizzo A, Damiano E, Tornesello ML, Buonaguro FM. Cellular prognostic markers in hepatocellular carcinoma. Future Oncol. 2015;11(11):1591–1598. doi:10.2217/fon.15.39
32. Lin J, Wu Y, Wu C, Shih P, Wang W, Chien Y. DNA methylation markers and serum α-fetoprotein level are prognostic factors in hepatocellular carcinoma. Ann Hepatol. 2015;14(4):494–504. doi:10.1016/S1665-2681(19)31171-8
33. Lee S, Rhim H, Kim YS, Kang TW, Song KD. Post-ablation des-gamma-carboxy prothrombin level predicts prognosis in hepatitis b-related hepatocellular carcinoma. Liver Int off J Int Assoc Study Liver. 2016;64(2):S342–S342.
34. Berry D, O’Byrne S, Vreeland A, Blaner W, Noy N. Cross talk between signaling and vitamin A transport by the retinol-binding protein receptor STRA6. Mol Cell Biol. 2012;32(15):3164–3175. doi:10.1128/MCB.00505-12
35. Zhong M, Kawaguchi R, Costabile B, et al. Regulatory mechanism for the transmembrane receptor that mediates bidirectional vitamin A transport. Proc Natl Acad Sci U S A. 2020;117(18):9857–9864. doi:10.1073/pnas.1918540117
36. Ashla A, Hoshikawa Y, Tsuchiya H, et al. Genetic analysis of expression profile involved in retinoid metabolism in non-alcoholic fatty liver disease. Hepatol Res. 2010;40(6):594–604. doi:10.1111/j.1872-034X.2010.00646.x
37. Chen D, Feng X, Lv Z, et al. ACADS acts as a potential methylation biomarker associated with the proliferation and metastasis of hepatocellular carcinomas. Aging. 2019;11(20):8825–8844. doi:10.18632/aging.102292
38. Scheiner B, Stättermayer A, Schwabl P, et al. Impact of HSD17B13 rs72613567 genotype on hepatic decompensation and mortality in patients with portal hypertension. Liver Int. 2020;40(2):393–404. doi:10.1111/liv.14304
39. Lu C, Fang S, Weng Q, et al. Integrated analysis reveals critical glycolytic regulators in hepatocellular carcinoma. CCS. 2020;18(1):97. doi:10.1186/s12964-020-00539-4
40. Cai J, Yuan S, Yang F, et al. Paraoxonase 3 inhibits cell proliferation and serves as a prognostic predictor in hepatocellular carcinoma. Oncotarget. 2016;7(43):70045–70057. doi:10.18632/oncotarget.12145
41. Song Y, Ahn J, Suh Y, Davis M, Lee K. Identification of novel tissue-specific genes by analysis of microarray databases: a human and mouse model. PLoS One. 2013;8(5):e64483. doi:10.1371/journal.pone.0064483
42. Dangi B, Davydova N, Vavilov N, Zgoda V, Davydov D. Nonadditivity in human microsomal drug metabolism revealed in a study with coumarin 152, a polyspecific cytochrome P450 substrate. Xenobiotica. 2020;1–13.
43. Gao H, Cao Y, Xia H, Zhu X, Jin Y. CYP4A11 is involved in the development of nonalcoholic fatty liver disease via ROS‑induced lipid peroxidation and inflammation. Int J Mol Med. 2020;45(4):1121–1129. doi:10.3892/ijmm.2020.4479
44. Ooeda K, Kubiura-Ichimaru M, Tsuji S, et al. A two-dimensional multiwell cell culture method for the production of CYP3A4-expressing hepatocyte-like cells from HepaRG cells. Pharmacol Res Perspect. 2020;8(5):e00652. doi:10.1002/prp2.652
45. Eun H, Cho S, Lee B, et al. Cytochrome P450 4A11 expression in tumor cells: a favorable prognostic factor for hepatocellular carcinoma patients. J Gastroenterol Hepatol. 2019;34(1):224–233. doi:10.1111/jgh.14406
46. Zhu L, Baker S, Liu W, et al. Lipid in the livers of adolescents with nonalcoholic steatohepatitis: combined effects of pathways on steatosis. Metabolism. 2011;60(7):1001–1011. doi:10.1016/j.metabol.2010.10.003
47. Gao Q, Zhang G, Zheng Y, et al. SLC27A5 deficiency activates NRF2/TXNRD1 pathway by increased lipid peroxidation in HCC. Cell Death Differ. 2020;27(3):1086–1104. doi:10.1038/s41418-019-0399-1
48. Chen S. Identification of SARS-CoV-2 proteins binding human mRNAs as a novel signature predicting overall survival in hepatocellular carcinoma. DNA Cell Biol. 2020.
 © 2021 The Author(s). This work is published and licensed by Dove Medical Press Limited. The full terms of this license are available at https://www.dovepress.com/terms.php and incorporate the Creative Commons Attribution - Non Commercial (unported, v3.0) License.
By accessing the work you hereby accept the Terms. Non-commercial uses of the work are permitted without any further permission from Dove Medical Press Limited, provided the work is properly attributed. For permission for commercial use of this work, please see paragraphs 4.2 and 5 of our Terms.
© 2021 The Author(s). This work is published and licensed by Dove Medical Press Limited. The full terms of this license are available at https://www.dovepress.com/terms.php and incorporate the Creative Commons Attribution - Non Commercial (unported, v3.0) License.
By accessing the work you hereby accept the Terms. Non-commercial uses of the work are permitted without any further permission from Dove Medical Press Limited, provided the work is properly attributed. For permission for commercial use of this work, please see paragraphs 4.2 and 5 of our Terms.