")
Back to Journals » International Journal of Women's Health » Volume 15
Integrated Proteomic and N-Glycoproteomic Profiling of Placental Tissues of Patients with Preeclampsia
Authors Wang H, Shi Y, Ma J, Wang W, Gao J, Zhao L, Zhao T, Ding G
Received 26 August 2022
Accepted for publication 13 December 2022
Published 13 January 2023 Volume 2023:15 Pages 59—68
DOI https://doi.org/10.2147/IJWH.S387672
Checked for plagiarism Yes
Review by Single anonymous peer review
Peer reviewer comments 2
Editor who approved publication: Professor Elie Al-Chaer
Huijuan Wang,1 Yinmin Shi,2 Jiying Ma,1 Wenxia Wang,2 Jianrong Gao,3 Lili Zhao,1 Ting Zhao,2 Guifeng Ding4
1The National Engineering Research Center for Miniaturized Detection Systems, Northwest University, Xi’an, Shaanxi, 710069, People’s Republic of China; 2Key Laboratory of Resource Biology and Biotechnology in Western China, Ministry of Education, Northwest University, Xi’an, Shaanxi, 710069, People’s Republic of China; 3Department of Obstetrics, Xi’an International Medical Center Hospital, Xi’an, Shaanxi, 710018, People’s Republic of China; 4Department of Obstetrics and Gynecology, Urumqi Maternal and Child Health Care Hospital, Urumqi, Xinjiang, 830001, People’s Republic of China
Correspondence: Guifeng Ding, Department of Obstetrics and Gynecology, Urumqi Maternal and Child Health Care Hospital, No. 344 Jiefang South Road, Urumqi, Xinjiang, People’s Republic of China, Tel +86 1 331 988 0258, Fax + 86 991-8554656, Email [email protected]
Background: Preeclampsia (PE) is a multi-system disorder of pregnancy that poses a serious threat to maternal and perinatal health worldwide. This study aims to evaluate the global alterations of protein expression and N-glycosylations that are crucial for PE pathogenesis. Here, tandem mass tag labeling combined with LC-MS/MS was employed to determine the global expression of all proteins and intact glycopeptide in placentas from three healthy pregnant women, three patients with early-onset severe PE, and three patients with late-onset severe PE.
Results: A total of 2260 proteins were quantified across 9 placental tissues, of which 37 and 23 were differentially expressed in the early-onset and late-onset PE groups, compared to the controls. A total of 789 glycopeptides were accurately quantified, which were derived from 204 glycosylated sites in 159 glycoproteins and were modified by 59 N-Linked glycans. A total of 123 differently expressed glycopeptides, which were from 47 glycoproteins were identified among three groups. Through a combined analysis of proteomic and glycoproteomic data, it was found that the changes in 10 glycoproteins were caused by the difference in glycosylation level but not in the protein abundance level.
Conclusion: This is the first study to conduct an integrated proteomic and glycoproteomic characterization of placental tissues of PE patients. Our findings suggest that glycosylation modification may affect the molecular function of proteins through changes in the glycosylation structure or the occupancy of glycosylation, which will provide new insights to help elucidating the pathogenic mechanism of PE.
Keywords: preeclampsia, placenta, proteomics, glycoproteomics, glycosylation
Background
Preeclampsia (PE) is a multisystem disorder during pregnancy. This condition is traditionally diagnosed by new onset hypertension and proteinuria and develops after 20 weeks of gestation in previously normotensive women. PE affects 3–5% of pregnancies worldwide and is a leading cause of maternal, fetal, and neonatal mortality.1,2 No effective treatment has been developed, and only drugs are used to alleviate its symptoms until the placenta is delivered.2,3 According to the timing of disease onset, PE can be divided into early-onset preeclampsia (EPE) that occurs before 34 weeks of gestation and late-onset preeclampsia (LPE) that occurs after 34 weeks of gestation. EPE is linked to poor placentation and often leads to unfavorable results, while LPE results from maternal factors and is generally associated with improved outcomes.4–6 Although extensive research has been carried out on PE, considering the complexity and diversity of its clinical manifestations, its precise pathogenesis has not been fully understood.2,3,6
Glycosylation modification is the most common post-translational modification.7,8 Approximately 50% of proteins in mammals undergo glycosylation modification.9 Generally, glycosylation plays a crucial role in diverse biological processes, such as cell adhesion, signal transduction, and receptor–ligand recognition.7,10 Changes in glycosylation level have been recognized as an essential feature of many diseases, and many glycoproteins have been used as validated biomarkers for the early detection of cancers.11–13 However, limited studies have investigated the glycoproteomic profiling of PE, and the role that glycosylation modification plays on the pathogenesis has not been determined. Moreover, in dozens of years, most N-linked glycoproteomic studies focused mainly on the analysis of either released glycans or de-glycosylated peptides. Although this strategy reduces the complexity of glycoprotein analysis, it also loses the important correspondence information between glycans and protein glycosylation sites.14–16 Strategies and methods for intact N-glycopeptide analysis can directly obtain glycosite-specific glycosylation information, which will provide a powerful tool for biomarker discovery and mechanism studies on various diseases.17
Although the exact pathogenic mechanism of PE is not clear, the involvement of the abnormal placenta in the pathogenesis of PE has been established.6,18 Anatomic examination shows that the specific area of the placenta most affected by PE is the maternal–fetal interface. The maternal–fetal interface, a chimeric structure, is formed when fetal cytotrophoblasts from the placenta invade the decidua and its resident vasculature. Defective remodeling of uterine spiral artery caused by inadequate trophoblast invasion at the maternal–fetal interface was considered as a key process in PE development.19,20 Therefore, we have collected samples of maternal-fetal interfaces from PE patients and healthy pregnant women to perform systematic proteomic and glycoproteomic analyses. An integrated workflow for the quantification of proteome and N-glycoproteome of human placental tissues involves the five following steps: (1) protein extraction and digestion from human placental tissue; (2) stable isotope labeling of tryptic peptides; (3) MAX-based enrichment of intact glycopeptides; (4) separation and analysis of the peptides and intact glycopeptides by using nano-LC-MS/MS; and (5) interpretation of the collected MS data and analysis of proteome and glycoproteome in protein functions and pathways by using extensive bioinformatics tools (Figure S1). This integrated approach enables a comprehensive presentation of the N-glycosylated proteins, their N-glycosylated sites, and the glycans occupying these sites in one study. Our findings reveal the similarities and differences of placental proteins and glycoproteins between PE and healthy normal controls and between EPE and LPE, as well as aid in addressing the potential functions of protein glycosylation in the pathogenesis of PE.
Materials and Methods
Samples
Six pregnant women complicated by severe PE (three EPE and three LPE) and three women with normal pregnancies at cesarean section were recruited from the Urumqi Maternal and Child Health Care Hospital between November 2019 and February 2020. All severe PE cases were defined at systolic blood pressure ≥160 mmHg or diastolic blood pressure ≥110 mmHg and proteinuria ≥2.0 g protein/24 h or ≥3 protein on dip stick.21 Tissues were dissected from the maternal side of the placentas (in the central part, exclusive of calcified area) at the time of cesarean section from participants, rinsed in phosphate buffered saline (PBS), frozen in liquid nitrogen for at least half an hour, and stored at −80°C until use. The recruited subjects were all singletons, and no significant differences were observed in age and weight (p>0.05). The detailed information about the nine samples is summarized in Table S1. The study was performed in accordance with the Declaration of Helsinki and was approved by the Ethics Committee of the Urumqi Maternal and Child Health Care Hospital. Informed consent was obtained from all participants before the collection of placenta samples.
Protein Extraction and Digestion
Proteins from placental tissues were extracted as described in a previous study.22 Briefly, approximately 50 mg of each sectioned tissue was washed twice with PBS to remove the serum. Then, tissues were denatured in 8 M urea/1 M NH4HCO3 buffer and homogenized with a tissue homogenizer (60 Hz, Shanghai Jing Xin, China). Lysates were precleared by centrifugation at 13,000 ×g for 15 min at 4°C, and protein concentrations were determined by BCA assay (Pierce, Wisconsin, USA). Proteins were reduced using 5 mM DTT at 37°C for 1 h, alkylated using 15 mM iodoacetamide at room temperature in the dark for 30 min, and then another 2.5 mM DTT was added to quench the excess iodoacetamide at room temperature for 10 min. Then, sequencing-grade trypsin (Promega, Madison, WI; protein: enzyme, 100:1, w/w) was added to the samples and incubated at 37°C overnight in less than 2 M urea/0.25M NH4HCO3 buffer. Samples were centrifuged at 13,000 rpm for 15 min to remove any particulate matter and purified with a HLB column (Waters, Milford, MA, USA). Peptides were eluted from the HLB column in 60% ACN/0.1% TFA, and the peptide concentrations were measured using NanodropTM one spectrophotometer (Thermo Fisher Scientific, Waltham, MA, USA).
TMT Labeling
Equal amounts of tryptic peptides from NC (set 1), EPE (set 2), and LPE (set 3) groups were labeled by 10-plex TMT reagents according to the manufacturer’s protocols for intact glycopeptide quantification (set 1: normal: TMT 126, 128N, and 129C; set 2: early-onset: TMT 127N, 128C, and 130N; set 3: delayed-onset: TMT 127C, 129N, 130C, and 131). After TMT labeling, the 10 channels of tagged peptides were combined and purified in the HLB column.22
Glycopeptides Enriched by Mixed Anion Exchange (MAX) Extraction Cartridges
The collected peptides were divided into two parts, one for LC-MS/MS analysis and the other for further enrichment by MAX columns (Waters, USA) after drying and reconstitution. For MAX enrichment, the cartridges were conditioned for three times with solutions of ACN, 100 mM triethylammonium acetate, water, and 95% ACN/1% TFA, successively. The sample in 95% ACN/1% TFA was loaded to the cartridges and washed for four times with 95% ACN/1% TFA. Glycopeptides were eluted in 400 μL of 50% ACN/0.1% TFA and dried using Speed-Vac. The residue was then reconstituted in 0.1% FA and centrifuged for 10 min at 13,000 rpm before LC-MS/MS analysis.22
LC-MS/MS Analysis
The samples of TMT-labeled peptide and intact glycopeptide were separated in an Easy-nLCTM 1200 system (Thermo Fisher Scientific) by using Acclaim PepMap100 precolumn (2 cm, 75 μm i.d., 3 μm) and Acclaim Pepmap100 separation column (50 cm, 75 μm i.d., 3 μm). The mobile-phase flow rate was 200 nL/min and consisted of 0.1% formic acid in water (A) and 0.1% formic acid in 80% acetonitrile (B). For the analysis with five fragmentation energies, the gradient profile was set as follows: 3–7% B for 3 min, 7–35% B for 91 min, 35–68% B for 19 min, 68–99% B for 4 min, and equilibrated in 100% B for 13 min. MS analysis was performed using an Orbitrap Fusion Lumos mass spectrometer (Thermo Fisher Scientific, Germany). The spray voltage was set at 2400 V. Orbitrap spectra (AGC 4×10⁵) were collected from 350 m/z to 2000 m/z at a resolution of 120 K followed by oxonium ions triggered by data-dependent higher-energy collisional dissociation (HCD) MS/MS (at a resolution of 50 K, collision energy 20%, AGC 5×10⁴, and collision energy 37%, AGC 2×10⁵) using an isolation width of 1.6 Da. Charge state screening (2–7) was enabled to reject unassigned and singly charged ions. Polypeptides with a scanning range of 110–3000 m/z were selected for MS/MS collection. A dynamic exclusion time of 5 s was used to discriminate against previously selected ions.22
Protein Database Search
LC-MS/MS data of global peptide from placental tissues were searched against UniProt human protein database (downloaded from http:www.uniprot.org in June 2019) using Sequest in Proteome Discoverer software V2.3 (Thermo Fisher Scientific). The search parameters for tryptic peptides identification were as follows: up to two missed cleavages were allowed for trypsin digestion. Identified peptides were filtered by 1% false discovery rate (FDR). Precursors and MS/MS ions were set as 10 ppm and 0.02 Da mass tolerances, static modification was set as carbon-based polyester (C, +57.021464Da) and 10-plex TMT (peptide N-termini, +229.162932Da), and dynamic modification was set as N-termini acetylation (+42.010565Da) and 10-plex TMT (K at the C-termini of peptides, +229.162932Da).22
Intact Glycopeptide Identification and Quantification
The intact N-glycopeptide raw data were converted to “mzML” format by using Trans-Proteomic Pipeline, and then to “MATLAB” format by using GPQuest 2.0. The search parameters were set as follows: at least two oxonium ions (glycopeptide characteristics, 138.055 m/z, 204.0866 m/z) out of the top 10 fragment ions in the MS/MS spectra were used for extraction of candidate intact glycopeptide MS/MS spectra. These spectra were then matched to the potential intact glycopeptide database, and intact glycopeptides were identified based on their precursor masses, Y ions, and b/y ions (peptide fragment ions). A mass tolerance of 10 ppm was allowed for precursors and fragmentation ions. The FDR of identified intact glycopeptides was estimated using the decoy peptide method, and 1% FDR was used for identification cutoff. The identification of intact glycopeptides was further filtered by ≥3 matched b/y ions of the peptide portion in the MS/MS spectra. Glycopeptides were further filtered for the consensus sequence of N-linked glycosylation motif N-X-S/T(X≠P).22 The relative ratios of abundance of N-glycoprotein between PE cases and health controls were calculated.
Bioinformatics and Statistics
Differentially expressed proteins (DEPs) and glycopeptides (DEgPs) were considered at p<0.05 and fold-change ≥1.2 or fold-change≤0.83. Differences between the PE and control groups were analyzed with independent sample t-test by using GraphPad Prism 7 (GraphPad Software, San Diego, CA, USA), and significance was considered at p<0.05 for all statistical calculations. The function of DEPs and DEgPs was annotated using the Gene Ontology (GO) database (http://www.geneontology.org/).
Results
Global Proteomic Profiling of Human Placental Tissues
A total of 4220 proteins were identified in all placental samples, in which 2260 proteins were quantified. In comparison with the healthy controls, 13 proteins were upregulated, and 24 proteins were downregulated in the EPE (Figure 1, Table S2), while 11 proteins were upregulated and 12 proteins were downregulated in the LPE (Figure 1, Table S3). Twelve proteins were upregulated and 17 proteins were downregulated between LPE and EPE (Figure 1, Table S4). Six DEPs were shared by EPE and LPE groups, including MAOA, DLG5, SRRM1, H2BU1, FBN1, and FN1(Figure S2).
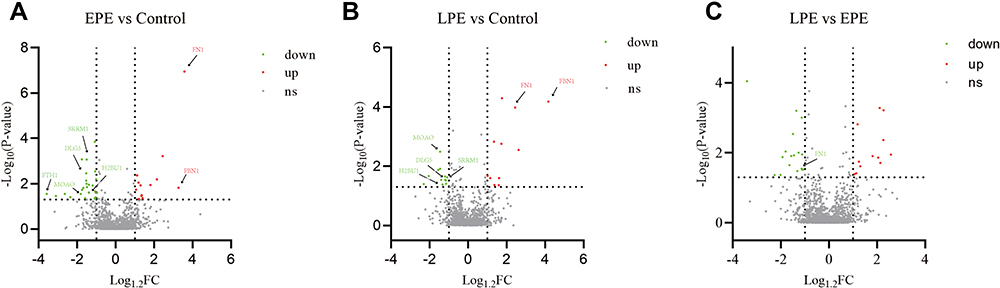 |
Figure 1 Distribution of proteins quantified in placental tissues between early-onset PE and the healthy controls (A), between late-onset PE and healthy controls (B), and between late-onset and early-onset PE groups (C). Abbreviations: EPE, early-onset preeclampsia; LPE, late-onset preeclampsia; FC, fold change. |
To elucidate the functional differences of DEPs, we conducted GO analysis and found that the altering proteins are mainly involved in biological processes, such as platelet degranulation, mechanism-dependent cell migration, cell adhesion, blood coagulation, redox process, and regulation of transforming growth factor secretion (Figure S3a).
N-Glycoproteomic Profiling of Human Placental Tissues
By using the TMT-labeled intact N-glycopeptides analysis method, 1310 intact glycopeptides were identified across the placental tissues by using 1% FDR as the threshold. These glycopeptides were derived from 390 glycosylated sites of 289 glycoproteins and were modified by 75 N-glycans. To ensure the quantitation accuracy by using the TMT-labeling approach, we only considered intact glycopeptides with at least three MS/MS spectral assignments for the quantitative analysis. Consequently, we accurately identified 789 intact glycopeptides, which were derived from 204 glycosites of 159 glycoproteins and were modified by 59 N-glycan compositions (Figure 2). The glycosylation sites of most of the identified intact peptides were only modified by one type of glycan subtypes. Most of the detected glycosites were occupied by complex type glycan (56.22%), followed by high-mannose (25.85%) and hybrid glycan (15.93%, Figure S4). Among the 204 glycosylation sites identified in this study, 38.9% were fucosylated, and more than one-fifth were modified by glycans containing 1–2 sialic acids (82 glycosylated sites were modified by one sialic acid, and 16 glycosylated sites were modified by two sialic acids). After filtering by log 1.2 (fold change) cutoff, 123 DEgPs were identified among EPE, LPE, and control groups (Figure 3). Among these DEgPs, 22 glycopeptides were upregulated, and 27 glycopeptides were downregulated in the EPE compared with the control group (Table S5), 31 glycopeptides were upregulated in the LPE compared with the control group (Table S6), and 37 glycopeptides were upregulated and 5 glycopeptides were downregulated in the EPE compared with the LPE group (Table S7, Figure S2). These 123 DEgPs were identified from 47 glycoproteins, which were mainly enriched in biological processes, such as blood plate degranulation, cell adhesion, and receptor-mediated endocytosis (Figure S3b).
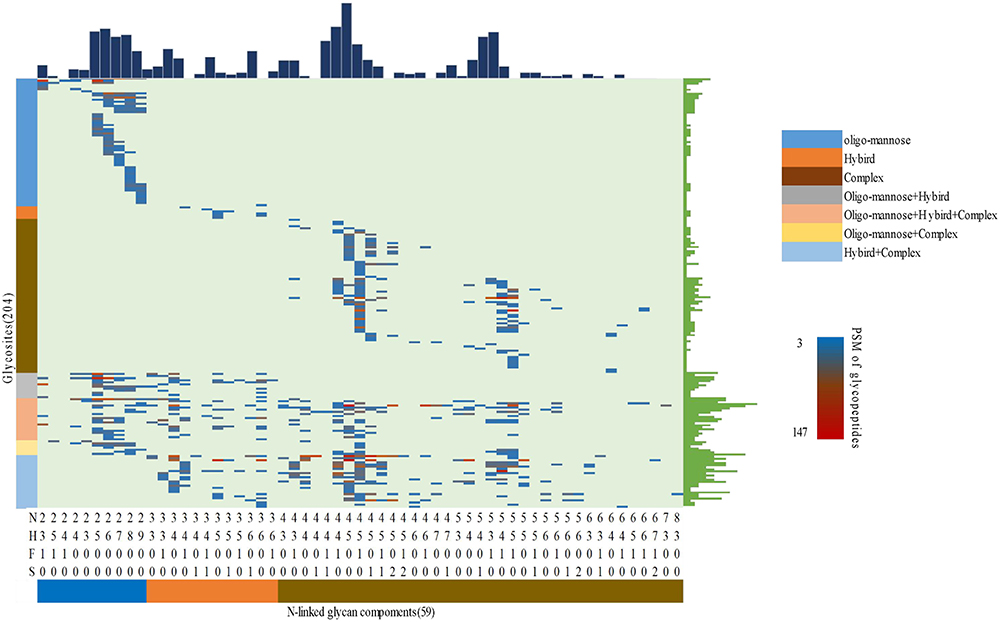 |
Figure 2 Profiling of N-linked glycans at individual glycosylation site identified from all placental tissue samples. The peptide-spectrum-matches (PSMs) of each out of 789 intact glycopeptides, comprising of 59 N-glycan (bottom) and 204 glycosites (left), were exhibited in the heat map with different colors. The numbers of glycosites modified by each glycan and of glycans at each glycosite were summarized at the upper and right parts of the figure, respectively. N: HexNAc; H: Fucose; S: Sialic acid. |
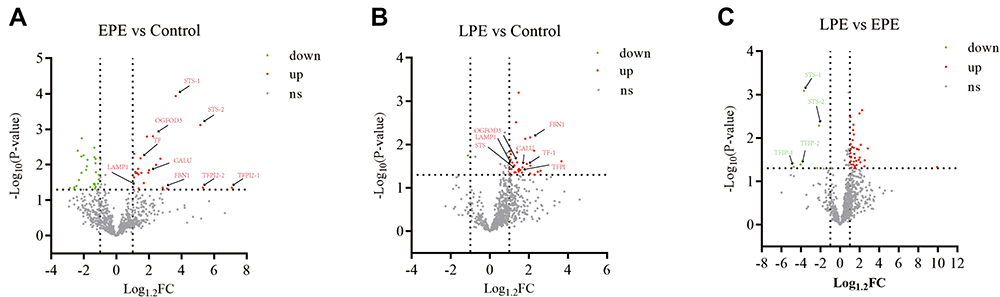 |
Figure 3 Distribution of glycopeptides quantified in placental tissues between early-onset PE and the healthy controls (A), between late-onset PE and healthy controls (B), and between late-onset and early-onset PE groups (C). Abbreviations: EPE, early-onset preeclampsia; LPE, late-onset preeclampsia; FC, fold change. |
Integrated Proteomic and N-Glycoproteomic Data Analysis
Although a total of 123 DEgPs showed over 1.2-fold changes in the studied placental tissues, it was not clear whether these changes occurred at the protein expression or glycosylation occupancy level. To address this concern, we calculated the ratio of DEgPs to DEPs to indicate the difference in the glycosylation occupancy of glycoproteins. Glycopeptide/protein ratios of 0.83–1.2 indicate that these proteins are regulated at the protein expression level. In comparison with the control group, the ratios of 10 glycoproteins (TFPI2, STS, FBN1, OGFOD3, CALU, LAMP1, TF, LAMC1, LAMA2, and MBD2) in both the EPE and LPE groups were outside the range of 0.83–1.2, indicating that these glycoproteins were changed at the glycosylation occupancy level (Tables S8–S10). The heatmap of fold changes of altered intact glycopeptides, corresponding proteins, and glycosylation occupancies among three sample groups showed a smaller difference at the overall protein level, which revealed that many site-specific glycosylation differences among different sample groups occurred at the glycosylation occupancy level instead of the protein expression level (Figure 4).
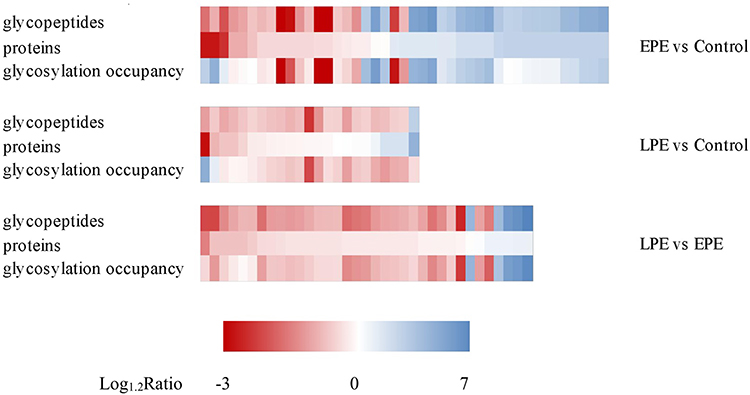 |
Figure 4 Heatmap of fold changes of altered intact glycopeptides, corresponding proteins and glycosylation occupancies among three sample groups. Abbreviations: EPE, early-onset preeclampsia; LPE, late-onset preeclampsia. |
Discussion
PE is a highly life-threatening syndrome, and its exact pathogenesis has not been fully elucidated. Although biochemical pathways including hypoxia, oxidative stress, angiogenesis changes, immune response, and inflammatory pathways have been determined to be independently involved in the development of PE,2,6 a more comprehensive understanding of the disease is urgently needed. Proteomic and glycoproteomic research based on mass spectrometry can help to quantitatively analyze the differential proteins and glycosylations closely related to the occurrence of PE at the global level and may provide a new insight into the etiology of PE.
In recent decades, proteomic techniques have been widely used in the study of clinical diseases including PE, which may provide candidate biomarkers for early diagnosis, or give insights on disease pathogenesis.23,24 For instance, Tang et al used label-free quantification proteomic technology to compare placental proteomes of normal-term pregnant women and PE patients, and found that DEPs were involved in multiple biological processes associated with immunity and angiogenesis.25 In the present study, 2260 highly reliable proteins were identified in nine placental tissues, and 60 proteins were differentially expressed between PE and normal placentas. These altered proteins are mainly enriched in biological processes, such as platelet degranulation, cell migration and adhesion, blood coagulation, and redox process, which are essential for the development of placenta.26–28 Among the identified DEPs, some proteins related to PE have been reported, including fibronectin (FN1),29–32 fibrillin-1 (FBN-1),33 pregnancy-specific beta-1-glycoprotein 9(PSG9),34 neprilysin (MME),35 and laeverin,36,37 displaying similar expression profiling in our proteome data to those previously reported. However, most of the identified DEPs in this study do not overlap with most of the published studies. In a systematic review of quantitative proteomics-based analyses performed on PE samples in the 2004–2020 period, of 23 publications focused on the proteomic analysis of placentas obtained from either pre-eclamptic or control individuals, only three differentially regulated proteins show consistent case/control ratios in 4 or more works.24 The complementarity across studies may result from the diversity of proteomic approaches used, sample collection methods and the heterogeneous nature of human samples. In addition, some significantly altered proteins are poorly explored or completely unknown in the pathogenesis of preeclampsia, thus requiring further experimental validation.
Using an intact glycopeptide analysis stratagem, glycoproteins, glycosylation sites, and glycans in placental tissues were analyzed at the glycoproteomic level. A total of 789 glycopeptides were accurately quantified, and they were derived from 159 glycoproteins, including 204 glycosylation sites and 59 glycan compositions. Among the identified glycoproteins, 47 glycoproteins are differentially expressed among the three sample groups. An integrated analysis of expression data from proteomic and glycoproteomic was applied to uncover the role of glycosylation modification in the change of glycoproteins. The data showed that several glycoproteins are changed at the glycosylation occupancy level but not at the protein expression level. For example, two glycoproteins, namely, steroid sulfatase (STS) and tissue factor pathway inhibitor 2 (TFPI2), were significantly upregulated in both EPE and LPE (p<0.05). STS is highly expressed in the placenta and serum of PE patients.38 Zheng et al found that TFPI2 can affect the proliferation and invasion of trophoblast cells, thus playing a role in the occurrence of PE.39 Our data showed that STS and TFPI2 were changed at the glycosylation level rather than at the protein level, indicating that STS and TFPI2 may affect the occurrence of PE through the abnormal glycosylation of proteins. Conversely, the change of some glycoproteins can be attributed to differential protein expression. For example, laminin subunit alpha-2 (LAMA2), a major component of the basement membrane, mediates cell attachment and migration into tissues during embryonic development by interacting with other extracellular matrices.40,41 Our data showed LAMA2 was downregulated in the placenta of patients with EPE, but this change was simply caused by differential protein expression but not the glycosylation occupancy. Moreover, fucose modifications are closely related to many biological processes and functions, including signal transduction, immunity, inflammation, and tumor metastasis.42,43 Our data show that nearly 50% of glycoproteins in placenta are fucosylated. The adhesion and invasion of trophoblast cells to maternal uterus is the premise of placenta formation, and based on the similarities in the biological characteristics of the trophoblast and cancer cells,44 fucosylation plays an important role in the maintenance of placenta function.
Generally, EPE and LPE are two different forms of disease with heterogeneous manifestations.2 However, specific pathogenic mechanisms that underline these two subtypes remain elusive. Shu et al used Protein Pathway Array to investigate the proteomic profiles among EPE, LPE, and healthy controls. They found that 16 DEPs and their associated signaling pathways overlapped between EPE and LPE, but meanwhile many proteins are uniquely altered in either EPE or LPE.45 In the present study, compared with the healthy control group, the number of identified differentially expressed proteins or glycopeptides in the EPE group is higher than that in the LPE group. Among the altered proteins or glycoproteins, only a minority are shared by these two groups, and the majority are subtype-specific, suggesting that common factors are present despite the remarkable difference in the pathogenic mechanisms of these two subtypes. For instance, the expression level of FN1 in the EPE or LPE group is significantly higher than that in the healthy controls, and the expression level in the EPE group is significantly higher than in the LPE group, indicating a positive correlation with the severity of PE and supporting previously obtained data.29–32 FN1 participates in the pathogenesis of PE by promoting apoptosis and autophagy in vascular endothelial cells,46 which is an accompanying pathological characteristic of pregnancy-induced hypertension syndrome.47,48 Furthermore, our data showed that two glycopeptides in FN1 protein were significantly upregulated in EPE (fold change: 1.32–1.56), whereas FN1 was upregulated by 1.9 times at the protein level, indicating that the glycosylation of FN1 peptides is incomplete, and the difference in glycopeptides expression is mainly caused by the differential protein expression. Therefore, the abnormal expression of FN1 protein is one crucial factor to lay down the common pathogenic mechanism of PE, and FN1 can be used as a specific and sensitive biomarker of PE in early screening. The principal iron storage protein FTH1 (ferritin heavy chain) is the main subunit of ferritin, and it plays an important role in iron transport, angiogenesis, inflammation, immunity, signal transduction, and cancer development.49,50 However, the role of FTH1 in PE pathogenesis is unreported. Our data showed low FTH1 expression in the placental tissues of EPE, but the level was not significantly changed in LPE, suggesting that FTH1 may be closely related to the occurrence of EPE.
Some limitations of this study need to be addressed. First, the sample size used in this study is relatively small, and further studies with large samples are needed to confirm our findings. Second, compared with similar proteomic studies of placentals based on LC-MS/MS (2D or label-free),25,51,52 the number of significantly altered proteins identified in this study is relatively small, which is generally in agreement with those studies using iTRAQ proteomic techniques.53,54 Some reasons may be mainly explained for this discrepancy. One factor involves the characteristics of TMT labeling reagents. When analyzing a complex proteome, a large number of co-eluted peptides will appear in chromatographic analysis, and these co-eluted peptides will enter the MS2 experiment, the report ion of co-eluted peptide fragment with similar molecular weight overlaps with the report ion of target peptide fragment, and the interference causes an underestimation of the variation in expression. However, compared with other commonly used techniques, TMT-based mass spectrometry can accurately quantify protein to a single amino acid and has obvious advantages in terms of quantitative reliability, coverage, and precision.55,56 Another factor can also be attributed to the different sampling criteria used in different studies. In the present study, only patients with severe PE were recruited, while in other studies, samples are mostly with mild or unspecified symptoms, resulting in different comparative proteome profiles. Moreover, the placental sampling sites and sampling procedures also affect the results. Besides, because the placenta is a complex and heterogeneous organ consisting of a variety of cells from the mother and fetus, cellular heterogeneity exacerbates heterogeneity between individual samples even with similar clinical phenotype.25 A poor correlation was observed among the proteomic expression profile of the three samples in each group (Figure S5). The heterogeneity among different PE individuals may also make the difference between groups smaller.
Conclusion
In summary, to the best of our knowledge, this is the first study to conduct an integrated analysis of proteome and glycoproteome in placental tissues of PE patients to comprehensively investigate protein expression changes and glycosylation modification changes during PE development. The results highlighted that some DEgPs identified in PE placental tissues were caused by changes in glycan or glycosylation occupancy other than by the changed protein abundance level. Future studies should clarify the specific molecular mechanism by which the glycosylation site and the glycan affect the protein function and participate in the occurrence of PE.
Abbreviations
PE, Preeclampsia; TMT, tandem mass tag; LC, liquid chromatography; MS, mass spectrum; EPE, early-onset preeclampsia; LPE, late-onset preeclampsia; NC, normal control; PBS, phosphate buffered saline; DTT, Dithiothreitol; ACN, acetonitrile; HLB, hydrophile-lipophile balance; HEPES, N-2-hydroxyethylpiperazine-N-2-ethane sulfonic acid; TFA, trifluoroacetic acid; MAX, mixed anion exchange; HCD, higher-energy collisional dissociation; FDR, false discovery rate; DEPs, differentially expressed proteins; DEgPs, differentially expressed glycopeptides; GO, Gene Ontology.
Data Sharing Statement
The mass spectrometry proteomic and glycoproteomic data have been deposited to the ProteomeXchange Consortium (http://proteomecentral.proteomexchange.org) via the iProX partner repository57 with the dataset identifier PXD032286 (URL: https://www.iprox.cn/page/PSV023.html;?url=1655188213974BAbc; Password: adX9).
Ethics Approval and Consent to Participate
The study was approved by the Ethics Committee of the Urumqi Maternal and Child Health Care Hospital (XJFYLL2019037). Informed consent was obtained from all participants before the collection of placenta samples.
Author Contributions
All authors made a significant contribution to the work reported, whether that is in the conception, study design, execution, acquisition of data, analysis and interpretation, or in all these areas; took part in drafting, revising, or critically reviewing the article; gave final approval of the version to be published; have agreed on the journal to which the article has been submitted; and agree to be accountable for all aspects of the work.
Funding
This study was supported by grants from National Natural Science Foundation of China (81960285), Tianshan Innovation Team Plan of Xinjiang Uygur Autonomous Region (2020D14010), and Natural Science Foundation of the Xinjiang Uygur Autonomous Region (2019D01A15).
Disclosure
The authors report no conflicts of interest in this work.
References
1. Steegers EAP, von Dadelszen P, Duvekot JJ, Pijnenborg R. Pre-eclampsia. Lancet. 2010;376(9741):631–644. doi:10.1016/S0140-6736(10)60279-6
2. Burton GJ, Redman CW, Roberts JM, Moffett A. Pre-eclampsia: pathophysiology and clinical implications. BMJ. 2019;366:l2381. doi:10.1136/bmj.l2381
3. Chaiworapongsa T, Chaemsaithong P, Korzeniewski SJ, Yeo L, Romero R. Pre-eclampsia part 2: prediction, prevention and management. Nat Rev Nephrol. 2014;10(9):531–540. doi:10.1038/nrneph.2014.103
4. Lisonkova S, Joseph KS. Incidence of preeclampsia: risk factors and outcomes associated with early- versus late-onset disease. Am J Obstet Gynecol. 2013;209(6):544e541–544 e512. doi:10.1016/j.ajog.2013.08.019
5. von Dadelszen P, Magee LA, Roberts JM. Subclassification of preeclampsia. Hypertens Pregnancy. 2003;22(2):143–148. doi:10.1081/PRG-120021060
6. Staff AC. The two-stage placental model of preeclampsia: an update. J Reprod Immunol. 2019;134–135:1–10. doi:10.1016/j.jri.2019.07.004
7. Hart GW, Copeland RJ. Glycomics hits the big time. Cell. 2010;143(5):672–676. doi:10.1016/j.cell.2010.11.008
8. Tian Y, Zhang H. Glycoproteomics and clinical applications. Proteomics Clin Appl. 2010;4(2):124–132. doi:10.1002/prca.200900161
9. Apweiler R. On the frequency of protein glycosylation, as deduced from analysis of the SWISS-PROT database. Biochim Biophys Acta Gen Subj. 1999;1473(1):4–8. doi:10.1016/S0304-4165(99)00165-8
10. Ohtsubo K, Marth JD. Glycosylation in cellular mechanisms of health and disease. Cell. 2006;126(5):855–867. doi:10.1016/j.cell.2006.08.019
11. Wang M, Zhu J, Lubman DM, Gao C. Aberrant glycosylation and cancer biomarker discovery: a promising and thorny journey. Clin Chem Lab Med. 2019;57(4):407–416. doi:10.1515/cclm-2018-0379
12. Clerc F, Reiding KR, Jansen BC, Kammeijer GS, Bondt A, Wuhrer M. Human plasma protein N-glycosylation. Glycoconj J. 2016;33(3):309–343.
13. Stowell SR, Ju T, Cummings RD. Protein glycosylation in cancer. Annu Rev Pathol. 2015;10(1):473–510. doi:10.1146/annurev-pathol-012414-040438
14. Zhang W, Wang H, Tang H, Yang P. Endoglycosidase-mediated incorporation of 18O into glycans for relative glycan quantitation. Anal Chem. 2011;83(12):4975–4981. doi:10.1021/ac200753e
15. Zhang H, Li XJ, Martin DB, Aebersold R. Identification and quantification of N-linked glycoproteins using hydrazide chemistry, stable isotope labeling and mass spectrometry. Nat Biotechnol. 2003;21(6):660–666. doi:10.1038/nbt827
16. Kaji H, Saito H, Yamauchi Y, et al. Lectin affinity capture, isotope-coded tagging and mass spectrometry to identify N-linked glycoproteins. Nat Biotechnol. 2003;21(6):667–672. doi:10.1038/nbt829
17. Sun S, Shah P, Eshghi ST, et al. Comprehensive analysis of protein glycosylation by solid-phase extraction of N-linked glycans and glycosite-containing peptides. Nat Biotechnol. 2016;34(1):84–88. doi:10.1038/nbt.3403
18. Fisher SJ. Why is placentation abnormal in preeclampsia? Am J Obstet Gynecol. 2015;213(4 Suppl):S115–S122. doi:10.1016/j.ajog.2015.08.042
19. Erlebacher A. Immunology of the maternal-fetal interface. Annu Rev Immunol. 2013;31(1):387–411. doi:10.1146/annurev-immunol-032712-100003
20. Phipps EA, Thadhani R, Benzing T, Karumanchi SA. Pre-eclampsia: pathogenesis, novel diagnostics and therapies. Nat Rev Nephrol. 2019;15(5):275–289. doi:10.1038/s41581-019-0119-6
21. Brown MA, Magee LA, Kenny LC, et al. Hypertensive disorders of pregnancy: ISSHP classification, diagnosis, and management recommendations for international practice. Hypertension. 2018;72(1):24–43. doi:10.1161/HYPERTENSIONAHA.117.10803
22. Zhao T, Jia L, Li J, et al. Heterogeneities of site-specific N-glycosylation in HCC tumors with low and high AFP concentrations. Front Oncol. 2020;10:496. doi:10.3389/fonc.2020.00496
23. Benny PA, Alakwaa FM, Schlueter RJ, Lassiter CB, Garmire LX. A review of omics approaches to study preeclampsia. Placenta. 2020;92:17–27. doi:10.1016/j.placenta.2020.01.008
24. Navajas R, Corrales F, Paradela A. Quantitative proteomics-based analyses performed on pre-eclampsia samples in the 2004–2020 period: a systematic review. Clin Proteomics. 2021;18(1):6. doi:10.1186/s12014-021-09313-1
25. Shangguan Y, Wang Y, Shi W, et al. Systematic proteomics analysis of lysine acetylation reveals critical features of placental proteins in pregnant women with preeclampsia. J Cell Mol Med. 2021;25(22):10614–10626. doi:10.1111/jcmm.16997
26. Forstner D, Guettler J, Gauster M. Changes in Maternal Platelet Physiology during Gestation and Their Interaction with Trophoblasts. Int J Mol Sci. 2021;22(19):10732. doi:10.3390/ijms221910732
27. Lim KH, Zhou Y, Janatpour M, et al. Human cytotrophoblast differentiation/invasion is abnormal in pre-eclampsia. Am J Pathol. 1997;151(6):1809–1818.
28. Zhou Y, Damsky CH, Chiu K, Roberts JM, Fisher SJ. Preeclampsia is associated with abnormal expression of adhesion molecules by invasive cytotrophoblasts. J Clin Invest. 1993;91(3):950–960. doi:10.1172/JCI116316
29. Jiang R, Wang T, Zhou F, Yao Y, He J, Xu D. Bioinformatics-based identification of miRNA-, lncRNA-, and mRNA-associated ceRNA networks and potential biomarkers for preeclampsia. Medicine. 2020;99(45):e22985. doi:10.1097/MD.0000000000022985
30. Pan HT, Guo MX, Xiong YM, et al. Differential proteomic analysis of umbilical artery tissue from preeclampsia patients, using iTRAQ isobaric tags and 2D nano LC-MS/MS. J Proteomics. 2015;112:262–273. doi:10.1016/j.jprot.2014.09.006
31. Zhao M, Li L, Yang X, Cui J, Li H. FN1, FOS, and ITGA5 induce preeclampsia: abnormal expression and methylation. Hypertens Pregnancy. 2017;36(4):302–309. doi:10.1080/10641955.2017.1385795
32. Ma Y, Lin H, Zhang H, Song X, Yang H. Identification of potential crucial genes associated with early-onset pre-eclampsia via a microarray analysis. J Obstet Gynaecol Res. 2017;43(5):812–819. doi:10.1111/jog.13275
33. Costa AM, Maximiano EB, Avvad-Portari E, Jesus NR, Levy RA, Porto LC. Contractile cells and fibrillin-1 distribution is disturbed in terminal villi of placentae from patients with preeclampsia and systemic lupus erythematosus. Placenta. 2006;27(2–3):234–243. doi:10.1016/j.placenta.2005.02.018
34. Jones K, Ballesteros A, Mentink-Kane M, et al. PSG9 stimulates increase in FoxP3+ regulatory T-cells through the TGF-beta1 pathway. PLoS One. 2016;11(7):e0158050. doi:10.1371/journal.pone.0158050
35. Li XM, Moutquin JM, Deschenes J, Bourque L, Marois M, Forest JC. Increased immunohistochemical expression of neutral metalloendopeptidase (Enkephalinase; EC 3. 4.24.11)in villi of the human placenta with pre-eclampsia. Placenta. 1995;16(5):435–445. doi:10.1016/0143-4004(95)90101-9
36. Sitras V, Paulssen RH, Gronaas H, et al. Differential placental gene expression in severe preeclampsia. Placenta. 2009;30(5):424–433. doi:10.1016/j.placenta.2009.01.012
37. Fujiwara H. Membrane-bound peptidases regulate human extravillous trophoblast invasion. Placenta. 2007;28 Suppl A:S70–S75. doi:10.1016/j.placenta.2007.01.005
38. Gratton AM, Ye L, Brownfoot FC, et al. Steroid sulfatase is increased in the placentas and whole blood of women with early-onset preeclampsia. Placenta. 2016;48:72–79. doi:10.1016/j.placenta.2016.10.008
39. Zheng L, Huang J, Su Y, Wang F, Kong H, Xin H. Overexpression of tissue factor pathway inhibitor 2 attenuates trophoblast proliferation and invasion in preeclampsia. Hum Cell. 2020;33(3):512–520. doi:10.1007/s13577-020-00322-0
40. Shan N, Zhang X, Xiao X, et al. Laminin alpha4 (LAMA4) expression promotes trophoblast cell invasion, migration, and angiogenesis, and is lowered in preeclamptic placentas. Placenta. 2015;36(8):809–820. doi:10.1016/j.placenta.2015.04.008
41. Wragg JW, Finnity JP, Anderson JA, et al. MCAM and LAMA4 are highly enriched in tumor blood vessels of renal cell carcinoma and predict patient outcome. Cancer Res. 2016;76(8):2314–2326. doi:10.1158/0008-5472.CAN-15-1364
42. Schneider M, Al-Shareffi E, Haltiwanger RS. Biological functions of fucose in mammals. Glycobiology. 2017;27(7):601–618. doi:10.1093/glycob/cwx034
43. Zhang M, Wang L, Zhang H, Cong J, Zhang L. Serum alpha-l-fucosidase activities are significantly increased in patients with preeclampsia. Prog Mol Biol Transl Sci. 2019;162:349–362.
44. Ross CA. The trophoblast model of cancer. Nutr Cancer. 2015;67(1):61–67. doi:10.1080/01635581.2014.956257
45. Shu C, Liu Z, Cui L, et al. Protein profiling of preeclampsia placental tissues. PLoS One. 2014;9(11):e112890. doi:10.1371/journal.pone.0112890
46. Wu H, Liu K, Zhang J. Excess fibronectin 1 participates in pathogenesis of pre-eclampsia by promoting apoptosis and autophagy in vascular endothelial cells. Mol Hum Reprod. 2021;27(6). doi:10.1093/molehr/gaab030
47. He P, Shao D, Ye M, Zhang G. Analysis of gene expression identifies candidate markers and pathways in pre-eclampsia. J Obstet Gynaecol. 2015;35(6):578–584. doi:10.3109/01443615.2014.990430
48. Yang TL, Lee PL, Lee DY, et al. Differential regulations of fibronectin and laminin in Smad2 activation in vascular endothelial cells in response to disturbed flow. J Biomed Sci. 2018;25(1):1. doi:10.1186/s12929-017-0402-4
49. Dogan E, Demir SC, Gulec UK. Maternal soluble vascular cytoplasmic adhesion molecule-1 and fibronectin levels in early- and late-onset preeclamptic pregnancies. Clin Exp Obstet Gynecol. 2014;41(6):681–684. doi:10.12891/ceog17532014
50. Huang H, Qiu Y, Huang G, Zhou X, Zhou X, Luo W. Value of Ferritin Heavy Chain (FTH1) expression in diagnosis and prognosis of renal cell carcinoma. Med Sci Monit. 2019;25:3700–3715. doi:10.12659/MSM.914162
51. Wang F, Shi Z, Wang P, You W, Liang G, Zenclussen A. Comparative proteome profile of human placenta from normal and preeclamptic pregnancies. PLoS One. 2013;8(10):e78025. doi:10.1371/journal.pone.0078025
52. Jin X, Xu Z, Cao J, et al. Proteomics analysis of human placenta reveals glutathione metabolism dysfunction as the underlying pathogenesis for preeclampsia. Biochim Biophys Acta Proteins Proteom. 2017;1865(9):1207–1214. doi:10.1016/j.bbapap.2017.07.003
53. Feng Y, He Y, Wang J, et al. Application of iTRAQ proteomics in identification of the differentially expressed proteins of placenta of pregnancy with preeclampsia. J Cell Biochem. 2019;120(4):5409–5416. doi:10.1002/jcb.27819
54. Qi WH, Zheng MY, Li C, Xu L, Xu JE. Screening of differential proteins of placenta tissues in patients with pre-eclampsia by iTRAQ proteomics techniques. Minerva Med. 2017;108(5):389–395. doi:10.23736/S0026-4806.17.05080-7
55. Xiao H, Xin W, Sun LM, Li SS, Zhang T, Ding XY. Comprehensive proteomic profiling of aqueous humor proteins in proliferative diabetic retinopathy. Transl Vis Sci Technol. 2021;10(6):3. doi:10.1167/tvst.10.6.3
56. Chahrour O, Cobice D, Malone J. Stable isotope labelling methods in mass spectrometry-based quantitative proteomics. J Pharm Biomed Anal. 2015;113:2–20. doi:10.1016/j.jpba.2015.04.013
57. Ma J, Chen T, Wu S, et al. iProX: an integrated proteome resource. Nucleic Acids Res. 2019;47(D1):D1211–D1217. doi:10.1093/nar/gky869
 © 2023 The Author(s). This work is published and licensed by Dove Medical Press Limited. The full terms of this license are available at https://www.dovepress.com/terms.php and incorporate the Creative Commons Attribution - Non Commercial (unported, v3.0) License.
By accessing the work you hereby accept the Terms. Non-commercial uses of the work are permitted without any further permission from Dove Medical Press Limited, provided the work is properly attributed. For permission for commercial use of this work, please see paragraphs 4.2 and 5 of our Terms.
© 2023 The Author(s). This work is published and licensed by Dove Medical Press Limited. The full terms of this license are available at https://www.dovepress.com/terms.php and incorporate the Creative Commons Attribution - Non Commercial (unported, v3.0) License.
By accessing the work you hereby accept the Terms. Non-commercial uses of the work are permitted without any further permission from Dove Medical Press Limited, provided the work is properly attributed. For permission for commercial use of this work, please see paragraphs 4.2 and 5 of our Terms.