")
Back to Journals » Drug Design, Development and Therapy » Volume 16
Integrated Metabonomics and Network Pharmacology to Reveal the Action Mechanism Effect of Shaoyao Decoction on Ulcerative Colitis
Authors Wu J, Luo Y, Shen Y, Hu Y, Zhu F , Wu J, Liu Y
Received 18 May 2022
Accepted for publication 27 September 2022
Published 27 October 2022 Volume 2022:16 Pages 3739—3776
DOI https://doi.org/10.2147/DDDT.S375281
Checked for plagiarism Yes
Review by Single anonymous peer review
Peer reviewer comments 2
Editor who approved publication: Dr Georgios Panos
Jin Wu,1 Yiting Luo,1 Yan Shen,2 Yuyao Hu,2 Fangyuan Zhu,1 Jiaqian Wu,1 Yingchao Liu3
1The Second Clinical Medical College, Zhejiang Chinese Medical University, Hangzhou, 310053, People’s Republic of China; 2Department of Gastroenterology, The Second Affiliated Hospital of Zhejiang Chinese Medical University, Hangzhou, 310005, People’s Republic of China; 3Academic Affairs Office, Zhejiang Chinese Medical University, Hangzhou, 310053, People’s Republic of China
Correspondence: Yingchao Liu, Academic Affairs Office, Zhejiang Chinese Medical University, Hangzhou, 310053, People’s Republic of China, Email [email protected]
Background: Traditional Chinese medicine (TCM) has the advantage of multi-component and multi-target, which becomes a hot spot in the treatment of numerous diseases. Shaoyao decoction (SYD) is a TCM prescription, which is mainly used to treat damp-heat dysentery clinically, with small side effects and low cost. However, its mechanism remains elusive. The purpose of this study is to explore the mechanism of SYD in the treatment of mice with ulcerative colitis (UC) induced by dextran sulfate sodium (DSS) through metabolomics and network pharmacology, and verify through molecular docking and immunohistochemistry, so as to provide a scientific basis for the role of SYD in the treatment of UC.
Materials and Methods: Firstly, DSS-induced UC models were established and then untargeted metabolomics analysis of feces, livers, serum and urine was performed to determine biomarkers and metabolic pathways closely related to the role of SYD. Besides, network pharmacology was applied to screen the active components and UC-related targets, which was verified by molecular docking. Finally, metabonomics and network pharmacology were combined to draw the metabolite-pathway-target network and verified by immunohistochemistry.
Results: Metabolomics results showed that a total of 61 differential metabolites were discovered in SYD-treated UC with 3 main metabolic pathways containing glycerophospholipid metabolism, sphingolipid metabolism and biosynthesis of unsaturated fatty acids, as well as 8 core targets involving STAT3, IL1B, IL6, IL2, AKT1, IL4, ICAM1 and CCND1. Molecular docking demonstrated that the first five targets had strong affinity with quercetin, wogonin, kaempferol and baicalein. Combined with metabolomics and network pharmacology, sphingolipid signaling pathway, PI3K/AKT-mTOR signaling pathway and S1P3 pathway were identified as the main pathways.
Conclusion: SYD can effectively ameliorate various symptoms and alleviate intestinal mucosal damage and metabolic disorder in DSS induced UC mice. Its effect is mainly related to sphingolipid metabolism, PI3K/AKT-mTOR signaling pathway and S1P3 pathway.
Keywords: metabolomics, UPLC-Q-TOF-MS, network pharmacology, Shaoyao decoction, ulcerative colitis
Introduction
UC is a chronic, nonspecific intestinal inflammatory disease that belongs to category of “diarrhea” and “dysentery” in TCM,1 with typical clinical symptoms of recurrent diarrhea, mucopurulent bloody stools, and abdominal pain.2 The etiology is unknown, mainly related to the interaction of multiple factors such as environment, genetics and intestinal microecology, which lead to an abnormal immune imbalance in the intestinal tract.3 Currently, the drug treatments of UC mainly include 5-aminosalicylic acid drugs, steroids, immunomodulators and biological agents.3–6 However, complementary and alternative therapies, containing TCM, dietary supplements, probiotics, and mind/body interventions,7 are becoming a novel strategy for treating UC, due to the side effects and adverse reactions such as drug dependence, drug resistance and decreased immune function. Among them, TCM has been manifested to have potential advantages owing to its clinical application and low toxicity.1,2,8–11
SYD, a well-known traditional Chinese medicine formula, possesses the functions of clearing heat and drying dampness, as well as regulating Qi and blood, and mainly focus on the treatment of damp-heat dysentery clinically.3 SYD consists of nine herbs, containing Paeoniae Radix Alba (Chinese name: Shaoyao), Angelicae Sinensis Radix (Chinese name: Danggui), Coptidis Rhizoma (Chinese name: Huanglian), Scutellariae Radix (Chinese name: Huangqin), Glycyrrhizae Radix et Rhizoma (Chinese name: Gancao), Arecae Semen (Chinese name: Binglang), Aucklandiae Radix (Chinese name: Muxiang), Rhei Radix et Rhizome (Chinese name: Dahuang), Cinnanmomi Cortex (Chinese name: Rougui), in a ratio of 30:15:15:15:6:6:6:9:5.3
Many studies have shown that these herbs contained many bioactive compounds with anti-inflammatory and antioxidant activities.10 A study has indicated that glycyrrhizic acid extract and its active ingredients are able to inhibit the free of pro-inflammatory mediators NO, IL1β and IL6 by mouse macrophages.12 Berberine, the active ingredient of Coptidis Rhizoma, can reduce the inflammatory response in UC and protect intestinal epithelial cells from damage.13 One of the main components of Rhei Radix et Rhizome, rhein, can eliminate the enhanced intestinal permeability caused by uric acid, regulate the intestinal microbiota, and relieve intestinal inflammation.14 SYD protects gut barrier function by adjusting the mucus layer genes MUC1, MUC2, MUC4 and TFF3, along with the epithelial barrier genes zonula occludens-1 (ZO-1) and Occludin.3
It is noteworthy that the key active components and targets of SYD are still unknown. Moreover, despite the known therapeutic effects of SYD, its molecular mechanism has not been fully elucidated and requires further study.7
Based on the complex chemical compositions and multi-target as well as multi-level characteristics of TCM, new methods such as network pharmacology and metabolomics have been created to explore the mechanism of drugs on diseases.
On the one hand, metabolomics is a new discipline that simultaneously conducts qualitative and quantitative analysis of all low-molecular-weight metabolites of a certain organism or cell in a specific physiological period. Ultra-performance liquid chromatography-quadrupole-time of flight-mass spectrometry (UPLC-Q-TOF-MS) has been widely used in drug multicomponent analysis and metabolite research owing to its high resolution, precision and sensitivity,15 which can provide primary and secondary fragment ion information of small molecule metabolites, with the ability to help us quickly analyze metabolite structures, laying the foundation for metabolite identification. Through metabolomic analysis, we can understand which metabolic pathways are mainly restored by SYD, such as glycerophospholipid metabolism and sphingolipid metabolism. Notably, plasma, feces, urine, et cetera can all be detected by metabolomics.
It has been confirmed that UC pathogenesis is associated with metabolic disorders,13,16 the gut microbiota also produces many important metabolites containing short-chain fatty acids, biotin and vitamin K.17 However, there are few studies on metabolic changes during the treatment of colitis with SYD. Therefore, it is beneficial to study the metabolite changes during the pathogenesis and treatment of UC to help us further understand the pathogenesis of UC and the underlying therapeutic mechanisms of SYD.
On the other hand, network pharmacology is a new discipline, which discusses the mechanism of drug therapy by constructing a component-target network, suitable for the study of Chinese medicine compounds.
Molecular docking is a method to predict the binding affinity between protein receptors and small molecule ligand.18 Binding energy lower than 0 indicates that the two molecules have the ability to bind spontaneously, and the smaller the binding energy, the more stable the conformation.2
In this study, UC model was established in mice, and untargeted LC-MS-based metabolomic approach and network pharmacology were used to evaluate the protective effect of SYD on UC, and to explore its mechanism. The flow chart of the research process is displayed in Figure 1.
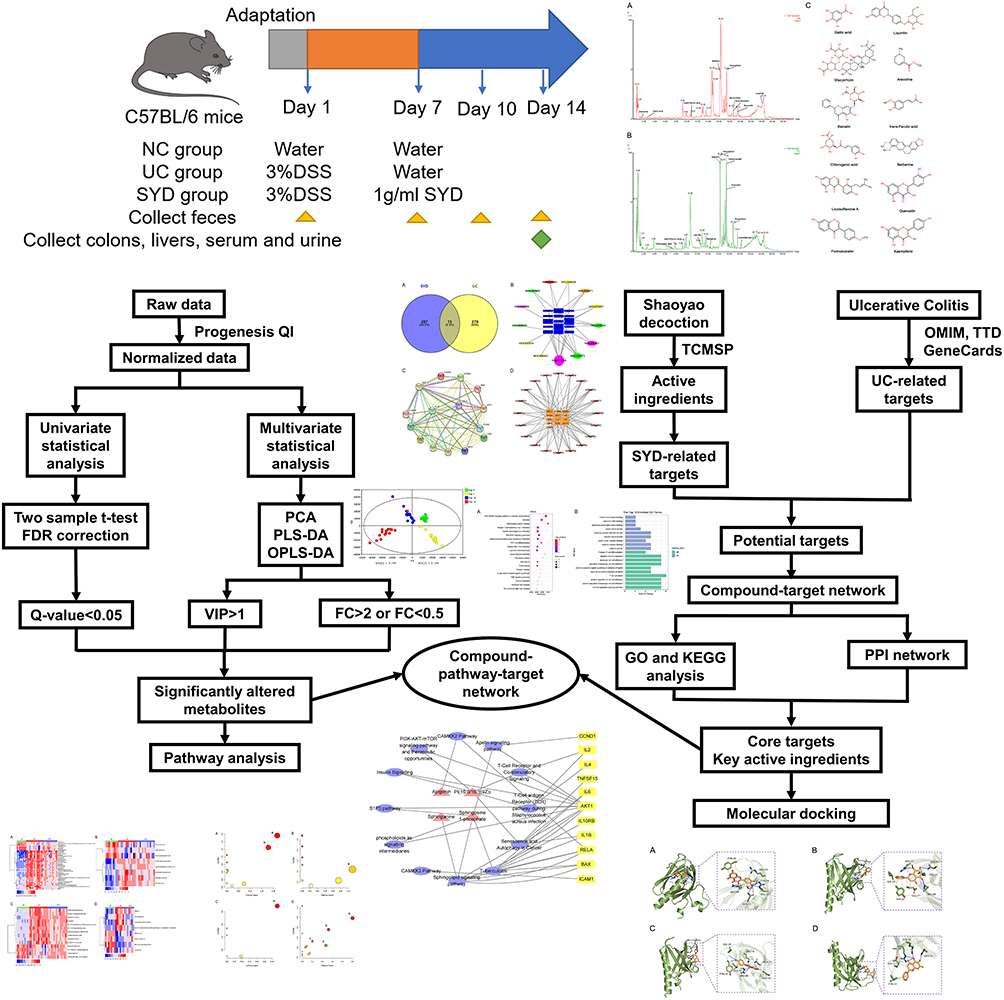 |
Figure 1 Flow chart of the research process. |
Materials and Methods
Main Chemicals and Reagents
DSS was purchased from MP Biomedicals (Irvine, CA, USA). LC-MS grade methanol and acetonitrile for extraction or analysis were purchased from Merck KGaA (Darmstadt Germany). Ultrapure water was prepared by a Milli‐Q water purification system (Millipore, Bedford, MA, USA). LC-MS grade formic acid was obtained from Shanghai Aladdin Biochemical Technology (Shanghai, China).
Composition and Preparation of SYD
After mixing Paeoniae Radix Alba (30g), Angelicae Sinensis Radix (15g), Coptidis Rhizoma (15g), Scutellariae Radix (15g), Glycyrrhizae Radix et Rhizoma (6g), Arecae Semen (6g), Aucklandiae Radix (6g), Rhei Radix et Rhizome (9g), Cinnanmomi Cortex (5g), we soaked them in distilled water (1:10, w/v) for 30 minutes, boiled them for 1h, filtered them with gauze, collected the filtrate, decocted the residue with distilled water (1:6, w/v) in the above method, then combined the two filtrates, and concentrated them to 1 g/mL with a rotary evaporator at 60 ℃.3 Finally, the SYD oral solution was stored in the refrigerator at 4 ℃ before intragastric administration to mice. All herbs were purchased from the Second Affiliated Hospital of Zhejiang Chinese Medical University (Hangzhou, Zhejiang, China).
Animals and Groups
A total of 40 8-week-old healthy male C57BL/6 mice (no specific pathogen, SPF) weighing 16–20g were bought from Zhejiang Chinese Medical University Laboratory Animal Research Center. All mice were fed with standard pelleted feed and free drinking water ad libitum under the standard laboratory conditions of controlled temperature (22 ± 2 ℃), humidity (50 ± 10%) and 12-hour light/dark cycle.6 In addition to the above, they were acclimatized for 7 days before the experiments we started. Moreover, the study was approved by the Ethics Committee of Zhejiang Chinese Medical University (IACUC-20210531-02).
Forty mice were randomly divided into three groups: normal control (NC), model (UC), and SYD group, with 10 mice in the normal control group and 15 mice in the model group and SYD group. Then mice in the model group and SYD group were given 3% DSS in drinking water for 7 days, respectively, to establish the DSS-induced UC model, while mice in the normal control group were treated with water.5 After the UC model was established, mice in the SYD group were gavaged with 0.02mL/g SYD, whereas those in the control and model groups were gavaged with the same volume of normal saline for 7 consecutive days, and all mice returned to normal drinking water.
Specimen Collection
Fecal samples of mice were gathered and stored at −80 ℃ on four time periods: Day 0, Day 7, Day 10 and Day 14. At the end of the experiment, urine samples were collected after a 12-hours fast, after which all mice were sacrificed and liver, serum samples were collected and stored at −80 ℃ for subsequent metabolomic analysis. The mouse colon tissues were taken for histopathological analysis. During the experiment, the daily body weight and disease activity index (DAI) of mice in each group were recorded.
During the experiment, the percentage of daily weight loss, stool consistency and occult blood or gross bleeding of mice in each group were recorded to calculate the disease activity index (DAI). The scoring criteria of DAI are shown in Table 1.9,13
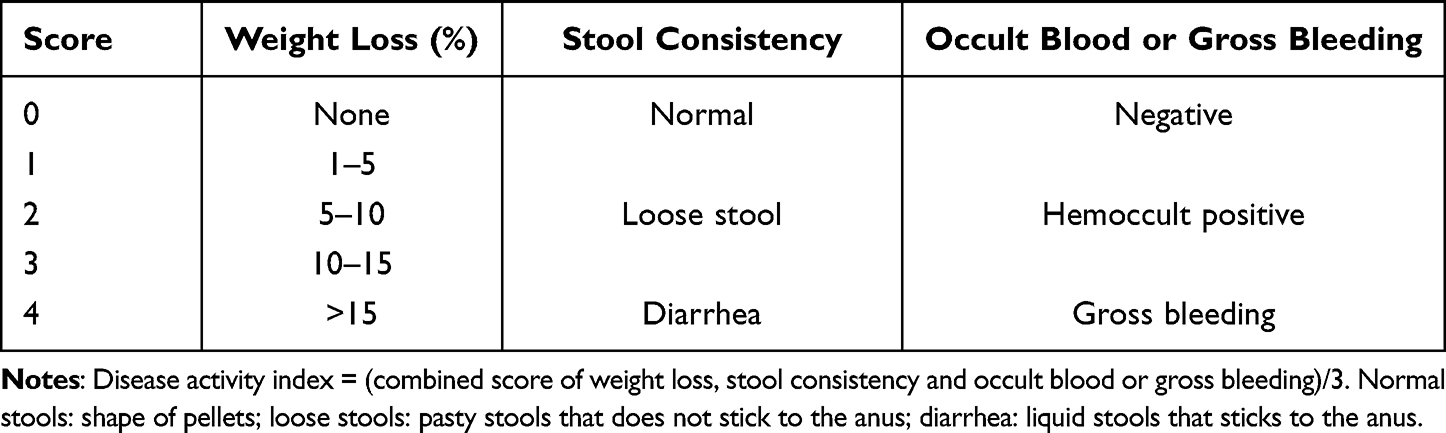 |
Table 1 Criteria for Scoring Disease Activity Index |
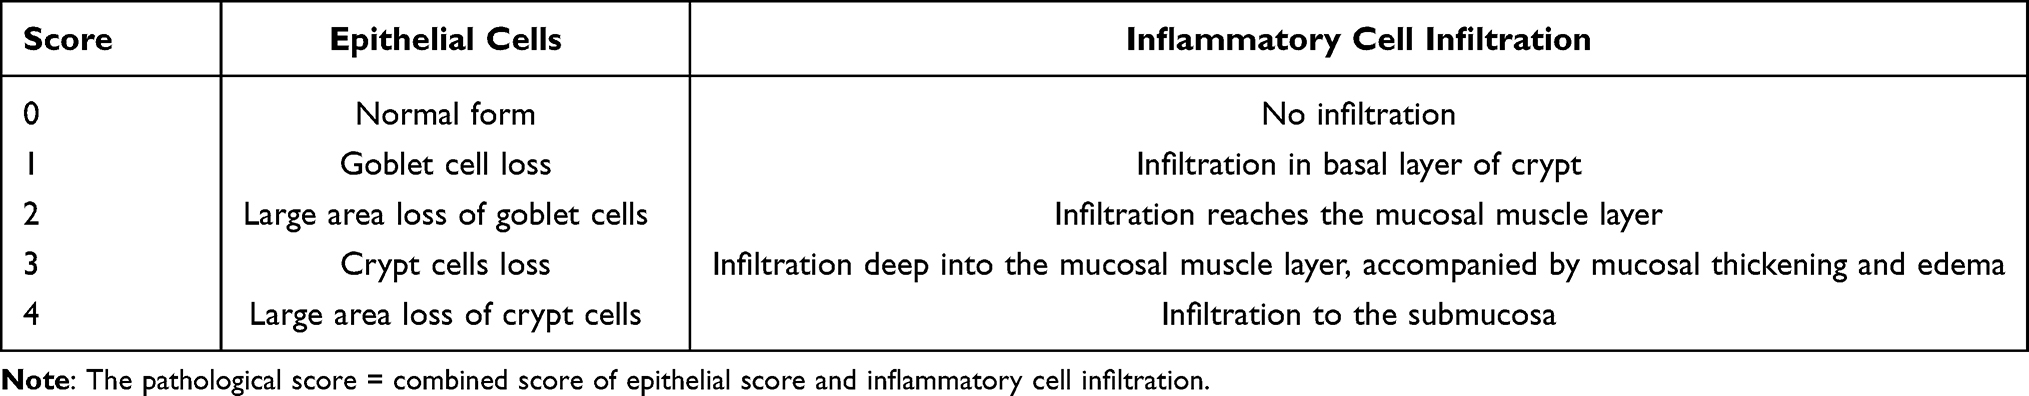 |
Table 2 Evaluation of Pathological Score |
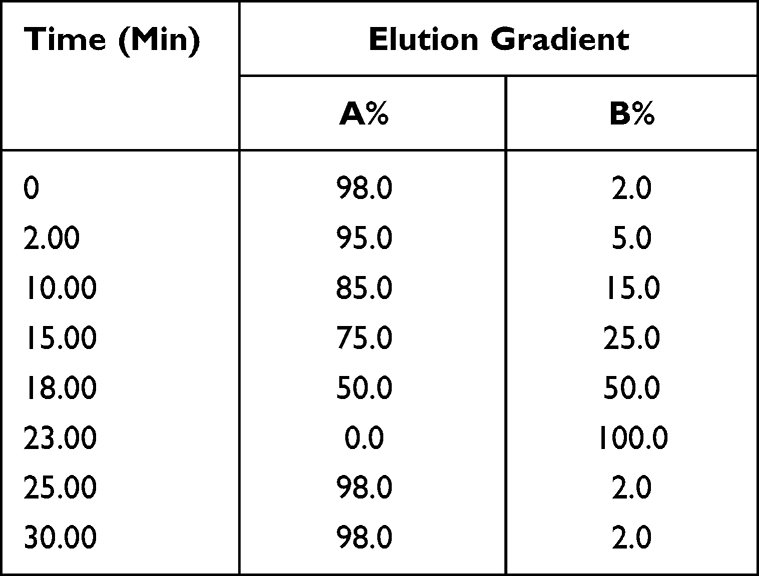 |
Table 3 The Gradient Elution Process of SYD |
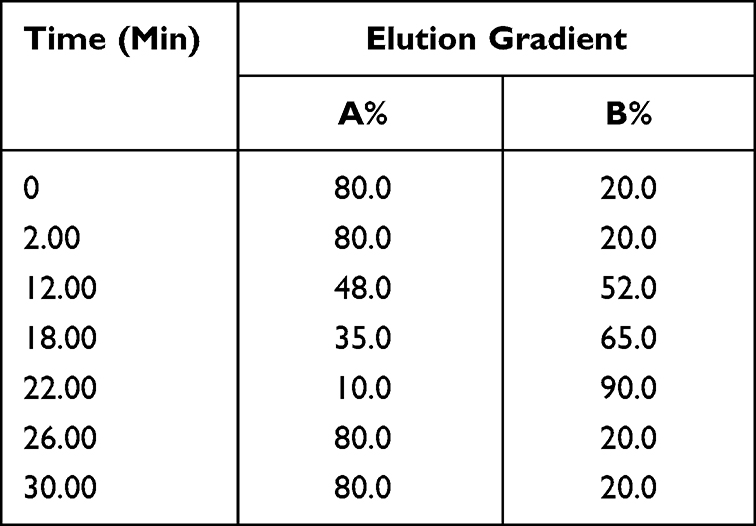 |
Table 4 The Gradient Elution Process of Fecal, Liver, Serum, Urine Samples |
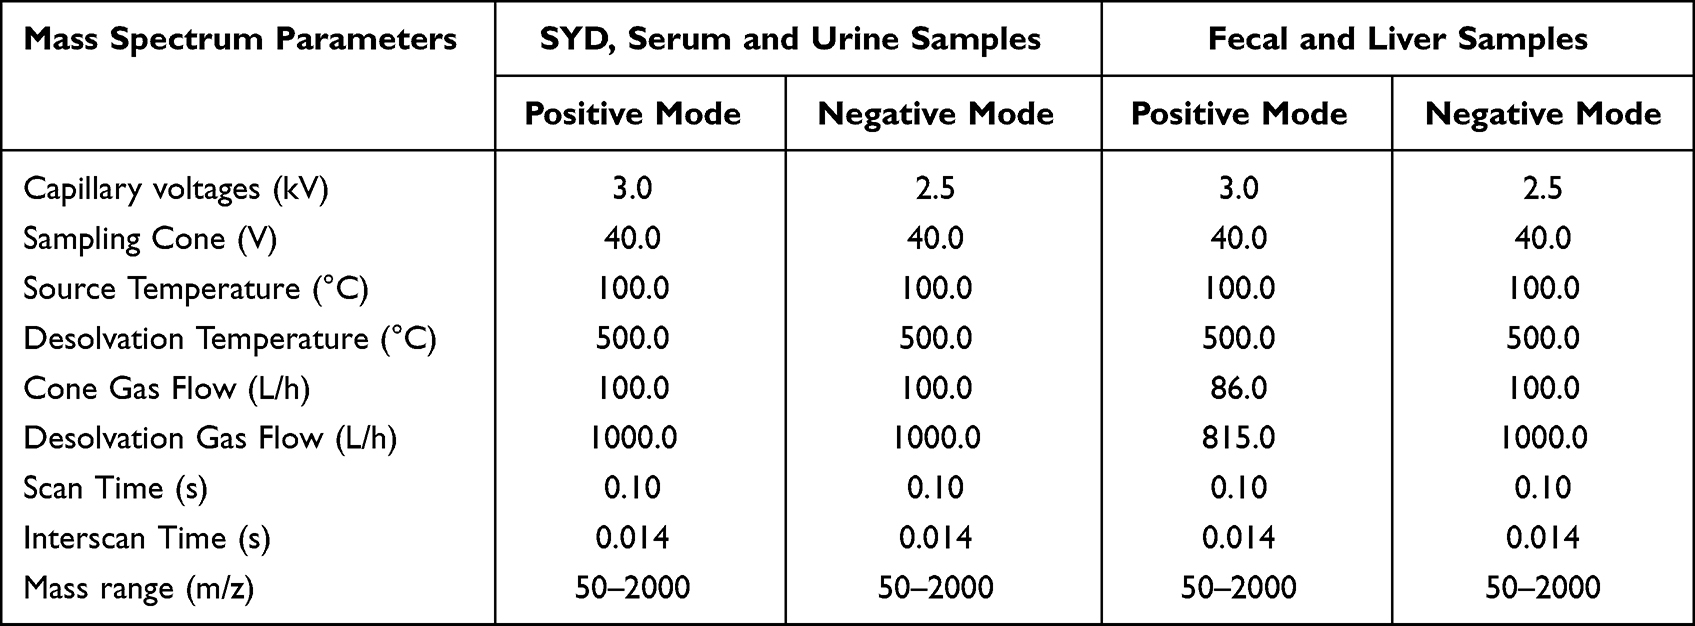 |
Table 5 The Mass Spectrum Conditions of All Samples |
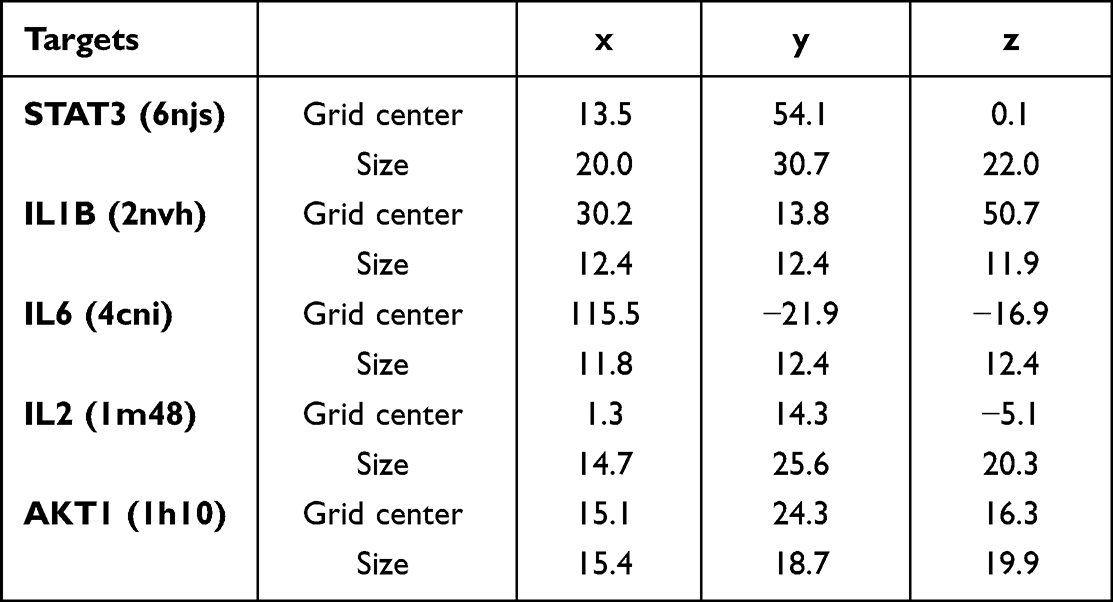 |
Table 6 The Molecular Docking Parameters |
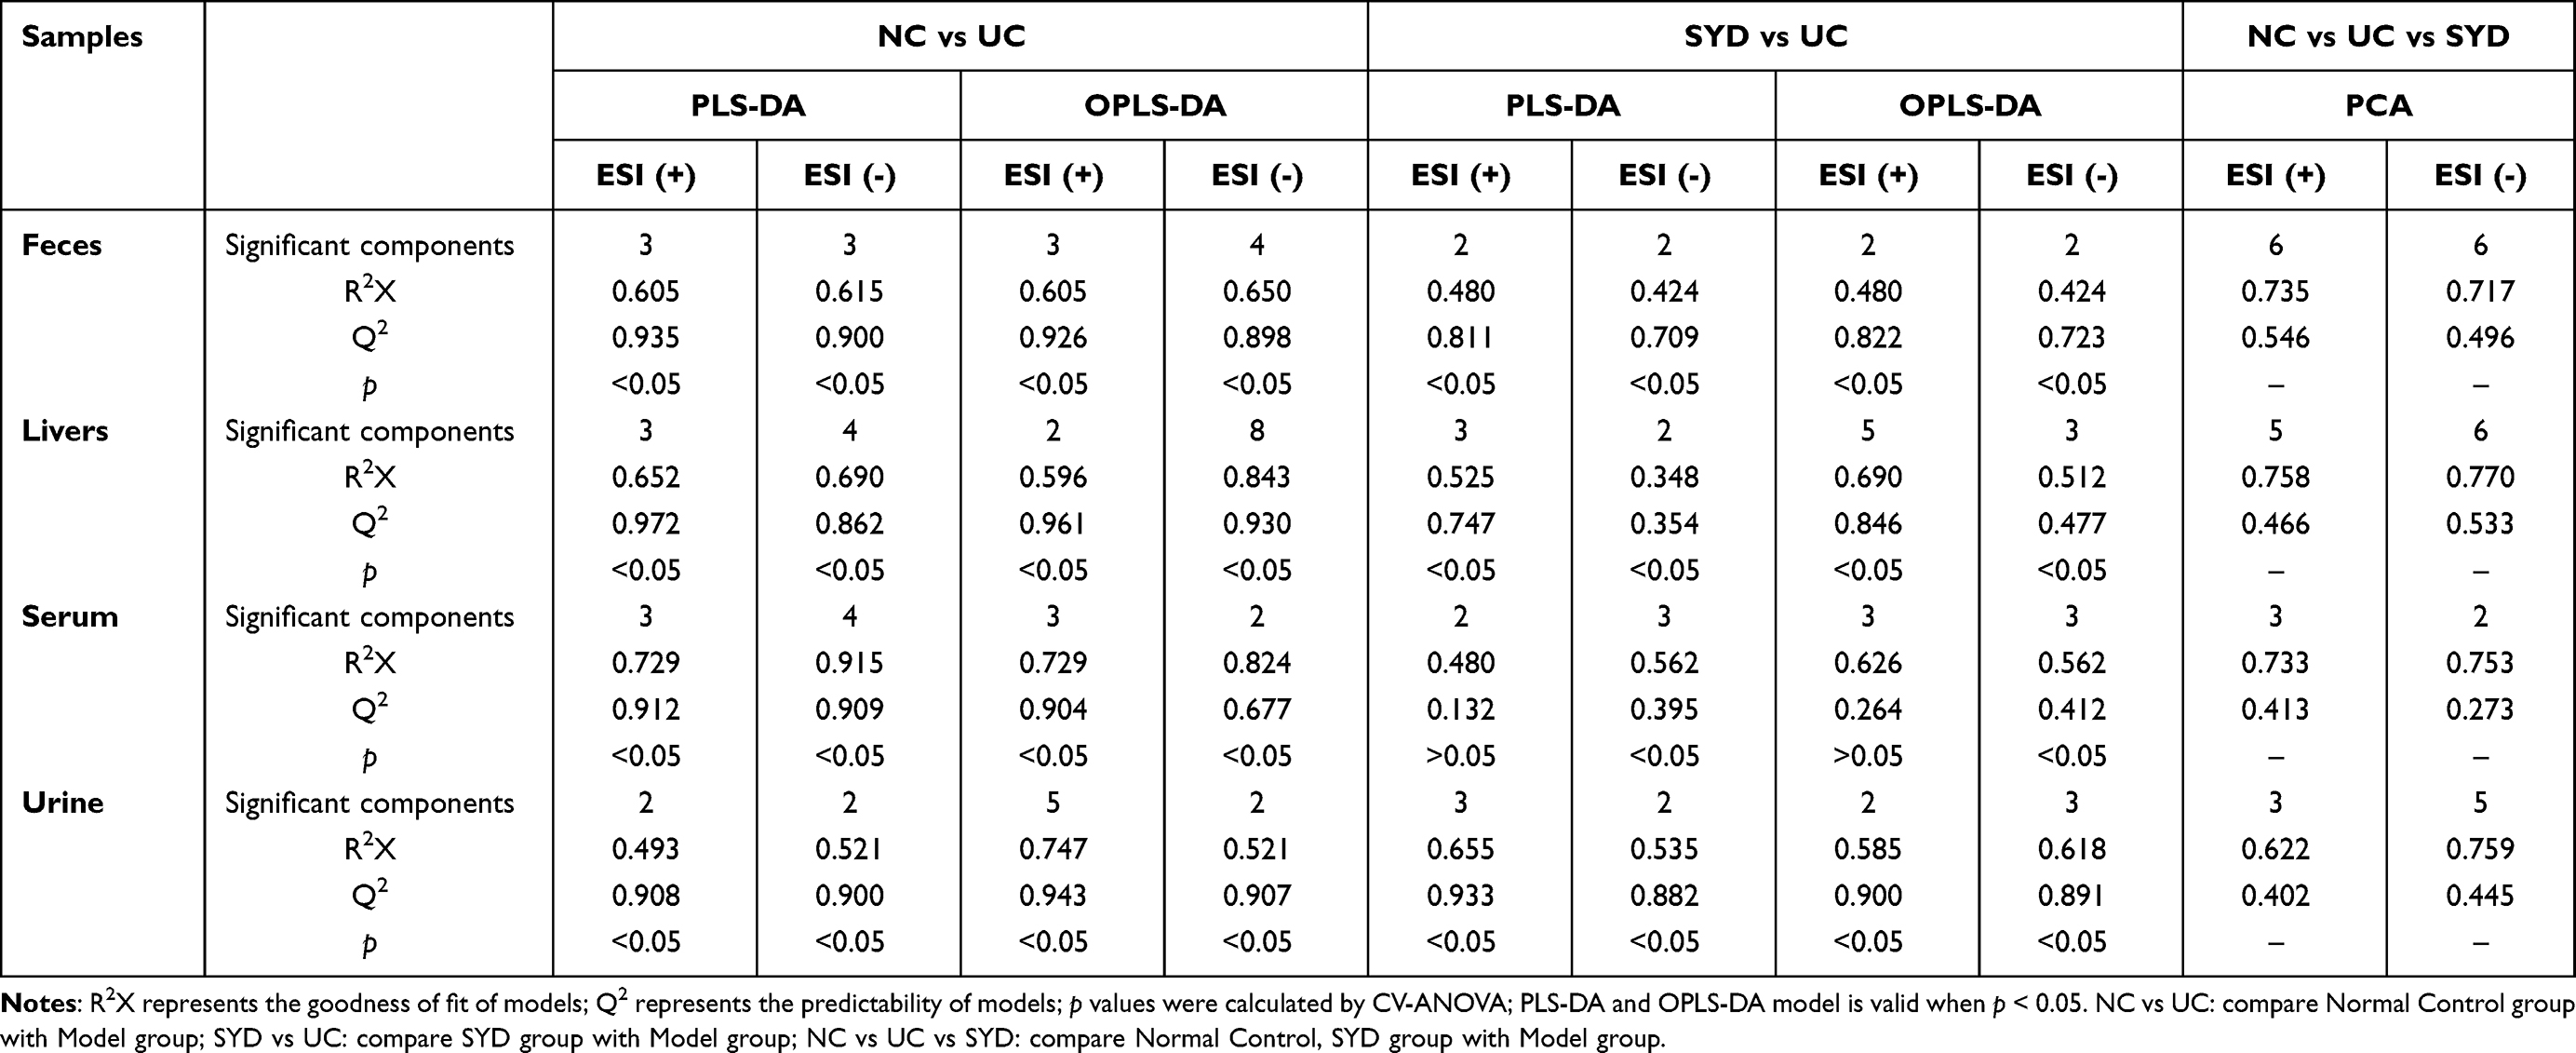 |
Table 7 Validation Parameters of PCA, PLS-DA and OPLS-DA Models for Mice Feces, Livers, Serum and Urine |
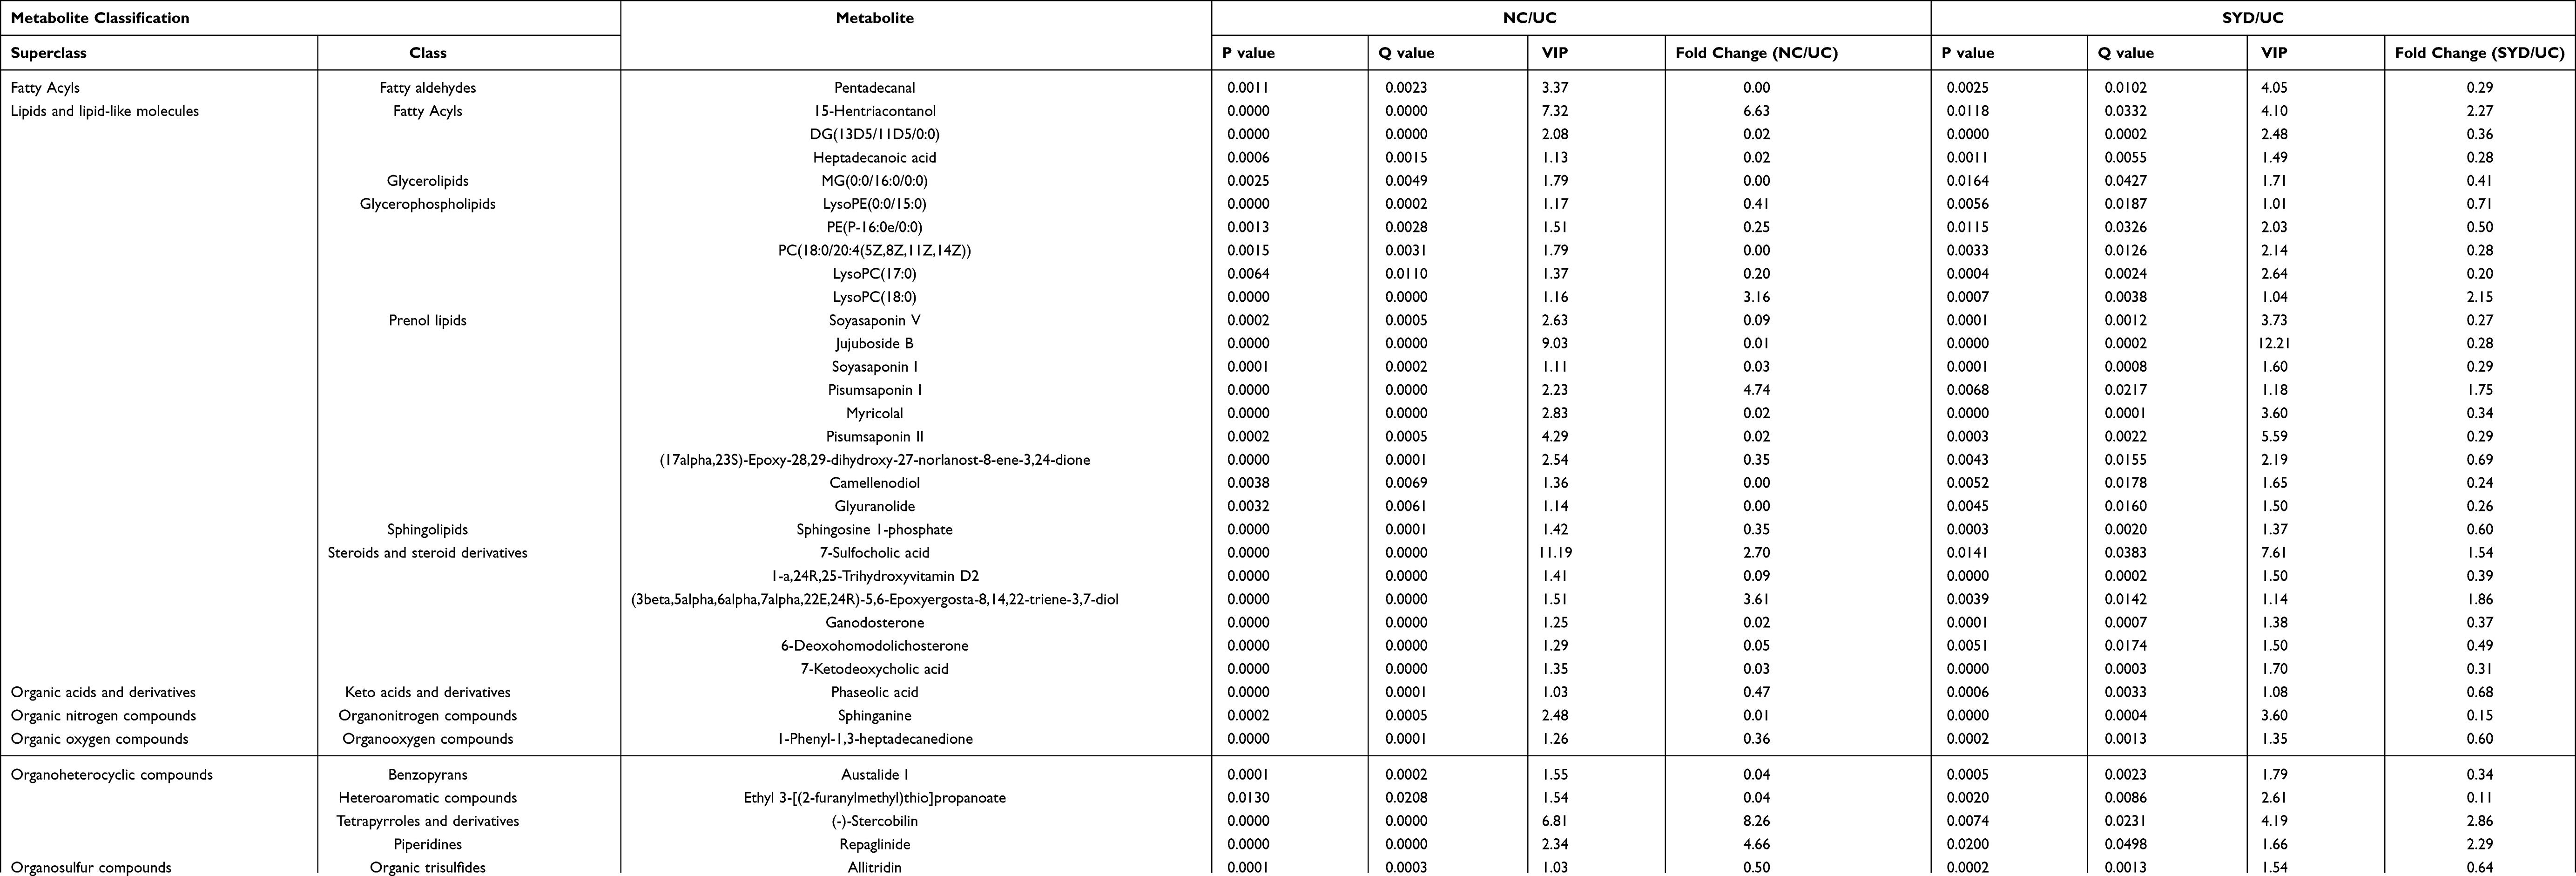 |
Table 8 Differential Metabolites in Fecal Tissues |
 |
Table 9 Differential Metabolites in Liver Tissues |
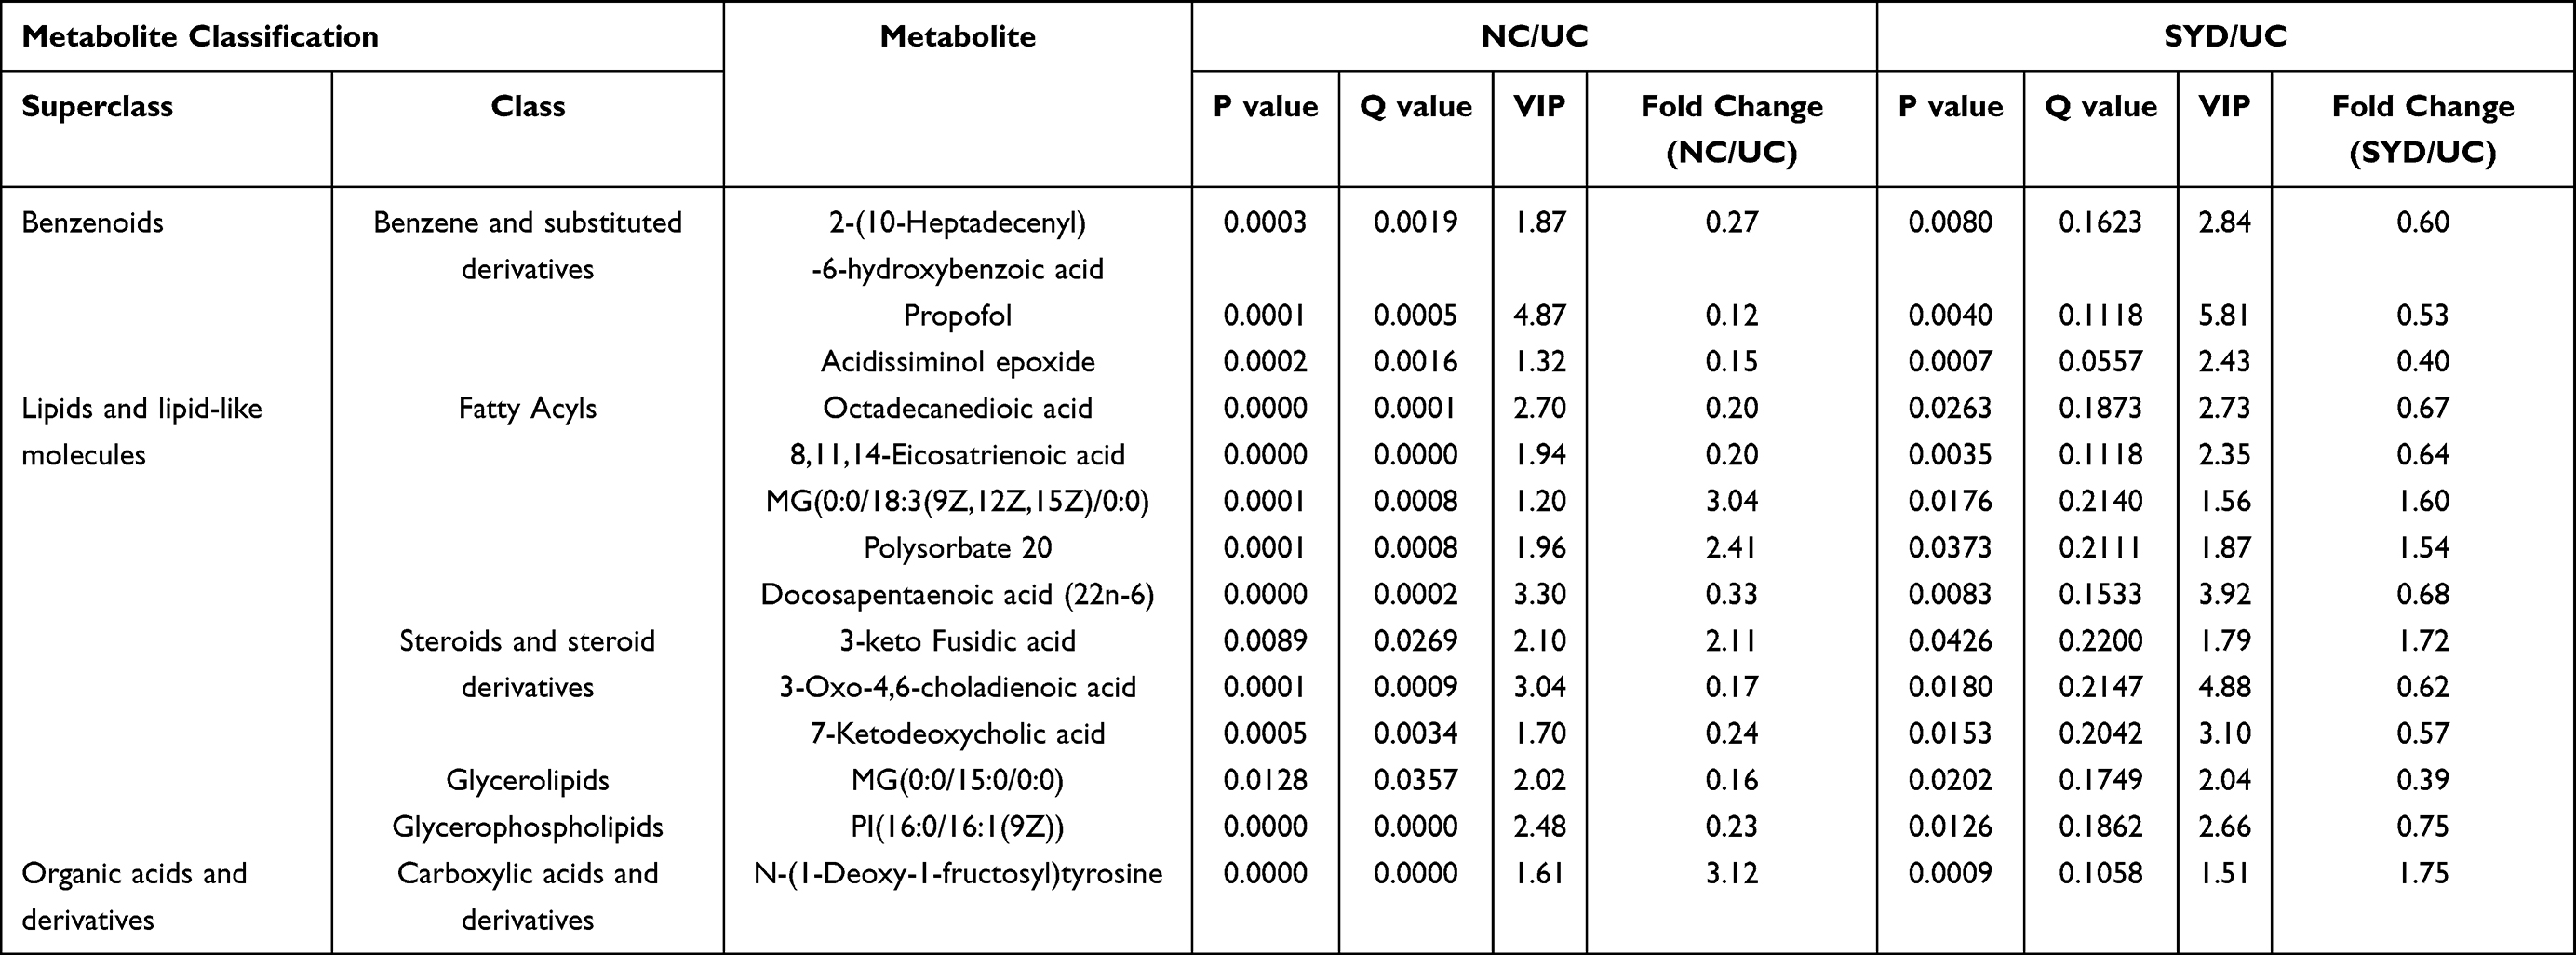 |
Table 10 Differential Metabolites in Serum Tissues |
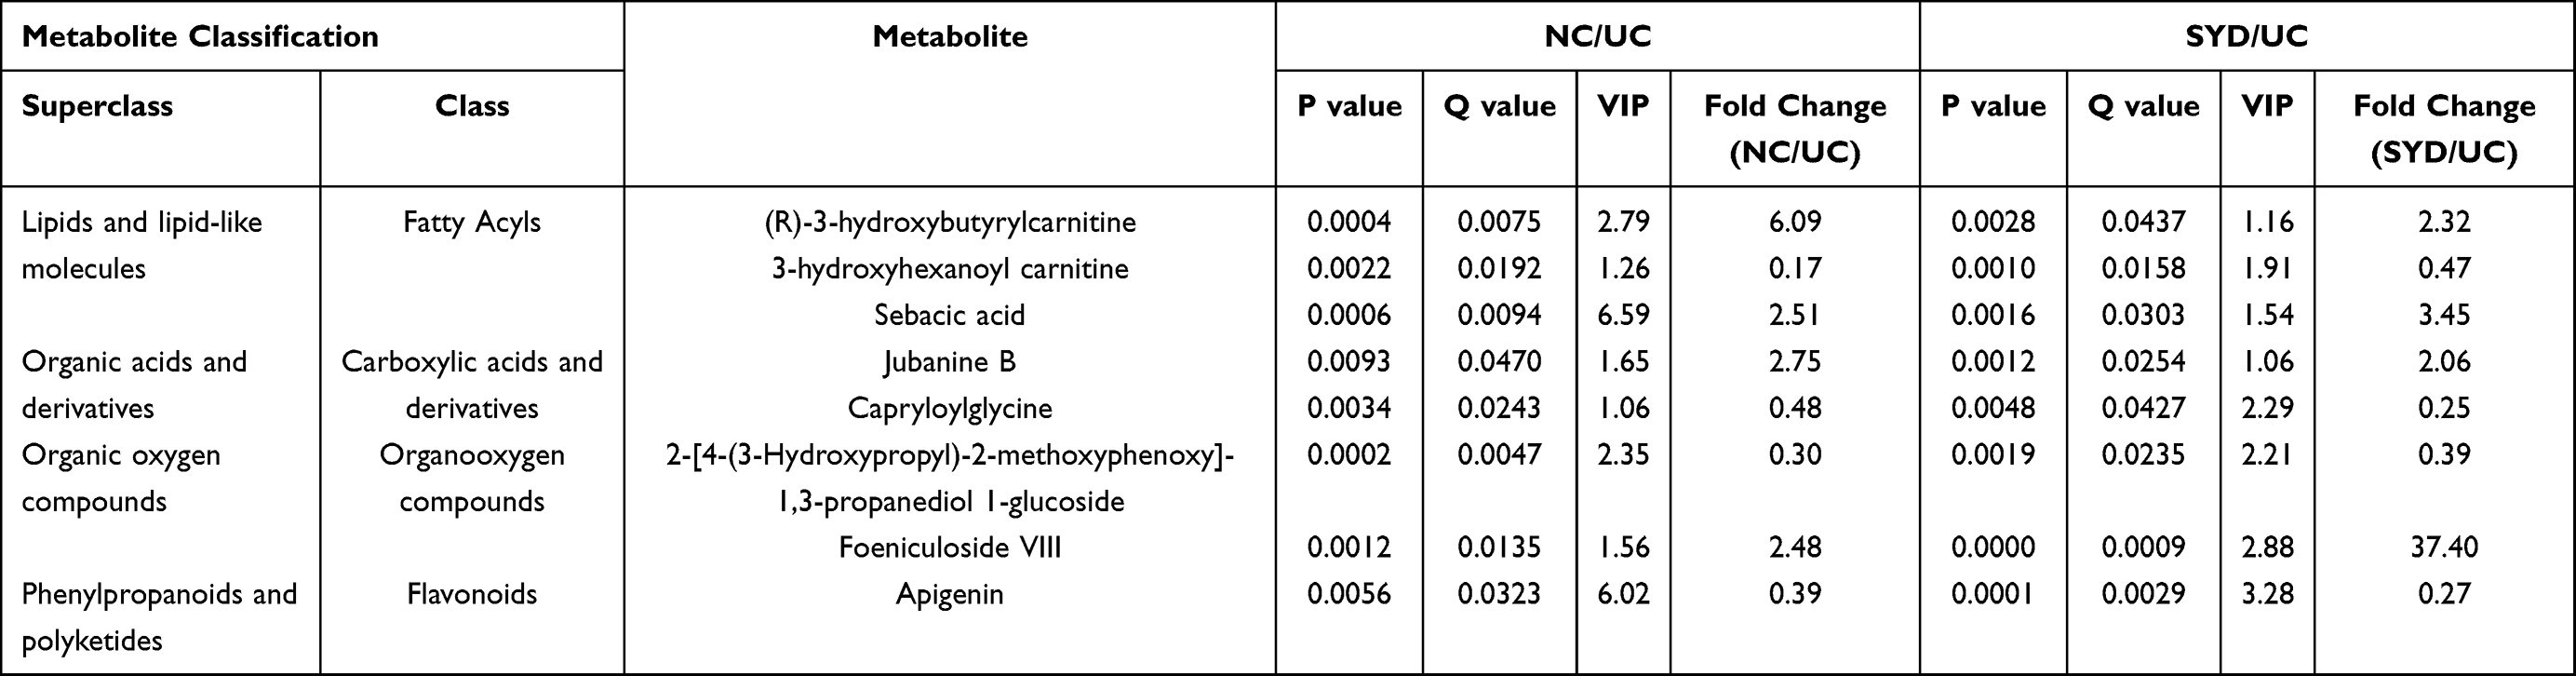 |
Table 11 Differential Metabolites in Urine Tissues |
 |
Table 12 Metabolic Pathways of SYD During the Treatment of UC |
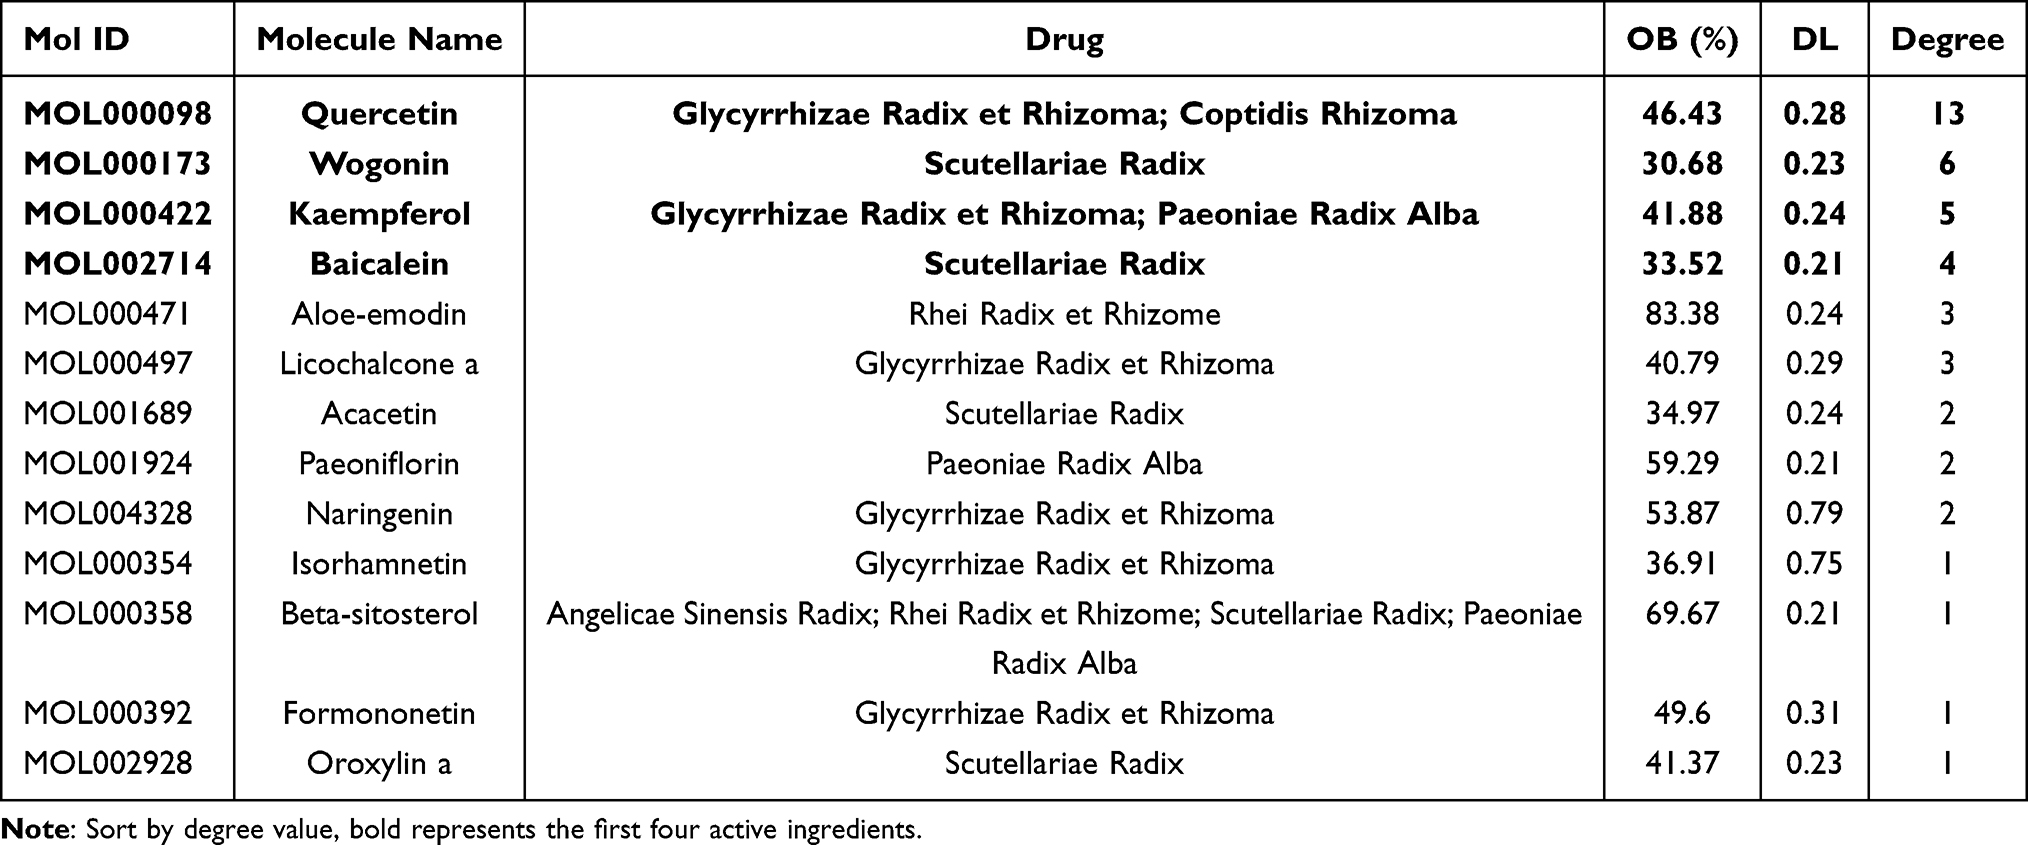 |
Table 13 Degree and Basic Information of 13 Active Components |
Evaluation of Hematoxylin-Eosin (H-E) Staining
The colon tissues were fixed in polyoxymethylene solution. After fixation, dehydration, paraffin infiltration and embedding, the sections were stained with H-E, and the histological score was calculated according to the degree of mucosal epithelial injury and inflammatory cell infiltration. The pathological scoring criteria are displayed in Table 2.9
Preparation of Samples
Part of the prepared SYD samples were centrifuged at 12000g for 10 minutes, the supernatant was diluted to 100mg/mL with methanol, sonicated for 15 minutes and centrifuged at 12000g for 10 minutes. Transfer the supernatant (80 μL) to autosampler vials for subsequent analysis, and repeated for 3 times.
Prior to analysis, 100 μL of each collected serum sample per group was thawed at 4℃, and subsequently aliquoted with 400 μL methanol to precipitate proteins. Stir the mixture ultrasonic for 15 minutes and centrifuge at 12,000 g for 10 minutes at 4℃. The supernatant (400 μL) was transferred to the EP tube and evaporated to dryness in a nitrogen stream at 4 ℃. Dissolve the residue with 100 μL methanol followed by vortexing for 60s and centrifuge at 12,000 g for 10 minutes. Transfer the supernatant (80 μL) to autosampler vials and run the instrument. Urine was processed in the same way as serum.
100mg of each fecal sample was collected and thawed at 4℃, extracted with 1mL methanol, sonicated for 15 minutes, and then was centrifuged at 12,000g for 10 minutes, and the supernatant was obtained for UPLC-Q-TOF-MS analysis. The liver samples were ground into powder separately in liquid nitrogen, and 100mg of each sample was collected, following the same procedure as stool samples.
Standardization correction adopts the method of quality control (QC) sample standardization, and 10 μL of each prepared sample was mixed as QC samples.13 QC samples have the ability to display the signal offset law in the process of data acquisition, which is convenient to assess the constancy of the system in the whole process.
UHPLC-Q-TOF-MS Conditions
All samples were analyzed in both negative and positive mode on an ACQUITY UPLC HSS T3 column (100 mm × 2.1 mm, 1.8 µm; Waters Corporation, Ireland) at a flow rate of 0.3 mL/min, sample injection volume of 2.0 μL, the autosampler temperature of 4 ℃ and the column temperature of 40 ℃.
Mobile phase A was 0.1% (V/V) formic acid/water and mobile phase B was 0.1% (V/V) formic acid/acetonitrile. The linear gradient elution processes of SYD, fecal, liver, serum and urine samples were displayed in Tables 3 and 4. The mass spectrum conditions of SYD, fecal, liver, serum and urine samples in positive and negative modes, respectively, are shown in Table 5.
Before the start of the analysis, a blank sample was injected three times, after which a blank sample was injected every 8 times and a QC sample every 10 times. All samples were randomly sequenced.
Untargeted Metabolomics Analyses
All data were obtained on MassLynx V4.1 (Waters Corporation, Milford, MA, USA) software, and then imported into Progenesis QI V2.0 (Waters Corporation, Milford, MA, USA) software for data preprocessing, including baseline filtering, peak identification, integration, retention time correction, peak alignment and normalization. Furthermore, on the basis of accurate mass number, secondary fragments and isotopic distribution, the Human Metabolome Database (HMDB, http://www.HMDB.ca), Lipid Maps (http://www.lipidmaps.org), NIST (https://www.nist.gov/) and ChemSpider (http://www.chemspider.com/) were used to speculate and identify the compounds.
Later, import the data stabilized as normal distributions (Figures S1 and S2)13 into SIMCA-p14.1 software, select pareto scaling for multivariate statistical analysis, including Principal Component Analysis (PCA), Partial Least Squares Discriminant Analysis (PLS-DA) and Orthogonal Partial Least Squares Discriminant Analysis (OPLS-DA). The quality of PLS-DA and OPLS-DA models were assessed by 10-fold cross-validation, analysis of variance of the cross-validated residuals (CV-ANOVA), 200 permutation tests and Q2 value.
Differential metabolites were screened by the combination of univariate analysis and multivariate analysis. Metabolites with variable importance in the projection (VIP) >1 in OPLS-DA analysis and q-value less than 0.05 in two sample t-test followed by false discovery rate (FDR) were selected as the differential compounds between the two groups. Furthermore, metabolites with fold-change (FC) >2 or FC <0.5 were selected from the above differential metabolites as significantly differential metabolites in this study. Receiver operating characteristics (ROC) curves were applied to verify the accuracy of potential biomarkers.
These significantly altered metabolites were analyzed by MetaboAnalyst 5.0 (http://www.metaboanalyst.ca/)19 for pathway analysis.20,21
Network Pharmacology Analysis
In the three databases of the gene map of the Online Mendelian Inheritance in Man (OMIM, https://OMIM.org/), Therapeutic Target Database (http://db.idrblab.net/TTD/) and GeneCards (https://www.genecards.org/, score>20), “ulcerative colitis” was used as the search term to screen candidate targets.
Through Traditional Chinese Medicine Systems Pharmacology (TCMSP, https://tcmspw.com/tcmsp.php) database, take the names of various traditional Chinese medicines in SYD as the search words, drug‐like properties (DL) ≥0.18 and oral availability (OB) ≥30% as the screening conditions to screen the effective components of every traditional Chinese medicines.22 The predicted targets of the screened compounds were acquired from the DrugBank (https://www.drugbank.ca/) database and verified literature.7 After summarizing the targets, import them into UniProt database (https://www.uniprot.org/) to standardize the names of genes and proteins.
Combine UC-related targets with SYD-related targets in Venny (htttps://bioinfogp.cnb.csic.es/tools/venny/), choose the intersection genes as the key genes. In addition, use STRING 11.5 (https://STRING-db.org/) and Cytoscape 3.8.2 to structure the protein–protein interaction (PPI) network. At the same time, the relevant active components were screened by using the intersection target, the active component-target network was drawn by Cytoscape, and the connection number between each node was calculated by NetworkAnalyzer, an analytical tool in Cytoscape. Gene Ontology (GO) and Kyoto Encyclopedia of Genes and Genomes (KEGG) were ran by R 4.1.0.
The identified metabolomic differential metabolites and targets were introduced into Integrated Molecular Pathway Level Analysis (IMPaLA, http://impala.molgen.mpg.de/) and Cytoscape, then a compound-pathway-target network was constructed to manifest the interaction between metabolites, pathways and genes.23
Molecular Docking
Through the active component-target network, the four active ingredients with the largest degree were selected as the ligands for molecular docking, and the three-dimensional structures of these active ingredients were obtained in PubChem (https://www.ncbi.nlm.nih.gov/). The crystal structures of targets were acquired from the RCSB Protein Data Bank (https://www.rcsb.org/). Altogether five targets were selected in this study, containing AKT1 (PDB ID: 1h10), IL1B (PDB ID: 2nvh), IL2 (PDB ID: 1m48), IL6 (PDB ID: 4ni9) and STAT3 (PDB ID: 6njs).
First of all, active ingredients were converted to pbdqt format using The Open Babel GUI 3.1.1 and AutoDockTools 1.5.7. Next, the target protein was imported into Pymol 2.5.2 and AutoDockTools for structural optimization, including removal of water molecules, removal of small molecule ligands, and addition of hydrogen atoms and charges. Then, molecular docking was performed using Autodock Vina, and the docking parameters are indicated in Table 6. Finally, the highest scoring docking results were visualized in Pymol.24
Immunohistochemistry
Colon tissue was taken to make paraffin sections (4um) for immunohistochemical staining. After deparaffinization to water, the sections were repaired by microwave in citrate buffer (10mM citric acid, pH6.0). The sections were cooled naturally and then transferred to Tris buffered saline (TBS; pH 7.4). Endogenous peroxidase activity was then blocked by treatment with 3% hydrogen peroxide for 20 minutes and incubated with 5% BSA at room temperature for 30 minutes. Next, the sections were treated with p-PI3K (YP0224, dilution ratio of 1:100, immunology), p-AKT (YP0864, dilution ratio of 1:100, immunology), p-mTOR (YP0176, dilution ratio of 1:200, immunology) overnight at 4℃, respectively, and the next day with HRP*Goat Anti Rabbit IgG (H+L) (RS0002, dilution ratio of 1:500, immunology) for 1 hour at room temperature. Finally, color was developed with DAB and counterstained with hematoxylin.25,26
Statistical Analysis
All data were analyzed by SPSS 21.0 statistical software (IBM, USA). Two sample t-test was used for the comparison between the two groups and one-way analysis of variance (ANOVA) was used for the comparison between the three groups followed by a least significant difference (LSD) test. Kruskal–Wallis statistical test was used for the data of skew distribution, and Bonferroni method was used to correct the p-value. The p-value less than 0.05 was considered statistically significant.
Results
Components Analysis of SYD
For the purpose of identifying the main chemical components of SYD, the samples were analyzed by UPLC-Q-TOF-MS. The total ion chromatograms (TIC) of SYD sample in positive and negative modes demonstrated the chemical composition of all compounds.27 The results manifested that SYD contains an ocean of components. As shown in Figure 2, the 12 compounds were distinguished: arecoline, trans-ferulic acid, baicalin, glycyrrhizin, gallic acid, liquiritin, berberine, chlorogenic acid, licoisoflavone A, quercetin, formononetin and kaempferol.
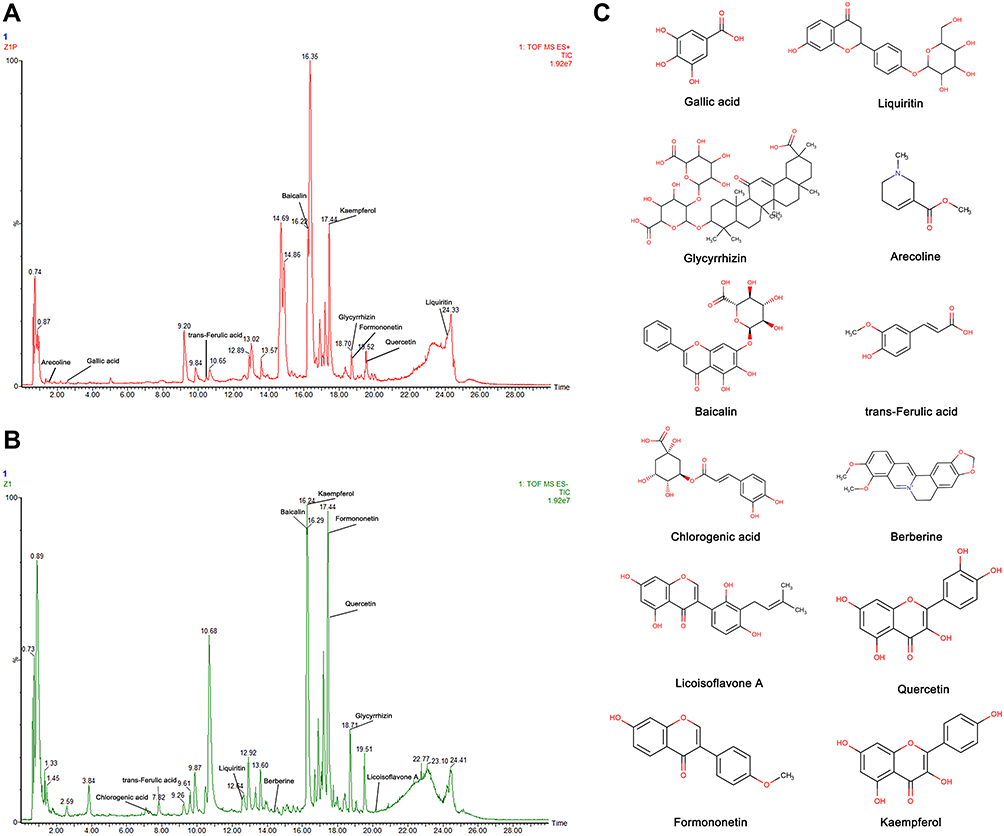 |
Figure 2 Identification of chemical components of SYD. SYD samples were examined by UPLC-Q-TOF-MS. Total ion chromatography (TIC) in positive (A) and negative (B) modes for SYD samples are shown. (C) Molecular structure of compounds. |
The Effect of SYD on DSS-Induced UC
The weight of DSS-induced UC mice decreased significantly from the day 4 (P-value < 0.001). After SYD treatment, the weight loss trend of mice was slightly improved (Figure 3A). In addition, the DAI score (Figure 3B) in the model group was significantly higher than normal group and SYD group (P-value < 0.05), and the colon length (Figure 3C and D) in the model group was significantly shorter than that in the normal group and SYD group (P-value < 0.05), accompanied by a certain degree of edema.
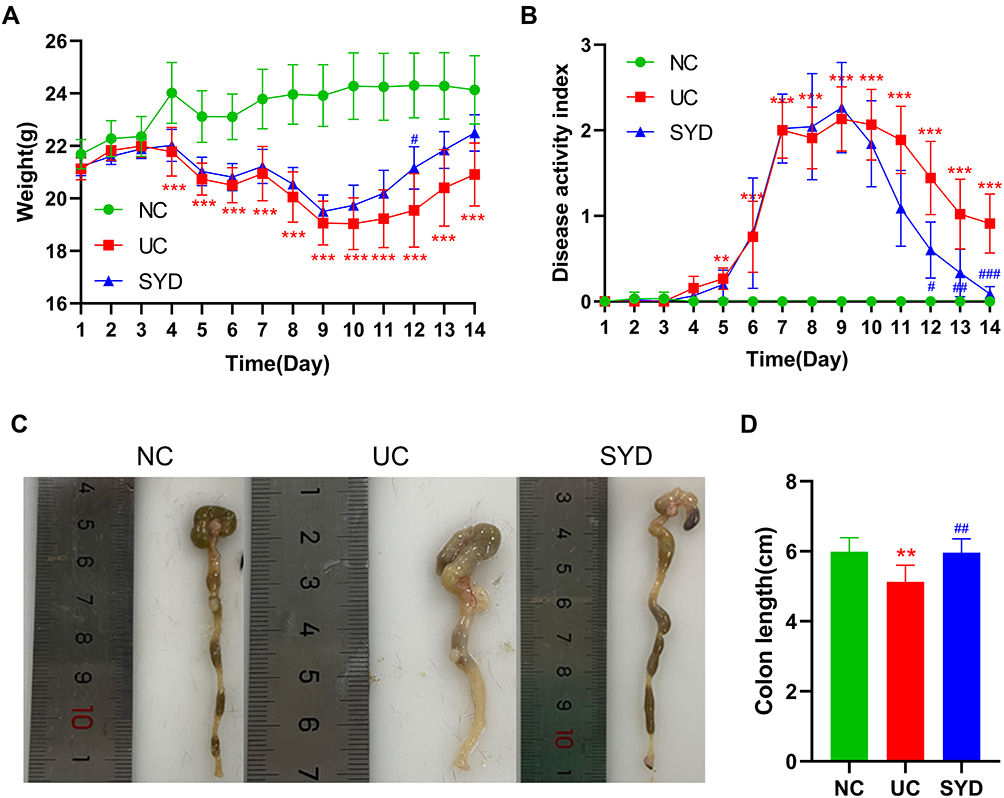 |
Figure 3 SYD ameliorated UC mice induced by DSS. (A) Body weight change. (B) Disease activity index. (C) Colon length. (D) Representative colon images from each group. **p<0.01, ***p<0.001, compared to normal group; #p<0.05, ##p<0.01, ###p<0.001, compared to model group. |
The results of H-E staining (Figure 4A) displayed that inflammatory cell infiltration and crypt loss or deformation appeared in the colon tissue of the model group, and the pathological injury score (Figure 4B) of the model group was significantly higher than that of the normal group (P-value < 0.05). The related symptoms in the colon of SYD mice were alleviated compared with the model group (P-value < 0.05).
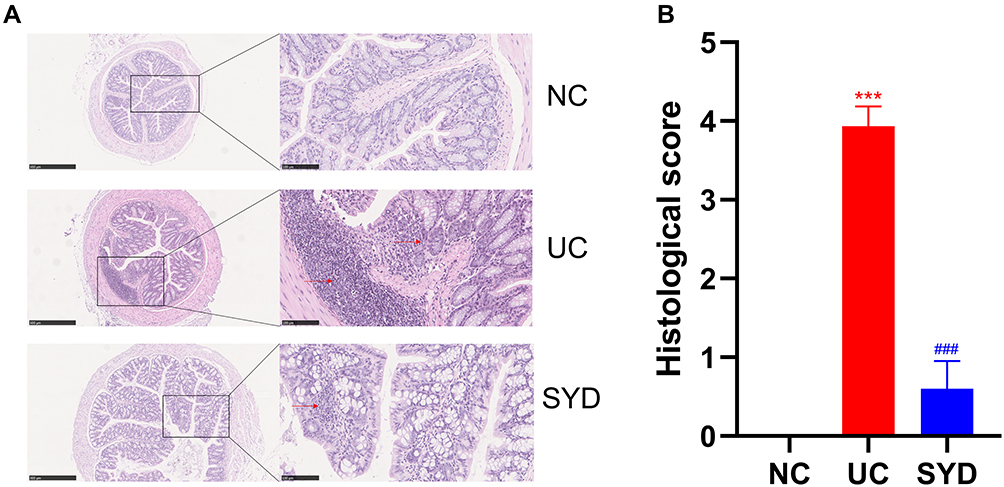 |
Figure 4 Histopathological changes. (A) H-E staining images of colonic tissues in normal group, model group and SYD group. Arrows refer to more inflammatory cell infiltration and crypt loss. (B) Histological score. ***p<0.001, compared to normal group; ###p<0.001, compared to model group. |
Taken together, SYD is capable of effectively treating UC in mice and improve the symptoms of UC related bloody stool and mucosal damage.
Untargeted LC-MS-Based Metabolomic Analysis of Fecal, Liver, Serum and Urine Samples of Mice After SYD Treatment
After sample collection, untargeted metabolomics analysis was conducted on fecal, liver, serum and urine samples, respectively, by LC-MS in both positive and negative ion mode. Subsequently, 15838, 7853, 11534, 9088 features were detected in positive ion mode, as well as 13435, 8601, 5452, 11682 features in negative ion mode, respectively.
Figure 5 shows that the change trend of fecal samples on Day 0, Day 7, Day 10, and Day 14 was consistent with each node of this experiment. Before modeling (Day 0, Figure 5A and E), the PCA images of the three groups were clustered together without obvious separation; after modeling (Day 7, Figure 5B and F) and during the SYD treatment (Day 10, Figure 5C and G), the UC group and the SYD group gradually separated, and they were obviously separated from the NC group. After treatment (Day 14, Figure 5D and H), the three groups were well separated, suggesting that there were significant differences in metabolites among the three groups.
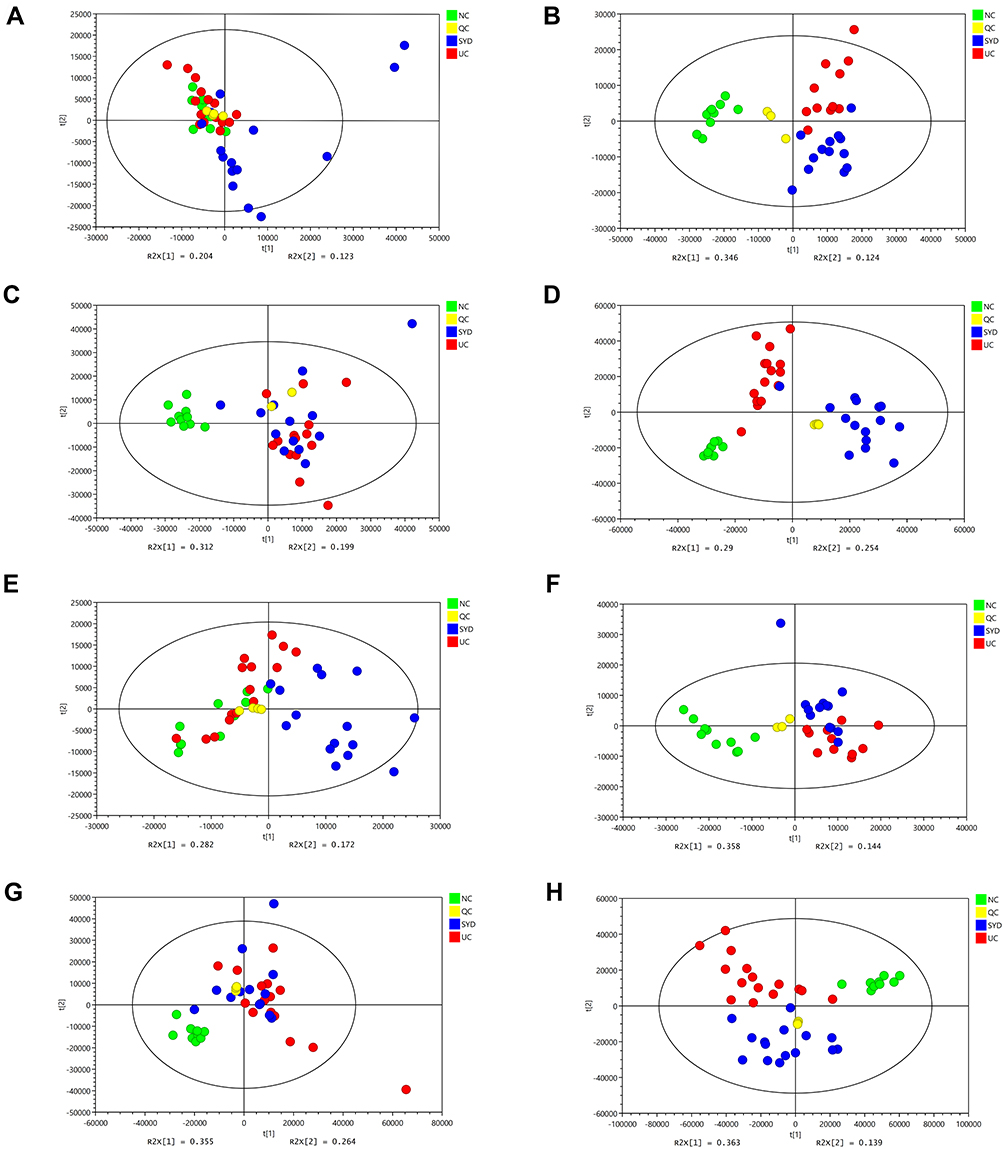 |
Figure 5 PCA score plots of feces metabolic profiling between normal, model and SYD group during the day 0, day 7, day 10 and day 14. (A) Fecal samples collected in the day 0 in positive mode. (B) Fecal samples collected in the day 7 in positive mode. (C) Fecal samples collected in the day 10 in positive mode. (D) Fecal samples collected in the day 14 in positive mode. (E) Fecal samples collected in the day 0 in negative mode. (F) Fecal samples collected in the day 7 in negative mode. (G) Fecal samples collected in the day 10 in negative mode. (H) Fecal samples collected in the day 14 in negative mode. |
Surprisingly, our experimental results showed that Day 7 (Figure 5B and F) had better between-group separation than Day 10 (Figure 5C and G). As far as we are concerned, it may be because ulcerative colitis tends to heal on its own. On the Day 7 (Figure 5B and F), the content of some metabolites in the feces of ulcerative colitis mice had begun to turn to normal, with similar changes with the Day 10 (Figure 5C and G), resulting in a less obvious separation trend on the 10th day. However, on the Day 14 (Figure 5D and H), the therapeutic effect of the SYD exceeded the self-healing effect of ulcerative colitis, leading to a very obvious separation trend.
QC samples were used to evaluate the stability and reproducibility of metabolomics, and the results revealed that the instrument had high stability and the method was reproducible. Simultaneously, the PCA images of the SYD group at Day 0, Day 7, Day 10 and Day 14 (Figure 6) indicated that the samples at the four time points were well separated as well.
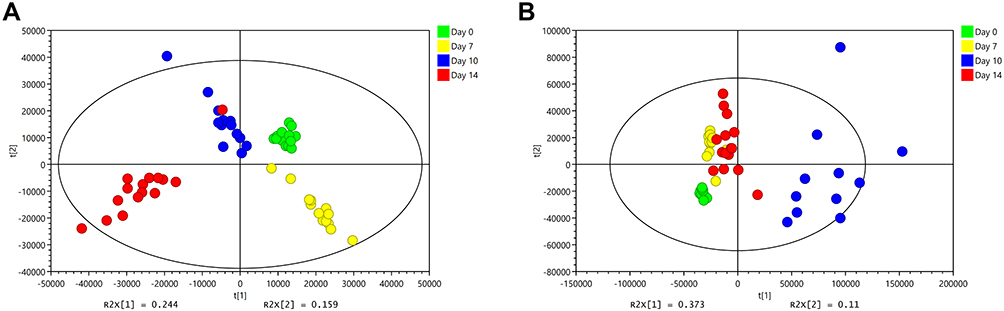 |
Figure 6 PCA score plots of feces metabolic profiling in SYD group during the day before the experiment, day 7, day 10 and day 14. (A) Fecal samples of SYD group detected in positive mode. (B) Fecal samples of SYD group detected in negative mode. |
The PCA plots (Figure 7) show that the serum samples in positive ion mode, liver and urine samples in each group can be separated, suggesting that the metabolites in the above tissues in UC mice were different from those in normal tissues and can be regulated by SYD. It can be seen in the figure that most of the QCs were clustered together, indicating that the instrument ran stably and the data was reliable during the analysis process, and the differences in the metabolic profiles obtained in the experiment can reflect the biological differences between the samples. It is worth noting that the three groups of PCA plots in serum negative ion mode did not manifest a clear separation trend. Figure S3 indicates the representative TIC plots of each group, respectively. These results indicated that the endogenous metabolic spectrum of serum, urine, feces and liver in mice with ulcerative colitis has significantly changed compared with that of normal mice, and has obvious changes after SYD treatment.24
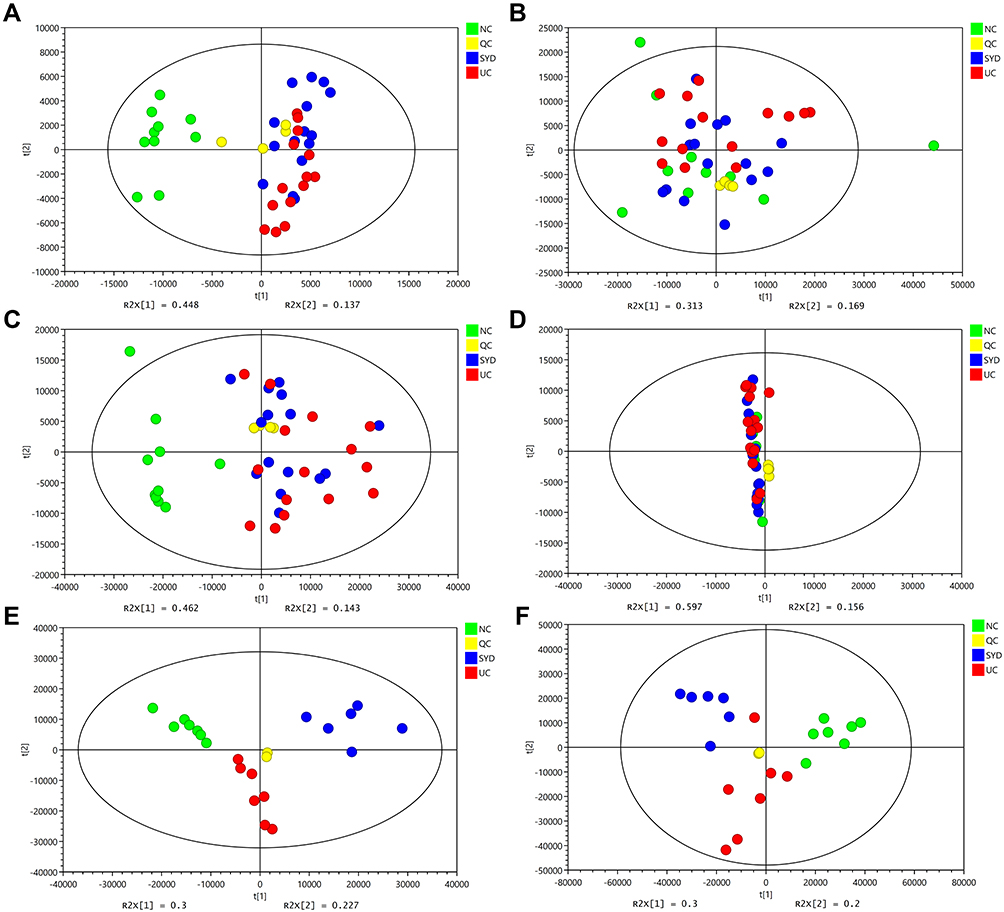 |
Figure 7 PCA score plots of livers, serum and urine metabolic profiling between normal, model and SYD group. (A) Liver samples detected in positive mode. (B) Liver samples detected in negative mode. (C) Serum samples detected in positive mode. (D) Serum samples in negative mode. (E) Urine samples detected in positive mode. (F) Urine samples detected in negative mode. |
A supervised multivariate statistical analysis was performed using OPLS-DA plot to screen for differential metabolites. In the OPLS-DA diagrams of most samples, there was a clear separation between NC group and UC group, as well as UC group and SYD group (Figures 8–11). P-value was tested with the CV-ANOVA method. The PLS-DA plots are shown in Figures S4–S7.
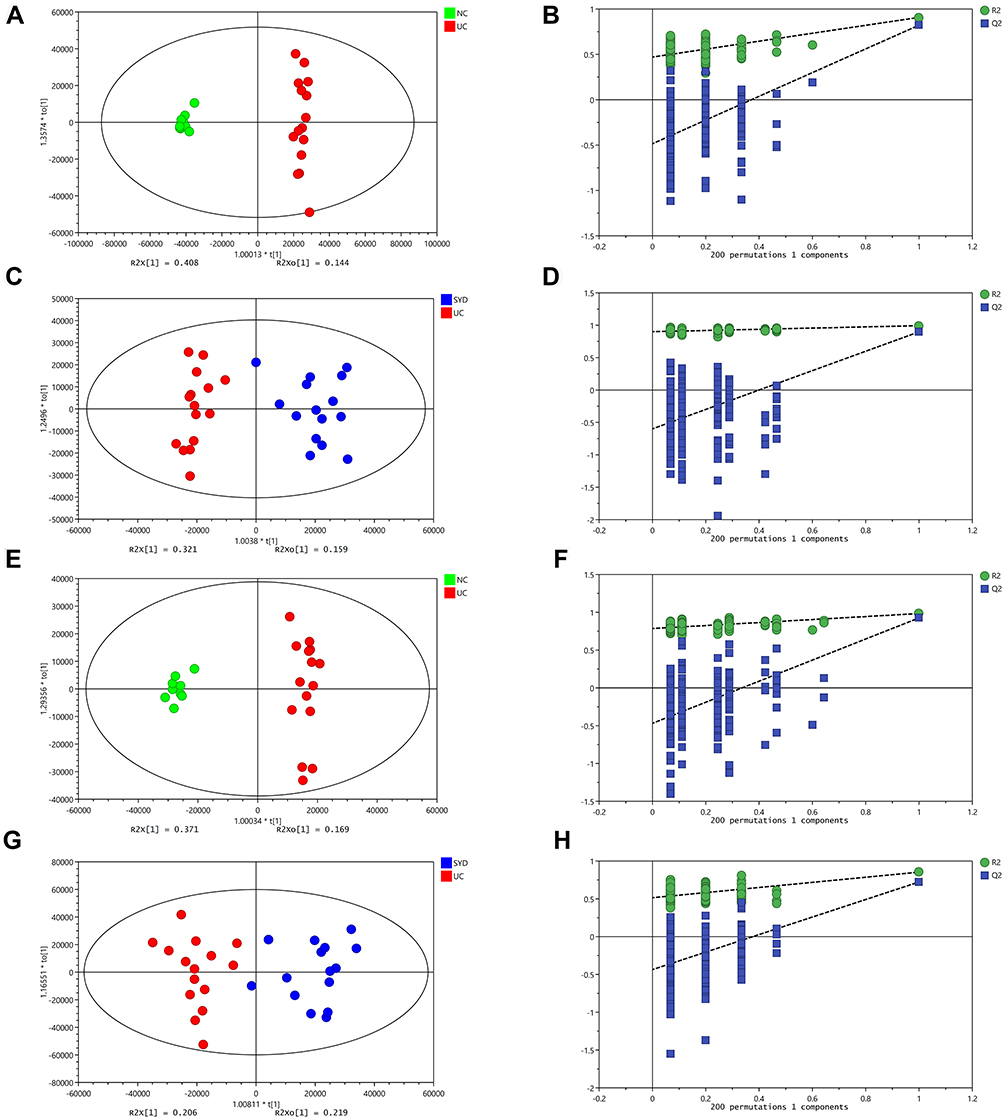 |
Figure 8 Metabolite changes in fecal samples. (A and B) OPLS‐DA plot of the normal and model groups in positive mode. (C and D) OPLS‐DA plot of the SYD and model groups in positive mode. (E and F) OPLS‐DA plot of the normal and model groups in negative mode. (G and H) OPLS‐DA plot of the SYD and model groups in negative mode. (B, D, F and H) Validation of the corresponding OPLS‐DA model by the 200‐time permutation test. |
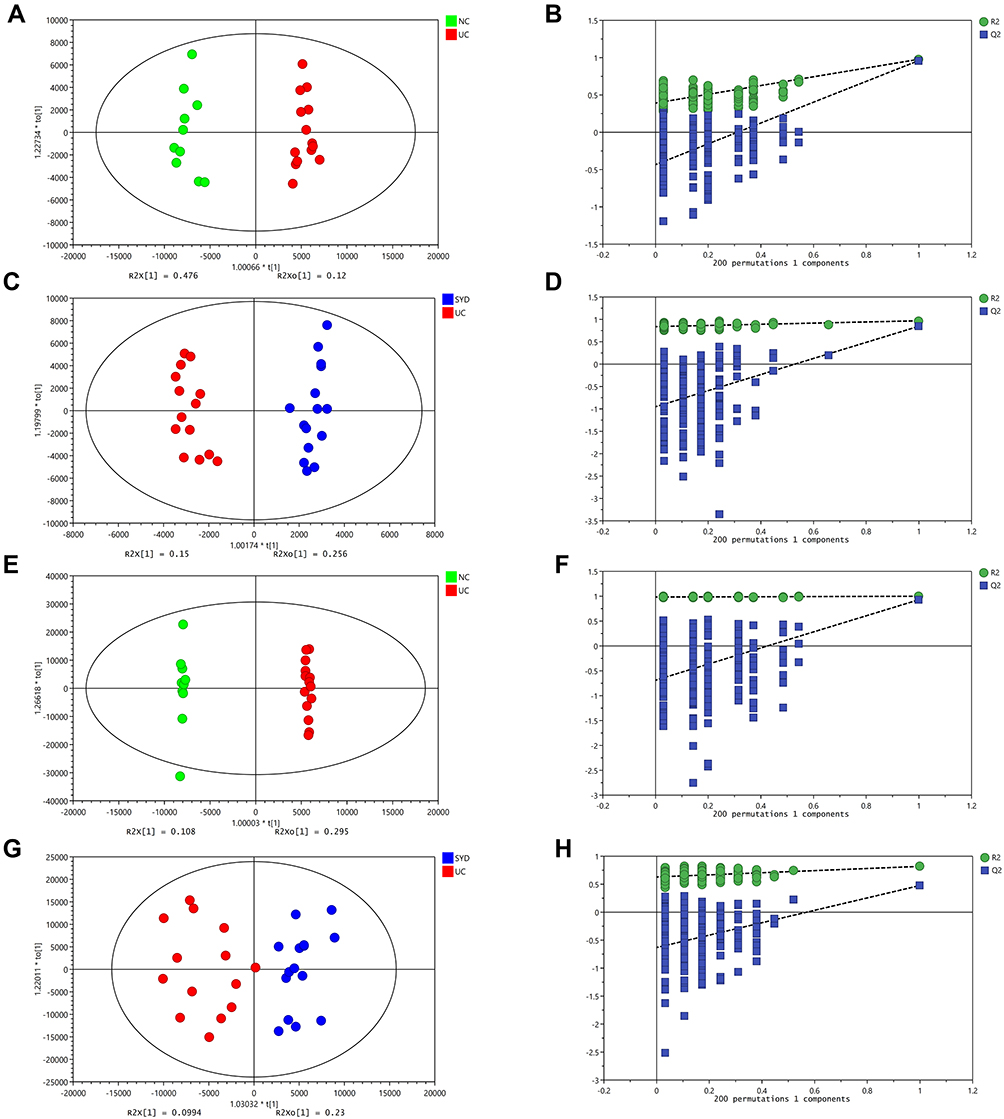 |
Figure 9 Metabolite changes in liver tissues. (A and B) OPLS‐DA plot of the normal and model groups in positive mode. (C and D) OPLS‐DA plot of the SYD and model groups in positive mode. (E and F) OPLS‐DA plot of the normal and model groups in negative mode. (G and H) OPLS‐DA plot of the SYD and model groups in negative mode. (B, D, F and H) Validation of the corresponding OPLS‐DA model by the 200‐time permutation test. |
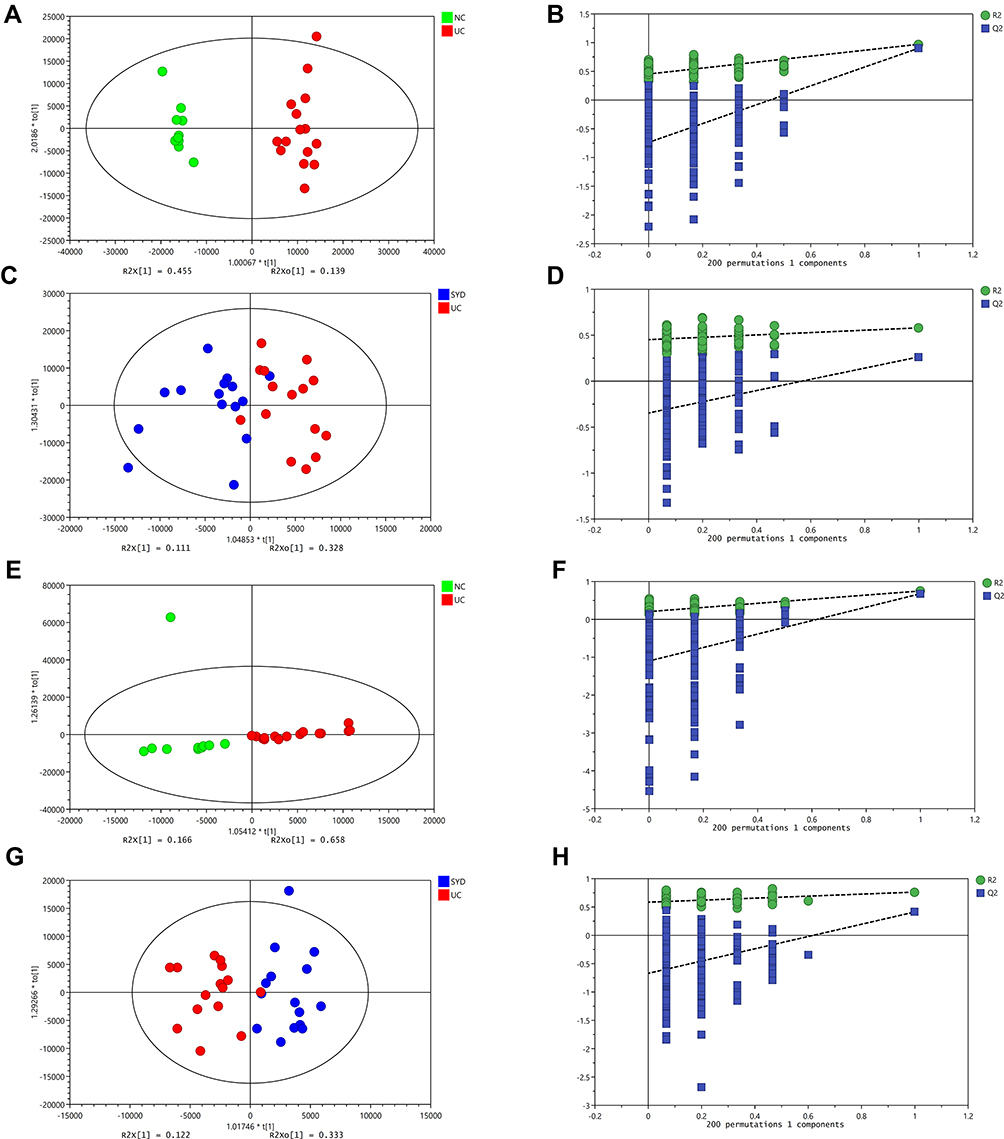 |
Figure 10 Changes in sera metabolites. (A and B) OPLS‐DA plot of the normal and model groups in positive mode. (C and D) OPLS‐DA plot of the SYD and model groups in positive mode. (E and F) OPLS‐DA plot of the normal and model groups in negative mode. (G and H) OPLS‐DA plot of the SYD and model groups in negative mode. (B, D, F and H) Validation of the corresponding OPLS‐DA model by the 200‐time permutation test. |
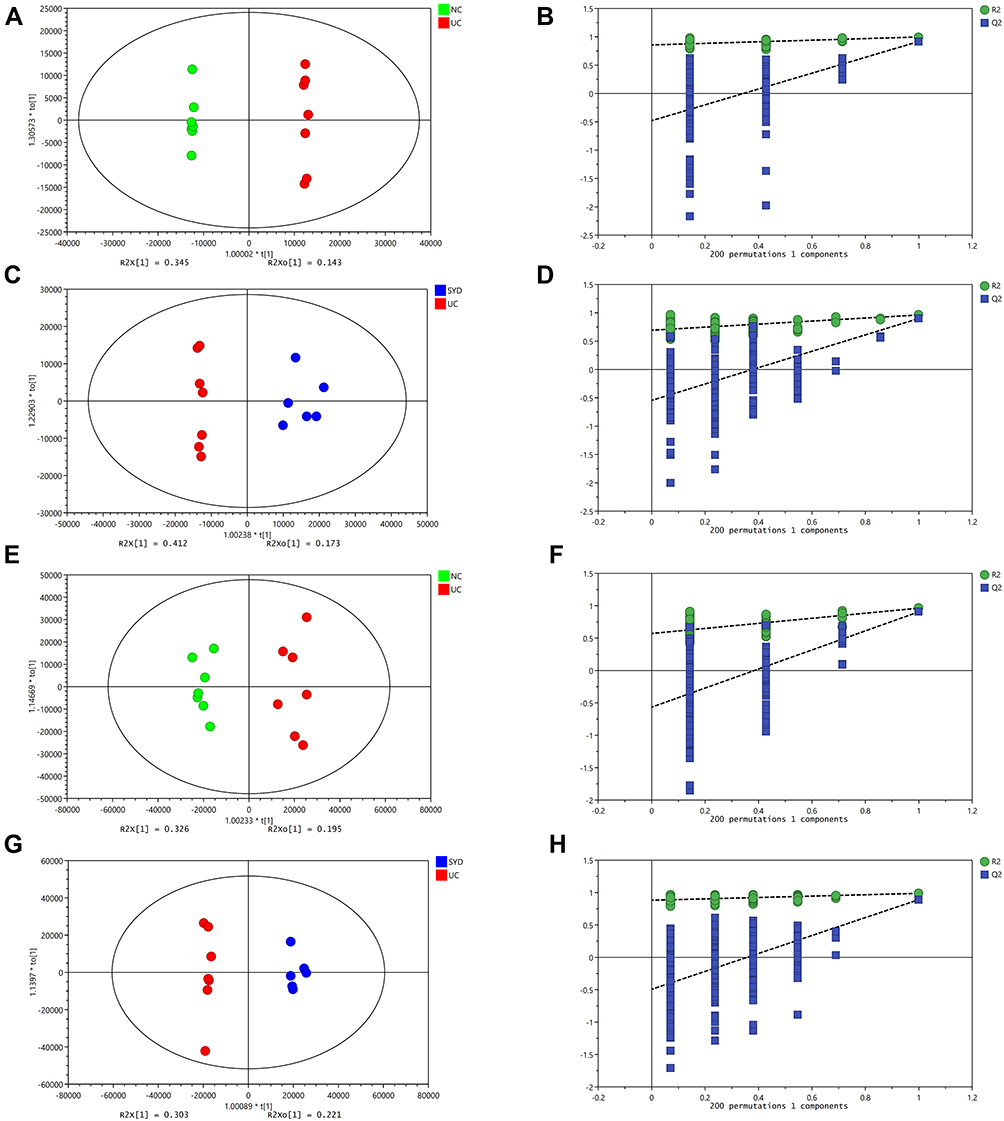 |
Figure 11 Changes in urine metabolites. (A and B) OPLS‐DA plot of the normal and model groups in positive mode. (C and D) OPLS‐DA plot of the SYD and model groups in positive mode. (E and F) OPLS‐DA plot of the normal and model groups in negative mode. (G and H) OPLS‐DA plot of the SYD and model groups in negative mode. (B, D, F and H) Validation of the corresponding OPLS‐DA model by the 200‐time permutation test. |
From Table 7, P-value was less than 0.05 in most of the models, demonstrating that the model is valid. However, the P value of the serum samples of the SYD group vs UC group was more than 0.05 in the positive ion mode in both PLS-DA model and OPLS-DA model, which may be due to the fact that the sample size was so small as to reduce the test efficiency. It can be known from the 200 permutation tests that the R2 and Q2 values of different groups (Table 7) demonstrated that the PLS-DA model and the OPLS-DA model were not overfitted, and the results had high accuracy, indicating that this analysis was reliable and effective.
Next, in order to dig out the different metabolites in each tissue, we combined the positive and negative ion mode to analyze each sample separately.
A total of 124 metabolites with significant difference (VIP>1, Q-value<0.05, FC(NC/UC)>2 or <0.5, Table S1) were found in fecal samples between NC group and UC group, among which 58 metabolites were up-regulated (FC(NC/UC)<0.5) and 66 metabolites were down-regulated (FC(NC/UC)>2). These altered metabolites were subjected to pathway analysis in MetaboAnalyst (Figure 12A, Table 8), based on impact>0.1, we discovered that 2 metabolic pathways were significantly affected, including glycerophospholipid metabolism and sphingolipid metabolism.
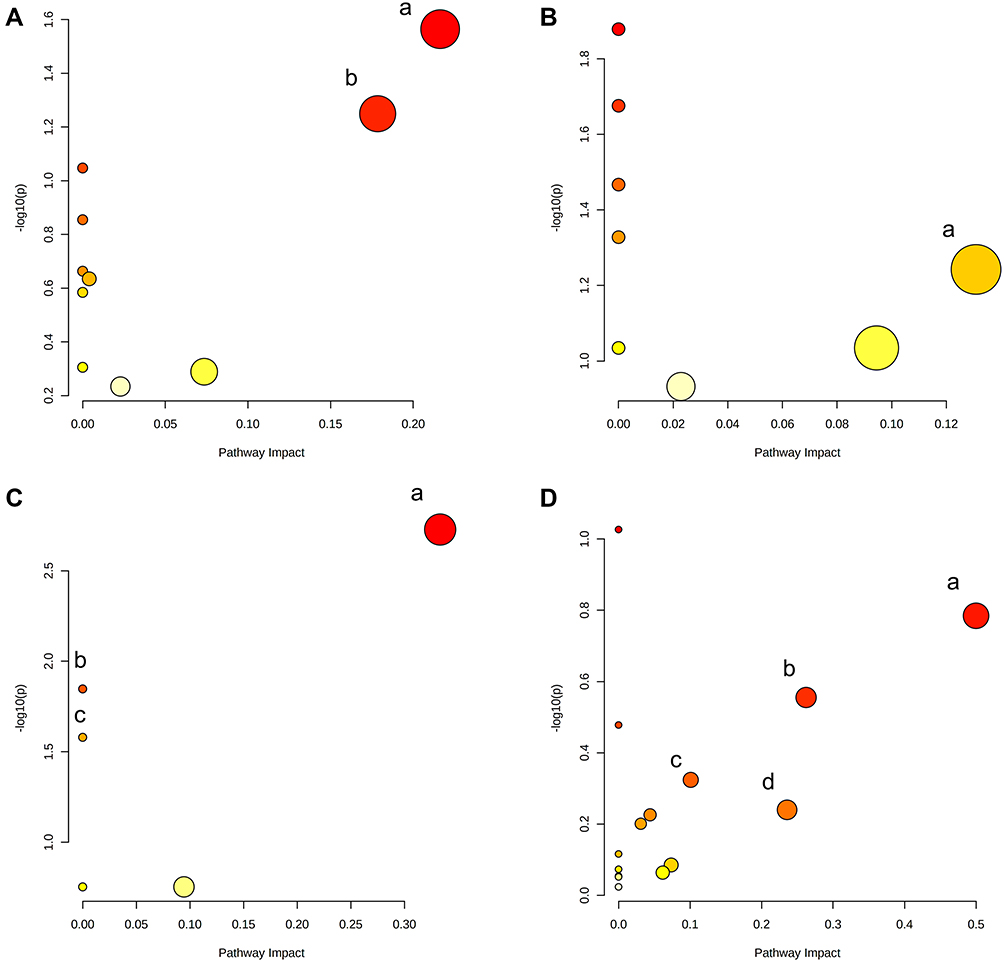 |
Figure 12 Summary of pathway analysis of differentially expressed metabolites in feces (A), livers (B), serum (C) and urine (D). (A) a-Glycerophospholipid metabolism; b-Sphingolipid metabolism. (B) a-Pentose phosphate pathway. (C) a-alpha-Linolenic acid metabolism; b-biosynthesis of unsaturated fatty acids (P<0.05); c-linoleic acid metabolism (P<0.05). (D) a-Phenylalanine, tyrosine and tryptophan biosynthesis; b-Tyrosine metabolism; c-Arachidonic acid metabolism; d-Pantothenate and CoA biosynthesis. |
There were 59 significantly different metabolites (VIP>1, Q-value<0.05, FC(SYD/UC)>2 or <0.5) in fecal samples between UC group and SYD group, of which 17 were up-regulated (FC(SYD/ UC)>2), 42 down-regulated (FC(SYD/UC)<0.5).
By comparing the fecal differential metabolites between the NC/UC and the SYD/UC, 46 metabolites were found to be common to these groups, of which 24 were first up-regulated (FC(NC/UC)<0.5) and then down-regulated (FC(SYD/UC)<0.5). Four metabolites were first down-regulated (FC(NC/UC)>2) and then up-regulated (FC(SYD/UC)>2). At the same time, among the 124 differential metabolites in NC/UC, 11 metabolites had FC(SYD/UC) between 0.5 and 2, and 10 metabolites had the same trend as NC group. It was suggested that these metabolites also had the potential to play a role in SYD therapy.
Majority (65.8%) of these 38 differential metabolites (Table 9) belonged to lipids and lipid-like molecules, and a heat map (Figure 13A) was used to visualize the changes of these metabolites. The metabolic profiles of most candidate metabolites were reversed in SYD group, suggesting that SYD can alleviate metabolic disorders, and this effect was mainly through the down-regulation of metabolites.
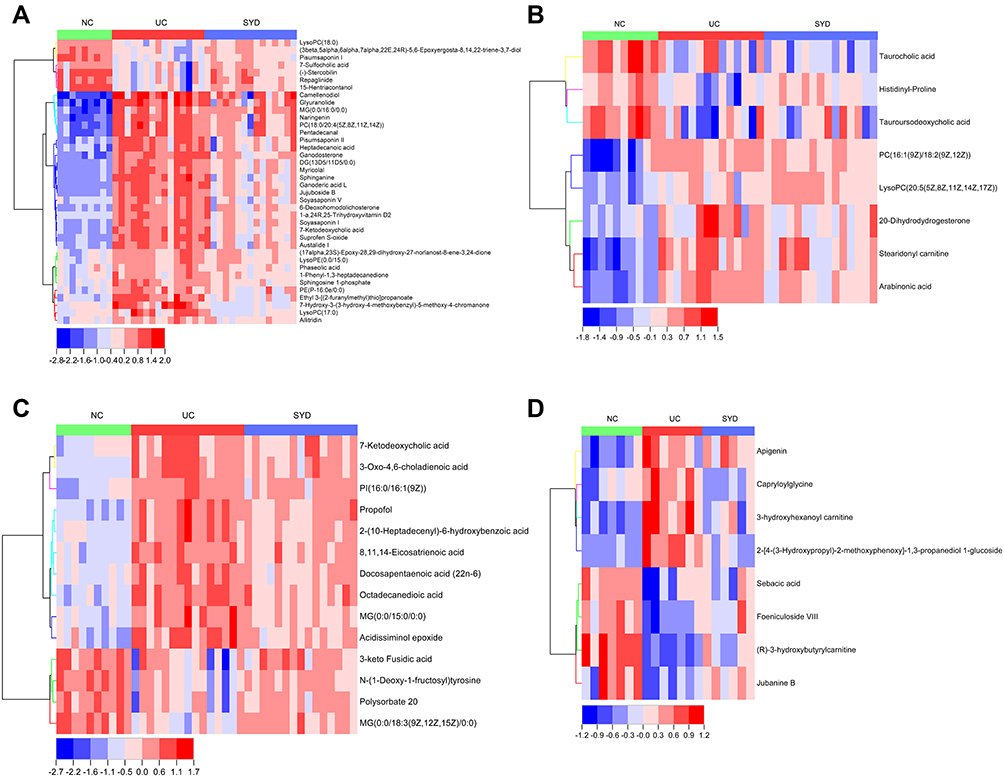 |
Figure 13 The heat maps of the results of differential metabolites in feces (A), livers (B), serum (C), and urine (D) analyzed by untargeted metabolomics with UPLC-Q-TOF-MS. |
The main metabolites related to pathways were
PC(18:0/20:4(5Z,8Z,11Z,14Z)), sphingosine 1-phosphate (S1P) and sphinganine, whose contents were all down-regulated after SYD treatment. PC(18:0/20:4(5Z,8Z,11Z,14Z)) was related to glycerophospholipid metabolism, linoleic acid metabolism, α-linolenic acid metabolism and arachidonic acid metabolism, while S1P and sphinganine were involved in sphingolipid metabolism.
In liver samples, 8 significantly different metabolites were observed between NC and UC groups (VIP>1, Q-value<0.05, FC(NC/UC)>2 or <0.5, Table S2, Table 10), 5 were up-regulated and 3 were down-regulated. The heat map was displayed in Figure 13B. Pathway analysis (Figure 12B, Table 8) indicated that these differential metabolites mainly affected pentose phosphate pathway (impact>0.1). Two of the above metabolites were reversed (VIP>1, Q-value<0.05) after SYD therapy. Among them, PC(16:1(9Z)/18:2(9Z,12Z)) belonged to glycerophospholipids in lipids and lipid-like molecules, mainly related to linoleic acid metabolism, α-linolenic acid metabolism, arachidonic acid metabolism and glycerol phospholipid metabolism.
In serum samples, there were 26 significantly different metabolites between NC group and UC group (VIP>1, Q-value<0.05, FC(NC/UC)>2 or <0.5, Table S3), of which 19 were up-regulated and 7 were down-regulated. Pathway analysis (Figure 12C, Table 8) revealed that these differential metabolites mainly affected α-linolenic acid metabolism (impact>0.1, P<0.05), biosynthesis of unsaturated fatty acids (P<0.05) and linoleic acid metabolism (P<0.05). After SYD therapy, 14 of the above metabolites were reversed (VIP>1, P-value<0.05, Table 11), of which 10 were down-regulated (1 with FC(SYD/UC)<0.5), 4 were up-regulated. The heat map is shown in Figure 13C, and the vast majority (71.4%) of them belonged to lipids and lipid-like molecules. The metabolite related to the pathway was 8,11,14-Eicosatrienoic acid, which belonged to fatty acyls in lipids and lipid-like molecules, and mainly affects biosynthesis of unsaturated fatty acids.
In the urine samples, 244 metabolites (VIP>1, Q-value<0.05, FC(NC/UC)>2 or <0.5, Table S4) were significantly different between NC group and UC group, among which 82 were up-regulated and 162 were down-regulated. Pathway analysis (Figure 12, Table 8) indicates that, based on impact>0.1, a total of 4 metabolic pathways were significantly affected, involving phenylalanine, tyrosine and tryptophan biosynthesis, tyrosine metabolism, arachidonic acid and pantothenate and CoA biosynthesis.
There were 163 significantly different metabolites in UC group and SYD group (VIP>1, Q-value<0.05, FC(SYD/UC)>2 or <0.5), of which 155 were up-regulated (FC(SYD/UC)>2), 8 down-regulated (FC(SYD/UC)<0.5).
By comparing the significantly different metabolites between NC/UC and SYD/UC in the urine samples, 19 metabolites were found to be common to these groups, of which 4 were up-regulated first (FC(NC/UC)<0.5) and then down-regulated (FC(SYD/UC)<0.5), 4 metabolites were down-regulated first (FC(NC/UC)>2) and then up-regulated (FC(SYD/UC)>2). The heat map (Figure 13D) was applied to visualize the changes of these 8 metabolites, among which 3 belonged to lipids and lipid-like molecules, 4 belonged to organic acids and derivatives, and 1 belonged to phenylpropanoids and polyketides. Their specific information is displayed in Table 12. The sensitivity and specificity of the above differential metabolites were evaluated by ROC curve, and the area under curve (AUC) was calculated to test the accuracy of ROC diagnostic test results. When AUC ≥ 0.7, the metabolite had moderate or higher diagnostic value, and AUC ≥ 0.9 indicates that the metabolite has high diagnostic value. Figures 14 and 15 are the ROC curve analysis results and histograms of some differential metabolites.
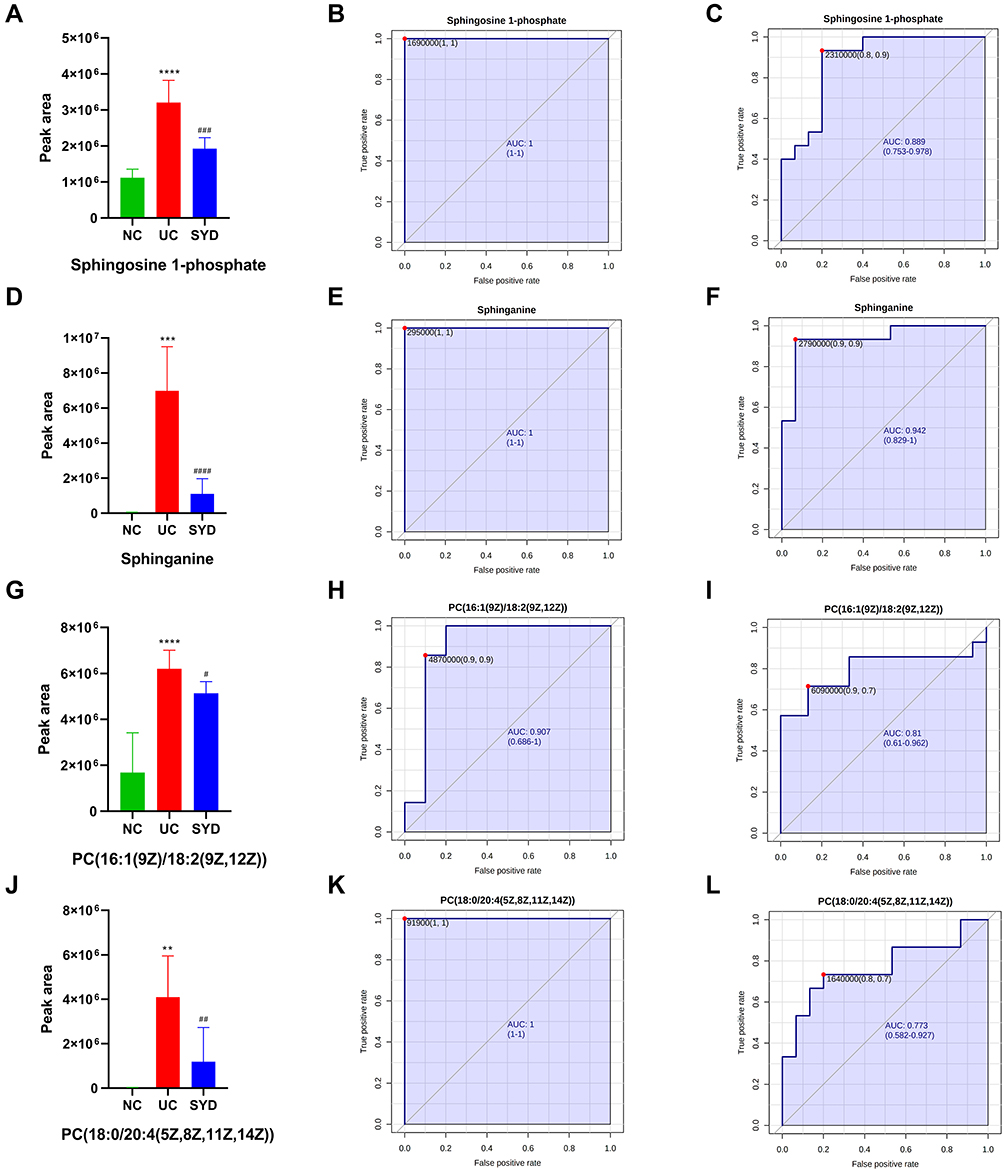 |
Figure 14 Histogram and the corresponding ROC curves of sphingosine 1-phosphate (S1P) (A–C) and sphinganine (D–F), PC(18:0/20:4(5Z,8Z,11Z,14Z)) (G–I) and PC(16:1(9Z)/18:2(9Z,12Z)) (J–L). (B) ROC curve between model group and normal group for S1P. (C) ROC curve between model group and SYD group for S1P. (E) ROC curve between model group and normal group for sphinganine. (F) ROC curve between model group and SYD group for sphinganine. (H) ROC curve between model group and normal group for PC(18:0/20:4(5Z,8Z,11Z,14Z)). (I) ROC curve between model group and SYD group for PC(18:0/20:4(5Z,8Z,11Z,14Z)). (K) ROC curve between model group and normal group for PC(16:1(9Z)/18:2(9Z,12Z)). (L) ROC curve between model group and SYD group for PC(16:1(9Z)/18:2(9Z,12Z)). **p<0.01, ***p<0.001, ****p<0.0001, compared to normal group; #p<0.05, ##p<0.01 ###p<0.001, ####p<0.0001, compared to model group. |
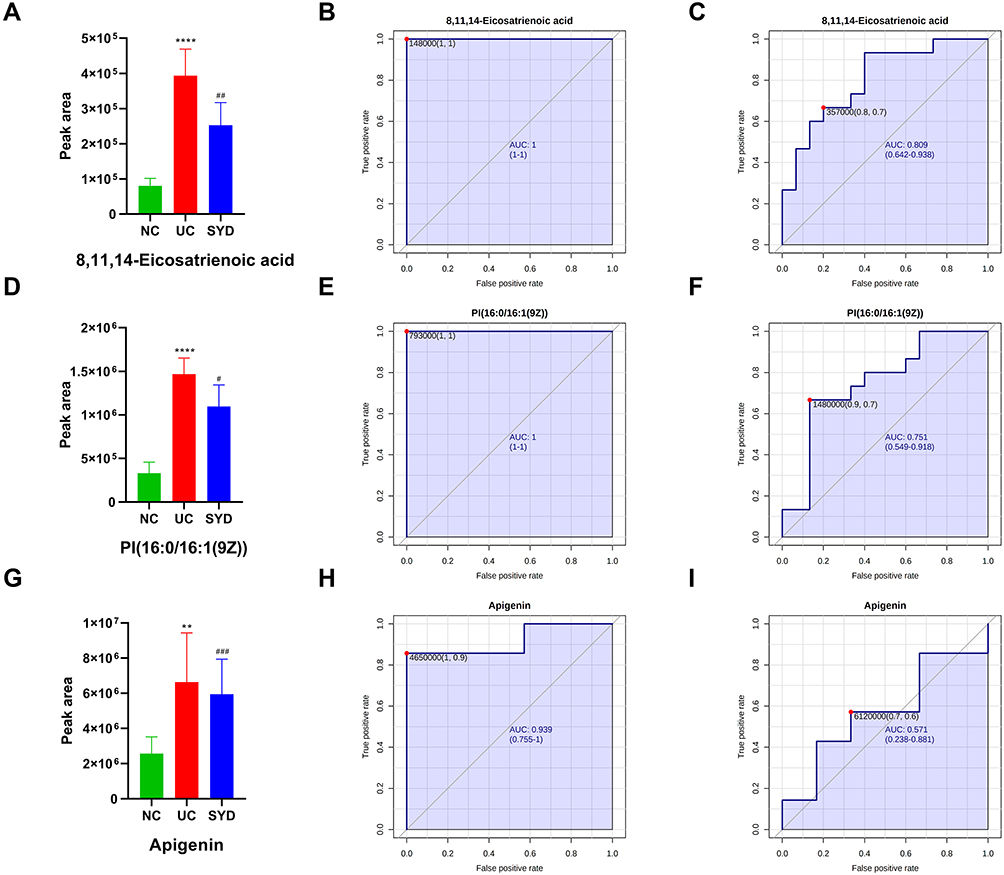 |
Figure 15 Histogram and the corresponding ROC curves of 8,11,14-Eicosatrienoic acid (A–C), PI(16:0/16:1(9Z)) (D–F) and apigenin (G–I). (B) ROC curve between model group and normal group for 8,11,14-Eicosatrienoic acid. (C) ROC curve between model group and SYD group for 8,11,14-Eicosatrienoic acid. (E) ROC curve between model group and normal group for PI(16:0/16:1(9Z)). (F) ROC curve between model group and SYD group for PI(16:0/16:1(9Z)). (H) ROC curve between model group and normal group for apigenin. (I) ROC curve between model group and SYD group for apigenin. #p<0.05, ##p<0.01 ###p<0.001, compared to model group. |
To sum up, the metabolomics results proved metabolic alterations in the feces, livers, serum and urine of mice with UC. SYD mainly relieves UC symptoms and reduces metabolic disorders by down-regulating metabolites. There were 61 potential endogenous markers, involving 38 in feces, 2 in liver, 14 in serum and 8 in urine, of which 7-Ketodeoxycholic acid coexisted in fecal and serum samples. Most of these differential metabolites belong to lipids and lipid-like molecules. Furthermore, glycerophospholipid metabolism, sphingolipid metabolism and biosynthesis of unsaturated fatty acids were the main metabolic pathways for SYD to play a therapeutic role.
Network Pharmacology
To further explore the mechanism by which SYD treats UC, we collected 393 UC-related primary targets from the OMIM, TTD, and GeneCards databases using a network pharmacology approach. Later, in the TCMSP database, SYD contains 129 active ingredients in total, involving 4 in Paeoniae Radix Alba, 2 in Angelicae Sinensis Radix, 9 in Coptidis Rhizoma, 28 in Scutellariae Radix, 83 in Glycyrrhizae Radix et Rhizoma, 4 in Arecae Semen, 3 in Aucklandiae Radix, 6 in Rhei Radix et Rhizome and 0 in Cinnanmomi Cortex. The targets were predicted by the DrugBank database and UniProt database.2 Eventually, 2541 targets, containing 101 in Paeoniae Radix Alba, 56 in Angelicae Sinensis Radix, 239 in Coptidis Rhizoma, 431 in Scutellariae Radix, 1545 in Glycyrrhizae Radix et Rhizoma, 35 in Arecae Semen, 39 in Aucklandiae Radix and 95 in Rhei Radix et Rhizome.
After matching UC targets and active ingredient targets, a total of 15 potential targets related to SYD in the treatment of UC were identified (Figure 16A). All intersecting target names were converted into gene symbols in the UniProt database.
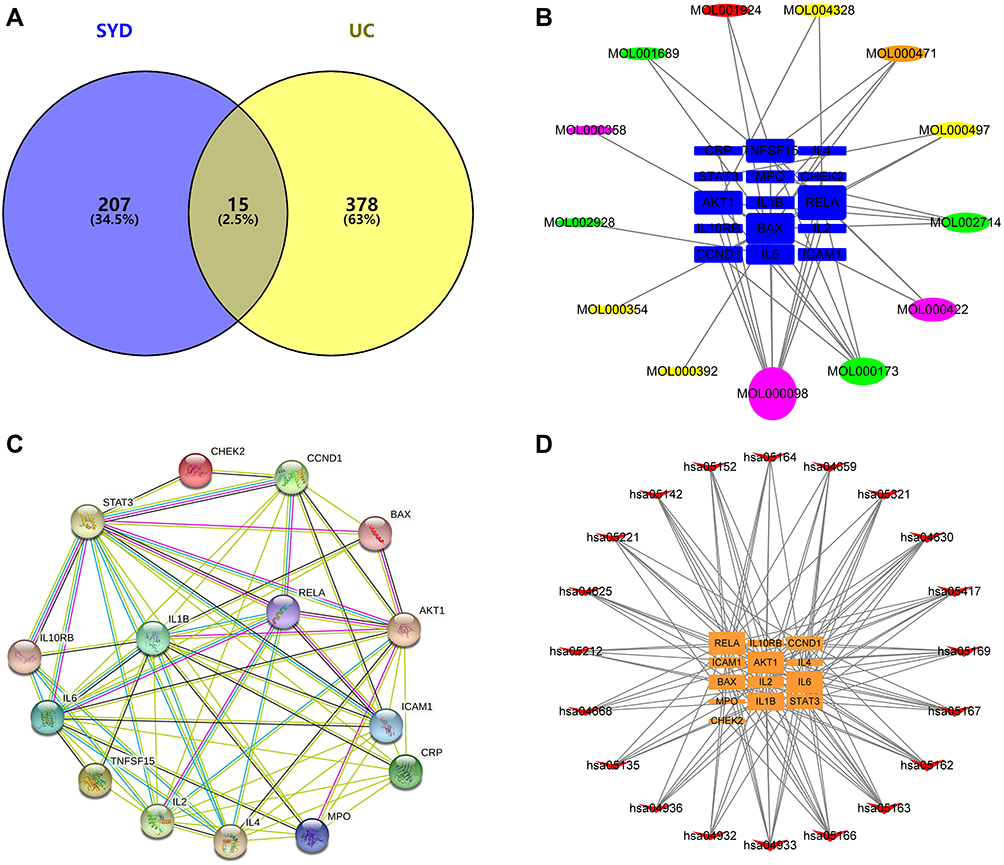 |
Figure 16 Venn diagram and various networks. (A) Venn diagram showing the intersection of UC-related genes and SYD-related genes. (B) The compound-target network. The circles represent the active components, in which red represents Paeoniae Radix Alba, Orange represents Rhei Radix et Rhizome, yellow represents Glycyrrhizae Radix et Rhizoma, green represents Scutellariae Radix, purple represents common component, and blue squares represent genes. The line between two nodes represents the interaction, and the size of each node indicates the number of connections. (C) The PPI network of 15 potential targets. The line width between two nodes represents the interaction. (D) The target-pathway network. Orange squares represent genes and red arrows represent KEGG pathways. This network shows the relationship between the enriched 20 pathways and 13 genes, and the size of the graph shows the number of pathways or genes connected. |
There were 13 active components corresponding to potential targets. In order to better show the complex relationship between SYD active components and potential UC targets, we constructed an active component-target network (Figure 16B). According to degree, the top four were quercetin, wogonin, kaempferol, baicalein, and the basic information of these components is manifested in Table 13.
Furthermore, in order to identify the key targets of SYD in the treatment of UC, we constructed PPI network (Figure 16C) by using String database and Cytoscape. Taking degree greater than the average as the screening standard,28 STAT3, IL1B, IL6, IL2, AKT1, IL4, ICAM1 and CCND1 were screened as key targets (Table 14).
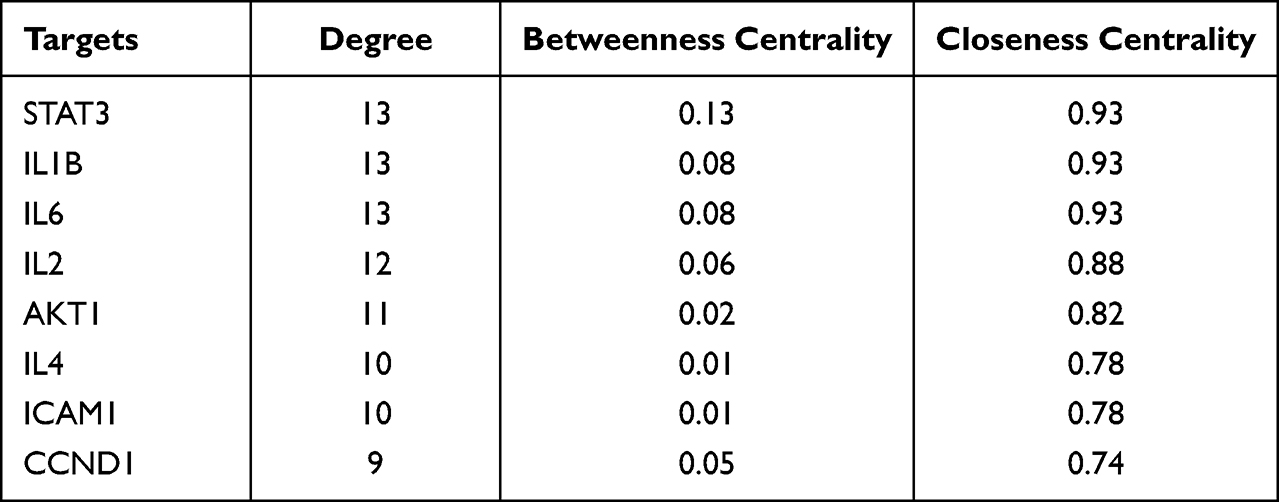 |
Table 14 The Potential Hub Proteins |
For the sake of understanding the ability of potential targets to resist UC symptoms, we performed KEGG enrichment analysis (Figure 17A) and GO enrichment analysis (Figure 17B) on these targets. The pathways affected significantly in KEGG enrichment analysis were JAK-STAT signaling pathway, Th17 cell differentiation, C-type lectin receptor signaling pathway and TNF signaling pathway. These results indicated that SYD probably acted on UC in a multi-target, multi-pathway, and overall integrative mode. In addition, the signaling pathways related to UC were extracted from KEGG database, and target-pathway network was generated by using Cytoscape software (Figure 16D).
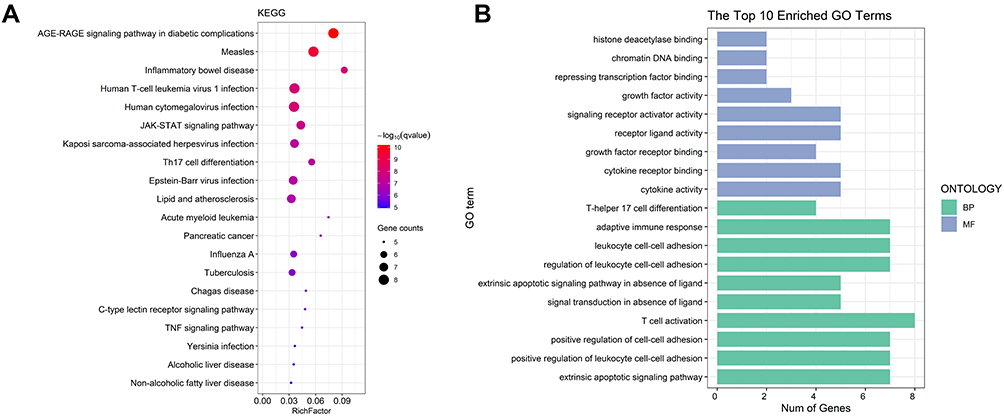 |
Figure 17 GO and KEGG analysis. (A) The top 20 KEGG pathways. The size of each node indicates enriched counts, the abscissa represents the enriched gene ratio, and color means the enrichment degree according to the -log10(Q value). (B) GO enrichment analysis of SYD targets in treating UC. The horizontal axis represents the number of genes enriched in each item, and the color represents BP and MF respectively. |
In terms on GO analysis (Figure 17B), there were several pathways involving cytokine activity, cytokine receptor binding, receptor ligand activity and signaling receptor activator activity in molecular function (MF), as well as adaptive immune response, leukocyte cell–cell adhesion, regulation of leukocyte cell–cell adhesion, T cell activation, positive regulation of cell–cell adhesion, positive regulation of leukocyte cell–cell adhesion and extrinsic apoptotic signaling pathway in biological process (BP).
Molecular Docking
To further study the possibility of the interaction between the active components of SYD and the key targets of UC, we screened 4 key components, involving quercetin, wogonin, kaempferol, baicalein by degree in Cytoscape, and obtained 5 key targets by searching the RCSB Protein Data Bank database.24
Through molecular docking, the binding energy between small ligand molecules and receptor protein macromolecules is calculated to predict the affinity between them.2 In this study, molecular docking confirmed that the active compounds of SYD had significant regulatory effects on STAT3 (Figure S8A–D), IL1B (Figure S8E–H), IL6 (Figure S9A–D), IL2 (Figure S9E–H) and AKT1 (Figure S10A–D). The absolute values of the binding energies between active compounds and target proteins were all greater than 5 (Table 15), indicating a strong affinity between them, and all of which may play a key role in the treatment of UC.29,30 Among them, IL6 had very binding activity with four active components and the strongest affinity with quercetin (−7.9kcal/mol), while IL1B had good binding power with components, and its affinity with quercetin and kaempferol was the weakest (−5.1kcal/mol).
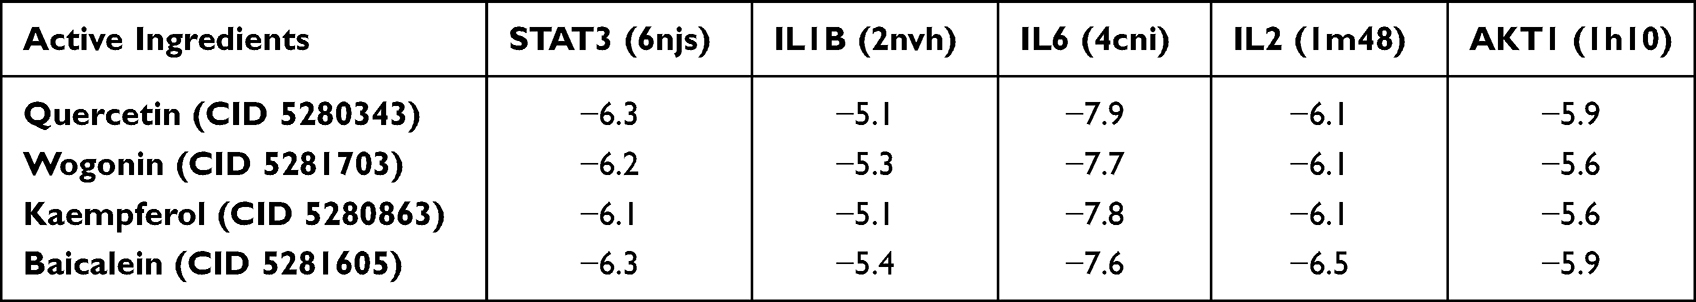 |
Table 15 Molecular Docking Score Between Active Ingredients of SYD and Related Targets |
Network Analysis of Differential Metabolites and Genes Associated with UC
Combined with the above metabolomics data and network pharmacology results, 61 differential metabolites and 15 potential targets were jointly analyzed, and the results were visualized with Cytoscape to create a compound-pathway-target network (Figure 18A). The network graph displayed the interactions of 12 pathways, 11 targets and 4 metabolites, totaling 27 nodes. Finally, 3 related signaling pathways were screened, including sphingolipid signaling pathway, PI3K/AKT-mTOR signaling pathway and S1P3 pathway, indicating that SYD may function through these 3 pathways. In addition, AKT1 was involved in the above three signaling pathways, and BAX was involved in the sphingolipid signaling pathway. The main metabolites involved are S1P, sphinganine and PI(16:0/16:1(9Z)). In the aggregate, AKT1 was the core target of SYD therapy.
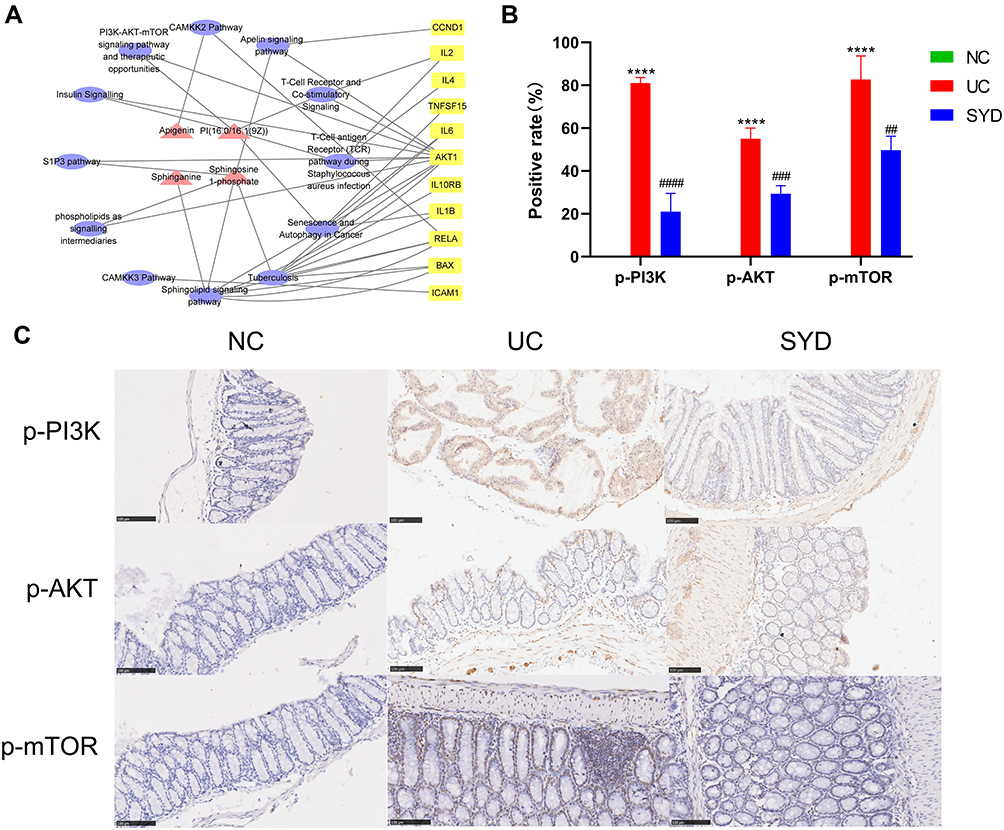 |
Figure 18 The metabolite-pathway-target network (A) and immunohistochemistry of p-PI3K, p-AKT and p-mTOR on sections from colonic tissues in each groups (B and C). (A) Red triangles represent metabolites, yellow squares represent genes, and purple circles represent pathways. (B) ****p<0.0001, compared to normal group; ##p<0.01 ###p<0.001, ####p<0.0001, compared to model group. (C) Scale bar size is 100μm. |
Experiment Verification
PI3K/AKT-mTOR pathway plays an important role in the occurrence and development of UC, whose activation can affect the synthesis and secretion of some cytokines. After being activated, PI3K can change the protein structure of AKT and activate it, and activate or inhibit a series of downstream substrates such as mTOR, Bax, etc. in the form of phosphorylation.31 In this study, we investigated whether SYD could exert a therapeutic effect on UC by inhibiting the PI3K/AKT-mTOR pathway by studying the expressions of p-PI3K, p-AKT and p-mTOR. According to Figure 18B and C, we found that the expression of p-PI3K, p-AKT and p-mTOR in the model group was significantly higher than that in the normal group (p<0.0001), and after SYD treatment, the phosphorylation levels of PI3K, AKT and mTOR significantly lower (p<0.01). These results suggest that UC can promote the activation of PI3K/AKT-mTOR pathway, and SYD reduces colonic inflammation and ameliorates UC by inhibiting the expression of these channel proteins.
Discussion
As we are all aware, the typical clinical symptoms of UC are recurrent abdominal pain, diarrhea, and mucopurulent stools. Fecal metabolomic changes can better reflect local inflammatory processes in the gut.32
It is generally known that the direct venous outflow of the gut is the portal vein, and the liver is the main organ exposed to gut derivatives such as bacterial products and nutrients, and studies have shown that IBD has a certain chance of causing non-alcoholic fatty liver disease.33 Furthermore, the gut–liver axis plays an important role in lipid-glucose-related metabolic disturbances, and the gut microbiota is thought to play an important role in the gut–liver interaction. This experiment proved that ulcerative colitis can cause metabolic disorder, especially lipid metabolism disorder. The relationship between metabolic disorder and intestinal microflora and which kind of metabolic changes are mainly caused by which bacteria in ulcerative colitis may be a direction for future research.
Some cytokine production changes can be detected in the serum of acute ulcerative colitis patients or mice,32 such as tumor necrosis factor, interferon, interleukin-1β, etc. Studies have shown that there are also some potential biomarkers in serum, such as tryptophan.34
Urine metabolites are susceptible to environmental factors, and gut microbes can produce significantly different metabolites.32 Therefore, urine metabolites can be indicative of the state of the gut microbiota. However, no widely validated and applied biomarkers have been found in urine.32 Consequently, the study of potential markers of urine in ulcerative colitis has certain development prospects.
In this experiment, urine metabonomic analysis showed that the change of metabolites in urine was mainly related to amino acid metabolism, while feces, liver and serum were mainly related to lipid metabolism, especially glycerophospholipid metabolism, biosynthesis of unsaturated fatty acids and sphingolipid metabolism. Taken together, it is of great significance to study the metabonomics of feces, liver, serum and urine and the potential relationship among them.
Metabolomics analysis manifested that the anti-UC effect of SYD was related to 61 differential metabolites and 3 pathways. Network pharmacology proclaimed that AKT1, IL1B, IL2, IL6 and STAT3 were the hub targets of SYD, and molecular docking indicated the interaction mode between the 4 active components and the 5 core targets. Combining metabolomics and network pharmacology, we found that SYD mainly exerted its anti-UC effect through the following three pathways, containing sphingolipid signaling pathway, PI3K/AKT-mTOR signaling pathway and S1P3 pathway. Moreover, the main target was AKT1, and related metabolites were S1P, sphinganine and PI (16:0/16:1(9Z)).
8,11,14-Eicosatrienoic acid, also known as dihomo-gamma-linolenic acid, which serve as a precursor in the synthesis of eicosapentaenoic acid (EPA), can be converted into prostaglandin E1 (PGE1) as well as the series-3 prostaglandins, and participate in various pathophysiological activities, including anti-thrombogenic, anti-inflammatory and anti-atherogenic properties. Numerous studies have found that EPA can reduce the level of calprotectin in feces of UC patients, alleviate intestinal inflammation by inhibiting the NLRP3/IL-1β and IL-6/STAT3 inflammatory pathways, upregulate the Wnt/β-catenin pathway,35 and promote goblet cell differentiation as well as modulation of gut microbiota composition.36 Furthermore, long-term administration also induces and maintains asymptomatic remission in patients with ulcerative colitis.37 Here, we found that 8,11,14-Eicosatrienoic acid was up-regulated in UC and decreased after SYD treatment, according to its anti-inflammatory effect, suggesting that elevated 8,11,14-Eicosatrienoic acid could alleviate intestinal mucosal damage. Its upregulation in inflammatory states may be part of the protective mechanism of UC.
Phosphatidylcholine (PC) is an important constituent of cell membranes, alveolar surfactants, lipoproteins and bile; as well as a source of lipid messengers such as lysophosphatidylcholine, phosphatidic acid, diglycerides, lysophosphatidic acid and arachidonic acid, which mainly involved in glycerophospholipid metabolism, linoleic acid metabolism, alpha-linolenic acid metabolism and arachidonic acid metabolism. It has been found that berberine, one of the main active components of SYD, can significantly reduce the level of lysophosphatidylcholine (LPC) in the serum of DSS-induced experimental colitis mice and LPS-stimulated RAW 264.7 cells.38 Recent studies have elucidated that IBD is associated with an imbalance between pro- and anti-inflammatory bioactive lipid mediators.39 PC has been shown to have anti-inflammatory effects on the intestinal mucosal barrier.38 In this study, among the differential metabolites in fecal tissue, LysoPC(18:0) was found to decrease in UC mice, while LysoPC(17:0), LysoPE(0:0/15:0), PE(P-16:0e/0:0), PC(18:0/20:4(5Z, 8Z, 11Z, 14Z)) increased, and showed an opposite trend after medication. In liver tissue, PC(16:1(9Z)/18:2(9Z,12Z)) and LysoPC(20:5(5Z,8Z,11Z,14Z,17Z)) showed a trend of increasing first and then decreasing. Since the contents of total lysophospholipids and phosphatidylcholine cannot be determined, their overall anti-inflammatory and pro-inflammatory effects are still unclear. Subsequent studies may be conducted through lipidomics or other means to determine whether their individual effects and ratios have specificity.
PI(16:0/16:1(9Z)) is a phosphatidylinositol. Phosphatidylinositols are important lipids, both as a key membrane constituent and as a participant in essential metabolic processes, which act directly or indirectly through some metabolites. In animal tissues, phosphatidylinositol is the primary source of the arachidonic acid required for biosynthesis of eicosanoids, involving prostaglandins, via the action of the enzyme phospholipase A2. Phosphatidylinositol and the phosphatidylinositol phosphates are the main source of diacylglycerols that serve as signaling molecules, via the action of phospholipase C enzymes. Elevations of epoxyeicosatrienoic acids (EETs) from cytochrome P450 (CYP) cyclooxygenase-dependent metabolism of arachidonic acid have been found to have important anti-inflammatory effects.40 A research has manifested that phosphoinositide 3-kinase signaling mediates beta-catenin activation in intestinal epithelial stem and progenitor cells in colitis.41
Apigenin, a flavone detected in urine samples and SYD, exhibits antiproliferative, anti-inflammatory, and antioxidant properties through poorly defined mechanisms.42,43 A study elucidated that dietary apigenin anti-inflammatory activity was attached to an inhibition of NLRP3 inflammasome pathways by diminishing proinflammatory IL1β and IL18 cytokine levels.44 Recently, apigenin was found to enhance apoptosis induction by 5-fluorouracil through regulation of thymidylate synthase in colorectal cancer cells.45 In this study, since SYD contains apigenin, although it acts as a differential metabolite, its role is not yet clear. Apigenin may be an effective component of anti-UC, which can be further explored in the follow-up.
Sphingosine is derived from the catabolism of endogenous cellular sphingosine, which is catalyzed by sphingosine kinases (SphKs) to produce S1P, an important biologically active sphingolipid metabolite that acts on sphingosine-1-phosphate receptors (S1PRs). S1P has the ability to regulate an oceans of signal pathways, such as IL6/STAT3 signal pathway and PI3K/AKT signal pathway,46,47 mediate a variety of biological behaviors, and play a crucial role in malignant tumors, cardiovascular diseases, lung diseases, inflammatory bowel diseases and autoimmune diseases.16,48–52
One study suggested that sphingolipids were involved in inflammation, apoptosis and cellular immune responses.53 Xin-Sheng-Hua Granule was proved to inhibit erythrocyte apoptosis by inhibiting sphingolipid metabolism.28 S1P mainly caused damage to the intestinal mucosa by participating in the inflammatory response, regulating the immune response and affecting the intestinal microecology, thereby causing UC.54 Moreover, since sphingolipids can synthesize ceramides, the rise of sphingolipids in UC mice may be explained by the deleterious effects of ceramides in IBD, which are mainly by activating immune cells and triggering apoptosis to promote inflammation.39 A study has pointed out that S1P was negatively associated with Roseburia and positively associated with Klebsiella and Escherichia-Shigella,16 which can be seen that abnormal sphingolipid metabolism in UC is related to changes in intestinal flora.
Sphingosine kinases are divided into two types: SphK1 and SphK2. A study has corroborated that the expression of SphK1 in UC patients with inflammation and colonic epithelial cells is increased, indicating that the SphK1/S1P pathway plays a significant role in the occurrence and development of intestinal inflammation.54 Moreover, S1P had the ability to regulate the expression of adherens junction protein E-cadherin and enhance intestinal epithelial cell barrier function.55
S1P mainly binds to 5 receptors (S1PR1-5), of which S1PR1-3 is widely expressed in tissues, while the expression of S1PR4-5 is restricted.54 The S1PR1 has been identified as a key component for persistent activation of STAT3 in tumors.56 It was found that activation of S1P3-mediated NO-dependent pathway and AKT can protect cardiomyocytes from apoptosis.46,57 In vitro experiments confirmed that S1P-induced S1PR3/PI3K/AKT signaling pathway can promote endothelial progenitor cell proliferation and inhibit apoptosis.58 A recent review indicated that ozanimod, a selective sphingosine-1-phosphate receptor modulator, was approved by the Food and Drug Administration for the treatment of adult patients with moderately to severely active ulcerative colitis,59,60 and S1PR agonists etrasimod have been shown to be safe and efficacious for the treatment of patients with inflammatory bowel disease.54,61 In conclusion, S1PR is expected to become a new therapeutic target for UC. In this study, S1P was significantly increased in UC, while SYD could significantly decrease it, indicating that S1P may be the target of SYD, and the therapeutic effect of SYD may be explored from the PI3K/AKT-mTOR signaling pathway and S1P3 pathway. Figure 19 is a diagram of the possible molecular mechanism of SYD, which was drawn by Figdraw (www.figdraw.com).
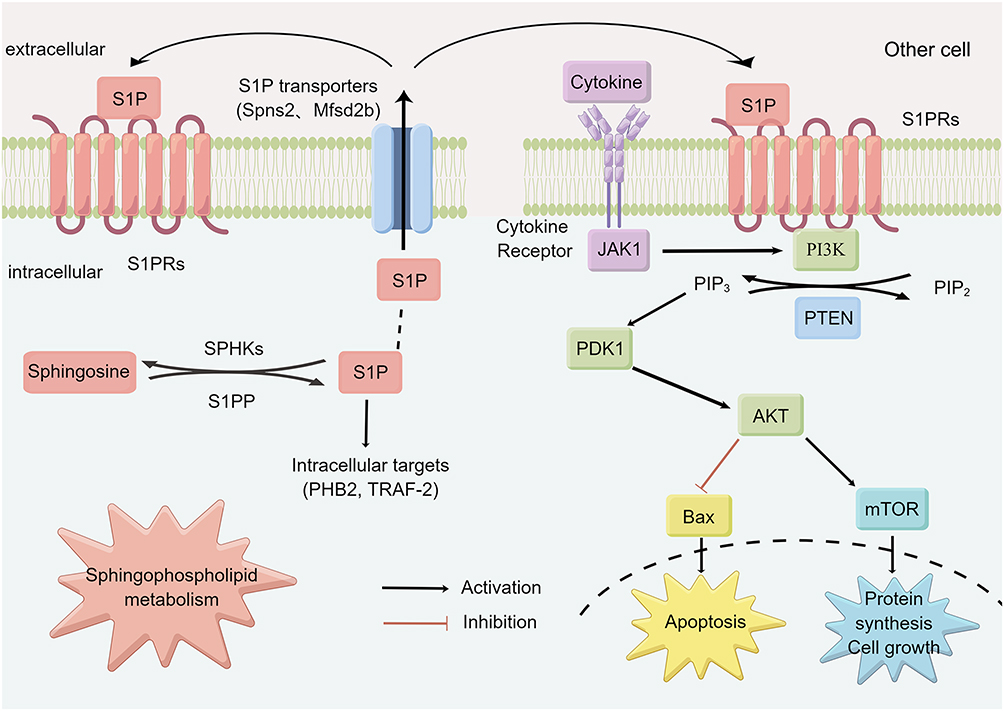 |
Figure 19 Possible molecular mechanism of SYD in the treatment of UC. |
Regarding the PI3K/AKT-mTOR signaling pathway, abnormal activation of the PI3K/AKT signaling pathway and mTOR has been found in experimental colitis.62 One study clarified that phosphoinositide 3-kinase signaling can mediate beta-catenin activation in intestinal epithelial stem and progenitor cells in colitis.41 Besides, a study elucidated that MiR-223 can trigger cell apoptosis and inflammation in UC by up-regulating the PI3K/AKT-mTOR signaling pathway.63 In addition, this study revealed that SYD may exert its therapeutic effect on UC by inhibiting PI3K/Akt-mTOR pathway, and other Chinese medicine-related studies have also produced similar results,25,29,64,65 which all clarify that Chinese medicine treatment against UC may mainly produce efficacy through regulating PI3K/Akt pathway. Compared with single-drug research, compound drug research can reveal the synergistic mechanism between drugs.29 At the same time, traditional Chinese medicine compound has higher safety and lower cost in clinical practice.
Conclusion
This experiment demonstrated that SYD treatment can alleviate DSS-induced ulcerative colitis, and explored the key targets and mechanisms of SYD in the treatment of UC based on metabolomics and network pharmacology. Molecular docking revealed the interaction mode between the four active components of SYD and the five core targets of UC and validated by immunohistochemistry. The docking results preliminarily revealed the material basis of SYD in the treatment of UC. This discovery has far-reaching significance for exploring the molecular mechanism of SYD.
This study provides theoretical and data support for the in-depth study of the potential mechanism of SYD, showing that SYD counteracts UC through multi-component and multi-target, highlighting the reliability and effectiveness of the network pharmacology approach. Combined analysis indicated that PI3K/AKT-mTOR signaling pathway and S1P3 pathway may be the potential signaling pathway for its function.
In addition, untargeted metabolomics analysis has certain limitations, firstly, its sensitivity is lower than that of targeted metabolomics, and secondly, the limited number of compounds in the metabolomics database hinders a subset of metabolite annotation and its biological interpretation.66 Regarding the above differential metabolites, targeted metabolomics and some molecular biology experiments can be used to clarify the specific molecular mechanism of SYD or its active components, which can provide a scientific basis for traditional Chinese medicine compound treatment of diseases or lay a foundation for drug screening.
Abbreviations
TCM, traditional Chinese medicine; SYD, Shaoyao decoction; UC, ulcerative colitis; DSS, dextran sulfate sodium; NO, nitric oxide; IL, interLeukin; MUC, mucin; TFF3, trefoil factor 3; ZO-1, occludens-1; NC, normal control; UPLC-Q-TOF-MS, ultra-performance liquid chromatography-quadrupole-time of flight-mass spectrometry; DAI, disease activity index; H-E, hematoxylin-eosin; QC, quality control; PCA, Principal Component Analysis; PLS-DA, Partial Least Squares Discriminant Analysis; OPLS-DA, Orthogonal Partial Least Squares Discriminant Analysis; CV-ANOVA, analysis of variance of the cross-validated residuals; VIP, variable importance in the projection; FC, fold-change; FDR, false discovery rate; ROC, receiver operating characteristics; OMIM, Online Mendelian Inheritance in Man; TTD, Therapeutic Target Database; TCMSP, Traditional Chinese Medicine Systems Pharmacology; DL, drug‐like properties; OB, oral availability; PPI, protein–protein interaction; GO, Gene Ontology; KEGG, Kyoto Encyclopedia of Genes and Genomes; IMPaLA, Integrated Molecular Pathway Level Analysis; STAT, signal transducer and activator of transcription; AKT1, AKT Serine/Threonine Kinase 1; ANOVA, analysis of variance; LSD, least significant difference; TIC, total ion chromatogram; PC, phosphatidylcholine; S1P, sphingosine 1-phosphate; AUC, area under curve; ICAM, intercellular cell adhesion molecule; CCND1, Recombinant Cyclin D1; JAK, Janus Kinase; Th17, T help 17 cells; TNF, tumor necrosis factor; MF, molecular function; BP, biological process; PI3K, phosphatidylinositol 3-kinase; mTOR, Mammalian Target of Rapamycin; S1P3, sphingosine-1-phosphate receptor 3; BAX, BCL2-associated X protein; PI, phosphatidylinositol; PGE1, prostaglandin E1; SphKs, sphingosine kinases; S1PRs, sphingosine-1-phosphate receptors; NLRP3, NOD-like receptor protein 3.
Data Sharing Statement
The datasets during and/or analysed during the current study available from the corresponding author on reasonable request.
Ethics Statement
All animal experiments were complied with institutional animal care guidelines. The experimental procedures were approved by the Experimental Animal Ethics Committee of Zhejiang Chinese Medical University (IACUC-20210531-02).
Author Contributions
All authors made a significant contribution to the work reported, whether that is in the conception, study design, execution, acquisition of data, analysis and interpretation, or in all these areas; took part in drafting, revising or critically reviewing the article; gave final approval of the version to be published; have agreed on the journal to which the article has been submitted; and agree to be accountable for all aspects of the work.
Supplementary Materials
Supplementary data associated with this article can be found in the Supplementary Materials.
Funding
This research was supported by Zhejiang Province Traditional Chinese Medicine Science and Technology Project (No: Z2021ZQ042), Zhejiang Traditional Chinese Medicine Administration (No: 2020ZZ010), and Zhejiang Province Natural Science Foundation (No: LY21H270007).
Disclosure
The authors declare that they have no conflicts of interest in relation to this work.
References
1. Wang B, Liu Y, Sun J, Zhang N, Zheng X, Liu Q. Exploring the potential mechanism of Xiaokui Jiedu decoction for ulcerative colitis based on network pharmacology and molecular docking. J Healthc Eng. 2021;2021:1536337. doi:10.1155/2021/1536337
2. Wei M, Li H, Li Q, et al. Based on network pharmacology to explore the molecular targets and mechanisms of Gegen Qinlian decoction for the treatment of ulcerative colitis. Biomed Res Int. 2020;2020:5217405. doi:10.1155/2020/5217405
3. Chi H, Wang D, Chen M, et al. Shaoyao decoction inhibits inflammation and improves intestinal barrier function in mice with dextran sulfate sodium-induced colitis. Front Pharmacol. 2021;12. doi:10.3389/fphar.2021.524287
4. Ungaro R, Mehandru S, Allen PB, Peyrin-Biroulet L, Colombel J-F. Ulcerative colitis. Lancet. 2017;389(10080):1756–1770. doi:10.1016/S0140-6736(16)32126-2
5. Cui L, Guan X, Ding W, et al. Scutellaria baicalensis Georgi polysaccharide ameliorates DSS-induced ulcerative colitis by improving intestinal barrier function and modulating gut microbiota. Int J Biol Macromol. 2021;166:1035–1045. doi:10.1016/j.ijbiomac.2020.10.259
6. Zhu F, Ke Y, Luo Y, et al. Effects of different treatment of fecal microbiota transplantation techniques on treatment of ulcerative colitis in rats. Front Microbiol. 2021;12:683234. doi:10.3389/fmicb.2021.683234
7. Xu L, Zhang J, Wang Y, Zhang Z, Wang F, Tang X. Uncovering the mechanism of Ge-Gen-Qin-Lian decoction for treating ulcerative colitis based on network pharmacology and molecular docking verification. Biosci Rep. 2021;41(2). doi:10.1042/BSR20203565
8. Hua YL, Jia YQ, Zhang XS, et al. Baitouweng Tang ameliorates DSS-induced ulcerative colitis through the regulation of the gut microbiota and bile acids via pathways involving FXR and TGR5. Biomed Pharmacother. 2021;137:111320. doi:10.1016/j.biopha.2021.111320
9. Wu ZC, Zhao ZL, Deng JP, Huang JT, Wang YF, Wang ZP. Sanhuang Shu’ai decoction alleviates DSS-induced ulcerative colitis via regulation of gut microbiota, inflammatory mediators and cytokines. Biomed Pharmacother. 2020;125:109934. doi:10.1016/j.biopha.2020.109934
10. Zou J, Shen Y, Chen M, et al. Lizhong decoction ameliorates ulcerative colitis in mice via modulating gut microbiota and its metabolites. Appl Microbiol Biotechnol. 2020;104(13):5999–6012. doi:10.1007/s00253-020-10665-1
11. Jiang S, Shen X, Xuan S, et al. Serum and colon metabolomics study reveals the anti-ulcerative colitis effect of Croton crassifolius Geisel. Phytomedicine. 2021;87:153570. doi:10.1016/j.phymed.2021.153570
12. Thiyagarajan P, Chandrasekaran CV, Deepak HB, Agarwal A. Modulation of lipopolysaccharide-induced pro-inflammatory mediators by an extract of Glycyrrhiza glabra and its phytoconstituents. Inflammopharmacology. 2011;19(4):235–241. doi:10.1007/s10787-011-0080-x
13. Liao Z, Zhang S, Liu W, et al. LC-MS-based metabolomics analysis of Berberine treatment in ulcerative colitis rats. J Chromatogr B Analyt Technol Biomed Life Sci. 2019;1133:121848. doi:10.1016/j.jchromb.2019.121848
14. Wu J, Wei Z, Cheng P, et al. Rhein modulates host purine metabolism in intestine through gut microbiota and ameliorates experimental colitis. Theranostics. 2020;10(23):10665–10679. doi:10.7150/thno.43528
15. Feng X, Zhang X, Chen Y, Li L, Sun Q, Zhang L. Identification of bilobetin metabolites, in vivo and in vitro, based on an efficient ultra-high-performance liquid chromatography coupled with quadrupole time-of-flight mass spectrometry strategy. J Sep Sci. 2020;43(17):3408–3420. doi:10.1002/jssc.202000313
16. Sun M, Du B, Shi Y, Lu Y, Zhou Y, Liu B. Combined signature of the fecal microbiome and plasma metabolome in patients with ulcerative colitis. Med Sci Monit. 2019;25:3303–3315. doi:10.12659/MSM.916009
17. Goedert JJ, Sampson JN, Moore SC, et al. Fecal metabolomics: assay performance and association with colorectal cancer. Carcinogenesis. 2014;35(9):2089–2096. doi:10.1093/carcin/bgu131
18. Liu J, Liu J, Tong X, et al. Network pharmacology prediction and molecular docking-based strategy to discover the potential pharmacological mechanism of Huai Hua San against ulcerative colitis. Drug Des Devel Ther. 2021;15:3255–3276. doi:10.2147/DDDT.S319786
19. Pang Z, Chong J, Zhou G, et al. MetaboAnalyst 5.0: narrowing the gap between raw spectra and functional insights. Nucleic Acids Res. 2021;49(W1):W388–W396. doi:10.1093/nar/gkab382
20. Zhang W, Chen Y, Jiang H, et al. Integrated strategy for accurately screening biomarkers based on metabolomics coupled with network pharmacology. Talanta. 2020;211:120710. doi:10.1016/j.talanta.2020.120710
21. Han Q, Li H, Jia M, et al. Age-related changes in metabolites in young donor livers and old recipient sera after liver transplantation from young to old rats. Aging Cell. 2021;20(7):e13425. doi:10.1111/acel.13425
22. Ma JX, Ye M, Ma K, et al. Network pharmacology-based strategy for predicting active ingredients and potential targets of coptis chinensis franchin polycystic ovary syndrome. Evid Based Complement Alternat Med. 2021;2021:6651307. doi:10.1155/2021/6651307
23. Kamburov A, Cavill R, Ebbels TM, Herwig R, Keun HC. Integrated pathway-level analysis of transcriptomics and metabolomics data with IMPaLA. Bioinformatics. 2011;27(20):2917–2918. doi:10.1093/bioinformatics/btr499
24. Li T, Zhang W, Hu E, et al. Integrated metabolomics and network pharmacology to reveal the mechanisms of hydroxysafflor yellow A against acute traumatic brain injury. Comput Struct Biotechnol J. 2021;19:1002–1013. doi:10.1016/j.csbj.2021.01.033
25. Zhu F, Zheng J, Xu F, Xi Y, Chen J, Xu X. Resveratrol alleviates dextran sulfate sodium-induced acute ulcerative colitis in mice by mediating PI3K/Akt/VEGFA pathway. Front Pharmacol. 2021;12:693982. doi:10.3389/fphar.2021.693982
26. Herath NI, Doecke J, Spanevello MD, Leggett BA, Boyd AW. Epigenetic silencing of EphA1 expression in colorectal cancer is correlated with poor survival. Br J Cancer. 2009;100(7):1095–1102. doi:10.1038/sj.bjc.6604970
27. Xuan C, Xi YM, Zhang YD, Tao CH, Zhang LY, Cao WF. Yiqi Jiedu Huayu decoction alleviates renal injury in rats with diabetic nephropathy by promoting autophagy. Front Pharmacol. 2021;12:624404. doi:10.3389/fphar.2021.624404
28. Pang HQ, Yue SJ, Tang YP, et al. Integrated metabolomics and network pharmacology approach to explain possible action mechanisms of Xin-Sheng-Hua granule for treating anemia. Front Pharmacol. 2018;9:165. doi:10.3389/fphar.2018.00165
29. Shou X, Wang Y, Zhang X, et al. Network pharmacology and molecular docking analysis on molecular mechanism of Qingzi Zhitong decoction in the treatment of ulcerative colitis. Front Pharmacol. 2022;13:727608. doi:10.3389/fphar.2022.727608
30. Liu C-S, Xia T, Luo Z-Y, et al. Network pharmacology and pharmacokinetics integrated strategy to investigate the pharmacological mechanism of Xianglian pill on ulcerative colitis. Phytomedicine. 2021;82:153458. doi:10.1016/j.phymed.2020.153458
31. Ye Z, Li Y, She Y, et al. Renshen Baidu powder protects ulcerative colitis via inhibiting the PI3K/Akt/NF-kappaB signaling pathway. Front Pharmacol. 2022;13:880589. doi:10.3389/fphar.2022.880589
32. Sands BE. Biomarkers of inflammation in inflammatory bowel disease. Gastroenterology. 2015;149(5):1275–1285 e2. doi:10.1053/j.gastro.2015.07.003
33. Kim SH, Lee W, Kwon D, et al. Metabolomic analysis of the liver of a dextran sodium sulfate-induced acute colitis mouse model: implications of the gut–liver connection. Cells. 2020;9(2):341.
34. Di’Narzo AF, Houten SM, Kosoy R, et al. Integrative analysis of the inflammatory bowel disease serum metabolome improves our understanding of genetic etiology and points to novel putative therapeutic targets. Gastroenterology. 2022;162(3):828–843 e11. doi:10.1053/j.gastro.2021.11.015
35. Zhang Z, Xue Z, Yang H, et al. Differential effects of EPA and DHA on DSS-induced colitis in mice and possible mechanisms involved. Food Funct. 2021;12(4):1803–1817. doi:10.1039/D0FO02308F
36. Prossomariti A, Scaioli E, Piazzi G, et al. Short-term treatment with eicosapentaenoic acid improves inflammation and affects colonic differentiation markers and microbiota in patients with ulcerative colitis. Sci Rep. 2017;7(1):7458. doi:10.1038/s41598-017-07992-1
37. Scaioli E, Sartini A, Bellanova M, et al. Eicosapentaenoic acid reduces fecal levels of calprotectin and prevents relapse in patients with ulcerative colitis. Clin Gastroenterol Hepatol. 2018;16(8):1268–1275 e2. doi:10.1016/j.cgh.2018.01.036
38. Zhai L, Huang T, Xiao HT, et al. Berberine suppresses colonic inflammation in dextran sulfate sodium-induced murine colitis through inhibition of cytosolic phospholipase A2 activity. Front Pharmacol. 2020;11:576496. doi:10.3389/fphar.2020.576496
39. Diab J, Hansen T, Goll R, et al. Lipidomics in ulcerative colitis reveal alteration in mucosal lipid composition associated with the disease state. Inflamm Bowel Dis. 2019;25(11):1780–1787. doi:10.1093/ibd/izz098
40. Qiu Y-E, Qin J, Luo Y, et al. Increased epoxyeicosatrienoic acids may be part of a protective mechanism in human ulcerative colitis, with increased CYP2J2 and reduced soluble epoxide hydrolase expression. Prostaglandins Other Lipid Mediat. 2018;136:9–14. doi:10.1016/j.prostaglandins.2018.03.004
41. Lee G, Goretsky T, Managlia E, et al. Phosphoinositide 3-kinase signaling mediates beta-catenin activation in intestinal epithelial stem and progenitor cells in colitis. Gastroenterology. 2010;139(3):869–81, 881 e1–9. doi:10.1053/j.gastro.2010.05.037
42. Vargo MA, Voss OH, Poustka F, Cardounel AJ, Grotewold E, Doseff AI. Apigenin-induced-apoptosis is mediated by the activation of PKCdelta and caspases in leukemia cells. Biochem Pharmacol. 2006;72(6):681–692. doi:10.1016/j.bcp.2006.06.010
43. Li F, Lang F, Zhang H, et al. Apigenin alleviates endotoxin-induced myocardial toxicity by modulating inflammation, oxidative stress, and autophagy. Oxid Med Cell Longev. 2017;2017:2302896. doi:10.1155/2017/2302896
44. Márquez-Flores YK, Villegas I, Cárdeno A, Rosillo M, Alarcón-de-la-Lastra C. Apigenin supplementation protects the development of dextran sulfate sodium-induced murine experimental colitis by inhibiting canonical and non-canonical inflammasome signaling pathways. J Nutr Biochem. 2016;30:143–152. doi:10.1016/j.jnutbio.2015.12.002
45. Yang C, Song J, Hwang S, Choi J, Song G, Lim W. Apigenin enhances apoptosis induction by 5-fluorouracil through regulation of thymidylate synthase in colorectal cancer cells. Redox Biol. 2021;47:102144. doi:10.1016/j.redox.2021.102144
46. Li Q, Li Y, Lei C, Tan Y, Yi G. Sphingosine-1-phosphate receptor 3 signaling. Clin Chim Acta. 2021;519:32–39. doi:10.1016/j.cca.2021.03.025
47. Gomez-Larrauri A, Presa N, Dominguez-Herrera A, Ouro A, Trueba M, Gomez-Muñoz A. Role of bioactive sphingolipids in physiology and pathology. Essays Biochem. 2020;64(3):579–589. doi:10.1042/EBC20190091
48. Li L, Dai W, Li W, et al. Integrated network pharmacology and metabonomics to reveal the myocardial protection effect of Huang-Lian-Jie-Du-Tang on myocardial ischemia. Front Pharmacol. 2020;11:589175. doi:10.3389/fphar.2020.589175
49. Kunkel GT, Maceyka M, Milstien S, Spiegel S. Targeting the sphingosine-1-phosphate axis in cancer, inflammation and beyond. Nat Rev Drug Discov. 2013;12(9):688–702. doi:10.1038/nrd4099
50. Ebenezer DL, Fu P, Natarajan V. Targeting sphingosine-1-phosphate signaling in lung diseases. Pharmacol Ther. 2016;168:143–157. doi:10.1016/j.pharmthera.2016.09.008
51. Colombo E, Farina C. Lessons from S1P receptor targeting in multiple sclerosis. Pharmacol Ther. 2022;230:107971. doi:10.1016/j.pharmthera.2021.107971
52. Li JX, Li RZ, Sun A, et al. Metabolomics and integrated network pharmacology analysis reveal Tricin as the active anti-cancer component of Weijing decoction by suppression of PRKCA and sphingolipid signaling. Pharmacol Res. 2021;171:105574. doi:10.1016/j.phrs.2021.105574
53. Testai FD, Kilkus JP, Berdyshev E, Gorshkova I, Natarajan V, Dawson G. Multiple sphingolipid abnormalities following cerebral microendothelial hypoxia. J Neurochem. 2014;131(4):530–540. doi:10.1111/jnc.12836
54. Argollo M, Furfaro F, Gilardi D, et al. Modulation of sphingosine-1-phosphate in ulcerative colitis. Expert Opin Biol Ther. 2020;20(4):413–420. doi:10.1080/14712598.2020.1732919
55. Greenspon J, Li R, Xiao L, et al. Sphingosine-1-phosphate regulates the expression of adherens junction protein E-cadherin and enhances intestinal epithelial cell barrier function. Dig Dis Sci. 2011;56(5):1342–1353. doi:10.1007/s10620-010-1421-0
56. Liang J, Nagahashi M, Kim EY, et al. Sphingosine-1-phosphate links persistent STAT3 activation, chronic intestinal inflammation, and development of colitis-associated cancer. Cancer Cell. 2013;23(1):107–120. doi:10.1016/j.ccr.2012.11.013
57. Yung BS, Brand CS, Xiang SY, et al. Selective coupling of the S1P3 receptor subtype to S1P-mediated RhoA activation and cardioprotection. J Mol Cell Cardiol. 2017;103:1–10. doi:10.1016/j.yjmcc.2016.12.008
58. Wang H, Huang H, Ding SF. Sphingosine-1-phosphate promotes the proliferation and attenuates apoptosis of Endothelial progenitor cells via S1PR1/S1PR3/PI3K/Akt pathway. Cell Biol Int. 2018;42(11):1492–1502. doi:10.1002/cbin.10991
59. Sandborn WJ, Feagan BG, D’Haens G, et al. Ozanimod as induction and maintenance therapy for ulcerative colitis. N Engl J Med. 2021;385(14):1280–1291. doi:10.1056/NEJMoa2033617
60. Wang J, Goren I, Yang B, et al. Review article: the sphingosine 1 phosphate/sphingosine 1 phosphate receptor axis - a unique therapeutic target in inflammatory bowel disease. Aliment Pharmacol Ther. 2022;55(3):277–291. doi:10.1111/apt.16741
61. Verstockt B, Vetrano S, Salas A, Nayeri S, Duijvestein M, Vande Casteele N. Sphingosine 1-phosphate modulation and immune cell trafficking in inflammatory bowel disease. Nat Rev. 2022;19:351–366.
62. Peng KY, Gu JF, Su SL, et al. Salvia miltiorrhiza stems and leaves total phenolic acids combination with tanshinone protect against DSS-induced ulcerative colitis through inhibiting TLR4/PI3K/AKT/mTOR signaling pathway in mice. J Ethnopharmacol. 2021;264:113052. doi:10.1016/j.jep.2020.113052
63. Jiang W, Han YP, Hu M, Bao XQ, Yan Y, Chen G. A study on regulatory mechanism of miR-223 in ulcerative colitis through PI3K/Akt-mTOR signaling pathway. Eur Rev Med Pharmacol Sci. 2019;23(11):4865–4872. doi:10.26355/eurrev_201906_18074
64. Chen P-Y, Yuan C, Hong Z-C, et al. Revealing the mechanism of “Huai Hua San” in the treatment of ulcerative colitis based on network pharmacology and experimental study. J Ethnopharmacol. 2021;281:114321.
65. Dong L, Du H, Zhang M, et al. Anti-inflammatory effect of Rhein on ulcerative colitis via inhibiting PI3K/Akt/mTOR signaling pathway and regulating gut microbiota. Phytother Res. 2022;36(5):2081–2094. doi:10.1002/ptr.7429
66. González-Domínguez R, Jáuregui O, Queipo-Ortuño MI, Andrés-Lacueva C. Characterization of the human exposome by a comprehensive and quantitative large-scale multianalyte metabolomics platform. Anal Chem. 2020;92(20):13767–13775. doi:10.1021/acs.analchem.0c02008
 © 2022 The Author(s). This work is published and licensed by Dove Medical Press Limited. The full terms of this license are available at https://www.dovepress.com/terms.php and incorporate the Creative Commons Attribution - Non Commercial (unported, v3.0) License.
By accessing the work you hereby accept the Terms. Non-commercial uses of the work are permitted without any further permission from Dove Medical Press Limited, provided the work is properly attributed. For permission for commercial use of this work, please see paragraphs 4.2 and 5 of our Terms.
© 2022 The Author(s). This work is published and licensed by Dove Medical Press Limited. The full terms of this license are available at https://www.dovepress.com/terms.php and incorporate the Creative Commons Attribution - Non Commercial (unported, v3.0) License.
By accessing the work you hereby accept the Terms. Non-commercial uses of the work are permitted without any further permission from Dove Medical Press Limited, provided the work is properly attributed. For permission for commercial use of this work, please see paragraphs 4.2 and 5 of our Terms.