")
Back to Journals » Cancer Management and Research » Volume 14
Integrated Bioinformatics Analysis and Validation of the Prognostic Value of RBM10 Expression in Hepatocellular Carcinoma
Authors Pang SJ, Sun Z, Lu WF, Si-Ma H, Lin ZP, Shi Y, Yang YC, Zhao XJ, Yang GS, Jin GZ, Yang N
Received 17 November 2021
Accepted for publication 11 February 2022
Published 4 March 2022 Volume 2022:14 Pages 969—980
DOI https://doi.org/10.2147/CMAR.S349884
Checked for plagiarism Yes
Review by Single anonymous peer review
Peer reviewer comments 2
Editor who approved publication: Professor Seema Singh
Shu-Jie Pang,1,* Zhe Sun,1,* Wen-Feng Lu,1,* Hui Si-Ma,1 Zhi-Peng Lin,2 Yang Shi,1 Ying-Cheng Yang,1 Xi-Jun Zhao,1 Guang-Shun Yang,1 Guang-Zhi Jin,3 Ning Yang1
1Department V of Hepatic Surgery, Eastern Hepatobiliary Surgery Hospital, Second Military Medical University, Shanghai, 200438, People’s Republic of China; 2Department of Hepatobiliary Surgery, The 940th Hospital of CPLA Joint Logistics Support Force, Lanzhou, 730050, People’s Republic of China; 3Hongqiao International Institute of Medicine, Tongren Hospital, Shanghai Jiao Tong University School of Medicine, Shanghai, 200336, People’s Republic of China
*These authors contributed equally to this work
Correspondence: Ning Yang, Department V of Hepatic Surgery, Eastern Hepatobiliary Surgery Hospital, Second Military Medical University, Shanghai, 200438, People’s Republic of China, Tel +86 21 81877591, Fax +86 21 6556 6851, Email [email protected] Guang-Zhi Jin, Hongqiao International Institute of Medicine, Tongren Hospital, Shanghai Jiao Tong University School of Medicine, Shanghai, 200336, People’s Republic of China, Email [email protected]
Background: RBM10ʹs function in hepatocellular carcinoma (HCC) has rarely been addressed. We intend to explore the prognostic significance and therapeutic meaning of RBM10 in HCC in this study.
Methods: Multiple common databases were integrated to analyze the expression status and prognostic meaning of RBM10 in HCC. The relationship between RBM10 mRNA level and clinical features was also assessed. Multiple enrichment analyses of the differentially expressed genes between RBM10 high- and low- transcription groups were constructed by using R software (version 4.0.2). A Search Tool for Retrieval of Interacting Genes database was used to construct the protein–protein interaction network between RBM10 and other proteins. A tumor immune estimation resource database was employed to identify the relationship between RBM10 expression and immune cell infiltrates. The prognostic value of RBM10 expression was validated in our HCC cohort by immunohistochemistry test.
Results: The transcription of RBM10 mRNA was positively correlated with tumor histologic grade (p < 0.001), T classification (p < 0.001), and tumor stage (p < 0.001). High transcription of RBM10 in HCC predicted a dismal overall survival (p = 0.0037) and recurrence-free survival (p < 0.001). Kyoto Encyclopedia of Genes and Genomes, Gene Ontology, and Gene Set Enrichment Analysis all revealed that RBM10 was involved in the regulation of cell cycle, DNA replication, and immune-related pathways. Tumor immune estimation analysis revealed that RBM10 transcription was positively related to multiple immune cell infiltrates and the expressions of PD-1 and PD-L1.
Conclusion: RBM10 was demonstrated to be a dismal prognostic factor and a potential biomarker for immune therapy in HCC in that it may be involved in the immune-related signaling pathways.
Keywords: RBM10, hepatocellular carcinoma, prognosis, differentially expressed gene, integrated bioinformatics analysis
Background
Liver cancer ranks the seventh most prevalent malignancy and the second leading cause of cancer-related mortality worldwide.1 Hepatocellular carcinoma (HCC) is the predominant type of primary liver cancer, accounting for 85–90% of all primary liver cases.2 Currently, surgical resection remains the mainstay of treatment for early-stage HCC. However, the resection rate of HCC is relatively low because most HCC cases were already in advanced stages at diagnosis mainly due to the lack of specific symptoms.3,4 Despite tremendous therapeutic advancements in recent years, the prognosis of HCC remains dismal due to its aggressive biological characters.5 Thus, it is of great significance to identify new diagnostic and prognostic markers for early detection, treatment, and prognosis prediction of the disease.
RNA-binding protein 10 (RBM10) is an important member of the RNA-binding protein family, containing two RNA recognition motifs for alternative RNA splicing, which could lead to the regulation of target gene expression after transcription.6 Depending on its function in RNA splicing, RBM10 participates in the regulation of multiple biological processes, including cell apoptosis, proliferation, cell cycle arrest, and inflammatory response.7–10 Most previous studies on RBM10 have mainly focused on the relationship between its mutation status and disease occurrence. For instance, it was found that RBM10 mutation was the root cause of Talipes equinovarus, atrial septal defect (ASD), Robin sequence (TARP) syndrome.11 Some recent studies demonstrated that the expression level of RBM10 was associated with the regulation of cancer proliferation and metastasis.12 Some studies in various cancer types suggest that RBM10 may act as a tumor suppressor.13–15 However, the role of RBM10 in HCC remains uncertain. Therefore, clarification of the specific role of RBM10 in HCC may throw light on the early detection and prognosis monitoring of HCC. The present study aimed to clarify the prognostic significance and potential role of RBM10 in HCC based on existing public databases, and validate its prognostic value in our HCC cohort by using multiple bioinformatics analysis methods.
Materials and Methods
Raw Data of HCC Patients in Common Databases and Our Cohort
mRNA transcriptional data of HCC and normal liver tissues were downloaded from The Cancer Genome Atlas (TCGA) or Gene Expression Omnibus (GEO) databases (GSE112971, GSE60502). As both two datasets contain RNA-seq data of unpaired or paired HCC-normal tissues respectively which could testify the result of RBM10 expression difference between LIHC and normal liver tissue derived from the TCGA database, the above two datasets were analyzed in the current study. Survival data and clinical features were extracted from the clinical records of the patients in the TCGA. Clinicopathological characteristics and survival data of our HCC patient cohort were retrospectively collected and reviewed. They included 262 patients who received curative surgery in our hospital between January 2007 and January 2009. They were followed up postoperatively till July 2014. Of them, 21 patients were lost to follow-up, and finally, 241 patients were included for analysis.
Identification of Differentially Expressed Genes (DEGs)
DEGs between 374 liver cancer tissue samples and 50 normal liver tissue samples were identified with software R (version 4.0.3) by using the Limma package.16 |logFC| > 0.6 and p < 0.001 were regarded as the thresholds to recognize the DEGs. The volcano plot was constructed by employing the R package “ggpubr”.
Functional Enrichment Analysis
To determine the DEGs pattern between HCC patients with high and low RBM10 transcription, HCC patients in the TCGA database were divided into two groups according to the median RBM10 transcription value. DEGs were determined by using the Limma package with the absolute value of logFC (log fold change) ≥ 1 and p value ≤ 0.001. The functions of these identified DEGs were explored by Gene Ontology (GO)17 and Kyoto Encyclopedia of Genes and Genomes (KEGG)18 pathway enrichment analysis. GO analysis mainly focused on three components: biological process (BP), cellular component (CC), and molecular function (MF), and KEGG analysis mainly evaluated the pathways that DEGs may be involved in. The results were visualized using cluster Profiler and ggplot2 R packages (threshold: p < 0.05).
Construction of the Protein–Protein Interaction (PPI) Network
The PPI network was constructed by utilizing the Search Tool for the Retrieval of Interacting Genes/Proteins (STRING; string-db.org/).19 In the current study, only experimentally validated interactions with a combined score > 0.7 were selected as significant.
Gene Set Enrichment Analysis (GSEA)
The GSEA 4.1.0 software was utilized to carry out GSEA with the gene set “c2.cp.kegg.v6.2.symbols.gmt”.20 The permutation number was established as 1000, and a p-value < 0.05 was considered significant. The enrichment plot of GSEA was constructed by using the R package of ggplot.
Relationship Between RBM10 Transcription and Immune Cell Infiltration
The relationships between RBM10 transcription and immune cell infiltration and immunotherapy markers were determined by using the Tumor Immune Estimation Resource (TIMER) database.21
Immunohistochemistry (IHC)
Tumor sections were incubated with commercial rabbit polyclonal antibodies against RBM10 (Abcam, ab224149) at 1:50 dilution overnight at 4°C. Then, the sections were incubated with the secondary antibody (1:1000 dilution; Thermo Fisher Scientific, A-10042, Massachusetts, USA) at 37°C for 1 h, and then covered by 3, 3-diaminobenzidine (DAB) (ZLI-9032, Zhongshan Biotech, Beijing, China). Subsequently, all fields were observed under the light microscope (Olympus 600 auto-biochemical analyzer, Tokyo, Japan). The control experiment without the primary antibody demonstrated that the signals observed were specific. The IHC staining intensity was quantified by software Image-Pro Plus, and the best cut-off value to identify RBM10 high expression and low expression was defined as the median of the intensity values.
Statistical Analysis
Survival curves were generated from the Gene Expression Profiling Interactive Analysis (GEPIA) website22 based on data in the TCGA database. The relationships between the clinicopathological characteristics and RBM10 expression were evaluated by Student’s t-test. For our HCC cohort, Kaplan–Meier (K-M) survival curves were constructed with GraphPad Prism 6.0 software (GraphPad Software, La Jolla, CA, United States). p < 0.05 was considered as statistically significant in the current study.
Results
RBM10 is Up-Regulated in Various Tumor Types
RBM10 transcriptions in multiple tumor types were determined by using the online service of TIMER 2.0. As shown in Figure 1, RBM10 transcription was up-regulated in a variety of tumor types, especially HCC (black framed) as compared with that in their normal counterparts.
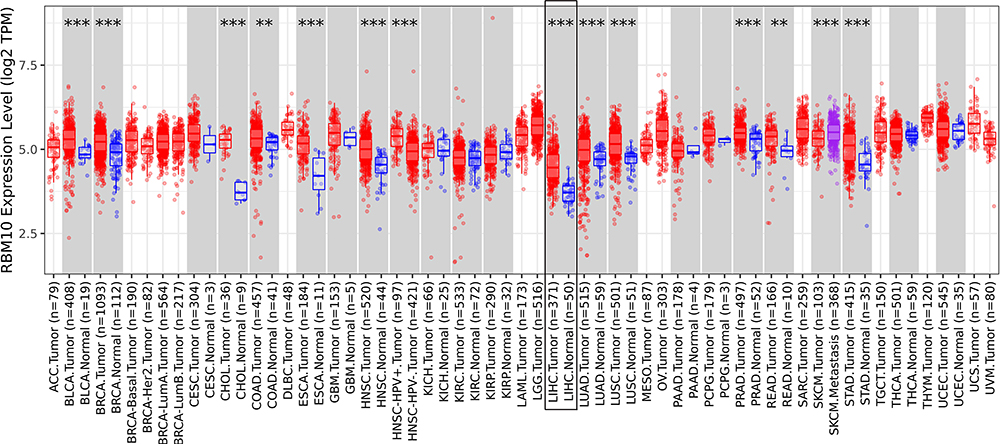 |
Figure 1 RBM10 is up-regulated in various tumor types. **represents p < 0.01; *** represents p < 0.001. |
Transcriptional Level of RBM10 in HCC
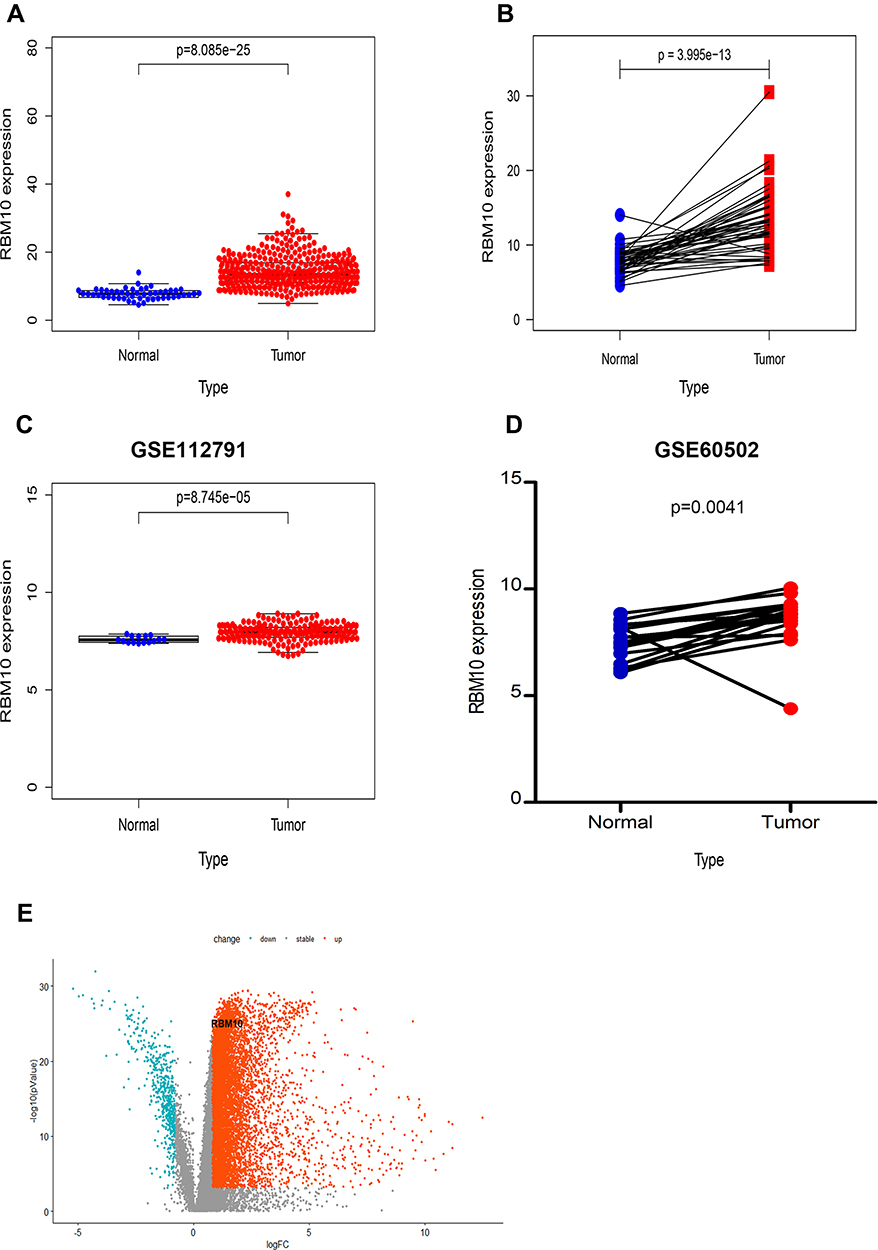
Raw data of LIHC RNA-seq (Fragments Per Kilobase Million, FPKM) were downloaded from the TCGA database and analyzed with R software. Transcriptional levels of RBM10 in 374 HCC tissue samples and 50 normal liver tissue samples were extracted and compared. It was found that RBM10 transcription was up-regulated in the HCC tissue as compared with that in the normal liver parenchyma with a p-value < 0.0001 (Figure 2A). Similarly, in the paired HCC-normal liver tissue, RBM10 was also highly expressed in the HCC tissue (p < 0.0001) (Figure 2B). These results were validated in the GEO database (Figure 2C and D). A volcano plot was constructed to show DEGs, and RBM10 was lined out (Figure 2E).


Relationship Between Transcriptional Levels of RBM10 and Clinicopathological Characteristics and Prognosis of HCC Patients
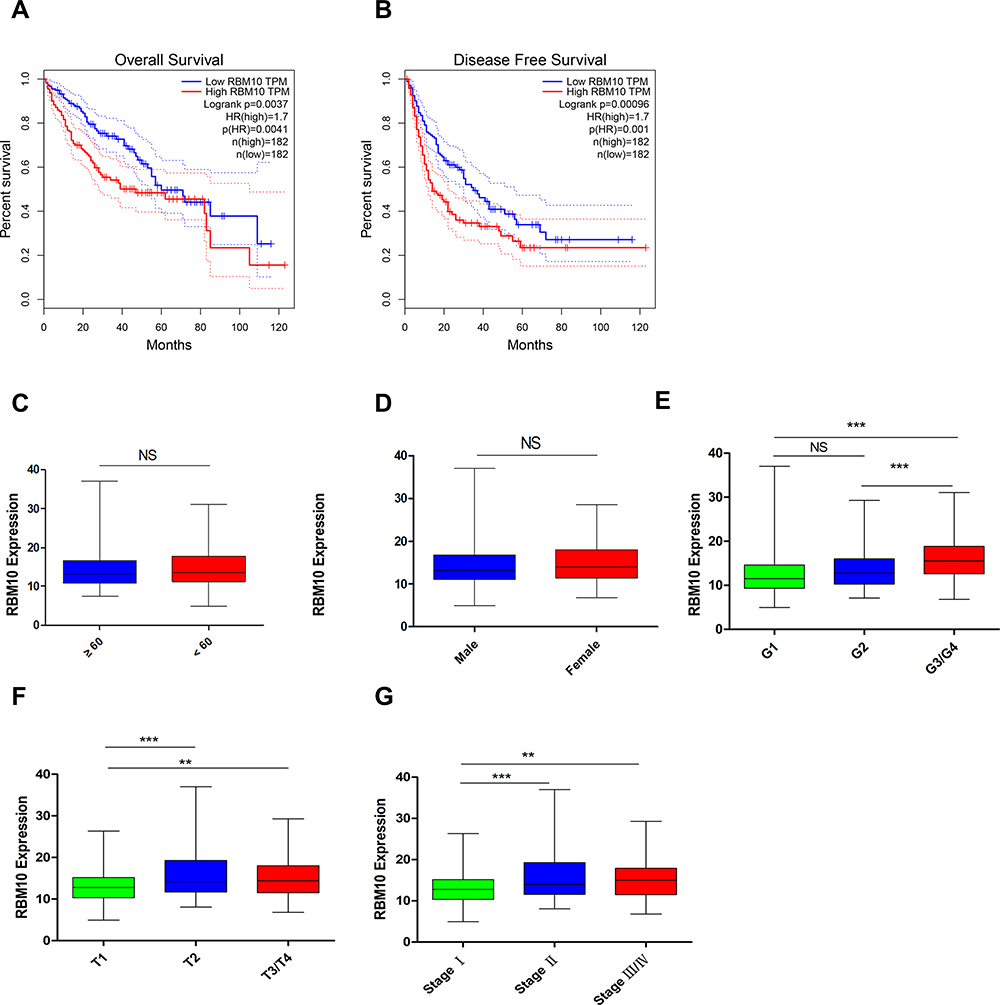
Survival data and RNA-seq data in the TCGA-LIHC patients were combined to investigate the potential prognostic meaning of RBM10 transcription. Compared with HCC patients with low transcriptional levels of RBM10, HCC patients with high transcriptional levels of RBM10 were associated with a dismal overall survival (OS) (Figure 3A) and recurrence free-survival (RFS) (Figure 3B). On account of the poor prognostic biomarker characteristic of RBM10, we speculated that high transcriptional levels of RBM10 might be related to some aggressive biological features of HCC. Thus, the relationships between RBM10 transcription and clinicopathological characteristics of HCC patients were analyzed, and the results showed that transcriptional levels of RBM10 were only related to tumor T-stage and TNM stage rather than gender, age, or G-stage (Figure 3C–G).


GO and KEGG Enrichment Analysis
Compared with the low RBM10 transcription group, 751 up-regulated genes and 83 down-regulated genes were discovered. As shown in Figure 4A and B, GO enrichment analysis revealed that the DEGs almost mapped to the DNA replication GO terms, such as DNA replication and DNA-dependent ATPase activity. KEGG enrichment analysis also displayed the enrichment of DNA replication (Figure 4C and D). GSEA analysis was also performed to validate the signaling pathway that RBM10 may be involved in. The results showed that the DEGs in the high RBM10 transcription group were mainly enriched in the cell cycle, DNA replication-related pathways and immune-related pathways (Figure 4E).
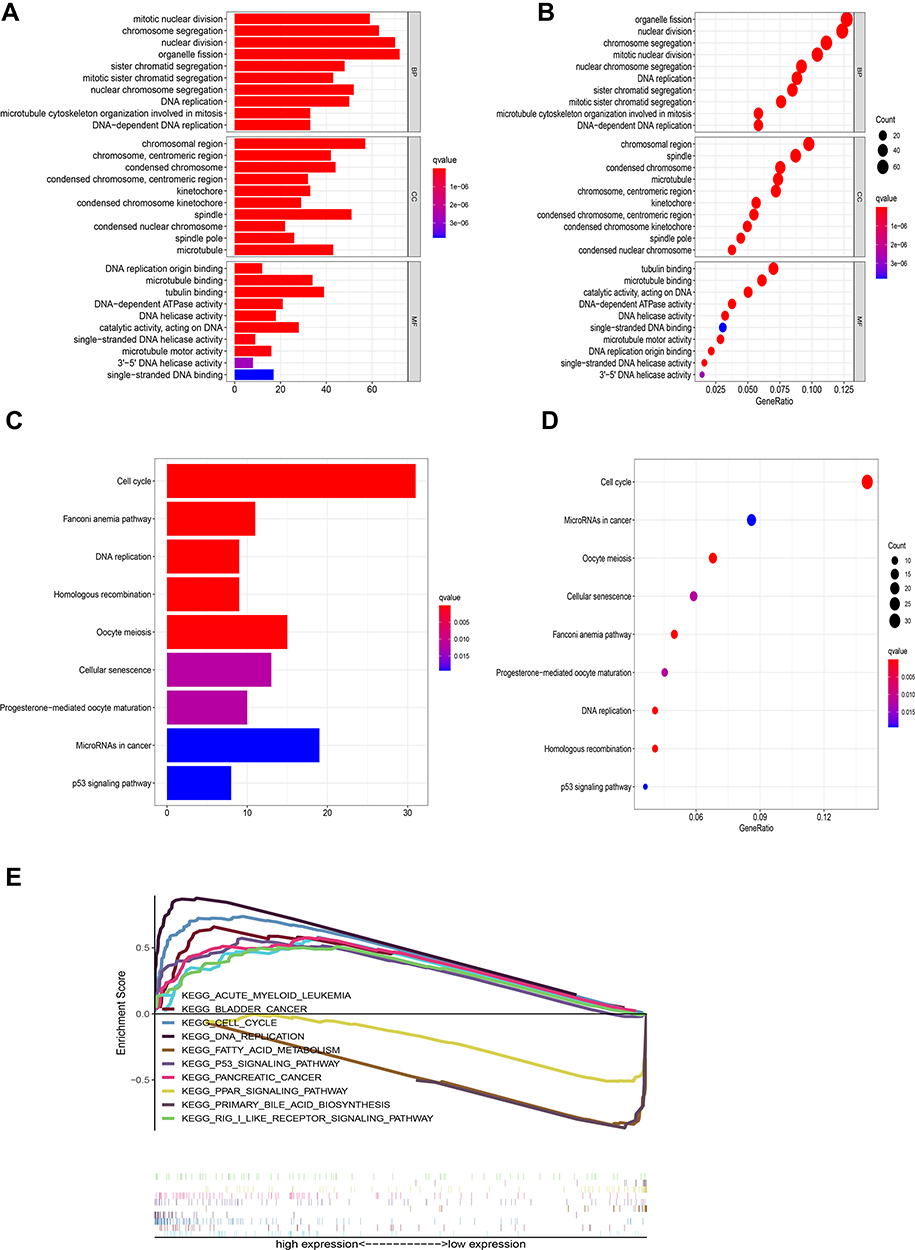 |
Figure 4 Enrichment plots of GO, KEGG, and GSEA. (A) GO pathways (bar plot); (B) GO pathways (bubble plot); (C) KEGG pathways (bar plot); (D) KEGG pathways (bubble plot); (E) GSEA pathways. |
Interaction Analysis of the PPI Network
The STRING database was used to construct a PPI network between RBM10 and other proteins. Only experimentally validated interaction with a combined score ≥ 0.7 was considered significant. As shown in Figure 5, RBM10 was implicated in the combination with Cornichon (CNIH), DLG (Discs Large MAGUK Scaffold Protein), and Splicing Factor (SF) family.
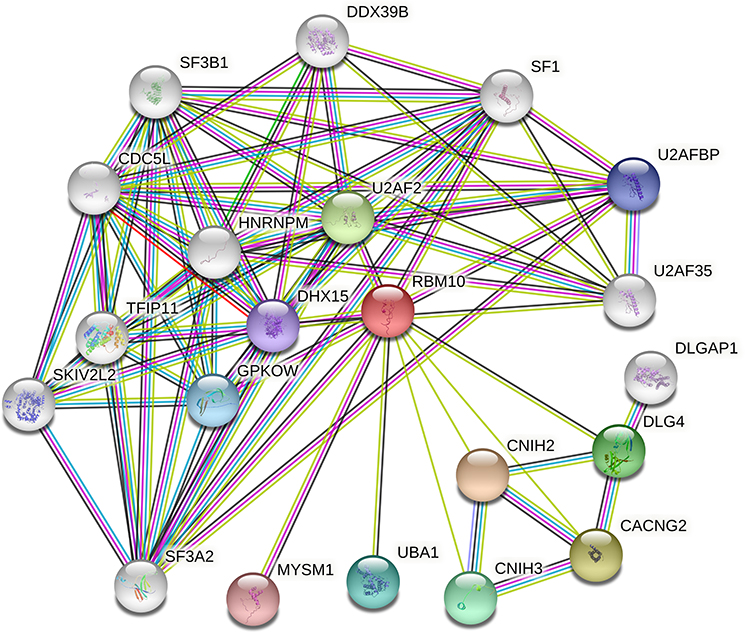 |
Figure 5 Protein–protein interaction network between RBM10 and other proteins. |
RBM10 Transcription is Related to Tumor Immune Cell Infiltration and Immune Marker Transcription
Knowing that RBM10 was engaged in immune-related pathways, as illustrated in Figure 4E, we hypothesized that RBM10 was linked to HCC tumor immunity. Thus, the TIMER database was used to explore the relationship between RBM10 transcription and immune cell infiltration. It was found that RBM10 transcription was positively related to multiple immune cell (eg CD8+ cell and macrophage) infiltration to the HCC tissue (Figure 6A). In addition, we found that RBM10 transcription was positively correlated with the transcription of PD1 (PDCD1) and PD-L1 (CD274)(Figure 6B), suggesting that RBM10 may play a therapeutic role in immunotherapy for HCC.
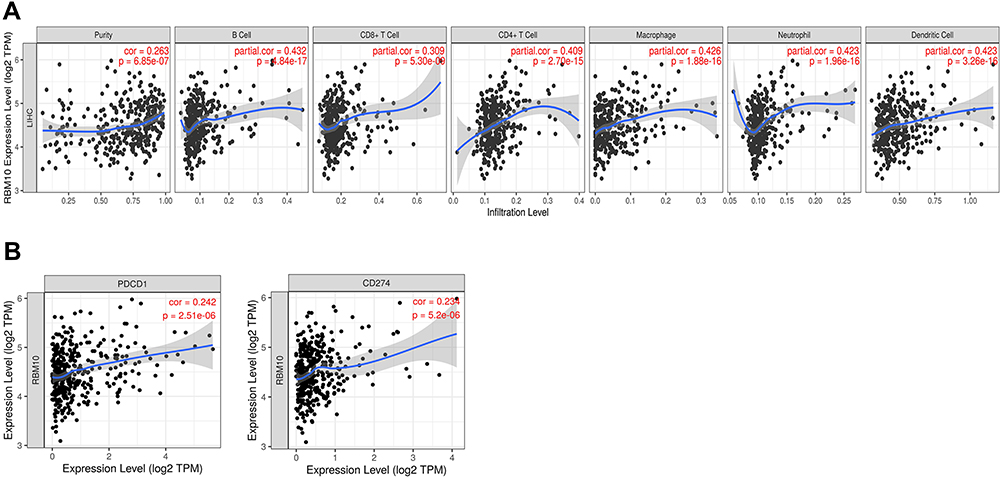 |
Figure 6 RBM10 relates to tumor immune cell infiltration and immune marker expression. (A) RBM10 transcription and tumor immune cell infiltration; (B) RBM10 transcription is positively correlated with PD-1 and PD-L1 expression. |
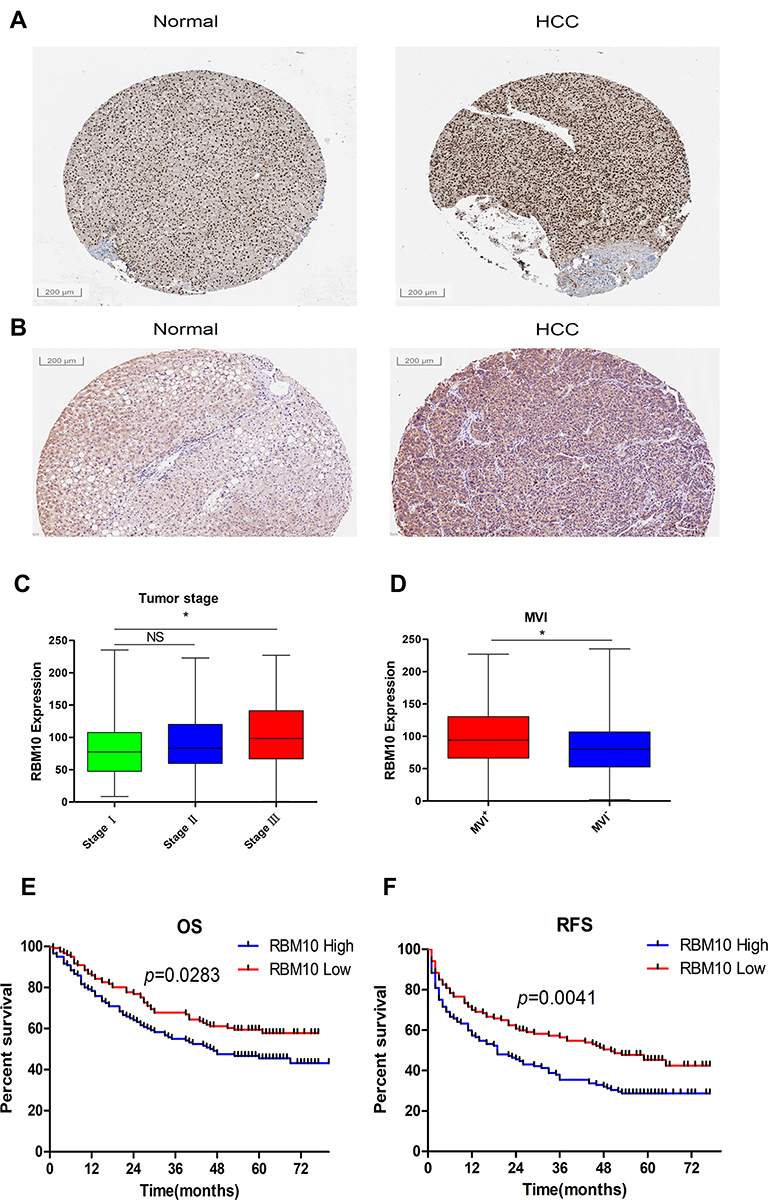
High Expression of RBM10 Correlates with Aggressive Tumor Characteristics and Predicts a Poor Prognosis
To testify the results originated from the public database, IHC was employed to assess the expression characteristic of RBM10 in our HCC cohort. Meanwhile, the Human Protein Atlas (HPA) website was checked to compare the characteristics of RBM10 expression in normal liver tissue samples and HCC tissue samples. The result showed that RBM10 was highly expressed in a certain number of HCC tissue samples (Figure 7A). And, our cohort also revealed a similar result (Figure 7B). After integrating the expression levels of RBM10 in HCC tissues with clinicopathologic characteristics and prognosis of HCC patients in our cohort, we found that high expression of RBM10 were also correlated with a more advanced tumor stage (Figure 7C) and microvascular invasion (MVI) (Figure 7D). In addition, elevated expression of RBM10 was correlated to a worse OS and DFS (Figure 7E and F).


Discussion
The prognosis of HCC remains dismal due to its aggressive biological nature. Even after radical treatment, the 5-year RFS is only about 30%.23 It is therefore urgent to discover new recurrence-related and therapeutic biomarkers to improve the outcome of recurrence surveillance and postoperative targeted therapy of HCC. In the present study, we tried to explore whether RBM10 could serve as a prognostic and therapeutic biomarker for HCC.
Recent studies24,25 have demonstrated that multiple members of the RBM family can suppress tumor progression. However, the role of RBM10 in different tumors remains disputable. Previous studies reported that RBM10 acted as a tumor suppressor in breast cancer, osteosarcoma, and pancreatic cancer.14,26,27 Loiselle et al28 reported that RBM10 could promote lung cancer cell proliferation and other transformation-associated processes. However, the prognostic significance of RBM10in HCC has rarely been discussed. The present study aimed to explore the prognostic meaning and biological function of RBM10 in HCC by using the common data in a variety of databases.
In the present study, we used public data in GEO and TCGA databases in combination with our HCC patient cohort to uncover the expression pattern and prognostic significance of RBM10. The result showed that RBM10 was up-regulated in the HCC tissue as compared with that in the normal liver tissue. Furthermore, high transcription of RBM10 in HCC predicted a dismal DFS and OS. Our data revealed that high expression of RBM10 was correlated with an advanced tumor stage and microvascular invasion, suggesting that RBM10 may play a role in promoting HCC progression and serve as an aggressive biological marker of HCC. RBM10 is a member of the RBM family that can perform a function in targeted RNA metabolism and pre-mRNA splicing concerning the cell cycle.6 In this way, the RBM10 family can participate in the regulation of tumor cell proliferation and metastasis. However, further molecular biology research is needed to determine how RBM10 promotes HCC progression.
To gain more insights into the signaling pathway in which RBM10 may be involved, we performed KEGG and GO enrichment analyses and found that RBM10 truly participated in regulating gene expressions in terms of cell cycle and DNA replication in HCC. Various classical splicing regulators have been shown to display oncogenic activities.29,30 A previous study31 revealed that misregulation of RBM5, RBM6, and RBM10 affected tumor progression by targeting NUMB in lung cancer. Interestingly, Zhao et al32 reported that RBM10 could suppress tumor cell proliferation and played a protective role in HCC. Their results are not consistent with the results obtained from the common databases. In consideration of the absence of a comprehensive mechanism-related research, a high-quality biomolecular study is required to testify the regulatory function of RBM10 in HCC.
In the present study, GSEA showed that RBM10 had an impact on multiple immune-related signaling pathways. In addition to its interaction with the DLG family, RBM10 was also reported to be high-expressed in immune cells, especially memory CD8 T-cells.33 All these results suggest that RBM10 may play a part in immune regulation in HCC. Consistently, RBM10 was observed to be positively correlated with CD8+ T cell infiltration and expression of PD-1 and PD-L1, suggesting that RBM10 may be a biomarker for immunotherapy of HCC.
Conclusion
In the current study, we analyzed multiple common databases in combination with our HCC cohort and found that up-regulated RBM10 was a dismal prognostic factor and a potential biomarker for immunotherapy, which may be engaged in immune-related signaling pathways. However, further clinical and fundamental biological studies are warranted to verify the function of RBM10 in HCC.
Abbreviations
HCC, hepatocellular carcinoma; RBM10, RNA-binding protein 10; TEV, talipes equinovarus, ASD, atrial septal defect, TARP, Robin sequence syndrome; TCGA, The Cancer Genome Atlas; GEO, Gene Expression Omnibus; DEGs, Differentially expressed genes; FC, Foldchang; GO, Gene ontology; KEGG, Kyoto Encyclopedia of Genes and Genomes; BP, biological process; CC, cellular component; MF, molecular function; PPI, protein–protein interaction; Search Tool for the Retrieval of Interacting Genes/Proteins; GSEA, Gene Set Enrichment Analysis; TIMER, Tumor Immune Estimation Resource; IHC, immunohistochemistry; HPA, Human Protein Atlas; GEPIA, Gene Expression Profiling Interactive Analysis; K-M, Kaplan–Meier; OS, overall survival; RFS, recurrence free survival; MVI, microvascular invasion; CNIH, Cornichon; DLG, Discs Large MAGUK Scaffold Protein; SF, splicing factor.
Data Sharing Statement
Our cohort data are available from the corresponding author (Ning Yang, email: [email protected]) upon reasonable request. Public datasets were analyzed in this work. These data can be found in their official websites: http://cancergenome.nih.gov; https://www.ncbi.nlm.nih.gov/geo/query/acc.cgi?acc=GSE112791; https://www.ncbi.nlm.nih.gov/geo/query/acc.cgi.
Ethics Approval and Consent to Participate
This retrospective study was approved by the research ethics committee of the Eastern Hepatobiliary Surgery Hospital and complied with the Declaration of Helsinki Principles. Informed consent was obtained from all patients for their data to be used in the study.
Author Contributions
NY, GJ, and GY contributed to the conception and design of the study. SP, ZS, and WL organized the database and performed the statistical analysis. HS, ZL, YS, YY, and XZ took part in the statistical analysis. NY and GJ wrote the first draft of the manuscript. All authors contributed to data analysis, drafting, or revising the article, have agreed on the journal to which the article will be submitted, gave final approval of the version to be published, and agree to be accountable for all aspects of the work.
Funding
This study was supported by the State Key Project for Liver Cancer (2012ZX10002017-004, 2017ZX10203205-001-002). The funder was not involved in the study design, collection, analysis, interpretation of data, the writing of this article, or the decision to submit it for publication.
Disclosure
The authors report no conflicts of interest in this work.
References
1. Llovet JM, Zucman-Rossi J, Pikarsky E, et al. Hepatocellular carcinoma. Nat Rev Dis Primers. 2016;2. doi:10.1038/nrdp.2016.18
2. Yang JD, Hainaut P, Gores GJ, Amadou A, Plymoth A, Roberts LR. A global view of hepatocellular carcinoma: trends, risk, prevention and management. Nat Rev Gastroenterol Hepatol. 2019;16(10):589–604. doi:10.1038/s41575-019-0186-y
3. Vibert E, Schwartz M, Olthoff KM. Advances in resection and transplantation for hepatocellular carcinoma. J Hepatol. 2020;72(2):262–276. doi:10.1016/j.jhep.2019.11.017
4. de Lope CR, Tremosini S, Forner A, Reig M, Bruix J. Management of HCC. J Hepatol. 2012;56:S75–S87. doi:10.1016/S0168-8278(12)60009-9
5. Kanwal F, Singal AG. Surveillance for hepatocellular carcinoma: current best practice and future direction. Gastroenterology. 2019;157(1):54–64. doi:10.1053/j.gastro.2019.02.049
6. Inoue A. RBM10: structure, functions, and associated diseases. Gene. 2021;783:145463.
7. Mohan N, Kumar V, Kandala DT, Kartha CC, Laishram RS. A splicing-independent function of RBM10 controls specific 3 UTR processing to regulate cardiac hypertrophy. Cell Rep. 2018;24(13):3539–3553. doi:10.1016/j.celrep.2018.08.077
8. Jung JH, Lee H, Cao B, Liao P, Zeng SX, Lu H. RNA-binding motif protein 10 induces apoptosis and suppresses proliferation by activating p53. Oncogene. 2020;39(5):1031–1040. doi:10.1038/s41388-019-1034-9
9. Rodor J, FitzPatrick DR, Eyras E, Caceres JF. The RNA-binding landscape of RBM10 and its role in alternative splicing regulation in models of mouse early development. RNA Biol. 2017;14(1):45–57. doi:10.1080/15476286.2016.1247148
10. Atsumi T, Suzuki H, Jiang JJ, et al. Rbm10 regulates inflammation development via alternative splicing of Dnmt3b. Int Immunol. 2017;29(12):581–591. doi:10.1093/intimm/dxx067
11. Powis Z, Hart A, Cherny S, et al. Clinical diagnostic exome evaluation for an infant with a lethal disorder: genetic diagnosis of TARP syndrome and expansion of the phenotype in a patient with a newly reported RBM10 alteration. BMC Med Genet. 2017;18(1). doi:10.1186/s12881-017-0426-3.
12. Cao YS, Di X, Zhang QH, Li RW, Wang K. RBM10 regulates tumor apoptosis, proliferation, and metastasis. Front Oncol. 2021;11:158.
13. Zhang SR, Bao YF, Shen XF, et al. RNA binding motif protein 10 suppresses lung cancer progression by controlling alternative splicing of eukaryotic translation initiation factor 4H. EbioMedicine. 2020;61:103067.
14. Xiao WJ, Chen X, Li X, et al. RBM10 regulates human TERT gene splicing and inhibits pancreatic cancer progression. Am J Cancer Res. 2021;11(1):157.
15. Dou XQ, Chen XJ, Zhou Q, Wen MX, Zhang SZ, Zhang SQ. miR-335 modulates Numb alternative splicing via targeting RBM10 in endometrial cancer. Kaohsiung J Med Sci. 2020;36(3):171–177. doi:10.1002/kjm2.12149
16. Ritchie ME, Phipson B, Wu D, et al. limma powers differential expression analyses for RNA-sequencing and microarray studies. Nucleic Acids Res. 2015;43(7):e47. doi:10.1093/nar/gkv007
17. Blake JA, Christie KR, Dolan ME, et al. Gene ontology consortium: going forward. Nucleic Acids Res. 2015;43(D1):D1049–D1056.
18. Kanehisa M, Goto S, Sato Y, Furumichi M, Tanabe M. KEGG for integration and interpretation of large-scale molecular data sets. Nucleic Acids Res. 2012;40(D1):D109–D114. doi:10.1093/nar/gkr988
19. Szklarczyk D, Gable AL, Nastou KC, et al. The STRING database in 2021: customizable protein-protein networks, and functional characterization of user-uploaded gene/measurement sets. Nucleic Acids Res. 2021;49(D1):D605–D612. doi:10.1093/nar/gkaa1074
20. Subramanian A, Kuehn H, Gould J, Tamayo P, Mesirov JP. GSEA-P: a desktop application for gene set enrichment analysis. Bioinformatics. 2007;23(23):3251–3253. doi:10.1093/bioinformatics/btm369
21. Tang ZF, Li CW, Kang BX, Gao G, Li C, Zhang ZM. GEPIA: a web server for cancer and normal gene expression profiling and interactive analyses. Nucleic Acids Res. 2017;45(W1):W98–W102. doi:10.1093/nar/gkx247
22. Li TW, Fan JY, Wang BB, et al. TIMER: a web server for comprehensive analysis of tumor-infiltrating immune cells. Cancer Res. 2017;77(21):E108–E110. doi:10.1158/0008-5472.CAN-17-0307
23. Tabrizian P, Jibara G, Shrager B, Schwartz M, Roayaie S. Recurrence of hepatocellular cancer after resection patterns, treatments, and prognosis. Ann Surg. 2015;261(5):947–955. doi:10.1097/SLA.0000000000000710
24. Fushimi K, Ray P, Kar A, Wang L, Sutherland LC, Wu JY. Up-regulation of the proapoptotic caspase 2 splicing isoform by a candidate tumor suppressor, RBM5. Proc Natl Acad Sci USA. 2008;105(41):15708–15713. doi:10.1073/pnas.0805569105
25. David CJ, Manley JL. Alternative pre-mRNA splicing regulation in cancer: pathways and programs unhinged. Genes Dev. 2010;24(21):2343–2364. doi:10.1101/gad.1973010
26. Schneider J, Gomez-Esquer F, Diaz-Gil G, Torrejon R, Pollan M. mRNA expression of the putative antimetastatic gene BRMS1 and of apoptosis-related genes in breast cancer. Cancer Genomics Proteomics. 2011;8(4):195–197.
27. Han LP, Wang CP, Han SL. Overexpression of RBM10 induces osteosarcoma cell apoptosis and inhibits cell proliferation and migration. MS-Med Sci. 2018;34:81–86.
28. Loiselle JJ, Roy JG, Sutherland LC. RBM10 promotes transformation-associated processes in small cell lung cancer and is directly regulated by RBM5. PLoS One. 2017;12(6):Jun. doi:10.1371/journal.pone.0180258
29. Oltean S, Bates DO. Hallmarks of alternative splicing in cancer. Oncogene. 2014;33(46):5311–5318. doi:10.1038/onc.2013.533
30. Pio R, Montuenga LM. Alternative splicing in lung cancer. J Thorac Surg. 2009;4(6):674–678. doi:10.1097/JTO.0b013e3181a520dc
31. Bechara EG, Sebestyen E, Bernardis I, Eyras E, Valcarcel J. RBM5, 6, and 10 differentially regulate NUMB alternative splicing to control cancer cell proliferation. Mol Cell. 2013;52(5):720–733. doi:10.1016/j.molcel.2013.11.010
32. Zhao Z, Li J, Shen F. Protective effect of the RNA-binding protein RBM10 in hepatocellular carcinoma. Eur Rev Med Pharmacol Sci. 2020;24(11):6005–6013. doi:10.26355/eurrev_202006_21494
33. Adachi K, Davis MM. T-cell receptor ligation induces distinct signaling pathways in naive vs. antigen-experienced T cells. Proc Natl Acad Sci U S A. 2011;108(4):1549–1554. doi:10.1073/pnas.1017340108
 © 2022 The Author(s). This work is published and licensed by Dove Medical Press Limited. The full terms of this license are available at https://www.dovepress.com/terms.php and incorporate the Creative Commons Attribution - Non Commercial (unported, v3.0) License.
By accessing the work you hereby accept the Terms. Non-commercial uses of the work are permitted without any further permission from Dove Medical Press Limited, provided the work is properly attributed. For permission for commercial use of this work, please see paragraphs 4.2 and 5 of our Terms.
© 2022 The Author(s). This work is published and licensed by Dove Medical Press Limited. The full terms of this license are available at https://www.dovepress.com/terms.php and incorporate the Creative Commons Attribution - Non Commercial (unported, v3.0) License.
By accessing the work you hereby accept the Terms. Non-commercial uses of the work are permitted without any further permission from Dove Medical Press Limited, provided the work is properly attributed. For permission for commercial use of this work, please see paragraphs 4.2 and 5 of our Terms.