")
Back to Journals » Cancer Management and Research » Volume 11
Integrated assessment of PD-L1 expression and molecular classification facilitates therapy selection and prognosis prediction in gastric cancer
Authors Sun Y, Yu W, Guan W, Cai L, Qiao M, Zheng L, Jiang R, Wang R, Wang L
Received 21 February 2019
Accepted for publication 20 May 2019
Published 10 July 2019 Volume 2019:11 Pages 6397—6410
DOI https://doi.org/10.2147/CMAR.S206189
Checked for plagiarism Yes
Review by Single anonymous peer review
Peer reviewer comments 2
Editor who approved publication: Dr Kenan Onel
Yeqi Sun,1,* Wenwei Yu,1,* Wenbin Guan,1,* Lei Cai,1 Meng Qiao,1 Leizhen Zheng,2 Ruiqi Jiang,1 Ruifen Wang,1 Lifeng Wang1
1Department of Pathology, Xinhua Hospital, School of Medicine, Shanghai Jiao Tong University, Shanghai 200092, People’s Republic of China; 2Department of Oncology, Xinhua Hospital, School of Medicine, Shanghai Jiao Tong University, Shanghai 200092, People’s Republic of China
*These authors contributed equally to this work
Purpose: Targeting the PD-1/PD-L1 pathway has emerged as a novel therapy for cancer. To identify rational candidates for anti-PD-1/PD-L1 immunotherapy in gastric cancer (GC), the abundance of PD-L1 expression was evaluated on a kind of biomarker-based molecular classification for shaping prognosis and treatment planning.
Methods: One hundred and sixty-five GCs were classified into five subgroups using immunohistochemistry (IHC) and in situ hybridization (ISH) methods, based on a panel of seven markers (MLH1, PMS2, MSH2, MSH6, E-cadherin, P53, and Epstein-Barr virus mRNA). The expression of PD-L1 in GC tissues was analyzed immunohistochemically.
Results: The five categories (Epstein–Barr virus positivity, microsatellite instability, aberrant E-cadherin, aberrant P53 expression, and normal P53 expression) correspond to the reported molecular subgroups for similar proportions and clinicopathologic characteristics. Survival analysis indicated that subgroups with aberrant E-cadherin expression independently predicted a worse prognosis in GC patients (HR=2.51, P=0.010). The clinical and prognostic profiles produced by this stratification in nonintestinal-type GC were distinguishable from those in intestinal-type. Although PD-L1 was not a significant prognostic factor, that more frequent presence of PD-L1-positive in microsatellite instability tumors than other subtypes (P<0.010) hinted at a prolonged clinical course. Moreover, the lowest level of PD-L1 but the highest of Her2 was observed in the group of aberrant P53, namely it was suggested that there was a negative correlation between PD-L1 and Her2 overexpression.
Conclusion: Different molecular subtypes in GC may have a tendency to react differently to anti-PD-L1/PD-1 immunotherapy or anti-Her2 therapy. A combination of PD-L1 expression and this cost-effective classification strategy would be helpful for predicting prognosis and promoting personalized therapy in clinical practice.
Keywords: PD-L1, molecular classification, gastric cancer, immunohistochemistry, in situ hybridization
Introduction
Gastric cancer (GC) is the third leading cause of cancer-related death worldwide, with a particular high occurrence and mortality in Asia.1 Although there have been considerable advances in diversified therapeutics over the past decades, the 5-year survival rate of GC after treatment with curative intent is still under 40%.2–4 This disappointing outcome is usually caused by the limited capability to discern subpopulations in a heterogeneous cohort of GC patients for differential individualized therapy. Long-term used Lauren and WHO classifications are both merely based on morphologic features and far from disclosing molecular alterations about the complex and diverse biology of GC.5 Recently, the Cancer Genome Atlas (TCGA) and the Asian Cancer Research Group (ACRG) successively established classification systems of GC via comprehensive molecular analysis.6,7 Concretely, TCGA identified Epstein-Barr virus (EBV), microsatellite instability (MSI), chromosomal instability (CIN), genome stable (GS), and ACRG recognized MSI, microsatellite stable/epithelial to mesenchymal transition (MSS/EMT), MSS/TP53- (tumor protein 53 inaction), and MSS/TP53+ (tumor protein 53 activation). Even if such milestone classification greatly broadens our insights into the hidden molecular nature of GC, the demand for expensive and sophisticated high-throughput analysis technologies obviously prevents their clinical application. To overcome this, two research teams proposed an integrated classification contained five molecular subtypes through using relatively inexpensive and widely available immunohistochemistry (IHC) and in situ hybridization (ISH).8,9 Intriguingly, despite nearly uniform markers and assessment standards adopted by them in grouping, the clinical utility of this protein and mRNA expression-based stratification is doubtful as there was a huge difference in outcome prediction. Thus, a validation study of TCGA, ACRG, and integrated classification in a cohort of Chinese GC patients was implemented to systematically estimate the predicting value of this simplified molecular classification.
More importantly, what implications for current treatment strategies brought by this simplified approach is still unclear, therefore, it is imperative to combine such molecular classification with novel targets for therapy in GC. The blockade of PD-1 (program death-1)/PD-L1 (programdeath ligand-1) interaction to restore T-cell activity has emerged as a promising therapeutic avenue against various cancer types.10,11 It is increasingly acknowledged that PD-L1 as a potential predicative marker of response to immune checkpoint inhibition, which nonetheless only occur in a fraction of PD-L1-positive patients.12,13 Some impressive clinical trials of PD-1 inhibitor treatment for solid tumors uncovered that patients with mismatch repair–deficient (d-MMR) have a better prognosis than with mismatch repair–proficient (p-MMR).14–16 Hence, it is rational to speculate that GC with d-MMR and PD-L1 expression may be the prime choice for such therapy, guiding us special focus on the allocation of PD-L1 expression for molecular subtypes. Besides that, it is very attractive to identify the relationship between PD-L1 expression and clinical outcomes, owing to its prognostic relevance in GC still being a controversial issue.17–24 Meanwhile, given that Her2 antibody trastuzumab currently is the only approved first-line targeted treatment demonstrated by the ToGA trial (for Her2-positive GC patients), it is important to analyze the linkage of Her2 status with molecular subtypes and PD-L1 expression.25
Materials and methods
Patients and samples
This study was approved by the Institutional Review Boards at the Xin Hua Hospital Affiliated to Shanghai Jiao Tong University School of Medicine and conducted according to the Declaration of Helsinki. One hundred and sixty-five cases of gastric adenocarcinoma in our departmental archives with available clinical data, hematoxylin and eosin (H&E)-stained slides and formalin-fixed paraffin embedded (FFPE) blocks were enrolled in this study. These patients were treated with surgical resection of primary gastric tumors between June 2011 and December 2015. The diagnosis was confirmed by routine pathological examination after surgery. None of the patients received any preoperative radiotherapy or chemotherapy. Written informed consent was obtained from all patients who participated in the study. Pathologic parameters of all cases were reassessed in accordance to the 4th edition of WHO classification for stomach tumors.26 The time of follow-up was from initial diagnosis to September 2017 (range from 6–76 months).
Immunohistochemistry and chromogenic/fluorescence in situ hybridization
Two representative 2-mm-diameter cores were obtained from per slide of each sample with one paired normal epithelial tissue core as control and inserted into recipient paraffin blocks to construct tumor microarray (TMA). IHC of MLH1 (Clone M1, ready-to-use; Roche), PMS2 (Clone EPR3947, ready-to-use; Roche), MSH2 (Clone 219–1129, ready-to-use; Roche), MSH6 (Clone 44, ready-to-use; Roche), E-cadherin (Clone HECD1, dilution 1:50; Abcam) and P53 (Clone DO-7, dilution 1:100; Celplor), and Epstein-Barr virus mRNA (EBER) ISH (Ventana Medical Systems, Tucson AZ, USA) were performed on unstained tissue sections from each TMA. IHC for PD-L1 (Clone EiL3N, dilution 1:200; Cell signaling) and Her2 (Clone 4B5, ready-to-use; Ventana) proteins were implemented in corresponding whole-tissue sections of all cases. Immunostaining of all markers was carried on a Ventana Automated Immunostainer (Ventana Medical Systems), following the manufacturer’s protocols. Chromogenic probe for EBER was detected with ISH Iview Blue Detection Kit on Ventana BenchMark ISH system. Detection of Her2 amplification was conducted on the above Her2 IHC 2+ cases using a two-color commercial fluorescence in situ hybridization (FISH) probe (Abbott Molecular, Des Plaines, IL, USA).
Two gastrointestinal pathologists reviewed all H&E slides, immunohistochemical, and in situ hybridization slides, with no previous knowledge of the clinical or pathological parameters. The detailed procedure for immunohistochemical analysis was performed according to descriptions in prior studies and the concrete evaluation was as follows:8,9,27 A tumor was taken as d-MMR if at least one of the markers (MLH1, MSH2, MSH6, and PMS2) showed a complete loss of nuclear reactivity in conjunction with appropriate retention in background nonmalignant cells. Complete loss of membranous reactivity or reserved membranous staining less than 70% were regarded as aberrant E-cadherin expression, irrespective of whether or not they were accompanied with cytoplasmic or nuclear expression. The P53 specimens were scored for both the staining percentage (1–79% vs 0%/≥80%) and intensity (weak vs no/strong). Tumors that showed complete loss or diffuse (≥80%) and strong P53 nuclear positivity were interpreted as aberrant. Positive PD-L1 expression was defined as ≥1% membranous staining in tumor cells (TC) or tumor-infiltrating immune cells (IC, including lymphocytes, macrophages, dendritics, and histocytes), excluding necrotic areas. For EBER, identifiable nuclear staining (≥1%) served as aberrant expression. The evaluation criterion for Her2-overexpressing GC is IHC initial tested as 3+ or IHC initial tested as 2+, and then retested by FISH as Her2 gene amplification.28
Statistical analysis
Spearman’s correlation analysis was directed at comparisons of PD-L1-TC and PD-L1-IC expression. Clinicopathologic parameters (including Her2-positive status) within subtypes and their correlations with PD-L1 expression were assessed for differences using the Pearson’s χ2 test, Yate’s correction, or Fisher’s exact test. The Kaplan-Meier method (and the log-rank test) as well as Cox’s proportional hazards regression model were used for univariate survival analysis. Multivariate survival analysis was performed by Cox’s proportional hazards regression model. Overall survival (OS) was measured from the date of resection of GC to the date of death from any cause or the last follow-up time. The P-values under 0.05 (two-sided) were considered statistically significant and all statistical calculations were done using STATA 10.1 (stata corp., College Station, TX, USA). A heatmap that illustrated the clinicopathologic characteristics and biomarkers expression level in integrated classification was created by the pheatmap package for R (software version 3.3).
Results
Clinicopathologic characteristics and survival analysis in relation to patients’ stratification
One hundred and sixty-five GC cases were in turn subdivided by TCGA, ACRG, and integrated classification based on staining results, using the streamlined, stepwise classification algorithm as previously advised (Figure 1).8,9 Five subtypes in integrated classification were as follows: Cluster 1 (C1, EBER positive), two cases (1.2%); Cluster 2 (C2, MSI), 21 cases (12.7%); Cluster 3 (C3, aberrant E-cadherin expression), 32 cases (19.4%); Cluster 4 (C4, aberrant P53 expression), 79 cases (47.9%); and Cluster 5 (C5, normal P53 expression), 31 cases (18.8%). Aberrant and/or normal expression of these markers is displayed in Figure 2.
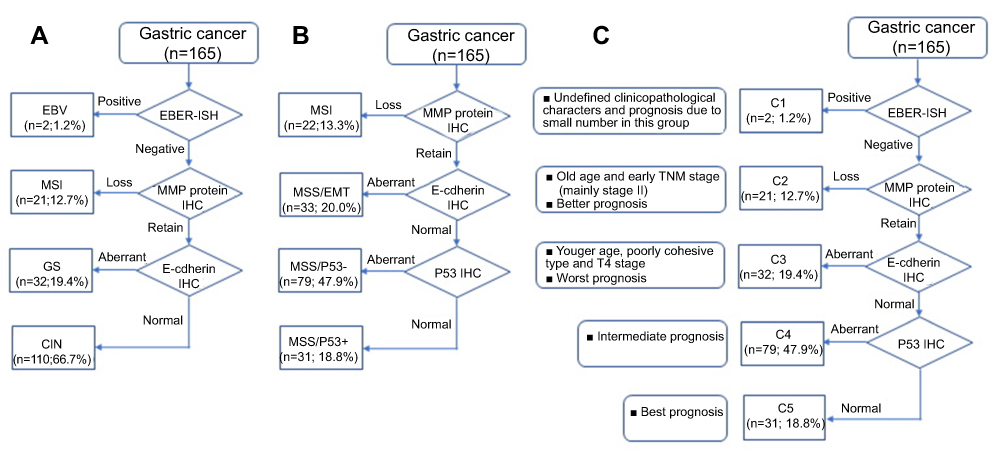 |
Figure 1 Identification of molecular subtypes of 165 gastric cancers with protein and mRNA-based categorical sequence: (A) TCGA; (B) ACRG, and (C) integrated classification. The rough corresponding relations between the integrated molecular classification and the TCGA and ACRG was: C1 correspondence to EBV (TCGA), C2 to MSI (TCGA or ACRG), C3 to GS (TCGA) or MSS/EMT (ACRG), C4 to CIN (TCGA) or MSS/TP53- (ACRG), and C5 to MSS/TP53+(ACRG).Abbreviations: ACRG, Asian Cancer Research Group; C1, cluster 1; C2, cluster 2; C3, cluster 3; C4, cluster 4, C5 cluster 5; CIN, chromosomal instability; EBV, Epstein-Barr Virus; MSI, microsatellite instability; MSS/EMT, microsatellite stable/epithelial mesenchymal transition; MSS/TP53-, microsatellite stable/tumor protein 53 inaction ; MSS/TP53+, microsatellite stable/tumor protein 53 activation; TCGA, the Cancer Genome Atlas. |
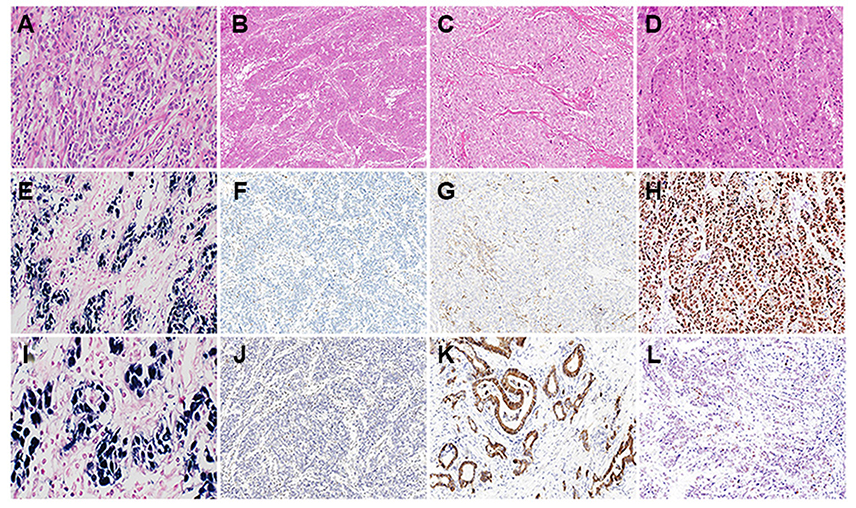 |
Figure 2 Protein markers expression on molecular subtypes of gastric cancers. (A, E, and I) Positivity for EBER in a medullary gastric cancer was categorized as cluster 1. (B, F, and J) Concurrent loss of tumor nuclear expression of MLH1 and PMS2, but retained expression on the stroma lymphocytes was stratified into cluster 2. (C, G) Reduced membranous expression of E-cadherin was considered as aberrant, irrespective of cytoplasmic or nuclear expression (cluster 3). (D and H) Aberrant P53 expression was determined by diffuse and strong P53 staining pattern (cluster 4). (K and L) Tumor showed normal expression of E-cadherin or P53.Abbreviation: EBER, Epstein-Barr virus mRNA. |
Clinicopathologic characteristics of integrated classification are summarized in Table S1 (data of TCGA and ACRG was not shown). C1 were both characterized by younger age, large size (≧5cm), poor differentiation, diffuse-type, and proximal stomach. Compared with the rest, C2 was detected to be significantly more prevalent in elderly age (P=0.009) and early TNM stage (P=0.027), especially for stage Ⅱ (P=0.004). Increased frequency but no significant difference was made for C2 in tumors with antrum-located location, tubular-type, medullary carcinoma and low lymph node involvement than the others (71.4% vs 52.1%, 61.9% vs 47.2%, 9.5% vs 1.4%, and 38.1% vs 17.4%). In younger patients (P=0.007), poorly cohesive type (P=0.002) and lesions with T4 stage (P=0.037), more frequent presence of C3 was observed than the remaining cases. C3 also had trends toward diffuse type and higher TNM staging (59.4% vs 44.3% and 75% vs 57.1%), although these differences were not significant. An analogous increased proportion of intestinal-type against the others could be yielded in C4 and C5 (13.4% and 11.3%). Clinicopathologic features and biomarker results for integrated classification are shown in Figure 3.
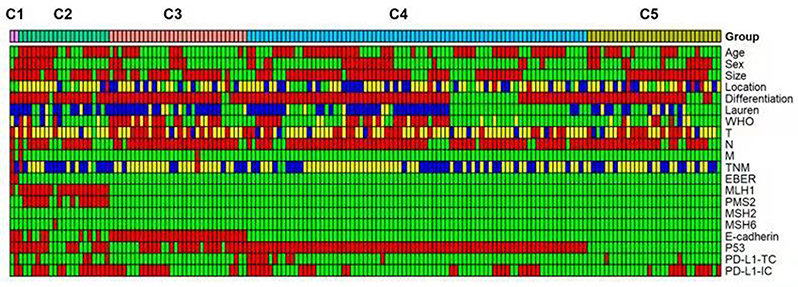 |
Figure 3 Heatmap depicting clinicopathologic features and biomarker information (rows) of 165 cases (columns) categorized into (C1 to C5) in this cohort. Dichotomous variables are distinguished by green (male, age under 64 years, tumor size less than 5 cm, well-moderate differentiation, lymph node and distant organ involvement) and red (female, aged 64 or more, size equaled or exceeded 5 cm, poor differentiation, without lymph node and distant organ metastasis). Multiple variables are represented by green (GEJ-cardia, intestinal-type, tubular and papillary type, pT1 and stage Ⅰ), blue (fundus-body, disffuse-type, medullary, pT2 and stage Ⅱ), yellow (antrum-pylorus, mixed-type, mucinous and remant, pT3 and stage Ⅲ), and red (the rest location, poorly cohesive, pT4 and stage Ⅳ). In regard of biomarkers, green and red denote normal and aberrant expression of EBER, MLH1, PMS2, MSH2, MSH6, E-cadherin, P53, and PD-L1, respectively.Abbreviations: C1, cluster 1; C2, cluster 2; C3, cluster 3; C4, cluster 4; C5, cluster 5; EBER, Epstein-Barr virus mRNA; GEJ, esophagogastric junction. |
Due to a small number of EBV-positive GC, we ruled out them and performed a survival analysis on the remainder (Figures 4A–C). Substantial overall survival (OS) difference stratified by integrated classification was described here (P<0.01): C5 (MSS/TP53+) tumors had the best prognosis and C2 (MSI) had almost the same outcome as C5 (MSS/TP53+) without apparent discrepancy; C4 (MSS/TP53-) and CIN carried the intermediate prognosis; C3 (GS, MSS/EMT) consistently signified the worst prognosis. Univariate analysis indicated molecular subtypes (C3 vs C2, C4, and C5), age, WHO classification (poorly cohesive type), advanced T, N, and TNM grade were associated with poor prognosis (P<0.05). Multivariate modeling revealed that prognosis was just independently influenced by molecular subtypes (P=0.010, HR=2.51, 95% CI=1.25–5.06), age (P=0.000, HR=1.05, 95% CI=1.02–1.07), and TNM stage (P=0.026, HR=2.72, 95% CI=1.23–6.55) (Table 1).
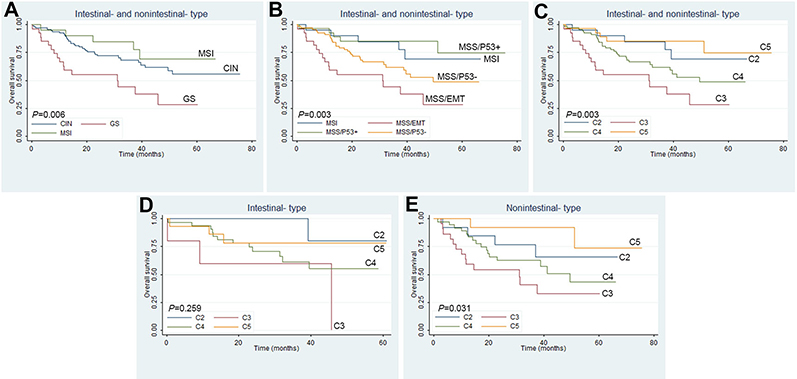 |
Figure 4 Survival analysis of molecular subtypes determined by Kaplan-Meier method (each diagram deleted 2 EBV-positive cases). Total patients stratified by (A) TCGA classification, (B) ACRG classification and (C) integrated classification. (D and E) Integrated classification in intestinal- and nonintestinal-type gastric cancers.Abbreviations: ACRG, Asian Cancer Research Group; EBER, Epstein-Barr virus mRNA; TCGA, the Cancer Genome Atlas. |
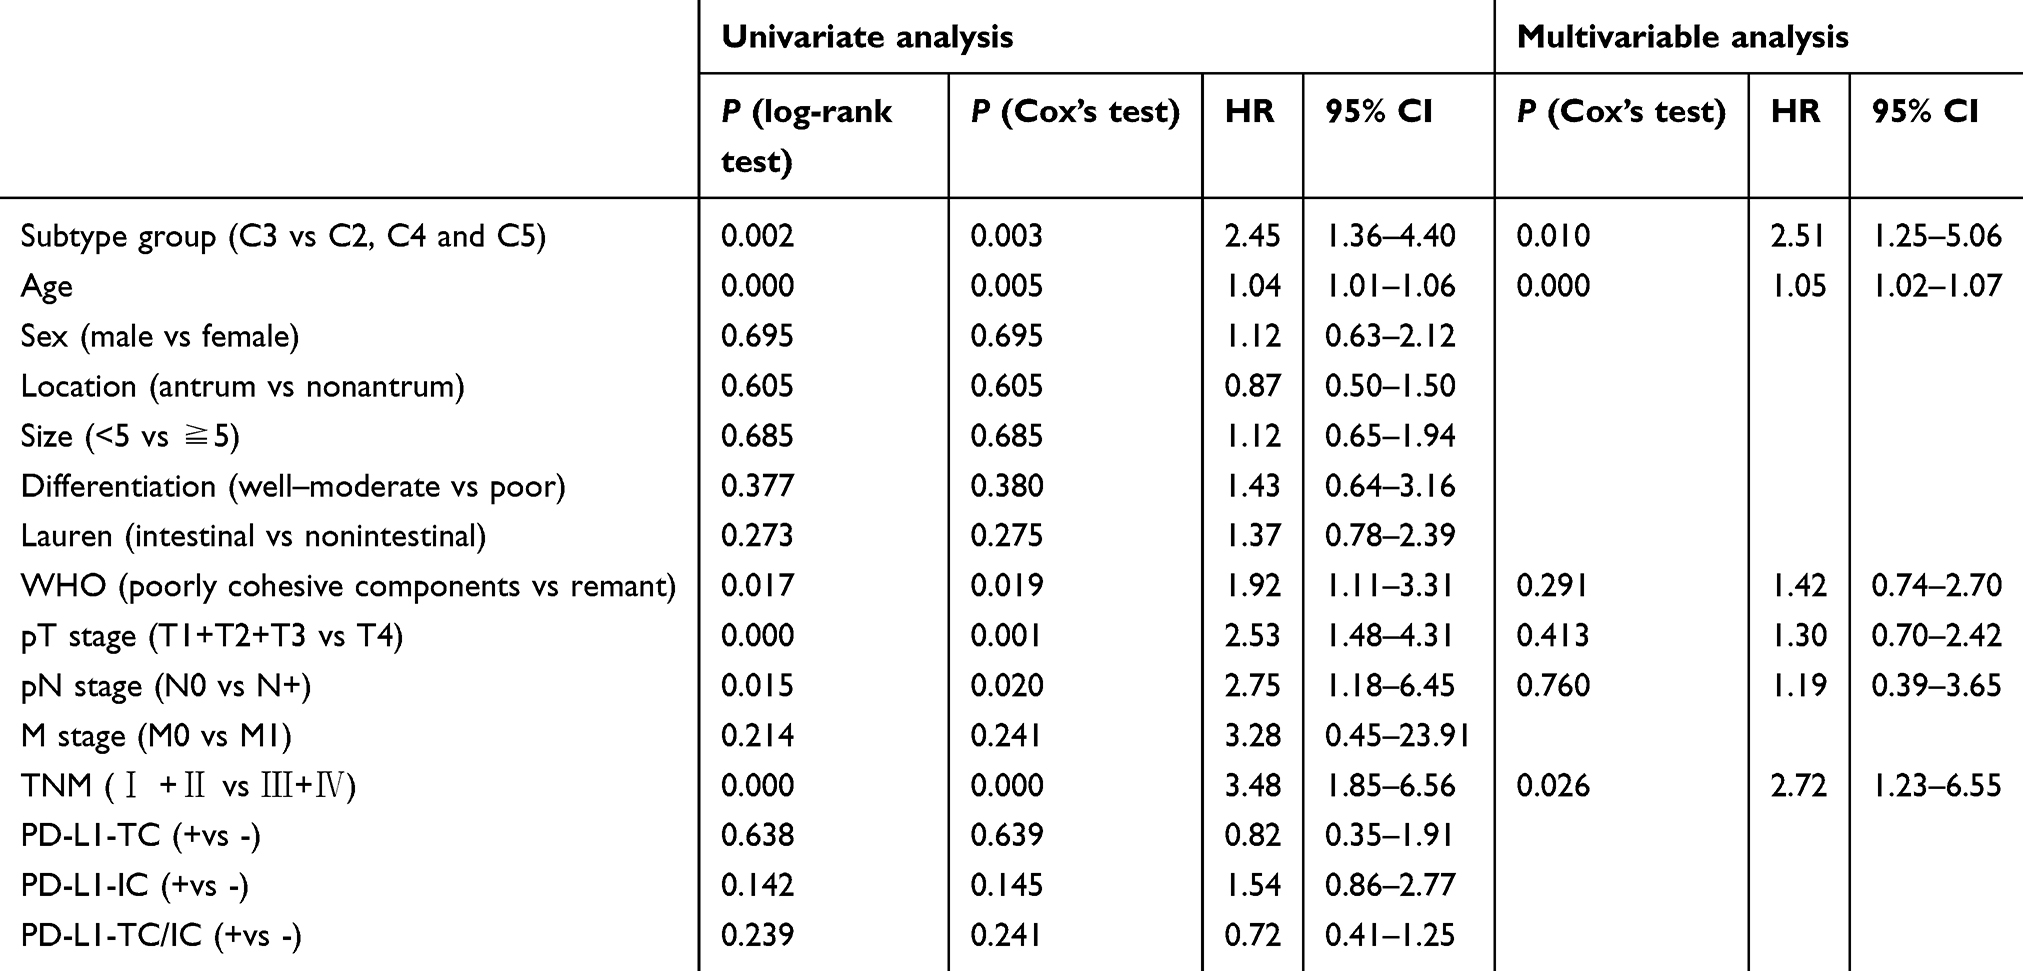 |
Table 1 Univariate and multivariable analysis of overall survival |
Analysis of molecular subtypes under different Lauren type background
Clinical features for subgroups in nonintestinal-type GC substantially overlapped with the whole cohort: initial diagnosis of C2 at old age and C3 at younger age; low TNM grade in C2 (P=0.021), high T (P=0.008), and TNM (P=0.018) stage in C3; molecular subtypes as an independent prognosis indicator (P=0.035, HR=2.31, 95% CI=1.06–5.02). While, subgroups in intestinal-type GC manifested radically different characteristics: male predominance in C4 (P=0.005), advanced T staging (P=0.028), and slight female dominance (P=0.054) in C5, C2 was inclined to have the best prognosis without prognostic significance (Figures 4D and E, Figure S1 and Table S2).
Distribution of PD-L1- and Her2-positive molecular subtypes and the clinical significance of PD-L1 expression
Of the 165 GC cases, 66 cases were positive for PD-L1 staining (66/165, 40%, consisting of 17 in TC and 61 in IC) and 12 cases showed simultaneous expression (TC and IC) of PD-L1 (12/165, 7.3%) (Figure 5). Positive PD-L1-TC and -IC expressions were weakly correlated with each other (r=0.236, P=0.002). The expression rate of PD-L1 in C1, C2, C3, C4, and C5 was 50% (1/2), 66.7% (14/21), 40.6% (13/32), 34.2% (27/79), and 35.5% (11/31), respectively (Figure 3). The prevalence of PD-L1-IC or -TC/IC positivity is greater in C2 (23.0% vs 6.7% in other subtypes, P=0.003; 21.2% vs 7.1% in other subtypes, P=0.008). PD-L1-TC positive was related to nonintestinal-type GC (P=0.029), even though it conferred no survival disadvantage over PD-L1-TC negative patients (Table 2, Figure 6). Apart from all cases of medullary carcinoma having aberrantly expressed PD-L1 (IC P=0.018, TC/IC P=0.050), the clinical and prognostic relevance failed to reach any significance for such PD-L1 staining patterns (Table 2, Figure 6). There still seemed to be an inclination towards better outcomes for those with PD-L1-IC or -TC/IC positivity. When the cut-off defining PD-L1-IC positivity was raised to 5%, there was a more pronounced tendency for PD-L1-IC expressed patients to have a favorable prognosis (IC P=0.067).
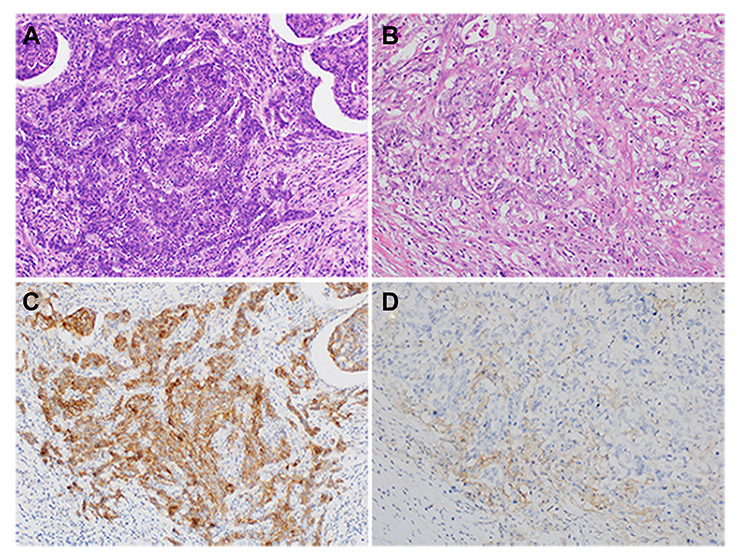 |
Figure 5 Expression of PD-L1 on gastric cancer. (A and C) Strong PD-L1 expression was observed in tumor cells and surrounding tumor embolism. (B and D) PD-L1-positive immune cells were seen at the peritumoral interface. |
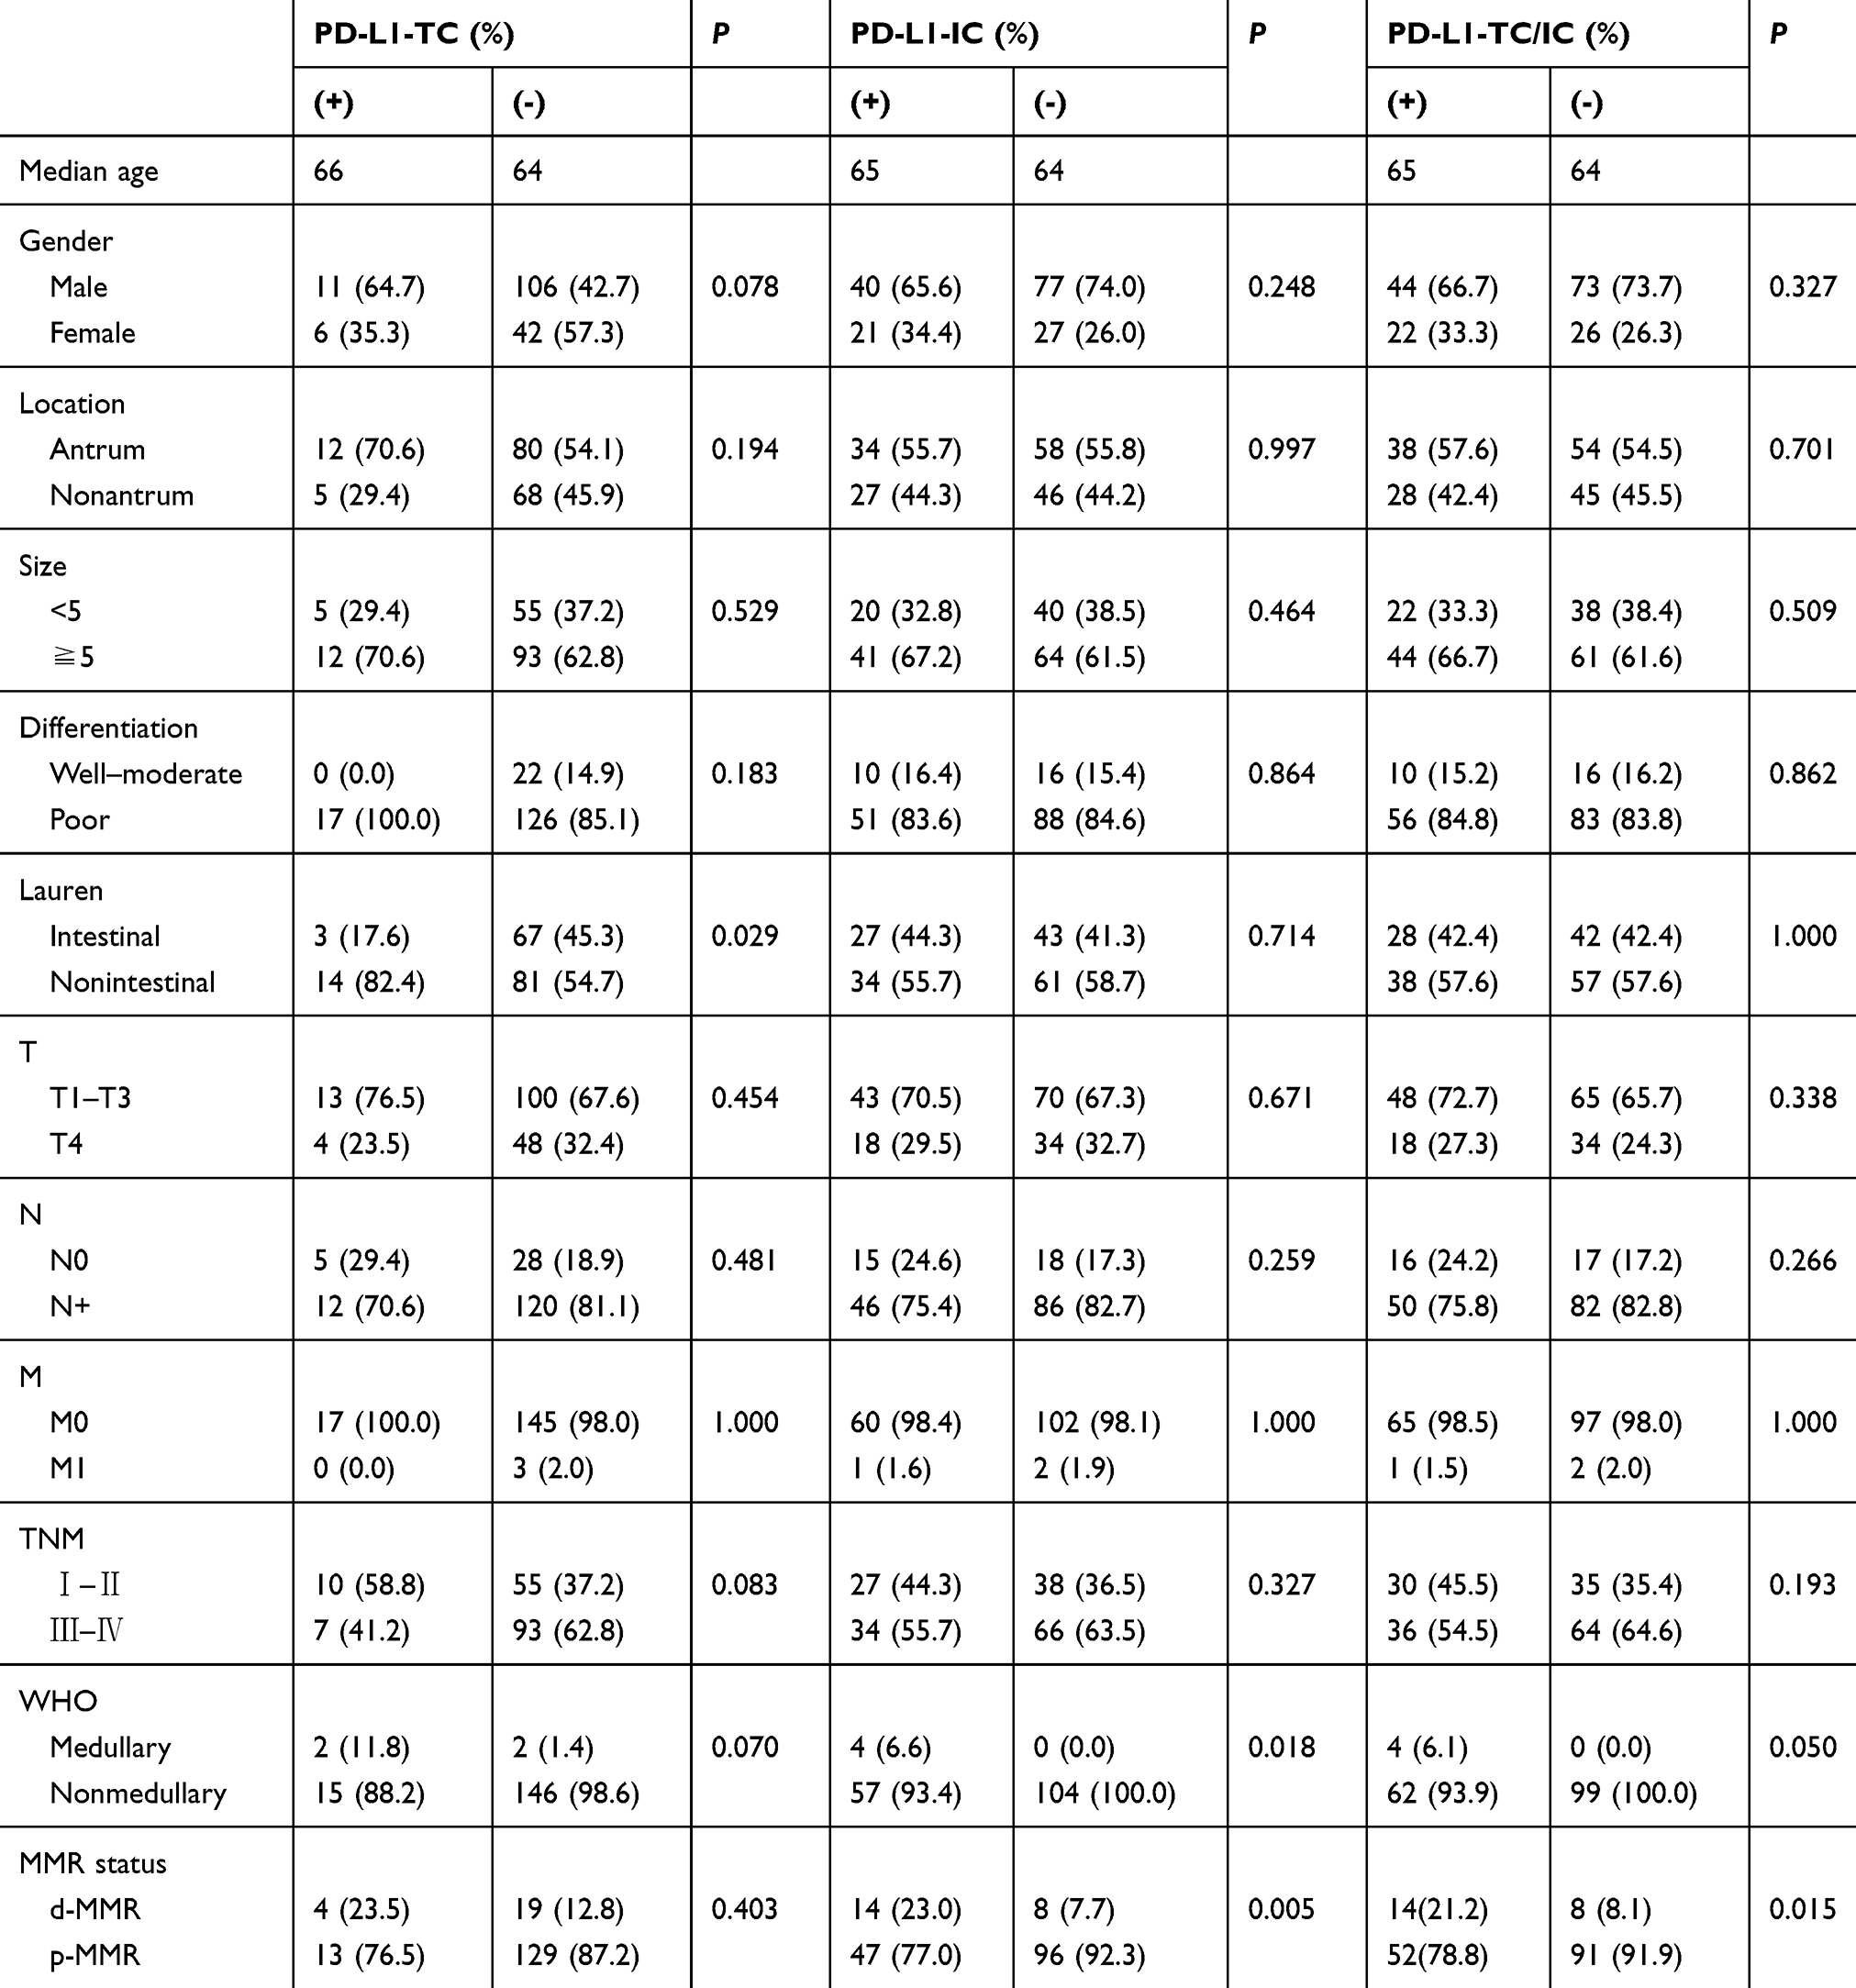 |
Table 2 The relationship between PD-L1 expression and clinicopathologic parameters |
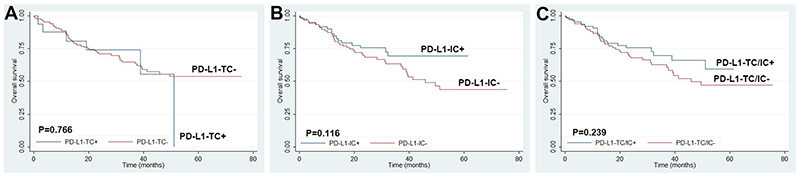 |
Figure 6 Kaplan-Meier plots of overall survival for PD-L1 expression in (A) tumor cells (TC), (B) immune cells (IC), and (C) tumor cells and/or immune cells. |
Among 165 GC cases, the most common category of Her2 overexpression was C4 (11/79, 13.9%) followed by C5 (4/31, 12.9%), whereas C2 (2/21, 9.5%) and C3 (1/32, 3.1%) were less common for Her2 positive, and C1 (0/2) had no Her2 positivity. The CIN subgroup (including C4 and C5) had increased Her2-positive (13.6% vs 5.5% in the remaining cases). Further analysis unveiled that PD-L1 was more frequently expressed in Her2-negative GC than that in Her2-positive GC (TC/IC 42.2% vs 22.2%, TC 11.6% vs 0%, IC 38.8% vs 22.2%), even though no statistical significance was reached.
Discussion
Increased PD-L1 expression has been associated with clinical activity of anti-PD-1/PD-L1 treatments; however, only a small proportion of PD-L1 expressed patients can truly benefit from checkpoint blockade. In-depth analysis of one-to-one correlations between immune response and molecular or morphological alterations may be a helpful way in selecting patients for PD-1/PD-L1 targeted therapy. Recent clinical trials in a variety of solid tumors (mainly in colorectal cancer) demonstrated a striking difference between d-MMR/MSI-H and p-MMR/MSS in therapeutic response to PD-1/PD-L1 inhibitors.14–16 Furthermore, MSI immune subtype, as one of the four known molecular subtypes for colorectal cancer, presents with a unique histological characteristics (including mucinous and medullary histology) and aggregated expression of PD-L1.29–31 As for GC, most previous studies focused on investigating the role of PD-L1 expression in predicting outcomes, but few evaluated PD-L1 expression in the context of molecular classification. How to choose the right patients for anti-PD-1/PD-L1 therapy, anti-Her2 therapy, or others is a thoughtful question with the development of novel therapy strategies. In addition, clinical applications of DNA sequencing technologies are thwarted by the restriction that such methodologies may be inaccessible in many small-scale medical centers and unaffordable by many cancer patients. In this sense, the use of IHC and ISH approaches to assess molecular genetic changes has become a powerful tool in biomarker detection. Accordingly, elucidating the association of PD-L1 expression and molecular subtypes as well as Her2-positive, is key to assess prognostic significance and improve therapy selectivity and efficacy for GC patients.
In order to more accurately delineate the expression of PD-L1 on GC tissues, whole tissue sections were adopted to minimize intratumoral heterogeneity. In this patient cohort, 40% of patients had PD-L1 expression on either TC or IC that conform to 8.8–74.9% of PD-L1 positivity in GC reported by previous literature.17,18,20,22–24 In contrast with some other research which reported that PD-L1 status could correlate with either favorable or unfavorable prognosis of cancer patients, no significant association was found between PD-L1-positive and almost all clinical and pathologic factors in this study (including TNM staging and OS). Indeed, this is in agreement with both Ma et al17 and Wang et al,18 who have published research results that PD-L1 expression is not predictive of patient survival in GC. It should be noted that PD-L1 positivity could vary with antibody clone, preparation of tissue samples, evaluating system, and even geographical differences of recruited patients, leading to discrepant results about the association of PD-L1 expression and prognosis. However this study showed that PD-L1 expression tended to give better survival for GC patients, reminding us not to overlook its distribution on molecular subgroups.
Herein, a validation study to assess the reliability of a simplified classification and focused on its prognostic significance in GC patients was then conducted. EBV-positive tumors (8.8% in TCGA; C1) represented a lower incidence of 1.2% in our cohort compared to other literature (2–20%).8,9,32,33 Such distinction appeared to be caused by either the lower proportion of intestinal- type that are one major histological type of EBV GC, or low diagnosis rate of enrolled early-stage GC (EGC) patients.33,34 The predominance of EBV tumors in EGC (30.8%) in the study of Anh favors the hypothesis that EBV was involved at an early stage of GC carcinogenesis.8 Hypermethylation of MLH1 is the characteristic of MSI-subtype tumors.6,35 The C2 (correspondence to MSI) in the current study had an incidence of 12.7% vs 21.7% in TCGA, 22.7% in ACRG, and 8.2–44.5% in other publications.36–41 Consistent with prior studies, loss of MLH1 and PMS2 was the predominant pattern in d-MMR cases.9,35,39 Additional experiments to inspect the coincidence ratio of d-MMR cases by PCR amplifying extracted DNA are necessary. This part of the results will be seen in our subsequent study (the conformity rate is 95.8%). Beyond that, lesser aggressiveness characteristics in parallel with longer survivals were observed in this group, as previously reported.36,37,39,40,42 Both TCGA and ACRG defined a distinctive subset characterized by the lowest number of mutation events, named GS (19.7%) and MSS/EMT (15.3%), respectively.6,7 In this study, the malignant features and bad prognosis possessed by C3 tumors (correspondence to GS or MSS/EMT subtypes; 19.4%) were basically identical to those in a Korean trial.8 The largest subtype described by TCGA is the CIN group (49.8%) that has high frequency of TP53 mutation, corresponding to the subtype of MSS/TP53- (35.7%) in ACRG.6,7 Likewise, patients with C4 (MSS/TP53-) and CIN tumors having prediction of intermediate outcomes constituted the biggest part of our entire cohort (66.7% and 47.9%, respectively). The remaining MSS tumors without TP53 mutation fell into the subtype of C5 (18.8% in our cohort) or MSS/TP53+ (26.3% in ACRG). Unlike the results obtained from research teams in Korea, the present study showed that the prognosis of patients in C5 was slightly superior to that in C2 and yet differed little between them (P=0.704).7,8 This difference may be attributed to our overall lower percentage of intestinal-type GC (42.4%), in comparison with the study of Ahn et al8 (57%). Hence, it is vital to further analyze the molecular subtypes in two different Lauren type settings. As expected, the “two-faced” character was substantiated by separate analysis of molecular subtypes in intestinal- and nonintestinal-type GC, especially when considering prognosis. Evidently, additional well-designed trials are needed to clarify the selective role of Lauren type on molecular classification. Certainly, other critical factors, for example the addition of adjuvant chemotherapy after surgery, may also improve the prognosis of C5 patients, so that further research on the relationship of the prognosis and post-operative therapy within subtypes is very necessary.
In light of the feasibility of using this stratification to reflect approximate molecular alternations, the differential expression of PD-L1 in each molecular subtype of this classification was further investigated. It was shown that PD-L1 was expressed at the highest in C2, followed by C1, which was identical to recent molecular studies having disclosed their altered immune status to some extent. EBV-positive tumors exhibit extreme DNA hypermethylation, high mutation rate of PIK3CA and ARID1A, and frequent amplification of JAK2 and PD-L1/2.6 And mutational “hotspots” within targetable genes (eg, PIK3CA, ERBB2, ERBB3, EGFR, ARID1A, KRAS, and ALK) are noted in MSI tumors.16,17 These hypermutated genes harbored by this class are suggested as the incentive of added number of tumor-specific neoantigens, which might shape response to immunotherapy through enhancing the host’s immune system.6,7 The finding that PD-L1 positivity with a preference for C2 and C1 was also equal to a previously described elevated PD-L1 expression enriched in MSI and EBV subgroups of GC.17 Moreover, an exciting clinical response to PD-1 blocking therapy exited in MSI and EBV subgroups of mGC (metastatic GC) patients was verified in another recent study.43 As such, this simplified classification could be a useful aid to prioritization of anti-PD-1/PD-L1 therapy in these two subgroups of GC patients, especially for C2. Marked amplifications of the RTK-RAS signaling pathway (eg, ERBB2, EGFR, VEGFA, c-MET, FGFR2, and K-RAS) reported by TCGA are reviewed as actionable targets in CIN tumors.6 In line with previous studies, we found increased Her2 overexpression in C4 (MSS/TP53-) and CIN tumors, but not to a statistical difference.8,43 It was of interest that reduced expression of PD-L1 was seen in C4 (MSS/TP53-) and CIN compared to other subtypes, suggesting the Her2 inhibitor was superior to the PD-1/PD-L1 blockade as the possible first-line targeted therapy for C4 (MSS/TP53-)/CIN patients. In fact, the relationship of PD-L1- and Her2- positive remains elusive. Oki et al44 found a positive relation between them; on the contrary, a negative relation was reported by both Wang et al18 and Li et al.21 In current research, the greater difference of PD-L1 expression between patients with or without Her2 overexpression confirmed that immunotherapy may be more suitable for the majority of GC patients who have Her2-negative cancer (89.1% in this study, 77.9–88% in previous studies).18,45,46 Other forceful unconventional treatment methods rather than just anti-PD-1/PD-L1 or anti-Her2 therapy should be explored to improve the gloomy prognosis of C3 patients (with a lower prevalence of both PD-L1- and Her2- positive). Notably, some molecular alterations are still found, including the maximum percentage of CDH1 mutation, an increase in RHOA mutation and CLDN18–ARHGAP26 fusion, which might be used for the development of new molecular targets for “neutral” C3 tumors.6,7,47,48
One major limitation of this study is that TMA slides fail to entirely account for the intratumoral heterogeneity in stratified patients and intricate molecular changes tend to be underestimated by protein expression. For example, one of the two EBV-positive cases with unusual overlapping EBV+ and d-MMR was rectified as p-MMR/MSS both by subsequent MMR IHC (using corresponding whole section) and PCR-based MSI assay. Although this correction did not affect the above results of stepwise stratification, two important things should be mentioned here. The first of these two situations (EBV positive and d-MMR/MSI-H status) are virtually mutually exclusive, similar to previous reports.6,43,49 The second, in order to solve the shortage of TMA methods in correctly reflecting MMR heterogeneity. A more comprehensive categorization of existing approaches will, therefore, be put forward on the whole histological section. At the same time, improving this multi-biomarker panel and enlarging the sample size is another indispensable step for making this stratification closer to actual molecular subtypes and assessing the definite role of PD-L1 expression in GC.
The well-corroborated results from our study elucidates that this protein and mRNA-based classification can be employed as not only a surrogate for molecular subtyping, but also predicting the prognosis of GC. What’s more, PD-L1 expression is positively associated with C2/d-MMR status and negatively associated with C4/Her2-positive, but not predictive of the survival of patients. This classification presents constructive suggestions for different therapeutic directions in GC patients, that is, C2/d-MMR and C4 (MSS/TP53-)/CIN are the good candidates for anti-PD-1/PD-L1 immunotherapy and anti-Her2 targeted therapy, respectively. In brief, our results highlight this reproducible and affordable stratification strategy, combined with therapy-related biomarkers, can be deemed as a preliminary guideline to optimize GC patients for individualizing treatments.
Acknowledgments
This work was supported by funds from the Shanghai Municipal Commission of Health and Family Planning (No. 20154Y0145 and No. 201740031), Joined Medicine-Engineering Fund of Shanghai Jiao Tong University (No. YG2016QN72), Xinhua Hospital, School of Medicine, Shanghai Jiao Tong University (No. 15YJ10), and Xinhua Hospital for the Introduction of Talent, School of Medicine, Shanghai Jiao Tong University (No. 005).
Disclosure
The authors report no conflicts of interest in this work.
References
1. Ferlay J, Soerjomataram I, Dikshit R, et al. Cancer incidence and mortality worldwide: sources, methods and major patterns in GLOBOCAN 2012. Int J Cancer. 2015;136(5):E359–E386. doi:10.1002/ijc.29210
2. Cunningham D, Allum WH, Stenning SP, et al. Perioperative chemotherapy versus surgery alone for resectable gastroesophageal cancer. N Engl J Med. 2006;355(1):11–20. doi:10.1056/NEJMoa055531
3. Macdonald JS, Smalley SR, Benedetti J, et al. Chemoradiotherapy after surgery compared with surgery alone for adenocarcinoma of the stomach or gastroesophageal junction. N Engl J Med. 2001;345(10):725–730. doi:10.1056/NEJMoa010187
4. Sakuramoto S, Sasako M, Yamaguchi T, et al. Adjuvant chemotherapy for gastric cancer with S-1, an oral fluoropyrimidine. N Engl J Med. 2007;357(18):1810–1820. doi:10.1056/NEJMoa072252
5. Lauren P. The two histological main types of gastric carcinoma: diffuse and so-called intestinal-type carcinoma. An attempt at a histo-clinical classification. Acta Pathol Microbiol Scand. 1965;64:31–49.
6. Cancer Genome Atlas Research N. Comprehensive molecular characterization of gastric adenocarcinoma. Nature. 2014;513(7517):202–209. doi:10.1038/nature13480
7. Cristescu R, Lee J, Nebozhyn M, et al. Molecular analysis of gastric cancer identifies subtypes associated with distinct clinical outcomes. Nat Med. 2015;21(5):449–456. doi:10.1038/nm.3850
8. Ahn S, Lee SJ, Kim Y, et al. High-throughput protein and mRNA expression-based classification of gastric cancers can identify clinically distinct subtypes, concordant with recent molecular classifications. Am J Surg Pathol. 2017;41(1):106–115. doi:10.1097/PAS.0000000000000756
9. Setia N, Agoston AT, Han HS, et al. A protein and mRNA expression-based classification of gastric cancer. Mod Pathol. 2016;29(7):772–784. doi:10.1038/modpathol.2016.55
10. Zou W, Wolchok JD, Chen L. PD-L1 (B7-H1) and PD-1 pathway blockade for cancer therapy: mechanisms, response biomarkers, and combinations. Sci Transl Med. 2016;8(328):328rv324. doi:10.1126/scitranslmed.aaf0746
11. Lote H, Cafferkey C, Chau I. PD-1 and PD-L1 blockade in gastrointestinal malignancies. Cancer Treat Rev. 2015;41(10):893–903. doi:10.1016/j.ctrv.2015.09.004
12. Topalian SL, Hodi FS, Brahmer JR, et al. Safety, activity, and immune correlates of anti-PD-1 antibody in cancer. N Engl J Med. 2012;366(26):2443–2454. doi:10.1056/NEJMoa1200690
13. Muro K, Chung HC, Shankaran V, et al. Pembrolizumab for patients with PD-L1-positive advanced gastric cancer (KEYNOTE-012): a multicentre, open-label, phase 1b trial. Lancet Oncol. 2016;17(6):717–726. doi:10.1016/S1470-2045(16)00175-3
14. Brahmer JR, Drake CG, Wollner I, et al. Phase I study of single-agent anti-programmed death-1 (MDX-1106) in refractory solid tumors: safety, clinical activity, pharmacodynamics, and immunologic correlates. J Clin Oncol. 2010;28(19):3167–3175. doi:10.1200/JCO.2009.26.7609
15. Le DT, Uram JN, Wang H, et al. PD-1 blockade in tumors with mismatch-repair deficiency. N Engl J Med. 2015;372(26):2509–2520. doi:10.1056/NEJMoa1500596
16. Le DT, Durham JN, Smith KN, et al. Mismatch repair deficiency predicts response of solid tumors to PD-1 blockade. Science. 2017;357(6349):409–413. doi:10.1126/science.aan6733
17. Ma C, Patel K, Singhi AD, et al. Programmed death-ligand 1 expression is common in gastric cancer associated with epstein-barr virus or microsatellite instability. Am J Surg Pathol. 2016;40(11):1496–1506. doi:10.1097/PAS.0000000000000698
18. Wang L, Zhang Q, Ni S, et al. Programmed death-ligand 1 expression in gastric cancer: correlation with mismatch repair deficiency and HER2-negative status. Cancer Med. 2018;7(6):2612–2620. doi:10.1002/cam4.1502
19. Eto S, Yoshikawa K, Nishi M, et al. Programmed cell death protein 1 expression is an independent prognostic factor in gastric cancer after curative resection. Gastric Cancer. 2016;19(2):466–471. doi:10.1007/s10120-015-0519-7
20. Kim JW, Nam KH, Ahn SH, et al. Prognostic implications of immunosuppressive protein expression in tumors as well as immune cell infiltration within the tumor microenvironment in gastric cancer. Gastric Cancer. 2016;19(1):42–52. doi:10.1007/s10120-014-0440-5
21. Li Z, Lai Y, Sun L, et al. PD-L1 expression is associated with massive lymphocyte infiltration and histology in gastric cancer. Hum Pathol. 2016;55:182–189. doi:10.1016/j.humpath.2016.05.012
22. Thompson ED, Zahurak M, Murphy A, et al. Patterns of PD-L1 expression and CD8 T cell infiltration in gastric adenocarcinomas and associated immune stroma. Gut. 2017;66(5):794–801. doi:10.1136/gutjnl-2015-310839
23. Pereira MA, Ramos M, Faraj SF, et al. Clinicopathological and prognostic features of Epstein-Barr virus infection, microsatellite instability, and PD-L1 expression in gastric cancer. J Surg Oncol. 2018. doi:10.1002/jso.25022
24. Xing X, Guo J, Wen X, et al. Analysis of PD1, PDL1, PDL2 expression and T cells infiltration in 1014 gastric cancer patients. Oncoimmunology. 2018;7(3):e1356144. doi:10.1080/2162402X.2018.1490854
25. Bang Y-J, Van Cutsem E, Feyereislova A, et al. Trastuzumab in combination with chemotherapy versus chemotherapy alone for treatment of HER2-positive advanced gastric or gastro-oesophageal junction cancer (ToGA): a phase 3, open-label, randomised controlled trial. Lancet. 2010;376(9742):687–697. doi:10.1016/S0140-6736(10)61121-X
26. Lauwers GY, Carneiro F, Graham DY, et al. Gastric carcinoma. In: Bosman FT, Carneiro F, Hruban RH, Theise ND, editors. WHO Classification of Tumours of the Digestive System,
27. Angell H, Lee J, Kim K, et al. PD-L1 and immune infiltrates are differentially expressed in distinct subgroups of gastric cancer. OncoImmunology. 2018;8(2):e1544442. doi:10.1080/2162402X.2018.1544442.
28. Ruschoff J, Hanna W, Bilous M, et al. HER2 testing in gastric cancer: a practical approach. Mod Pathol. 2012;25(5):637–650. doi:10.1038/modpathol.2011.198
29. Rosenbaum MW, Bledsoe JR, Morales-Oyarvide V, Huynh TG, Mino-Kenudson M. PD-L1 expression in colorectal cancer is associated with microsatellite instability, BRAF mutation, medullary morphology and cytotoxic tumor-infiltrating lymphocytes. Mod Pathol. 2016;29(9):1104–1112. doi:10.1038/modpathol.2016.95
30. Ward R, Meagher A, Tomlinson I, et al. Microsatellite instability and the clinicopathological features of sporadic colorectal cancer. Gut. 2001;48(6):821–829. doi:10.1136/gut.48.6.821
31. Guinney J, Dienstmann R, Wang X, et al. The consensus molecular subtypes of colorectal cancer. Nat Med. 2015;21(11):1350–1356. doi:10.1038/nm.3967
32. Birkman E-M, Mansuri N, Kurki S, et al. Gastric cancer: immunohistochemical classification of molecular subtypes and their association with clinicopathological characteristics. Virchows Archiv. 2017;472(3):369–382. doi:10.1007/s00428-017-2240-x
33. Shinozaki-Ushiku A, Kunita A, Fukayama M. Update on Epstein-Barr virus and gastric cancer (review). Int J Oncol. 2015;46(4):1421–1434. doi:10.3892/ijo.2015.2856
34. Takano Y, Kato Y. Epstein-Barr virus association with early cancers found together with gastric medullary carcinomas demonstrating lymphoid infiltration. J Pathol. 1995;175(1):39–44. doi:10.1002/path.1711750107
35. Fleisher AS, Esteller M, Wang S, et al. Hypermethylation of the hMLH1 gene promoter in human gastric cancers with microsatellite instability. Cancer Res. 1999;59(5):1090–1095.
36. Seo HM, Chang YS, Joo SH, et al. Clinicopathologic characteristics and outcomes of gastric cancers with the MSI-H phenotype. J Surg Oncol. 2009;99(3):143–147. doi:10.1002/jso.21220
37. Corso G, Pedrazzani C, Marrelli D, Pascale V, Pinto E, Roviello F. Correlation of microsatellite instability at multiple loci with long-term survival in advanced gastric carcinoma. Arch Surg. 2009;144(8):722–727. doi:10.1001/archsurg.2009.42
38. Vauhkonen M, Vauhkonen H, Sajantila A, Sipponen P. Differences in genomic instability between intestinal- and diffuse-type gastric cancer. Gastric Cancer. 2005;8(4):238–244. doi:10.1007/s10120-005-0346-3
39. Lee HS, Choi SI, Lee HK, et al. Distinct clinical features and outcomes of gastric cancers with microsatellite instability. Mod Pathol. 2002;15(6):632–640. doi:10.1038/modpathol.3880578
40. An JY, Kim H, Cheong JH, Hyung WJ, Kim H, Noh SH. Microsatellite instability in sporadic gastric cancer: its prognostic role and guidance for 5-FU based chemotherapy after R0 resection. Int J Cancer. 2012;131(2):505–511. doi:10.1002/ijc.26399
41. Wirtz HC, Muller W, Noguchi T, et al. Prognostic value and clinicopathological profile of microsatellite instability in gastric cancer. Clin Cancer Res. 1998;4(7):1749–1754.
42. Lu BJ, Lai M, Cheng L, Xu JY, Huang Q. Gastric medullary carcinoma, a distinct entity associated with microsatellite instability-H, prominent intraepithelial lymphocytes and improved prognosis. Histopathology. 2004;45(5):485–492. doi:10.1111/j.1365-2559.2004.01998.x
43. Kim ST, Cristescu R, Bass AJ, et al. Comprehensive molecular characterization of clinical responses to PD-1 inhibition in metastatic gastric cancer. Nat Med. 2018;24(9):1449–1458. doi:10.1038/s41591-018-0101-z
44. Oki E, Okano S, Saeki H, et al. Protein expression of programmed death 1 ligand 1 and HER2 in gastric carcinoma. Oncology. 2017;93(6):387–394. doi:10.1159/000479231
45. Kurokawa Y, Matsuura N, Kimura Y, et al. Multicenter large-scale study of prognostic impact of HER2 expression in patients with resectable gastric cancer. Gastric Cancer. 2015;18(4):691–697. doi:10.1007/s10120-014-0430-7
46. Van Cutsem E, Bang YJ, Feng-Yi F, et al. HER2 screening data from ToGA: targeting HER2 in gastric and gastroesophageal junction cancer. Gastric Cancer. 2015;18(3):476–484. doi:10.1007/s10120-014-0402-y
47. Kakiuchi M, Nishizawa T, Ueda H, et al. Recurrent gain-of-function mutations of RHOA in diffuse-type gastric carcinoma. Nat Genet. 2014;46(6):583–587. doi:10.1038/ng.2984
48. Yao F, Kausalya JP, Sia YY, et al. Recurrent fusion genes in gastric cancer: CLDN18-ARHGAP26 induces loss of epithelial integrity. Cell Rep. 2015;12(2):272–285. doi:10.1016/j.celrep.2015.06.020
49. Janjigian YY, Sanchez-Vega F, Jonsson P, et al. Genetic predictors of response to systemic therapy in esophagogastric cancer. Cancer Discov. 2018;8(1):49–58. doi:10.1158/2159-8290.CD-17-0787
Supplementary materials
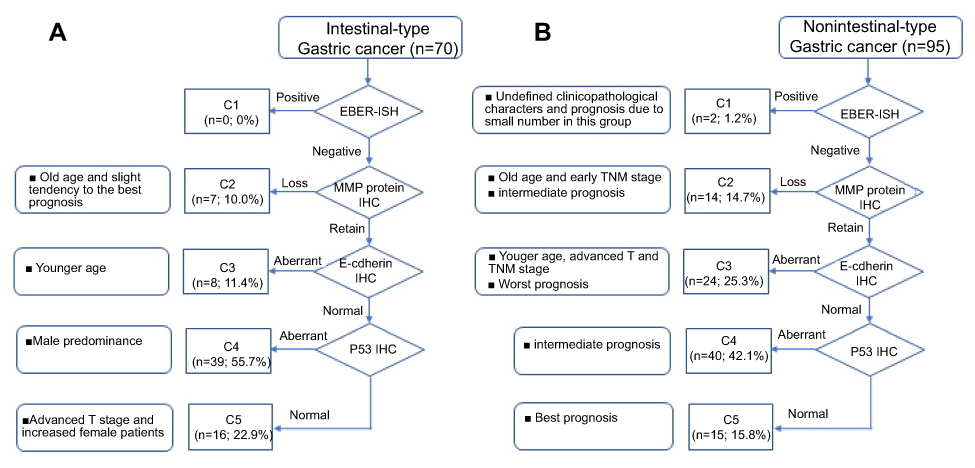 |
Figure S1 Identification of molecular subtypes of integrated classification with protein and mRNA-based categorical sequence in intestinal- or nonintestinal-type gastric cancers: (A) intestinal-type; (B) nonintestinal-type. |
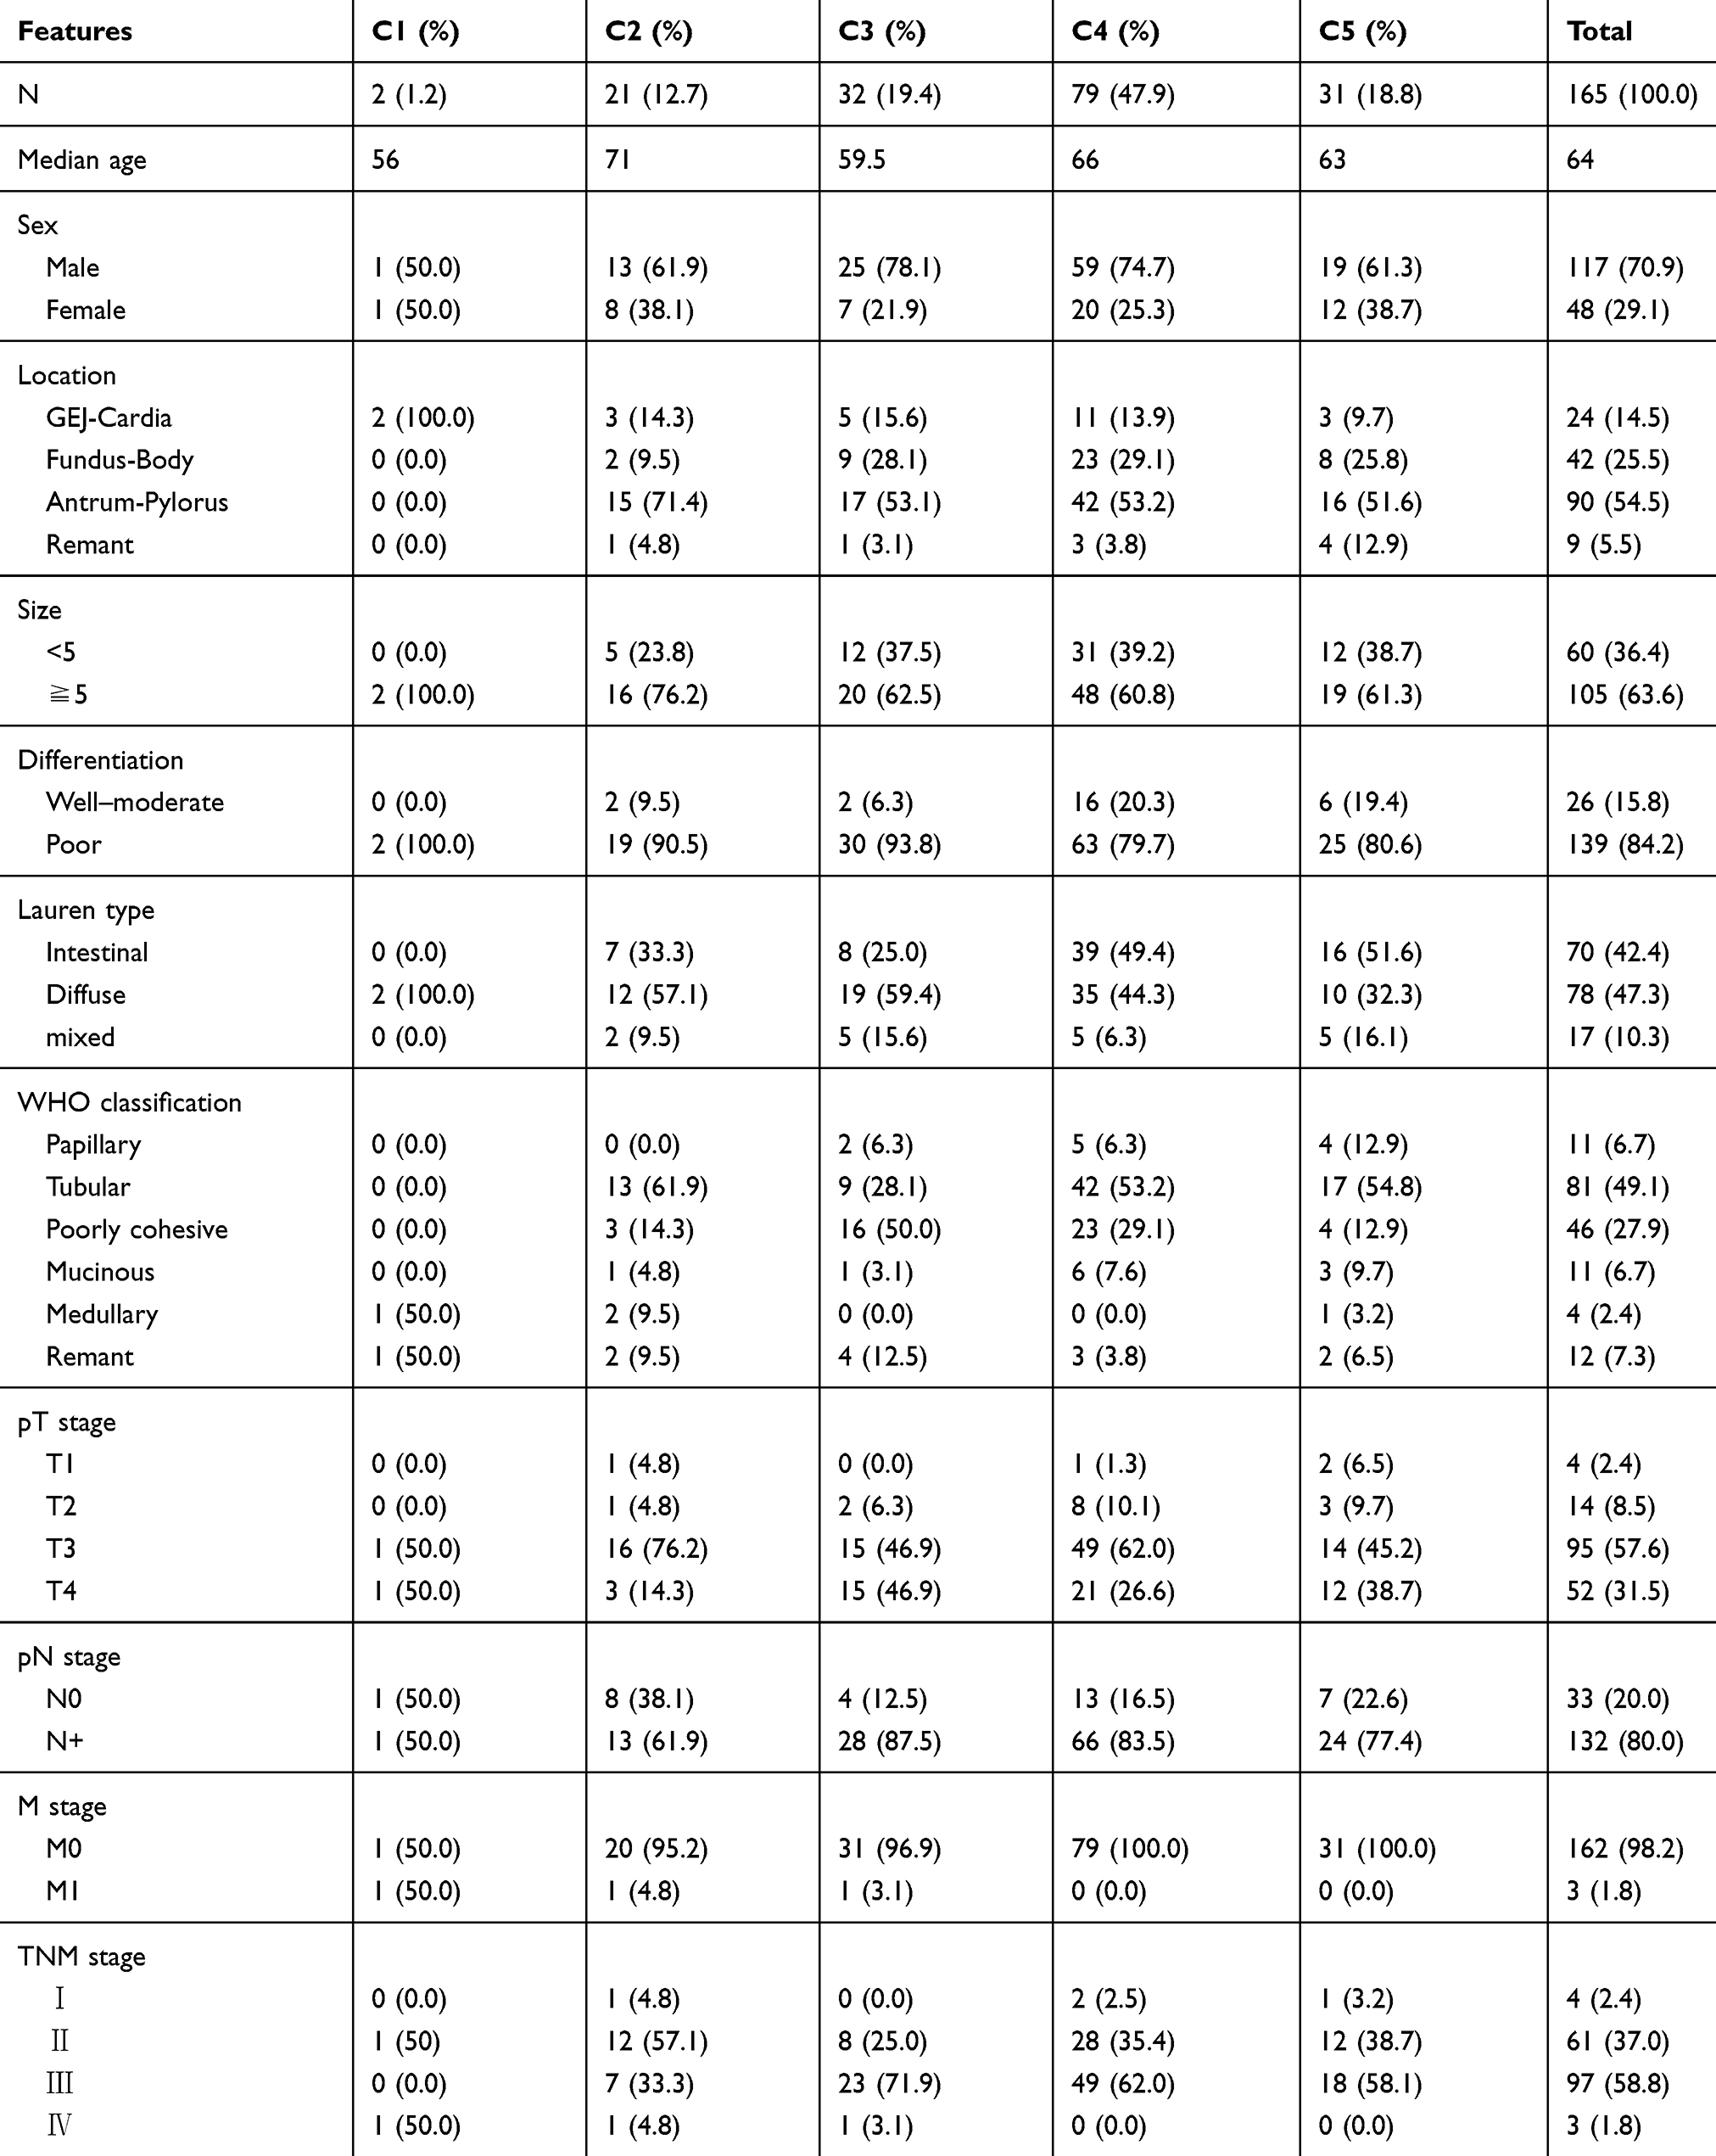 |
Table S1 Clinicopathological features according to integrated classification |
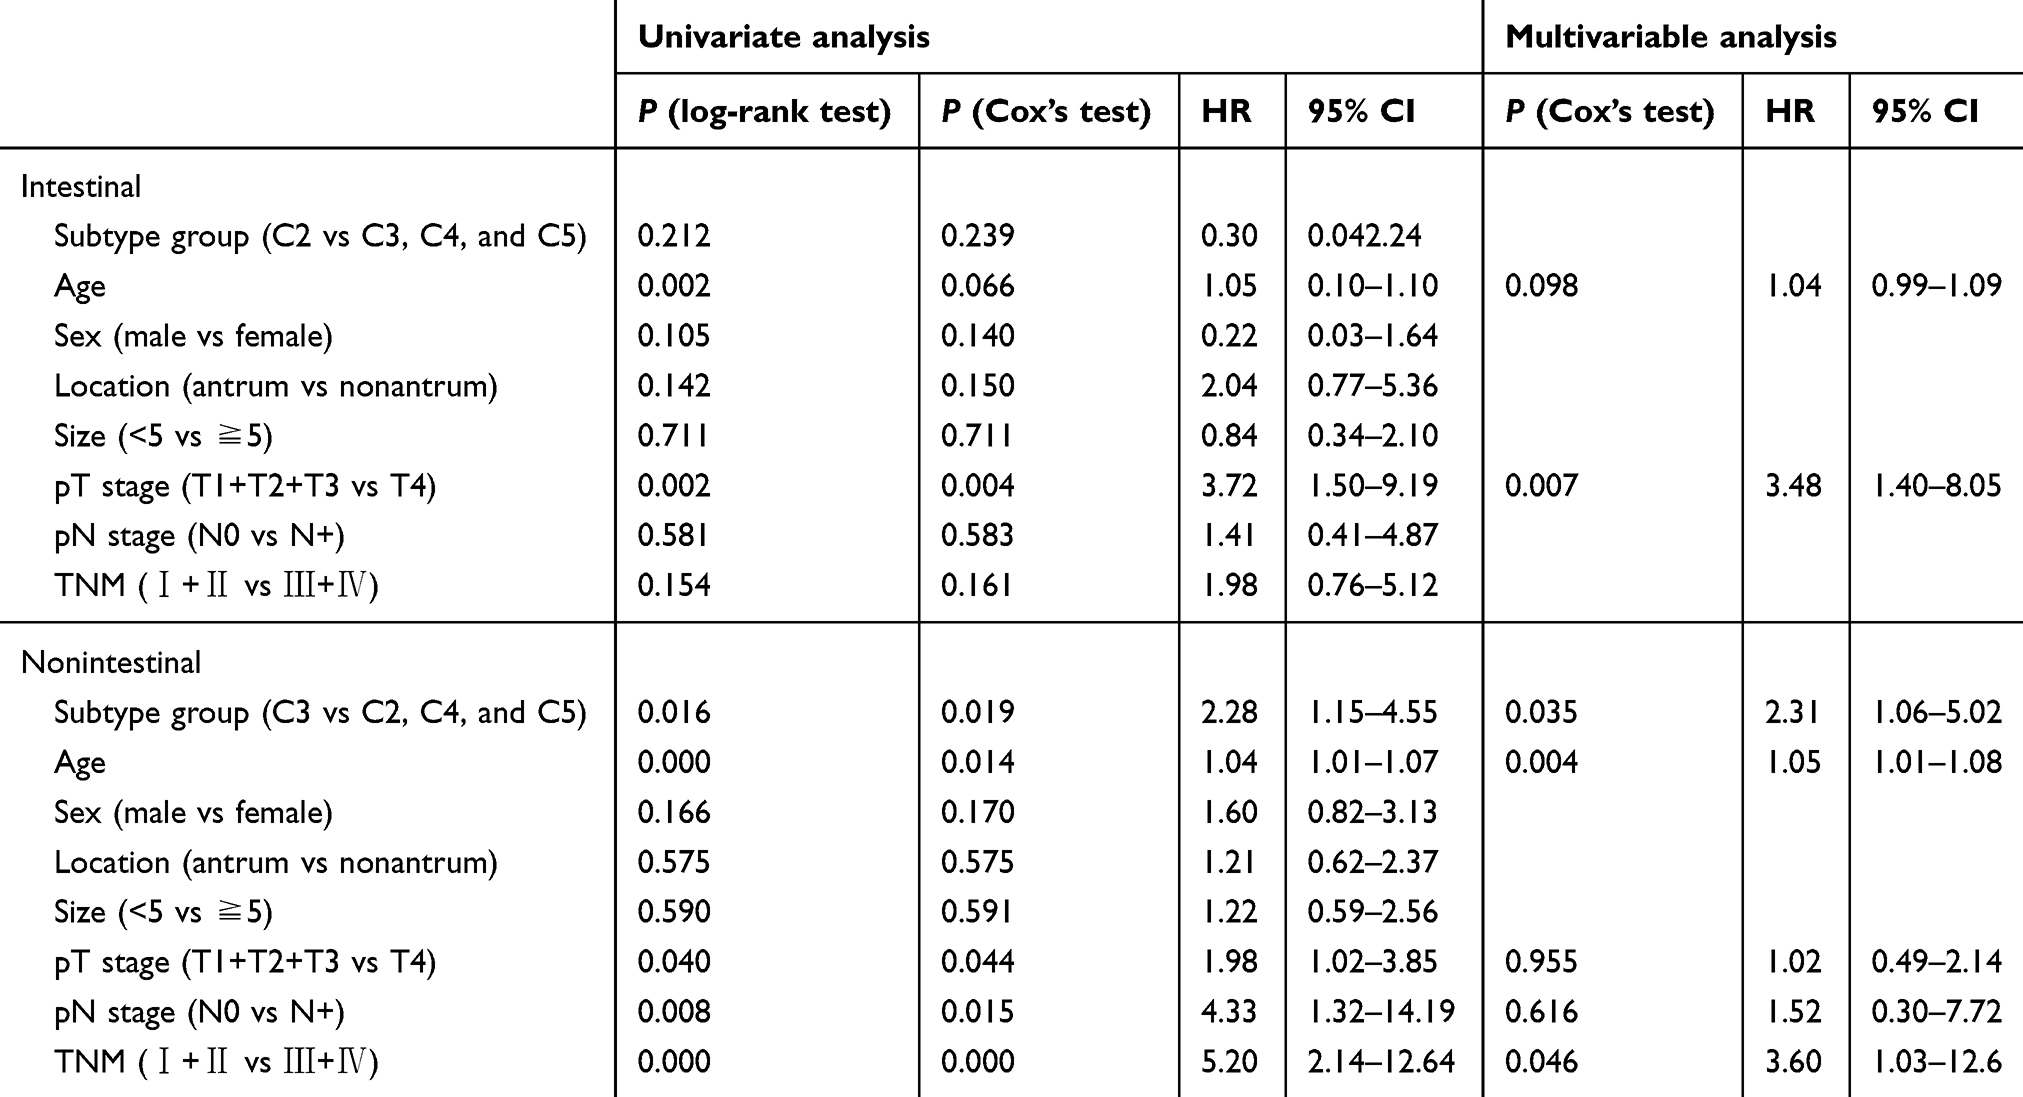 |
Table S2 Univariate and multivariable analysis of overall survival |
 © 2019 The Author(s). This work is published and licensed by Dove Medical Press Limited. The full terms of this license are available at https://www.dovepress.com/terms.php and incorporate the Creative Commons Attribution - Non Commercial (unported, v3.0) License.
By accessing the work you hereby accept the Terms. Non-commercial uses of the work are permitted without any further permission from Dove Medical Press Limited, provided the work is properly attributed. For permission for commercial use of this work, please see paragraphs 4.2 and 5 of our Terms.
© 2019 The Author(s). This work is published and licensed by Dove Medical Press Limited. The full terms of this license are available at https://www.dovepress.com/terms.php and incorporate the Creative Commons Attribution - Non Commercial (unported, v3.0) License.
By accessing the work you hereby accept the Terms. Non-commercial uses of the work are permitted without any further permission from Dove Medical Press Limited, provided the work is properly attributed. For permission for commercial use of this work, please see paragraphs 4.2 and 5 of our Terms.