")
Back to Journals » International Journal of General Medicine » Volume 14
Integrated Analysis of the Immune Infiltrates and PD-L1 Expression of N6-Methyladenosine-Related Long Non-Coding RNAs in Colorectal Cancer
Authors Jiang Z , Zhang Y, Chen K , Yang X, Liu J
Received 5 July 2021
Accepted for publication 16 August 2021
Published 29 August 2021 Volume 2021:14 Pages 5017—5028
DOI https://doi.org/10.2147/IJGM.S327765
Checked for plagiarism Yes
Review by Single anonymous peer review
Peer reviewer comments 2
Editor who approved publication: Dr Scott Fraser
Ziting Jiang,1,2,* Yitong Zhang,1,2,* Ke Chen,1,2,* Xiujiang Yang,1,2 Jianqiang Liu1,2
1Department of Endoscopy, Fudan University Shanghai Cancer Center, Shanghai, People’s Republic of China; 2Department of Oncology, Shanghai Medical College, Fudan University, Shanghai, People’s Republic of China
*These authors contributed equally to this work
Correspondence: Xiujiang Yang; Jianqiang Liu
Department of Endoscopy, Fudan University Shanghai Cancer Center, Shanghai, 200032, People’s Republic of China
Tel +86-21-34610367
Email [email protected]; [email protected]
Background: N6-methyladenosine-related long non-coding RNAs (m6A-related lncRNAs) are involved in the occurrence and progression of various cancers. However, it remains unclear whether m6A-related lncRNAs have potential roles in tumor immune microenvironment (TIME).
Methods: Herein, we investigated correlations of prominent m6A-related lncRNAs with immune infiltrates and PD-L1 expression and the prognostic value of m6A-related lncRNAs in colorectal cancer from The Cancer Genome Atlas (TCGA) cohort, systematically.
Results: Firstly, we conducted Pearson correlation analysis to screen the m6A-related lncRNAs, and then univariate Cox regression analysis was performed to identify 72 prognostic m6A-related lncRNAs in CRC patients. Moreover, two molecular subtypes (cluster 1/2) were identified by consensus clustering for 72 m6A-related lncRNAs. The cluster 1 preferentially associated with favorable prognosis, upregulated PD-L1 expression, higher immunoscore, and distinct immune cell infiltration. Furthermore, a prognostic risk score was calculated using 19 m6A-related lncRNAs based signatures which represented an independent prognostic factor for CRC. Patients with low-risk score showed higher PD-L1 expression than patients with high-risk score. Further analysis revealed that m6A-related lncRNAs based signatures were associated with tumor-infiltrating immune cells.
Conclusion: Our study indicated the essential roles of m6A-related lncRNAs in TIME of CRC and provide novel insights in our understanding of m6A-related lncRNAs function in colorectal cancer.
Keywords: colorectal cancer, N6-methyladenosine, long non-coding RNA, PD-L1, immune infiltrates
Introduction
Colorectal cancer (CRC) is one of the most common malignancies and remains the second most common cause of cancer-related death.1 Although the treatment of CRC has been optimized, there is still no effective therapy for advanced CRC patients.2 Recently, with the increased understanding of the complicated role of the tumor microenvironment composition, which includes cancer cells, stromal cells, infiltrating immune cells and secreted cytokines, the critical immune cell subsets in the occurrence and metastasis of several tumors have been recognized gradually.3–5 Moreover, current immunotherapies represented by specific immune checkpoint inhibitors (ICIs), such as anti-CTLA-4 and anti-PD-1/L1, have achieved a marked response in CRC patients.6,7 Thus, the specific regulatory mechanism of tumor immune microenvironment (TIME) should be further investigated to identify effective biomarkers that predict prognosis and optimize immunotherapy in colon cancer.
N6-methyladenosine (m6A) modification refers to an adenosine at the N6 position, is the most abundant epigenetic methylated modification of messenger RNAs (mRNAs) and non-coding RNAs (ncRNAs), which plays crucial role in multiple physiological processes.8,9 It is suggested that m6A modification is a kind of dynamic and reversible process that is regulated by m6A regulators, including “writers” (methyltransferases), “readers” (signal transducers) and “erasers” (demethylases).10 Recent several studies had revealed that abnormal m6A modification is associated with malignant tumor progression and immunomodulatory abnormalities. For example, METTL14 suppresses proliferation and metastasis of colorectal cancer;11 FTO modifies the m6A level of MALAT and promotes bladder cancer progression;12 and YTHDF2 restrains cell proliferation by reducing the mRNA stability of EGFR in liver cancer.13 In addition, bioinformatic study revealed that m6A regulator-based methylation modification patterns characterized by distinct tumor microenvironment immune profiles in colon cancer.14
Although lncRNAs encode almost no protein, they can regulate gene expression through RNA interference, gene co-inhibition, gene silencing, gene imprinting, and DNA demethylation.15 Aberrant lncRNA expression is strongly correlated to tumor malignancy. For example, long non-coding RNA RAMS11 promotes metastatic colorectal cancer progression.16 Long noncoding RNA OCC-1 suppresses cell growth through destabilizing HuR protein in colorectal cancer.17 Long noncoding RNA LINC01578 drives colon cancer metastasis through a positive feedback loop with the NF-κB/YY1 axis.18 However, the role of m6A regulators in the dysregulation of lncRNAs in colorectal cancer still remains unclear. Therefore, it is essential to explore how m6A-related lncRNAs are involved in the occurrence and progression of CRC which may help to identify effective biomarkers that can act as useful therapeutic targets.
The present study aimed to systematically evaluate the correlations of m6A-related lncRNAs with prognosis, programmed death ligand 1 (PD-L1), and TIME in CRC. Here, we identified the prognostic significance of m6A-related lncRNAs by bioinformatic and statistical analysis of data from patients with CRC based on The Cancer Genome Atlas (TCGA) dataset. Moreover, clustering subtypes and risk models for m6A-related lncRNAs were conducted to improve prognostic risk stratification. In addition, the relationships between clustering subgroups, risk models, PD-L1, immunoscores, and immune cell infiltration were thoroughly analyzed based on the m6A-related lncRNAs signatures to further explore the effect of m6A-related lncRNAs on TIME. This study suggested that m6A-related lncRNAs play essential roles in tumor immune microenvironment and may provide new insights in directing therapeutic strategies for CRC immunotherapy.
Materials and Methods
Datasets
The RNA-seq transcriptome data and the corresponding clinical data were downloaded from the TCGA data portal (https://portal.gdc.cancer.gov/). The RNA-seq data of 473 CRC samples and 41 normal tissues and the corresponding clinicopathological information, including age, gender, TNM staging were downloaded for further analysis.
m6A Regulatory Genes and Annotation of lncRNAs
Based on previous publications, expression matrices of 23 m6A regulatory genes were extracted from the TCGA database, including expression data on writers (METTL3, METTL14, METTL16, WTAP, VIRMA, RBM15, RBM15B, and ZC3H13), readers (YTHDC1, YTHDC2, YTHDF1, YTHDF2, YTHDF3, HNRNPC, FMR1, LRPPRC, HNRNPA2B1, IGF2BP1, IGF2BP2, IGF2BP3, and RBMX) and erasers (FTO and ALKBH5). The long non-coding RNA annotation file of Genome Reference Consortium Human Build 38 (GRCh38) was acquired from the GENCODE website 4 for annotation of the lncRNAs in the TCGA dataset.
Bioinformatic Analysis
Pearson correlation analysis was used to screen m6A-related lncRNAs (with the | Pearson R| >0.4 and p < 0.001). The univariate Cox regression analysis was conducted to filtrate the prognostic m6A-related lncRNAs. To explore the biological characteristics of the m6A-related lncRNAs in CRC, “ConsensusClusterPlus” package was employed to classify the patients into different subtypes.
The “estimate package” was used to calculate the immunoscore for each patient. The fraction of 22 immune cell types for each sample was yielded through cell type identification by estimating relative subsets of RNA transcripts (CIBERSORT; https://cibersort.stanford.edu/). The gene set enrichment analysis (GSEA) was conducted in the Hallmark gene set “h.all.v6.2.symbols. gmt” of MSigDB by using the JAVA program.
The prognostic risk signatures of m6A-related lncRNAs were established using the least absolute shrinkage and selection operator (LASSO) regression analysis in the TCGA training and validation cohort. The coefficients obtained from the LASSO regression algorithm were used to yield the following risk score equation: risk score = sum of coefficients m6A-related lncRNAs expression level. The risk score of each patient was separately calculated in the training and validation cohorts based on the equation. Then, the patients were divided into high- and low-risk groups, and the median value of the risk score was set as the cut-off point. The effect of m6A-related lncRNAs on immune cell infiltration levels was evaluated by applying the Tumor Immune Estimation Resource (TIMER, https://cistrome.shinyapps.io/timer/).
Statistical Analyses
R version 3.4.0 was used for the statistical analyses in this study. Student’s t-test and one-way ANOVA were used to perform the group comparisons of two subgroups and more than two subgroups, separately. Categorical variables were compared with chi-square tests. Survival curves were generated using the Kaplan-Meier method, and the difference between groups was compared with the log rank test. Subtypes, clinicopathological features, PD-L1, risk scores, and immune infiltration levels were subjected to correlation analysis by using a Pearson correlation test. Univariate and multivariate analyses were conducted using Cox regression models to determine the independent prognostic value of the risk scores integrated other clinical features. The receiver operating characteristic (ROC) curve was used to assess efficiency of the m6A-related lncRNAs signatures for OS, and the area under the curve (AUC) were calculated using “timeROC” package (0.3). p < 0.05 indicated statistical significance.
Results
Identification of m6A-Related lncRNAs in CRC Patients
To assess the biological function of m6A-related lncRNAs in the initiation and development of CRC, we downloaded the expression profiling datasets of 41 normal tissues and 473 CRC tissues from the available The Cancer Genome Atlas (TCGA) dataset. We then extracted the expression matrices of 23 m6A regulators from the TCGA dataset. A lncRNA whose expression value was correlated with one or more of the 23 m6A regulators (| Pearson R| >0.4 and p < 0.001) was defined as a m6A-related lncRNA. Pearson correlation analysis was performed and 1625 lncRNAs were obtained which were significantly correlated with m6A regulators. Combined with the clinical prognostic data downloaded from TCGA dataset, univariate Cox regression was then used to screen m6A-related prognostic lncRNAs from the 1625 m6A-related lncRNAs (p < 0.05). Finally, we found that 72 m6A-related lncRNAs were correlated with the OS of CRC patients, significantly. The expression levels of the 72 m6A-related prognostic lncRNAs in CRC and normal tissues were evident (Figure 1A and B). The results of univariate Cox analysis of the 72 m6A-related lncRNAs and the network between the 72 lncRNAs and the m6A regulators are shown in Figure 1C and D. These results indicated that m6A-related lncRNAs play important roles in the CRC patients.
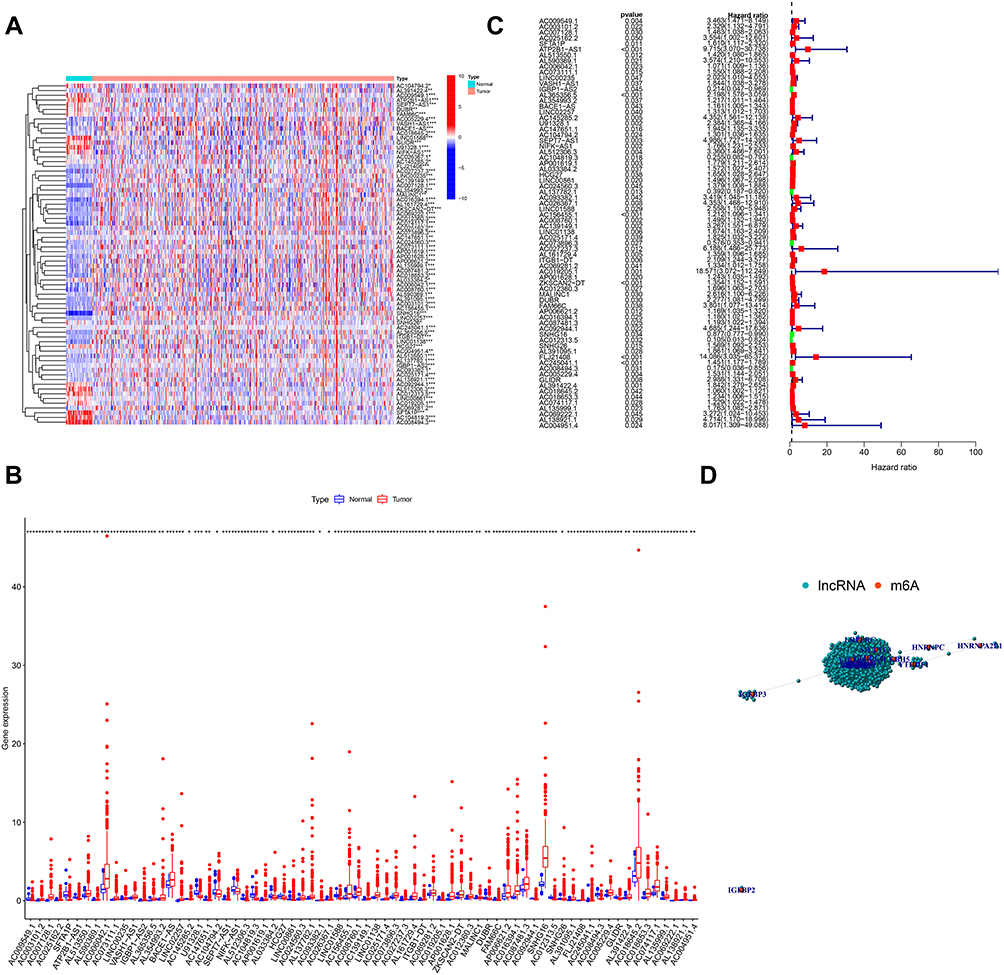 |
Figure 1 Identification of m6A-related lncRNAs in CRC in TCGA Cohort. Notes: Heatmap (A) and expression levels (B) of 72 m6A-related prognostic lncRNAs in 41 normal tissues and 473 CRC tissues. (C) Univariate Cox regression results of 72 m6A-related prognostic lncRNAs. (D) The network between m6A regulators and the 72 prognostic m6A-related lncRNAs. |
Consensus Clustering for m6A-Related lncRNAs Correlated with the Clinicopathological Features, Survival and PD-L1 Level of CRC Patients
The k = 2 was identified with optimal clustering stability based on the similarity displayed by the expression levels of m6A-related lncRNAs and the proportion of ambiguous clustering measure. A total of 446 patients with CRC were clustered into two subtypes, namely, cluster 1 (n = 347) and cluster 2 (n =99), based on the expression levels of the m6A-related lncRNAs (Figure 2A). The expression of individual m6A-related lncRNAs was lower in the cluster 1 than in the cluster 2. The clinicopathological features between the two subtypes were then compared (Figure 2B). The cluster 1 was preferentially associated with a low TNM stage (p < 0.05). The overall survival (OS, p =0.002) of the cluster 1 was longer than those of the cluster 2 (Figure 2C). In order to investigate the involvement of PD-L1 with m6A-related lncRNAs, we assessed differential PD-L1 expression in two subtypes and the correlation of PD-L1 with m6A-related lncRNAs. The expression level of PD-L1 in the cluster 1 was distinctly higher than that in the cluster 2 (p < 0.001; Figure 2D). In the TCGA cohort, the expression of PD-L1 had a significantly positive association with AL512306.3, LINC00861 and SNHG26 expression levels, whereas a significantly negative correlation was noted with AC005229.4, AC074117.1 and AC069281.2 expression levels (Figure S1).
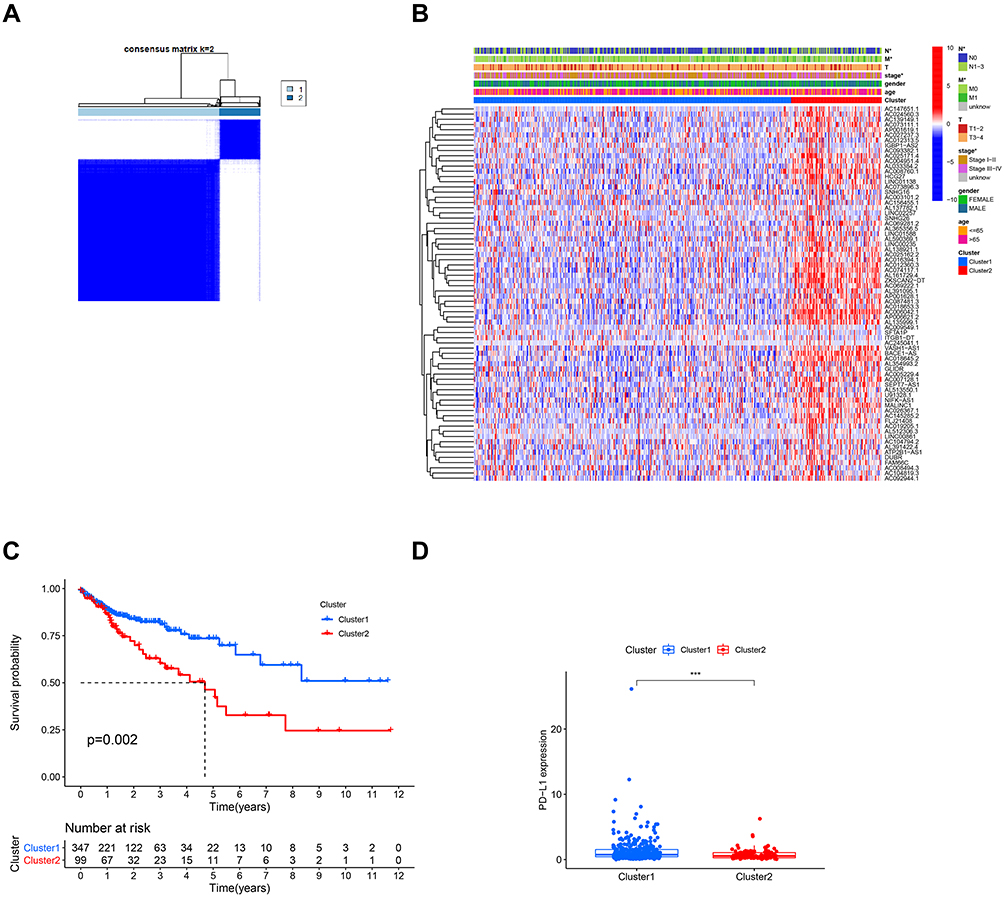 |
Figure 2 Differential clinicopathological features and survival of CRC in cluster 1/2 subtypes. Notes: (A) Consensus clustering matrix for k = 2. (B) Heatmap and clinicopathologic features of the two clusters (cluster 1/2). (C) Kaplan-Meier curves of overall survival (OS) for patients with CRC in two clusters (cluster 1/2). (D) The expression level of PD-L1 in cluster 1/2 subtypes in TCGA cohort. ***p < 0.001. |
Consensus Clustering for m6A-Related lncRNAs Associated with Significant Immune Cell Infiltration
To further explore the effect of m6A-related lncRNAs on the TIME of CRC, we evaluated the immunoscore and immune infiltrate level between the cluster 1 and cluster 2. The cluster 1 demonstrated a higher immunoscore than that of the cluster 2 (Figure 3A; p < 0.001). In addition, the fraction of 22 immune cell types between the two subgroups was analyzed. The two clusters showed a significant difference in immune cell infiltration. Cluster 1 showed significant higher infiltration levels of macrophages M1, macrophages M2, Dendritic cells resting and Neutrophils, whereas cluster 2 was more correlated with Eosinophils and B memory cells infiltration (Figure 3B–H). Moreover, GSEA was performed to investigate the potential regulatory mechanisms resulting in differences in the TIME between the two subgroups. The results showed that Citrate cycle TCA cycle signaling (NES = 2.22, normalized p < 0.001), Glycolysis signaling (NES = 2.21, normalized p < 0.001), Arginine and proline metabolism (NES = 2.12, normalized p < 0.001) and Antigen processing and presentation (NES =0.69, normalized p < 0.01) were dynamically correlated with the cluster 1 (Figure 3I–L). Hence, these metabolism and immune regulating signaling pathways might be implicated in the distinct TIME of cluster 1/2.
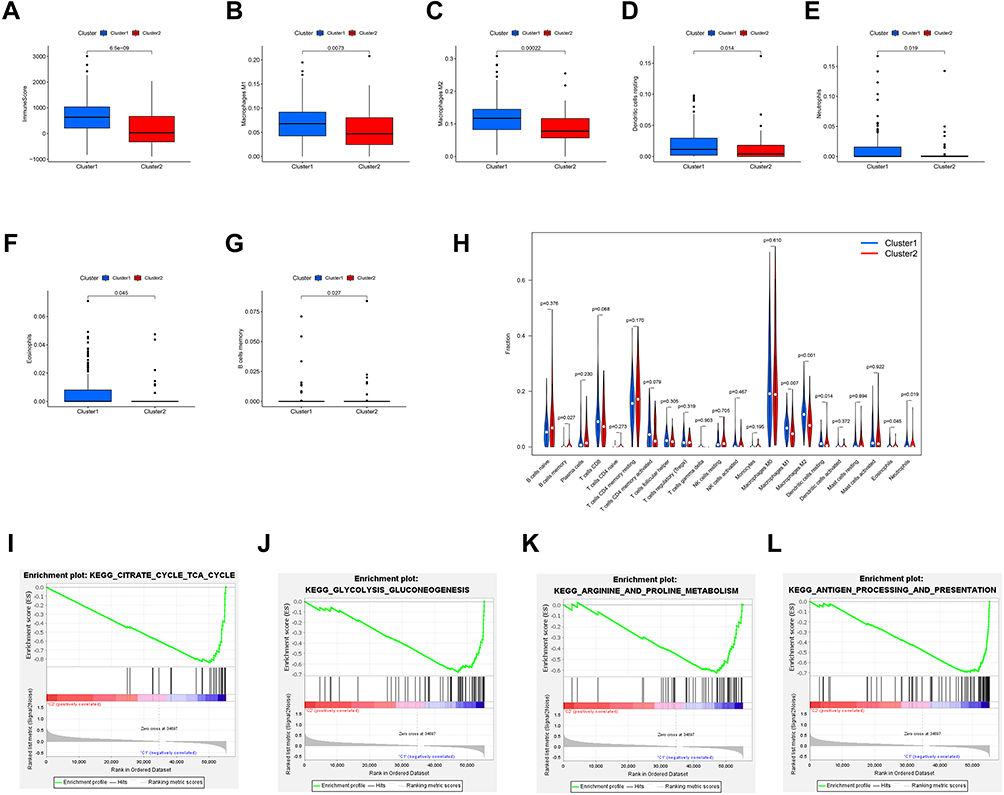 |
Figure 3 Distant immune cell infiltration in cluster 1/2 subtypes in TCGA Cohort. Abbreviations: ES, enrichment score; NES, normalized ES; NOM p value, normalized p value. Notes: (A) Immunoscore in the cluster 1/2 subtypes. (B–G) The infiltrating levels of the macrophages M1 (B), macrophages M2 (C), Dendritic cells resting (D), Neutrophils (E), Eosinophils (F), B memory cells (G) in two clusters. (H) The infiltrating levels of 22 immune cell types in cluster 1/2 subtypes in the TCGA cohort. (I–L) GSEA showed that Citrate cycle TCA cycle signaling, Glycolysis signaling, Arginine and proline metabolism signaling and Antigen processing and presentation signaling are differentially enriched in cluster 1. |
Construction and Validation of Prognostic Signatures for m6A-Related lncRNAs
We explored the prognostic role of m6A-related lncRNAs in CRC patients. The 446 patients were divided into the TCGA training cohort (224 patients) and validation cohort (222 patients) randomly. To further predict the clinical outcome of m6A-related lncRNAs in CRC patients, LASSO regression analysis based on the expression values of m6A-related lncRNAs was performed. Finally, 19 m6A-related lncRNAs were identified. The risk scores were calculated based on the coefficient for each lncRNA. Then, patients were divided into high- and low-risk groups based on the median value of risk scores. The distribution of the risk scores, expression profiles, OS and OS status of the m6A-related lncRNAs based signatures in TCGA training and validation cohorts was demonstrated in Figure 4A and B. The OS of the low-risk group was longer than that of the high-risk group in both the TCGA training and validation cohorts (Figure 4C and D). ROC curve analysis was further conducted to compare the respective AUC values. The AUC values for the 19 risk signatures were 0.827 and 0.678 in the TCGA training and validation cohort, respectively (Figure 4E and F). The AUC values showed that the signatures of the 19 m6A-related lncRNAs harbored a potential ability to predict the prognosis of patients with CRC. The prognostic value for m6A-related lncRNAs were also verified in distinct clinical subgroups such as age (≤65, or >65), gender (Male or Female) and stage (I–II or III–IV) (Figure S2).
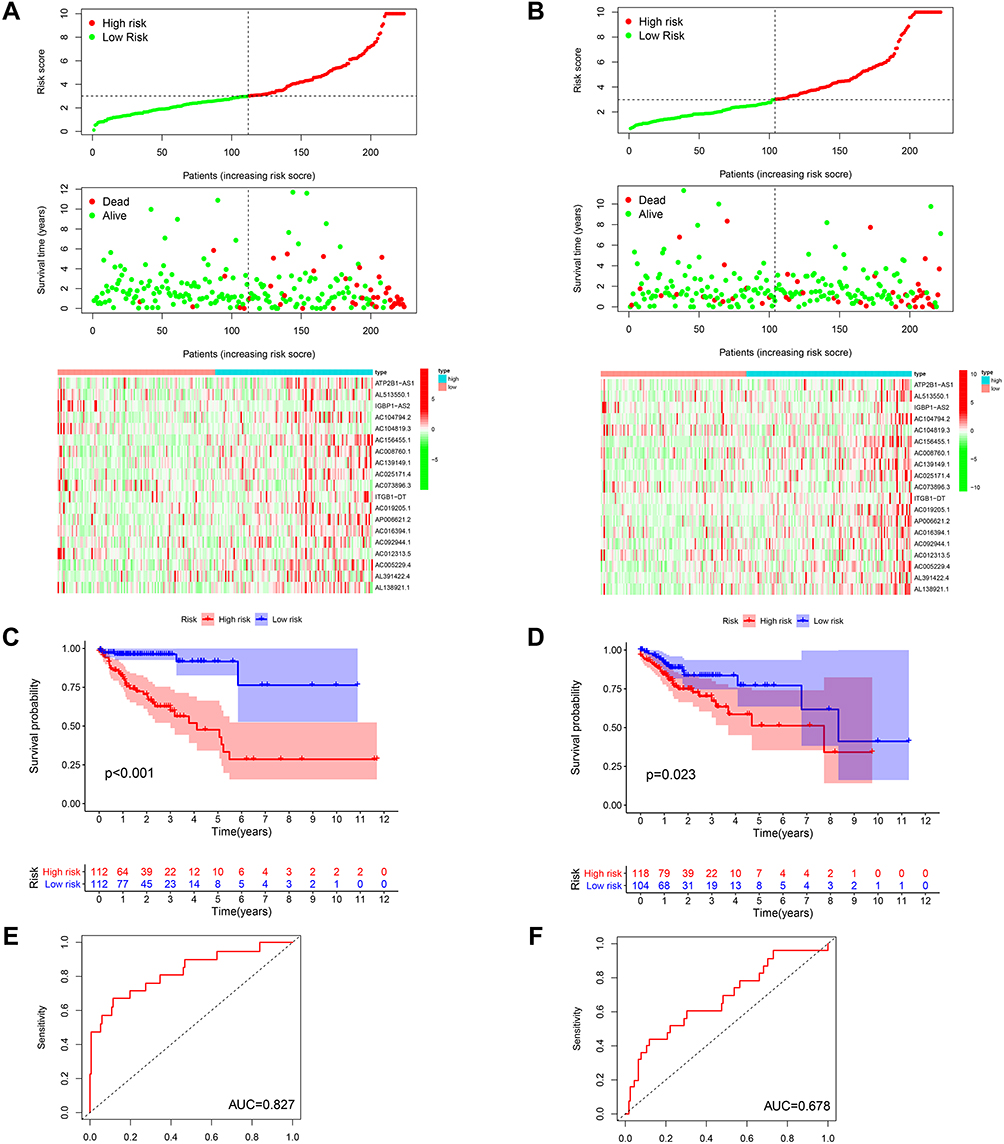 |
Figure 4 Construction and validation of prognostic signatures of m6A-related lncRNAs in TCGA Cohort. Notes: (A and B) Distribution of risk score, OS, and OS status and heatmap of the prognostic m6A-related lncRNAs in the TCGA training and validation cohort. (C and D) Kaplan-Meier curves of OS for patients with CRC based on the risk score in the TCGA training and validation cohort. (E and F) AUC for patients with CRC based on the risk score in the TCGA training and validation cohort. |
Prognostic Risk Scores Correlated with Clustering Subtypes, Histological Stage and PD-L1 Expression in CRC Patients
The relationship between risk scores and clinical features was further evaluated. The heatmap demonstrated the expression levels of 19 m6A-related lncRNAs in the high- and low-risk groups in the TCGA cohort (Figure 5A). The difference in terms of clustering subtypes (p < 0.001), stage (p < 0.001) between the high- and low-risk groups was significant, while the immunoscore showed no significance between the high- and low-risk groups (Figure 5D). The risk score of the cluster 1 was distinctly lower than that of the cluster 2 (p < 0.001, Figure 5B). The risk score increased along with the histological stage increased (p < 0.001, Figure 5C). These findings revealed that the risk score was significantly associated with clustering subtype and stage in CRC patients. Moreover, we found that patients with high-risk score had downregulated PD-L1 expression level than patients with low-risk score (Figure 5E). Univariate and multivariate Cox regression analysis showed that TNM stage (p < 0.001) and risk score (p < 0.001) were considerably associated with the OS in the TCGA training cohort (Figure 6A). In the TCGA validation cohort, univariate Cox analysis revealed that TNM stage (p =0.001) and risk score (p < 0.05) were highly related to the OS, while multivariate Cox analysis indicated that TNM stage (p < 0.001) was still significantly associated with OS (Figure 6B), risk score showed no significance with OS.
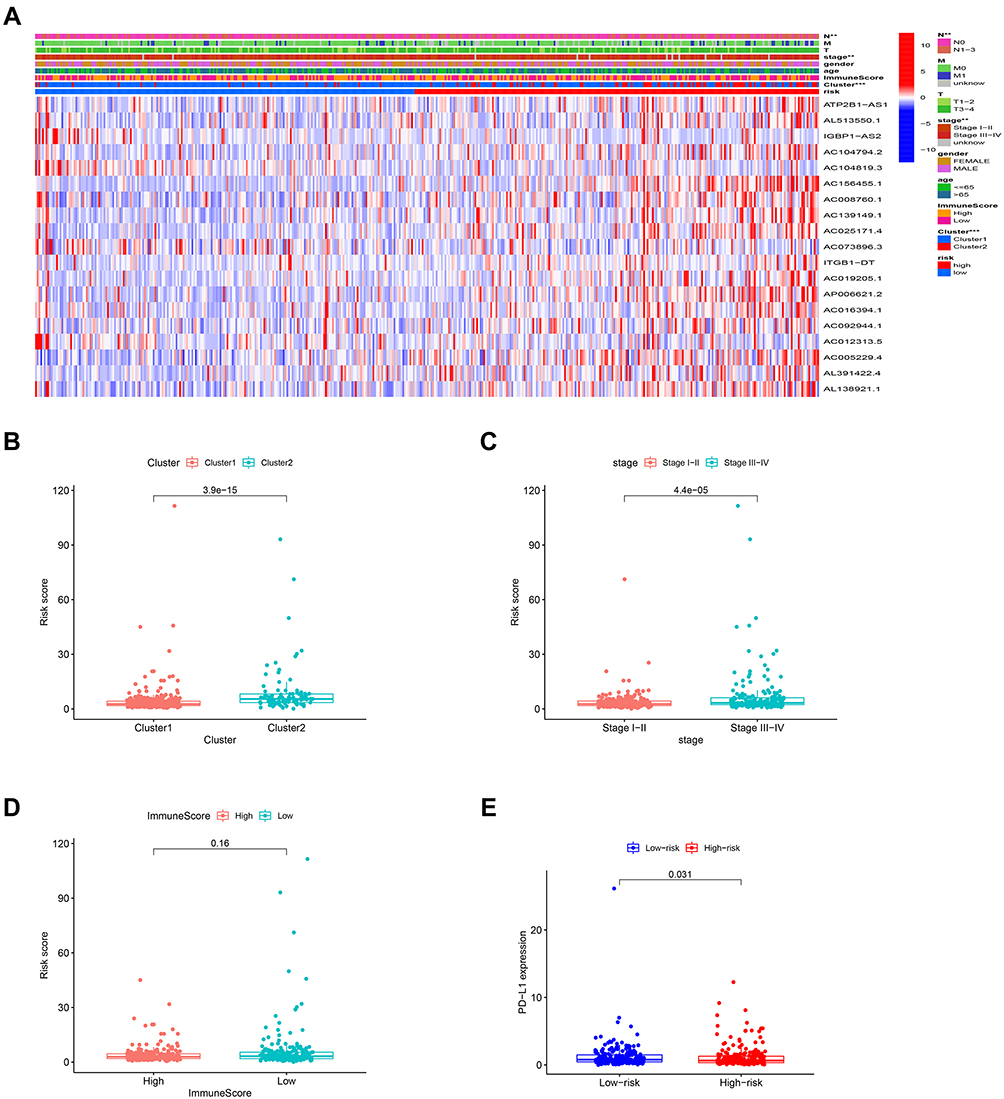 |
Figure 5 Prognostic risk scores correlated with clustering subtypes, stage and PD-L1 expression in TCGA cohort. Notes: (A) Heatmap and clinicopathologic features of high- and low-risk groups. (B–E) Distribution of risk scores stratified by cluster 1/2 (B), stage (C), immunoscore (D), and PD-L1 (E). **p < 0.01, and ***p < 0.001. |
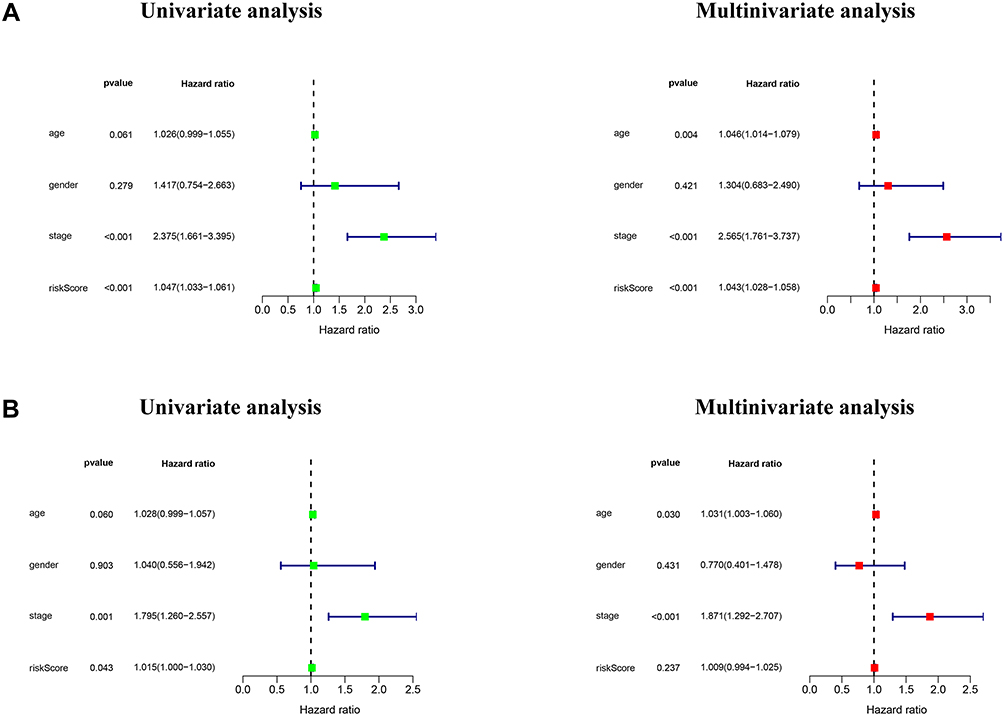 |
Figure 6 Independent validation of m6A-related lncRNAs based risk score model. Notes: (A and B) Univariate and multivariate analyses of risk score based on the m6A-related lncRNA prognostic signature in the TCGA training and validation cohort. |
Effect of m6A-Related lncRNAs on Immune Cell Infiltration
The relationship between the risk score and infiltration of immune cells was analyzed to forecast the effect of 19 m6A-related lncRNAs based signatures on the CRC immune microenvironment. A significantly negative correlation was observed between the risk score and infiltration levels of the T cells CD4 memory resting (p < 0.05) and Neutrophils (p < 0.05, Figure 7A and B). The risk score was positively correlated with the infiltration levels of Macrophages M0 (p < 0.01, Figure 7C). The result confirmed that m6A-related lncRNAs based risk signatures were implicated in the CRC immune microenvironment. These results indicated that m6A-related lncRNAs had essential regulatory effects on the TIME for CRC patients.
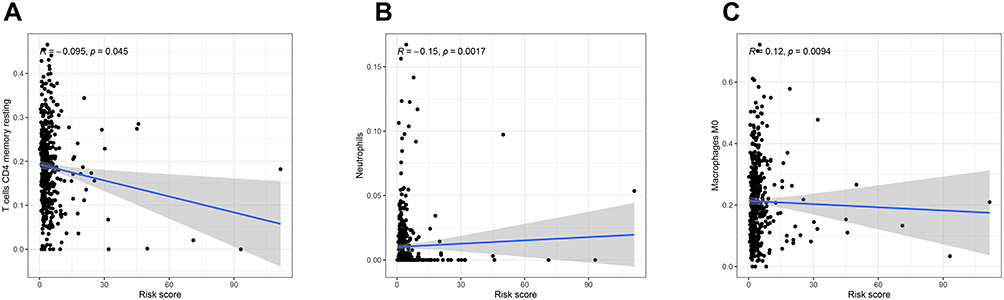 |
Figure 7 Relationships between the risk score and infiltration abundances of immune cell types. Notes: (A), T cells CD4 memory resting (B), Neutrophil (C), Macrophage M0. |
Discussion
Recently, several studies have indicated that m6A regulators play essential roles in the progression of kinds of tumors by modulating specific lncRNAs. For example, ALKBH5 promotes colon cancer progression by decreasing methylation of the lncRNA NEAT1 and inhibits pancreatic cancer motility by decreasing lncRNA KCNK15-AS1 methylation.19,20 METTL14 suppresses proliferation and metastasis of colorectal cancer by down-regulating oncogenic long non-coding RNA XIST.11 ALKBH5-mediated m6A demethylation of lncRNA PVT1 plays an oncogenic role in osteosarcoma.21 Negatively regulated by the m6A reader YTHDF3, lncRNA GAS5 inhibits progression of colorectal cancer by interacting with and triggering YAP phosphorylation and degradation.22 These studies had indicated that m6A modification of lncRNAs could influence the occurrence and progression of several tumors. However, at present the role of m6A-related lncRNAs in the TIME of CRC has yet to be fully explored.
A total of 41 normal tissues and 473 CRC tissues from the TCGA dataset were included in our study and 72 m6A-related lncRNAs were found to be associated with the OS of CRC patients. In addition, the expression patterns and effect on the TIME of m6A-related lncRNAs in CRC were demonstrated. We identified two subtypes of CRC, cluster 1 and cluster 2, by consensus clustering for m6A-related lncRNAs. The patients in the cluster 1 showed a low histological stage; similarly, the cluster 1 had a preferred survival, compared with that of the cluster 2. The PD-L1 expression level and immunoscore of the cluster 1 were significantly higher than that of the cluster 2. There is a significant survival difference between the two clusters, which may be associated with the higher immunoscore and PD-L1 expression level in cluster 1. This finding was consistent with a previous study, which indicated that the prognosis of patients with high immunoscore and PD-L1 level is better than that of patients with low immunoscore and PD-L1 level.14 Further analysis showed that the infiltration levels of macrophages M1, macrophages M2, Dendritic cells resting, and Neutrophils in the cluster 1 were higher than those in the cluster 2. Conversely, the infiltration levels of Eosinophils and B memory cells in the cluster 2 were higher than those in the cluster 1. The GSEA results indicated that the Citrate cycle TCA cycle signaling, Glycolysis signaling, Arginine and proline metabolism were significantly enriched in the cluster 1. It is reported that lncRNA LINRIS promotes the aerobic glycolysis in colorectal cancer;23 ALKBH5 regulates anti–PD-1 therapy response by modulating lactate and suppressive immune cell accumulation in tumor microenvironment.24 These studies suggested that metabolism signaling pathway molecules may serve as targets for m6A-related lncRNAs.
The prognostic value of the m6A-related lncRNAs was further evaluated in patients with CRC. The risk score obtained from 19 m6A-related lncRNAs effectively stratified the CRC patients into high- and low-risk groups. The OS of the patients in high-risk group was shorter than that of the patients in low-risk group in the TCGA training and validation cohorts. The risk score of the cluster 2 was significantly higher than those of the cluster 1. Moreover, patients in low-risk group had higher PD-L1 expression level than in high-risk group. Consequently, the identification of m6A-related lncRNAs can predict the prognosis of patients with CRC, thereby providing novel insights into the immunotherapy of CRC patients.
Tumor microenvironment plays an essential regulatory role in tumorigenesis, and its heterogeneity can lead to multiple dimensions, including the prognosis and therapeutic response in patients.25,26 In the present study, the risk score based on the 19 risk signatures of m6A-related lncRNAs was significantly correlated with the PD-L1 expression level and immune cell infiltration. Risk scores were negatively correlated with the infiltration levels of T cells CD4 memory resting (p < 0.05) and Neutrophils but were positively correlated with the infiltration levels of Macrophages M0. These findings indicated that m6A-related lncRNAs are involved in TIME regulation of CRC to some extent.
However, there are still several limitations in our study. Firstly, our results were substantiated in TCGA cohorts, and further external validation in the multicenter cohorts is needed to be carried out. Additionally, the specific mechanism of m6A-related lncRNAs in TIME of CRC need to be further explored.
In conclusion, this study explored the correlation of PD-L1, role in the TIME, prognostic value and potential regulatory mechanisms of m6A-related lncRNAs in CRC. Two CRC subtypes (cluster 1/2) were determined via the consensus clustering for m6A-related lncRNAs that stratified the prognosis of patients with CRC and presented the significantly different TIME. The risk score developed from 19 m6A-related lncRNAs based signatures was an independent prognostic indicator of patients with CRC and the m6A-related lncRNAs based risk signatures were associated with the immune cell infiltration levels of patients with CRC. Therefore, m6A-related lncRNAs may provide some new clues for further researches in the immunotherapy of CRC.
Acknowledgment
The authors would like to thank the TCGA, and TIMER databases for the availability of the data. The current study was funded by the National Natural Science Foundation of China (Grant No.81900557).
Disclosure
The authors declare no competing interests in this work.
References
1. Siegel RL, Miller KD, Goding Sauer A, et al. Colorectal cancer statistics, 2020. CA: A Cancer Journal for Clinicians. 2020;70(3):145–164.
2. Schmoll HJ, Van Cutsem E, Stein A, et al. ESMO consensus guidelines for management of patients with colon and rectal cancer. A personalized approach to clinical decision making. Ann Oncol. 2012;23(10):2479–2516.
3. Mahajan UM, Langhoff E, Goni E, et al. Immune cell and stromal signature associated with progression-free survival of patients with resected pancreatic ductal adenocarcinoma. Gastroenterology. 2018;155(5):1625–1639.e1622. doi:10.1053/j.gastro.2018.08.009
4. Fridman WH, Zitvogel L, Sautès-Fridman C, Kroemer G. The immune contexture in cancer prognosis and treatment. Nat Rev Clin Oncol. 2017;14(12):717–734. doi:10.1038/nrclinonc.2017.101
5. Turley SJ, Cremasco V, Astarita JL. Immunological hallmarks of stromal cells in the tumour microenvironment. Nat Rev Immunol. 2015;15(11):669–682. doi:10.1038/nri3902
6. Le DT, Durham JN. Mismatch repair deficiency predicts response of solid tumors to PD-1 blockade. Science. 2017;357(6349):409–413.
7. Xiao Y, Freeman GJ. The microsatellite instable subset of colorectal cancer is a particularly good candidate for checkpoint blockade immunotherapy. Cancer Discov. 2015;5(1):16–18. doi:10.1158/2159-8290.CD-14-1397
8. Fu Y, Dominissini D, Rechavi G, He C. Gene expression regulation mediated through reversible m6A RNA methylation. Nat Rev Genet. 2014;15(5):293–306. doi:10.1038/nrg3724
9. Wang X, Lu Z, Gomez A, et al. N6-methyladenosine-dependent regulation of messenger RNA stability. Nature. 2014;505(7481):117–120. doi:10.1038/nature12730
10. He L, Li H, Wu A, Peng Y, Shu G, Yin G. Functions of N6-methyladenosine and its role in cancer. Mol Cancer. 2019;18(1):176.
11. Yang X, Zhang S, He C, et al. METTL14 suppresses proliferation and metastasis of colorectal cancer by down-regulating oncogenic long non-coding RNA XIST. Mol Cancer. 2020;19(1):46.
12. Tao L, Mu X, Chen H, et al. FTO modifies the m6A level of MALAT and promotes bladder cancer progression. Clin Transl Med. 2021;11(2):e310.
13. Zhong L, Liao D, Zhang M, et al. YTHDF2 suppresses cell proliferation and growth via destabilizing the EGFR mRNA in hepatocellular carcinoma. Cancer Lett. 2019;442:252–261. doi:10.1016/j.canlet.2018.11.006
14. Chong W, Shang L, Liu J, et al. m(6)A regulator-based methylation modification patterns characterized by distinct tumor microenvironment immune profiles in colon cancer. Theranostics. 2021;11(5):2201–2217. doi:10.7150/thno.52717
15. Eddy SR. Non-coding RNA genes and the modern RNA world. Nat Rev Genet. 2001;2(12):919–929. doi:10.1038/35103511
16. Silva-Fisher JM, Dang HX, White NM, et al. Long non-coding RNA RAMS11 promotes metastatic colorectal cancer progression. Nat Commun. 2020;11(1):2156.
17. Lan Y, Xiao X, He Z, et al. Long noncoding RNA OCC-1 suppresses cell growth through destabilizing HuR protein in colorectal cancer. Nucleic Acids Res. 2018;46(11):5809–5821. doi:10.1093/nar/gky214
18. Liu J, Zhan Y, Wang J, Wang J, Guo J, Kong D. Long noncoding RNA LINC01578 drives colon cancer metastasis through a positive feedback loop with the NF-κB/YY1 axis. Mol Oncol. 2020;14(12):3211–3233.
19. Guo T, Liu DF, Peng SH, Xu AM. ALKBH5 promotes colon cancer progression by decreasing methylation of the lncRNA NEAT1. Am J Transl Res. 2020;12(8):4542–4549.
20. He Y, Hu H, Wang Y, et al. ALKBH5 inhibits pancreatic cancer motility by decreasing long non-coding RNA KCNK15-AS1 methylation. Cell Physiol Biochem. 2018;48(2):838–846. doi:10.1159/000491915
21. Chen S, Zhou L, Wang Y. ALKBH5-mediated m(6)A demethylation of lncRNA PVT1 plays an oncogenic role in osteosarcoma. Cancer Cell Int. 2020;20:34. doi:10.1186/s12935-020-1105-6
22. Ni W, Yao S, Zhou Y, et al. Long noncoding RNA GAS5 inhibits progression of colorectal cancer by interacting with and triggering YAP phosphorylation and degradation and is negatively regulated by the m(6)A reader YTHDF3. Mol Cancer. 2019;18(1):143. doi:10.1186/s12943-019-1079-y
23. Wang Y, Lu JH, Wu QN, et al. LncRNA LINRIS stabilizes IGF2BP2 and promotes the aerobic glycolysis in colorectal cancer. Mol Cancer. 2019;18(1):174.
24. Li N, Kang Y, Wang L, et al. ALKBH5 regulates anti-PD-1 therapy response by modulating lactate and suppressive immune cell accumulation in tumor microenvironment. Proc Natl Acad Sci U S A. 2020;117(33):20159–20170. doi:10.1073/pnas.1918986117
25. Galon J, Mlecnik B, Bindea G, et al. Towards the introduction of the ‘immunoscore’ in the classification of malignant tumours. J Pathol. 2014;232(2):199–209. doi:10.1002/path.4287
26. Hui L, Chen Y. Tumor microenvironment: sanctuary of the devil. Cancer Lett. 2015;368(1):7–13. doi:10.1016/j.canlet.2015.07.039
 © 2021 The Author(s). This work is published and licensed by Dove Medical Press Limited. The full terms of this license are available at https://www.dovepress.com/terms.php and incorporate the Creative Commons Attribution - Non Commercial (unported, v3.0) License.
By accessing the work you hereby accept the Terms. Non-commercial uses of the work are permitted without any further permission from Dove Medical Press Limited, provided the work is properly attributed. For permission for commercial use of this work, please see paragraphs 4.2 and 5 of our Terms.
© 2021 The Author(s). This work is published and licensed by Dove Medical Press Limited. The full terms of this license are available at https://www.dovepress.com/terms.php and incorporate the Creative Commons Attribution - Non Commercial (unported, v3.0) License.
By accessing the work you hereby accept the Terms. Non-commercial uses of the work are permitted without any further permission from Dove Medical Press Limited, provided the work is properly attributed. For permission for commercial use of this work, please see paragraphs 4.2 and 5 of our Terms.