")
Back to Journals » Diabetes, Metabolic Syndrome and Obesity » Volume 13
Insulin Resistance is Associated with Gut Permeability Without the Direct Influence of Obesity in Young Adults
Authors Mkumbuzi L , Mfengu MMO , Engwa GA , Sewani-Rusike CR
Received 4 April 2020
Accepted for publication 2 July 2020
Published 24 August 2020 Volume 2020:13 Pages 2997—3008
DOI https://doi.org/10.2147/DMSO.S256864
Checked for plagiarism Yes
Review by Single anonymous peer review
Peer reviewer comments 2
Editor who approved publication: Prof. Dr. Juei-Tang Cheng
Lusikelelwe Mkumbuzi,1 Mvuyisi MO Mfengu,1 Godwill A Engwa,2 Constance R Sewani-Rusike1
1Department of Human Biology, Faculty of Health Sciences, Walter Sisulu University, Mthatha 5117, South Africa; 2Department of Biological and Environmental Sciences, Faculty of Natural Sciences, Walter Sisulu University, Mthatha 5117, South Africa
Correspondence: Constance R Sewani-Rusike
Department of Human Biology, Faculty of Health Sciences, Walter Sisulu University, PBX1, Mthatha 5117, South Africa
Email [email protected]
Objective: Recent findings have associated insulin resistance and obesity with increased gut permeability. However, it still remains unclear whether obesity may be the underlining factor for the association between gut permeability and insulin resistance. This study investigated the relationship between gut permeability, measures of obesity, and markers of insulin resistance in young adults.
Materials and Methods: A cross-sectional quantitative study which enrolled 151 young South African adults was conducted. Anthropometric measurements were performed to assess obesity. Adiponectin, leptin, and zonulin, a marker for gut permeability, were assayed. Insulin and fasting glucose were assayed and used to determine insulin resistance (HOMA-IR), insulin sensitivity (%S) and beta cell function (%B).
Results: Decreased adiponectin and increased leptin were associated (p< 0.05) with obesity. HOMA-IR inversely correlated (p< 0.05) with adiponectin but positively with leptin to adiponectin (Lept/ADP) ratio (p< 0.05) in females. Markers of insulin resistance were not associated (p> 0.05) with obesity. Overweight/obese (O/O) females had a significantly (p< 0.01) higher zonulin concentration than lean females. Zonulin positively associated (p< 0.05) with body mass index and visceral fat, as well as with HOMA-IR and insulin concentration. Lept/ADP ratio, an inflammatory marker, was associated with risk of insulin resistance. Increased insulin, a maker for insulin resistance, was associated with risk of gut permeability.
Conclusion: Insulin resistance was associated with gut permeability without a direct influence by obesity in young adults. The lack of relationship between obesity and insulin resistance was possibly mediated by the contribution of obesity to gut permeability. This finding suggests that gut permeability may be a potential independent risk factor for the development of insulin resistance in healthy obese young adults.
Keywords: obesity, gut permeability, inflammation, insulin resistance
Introduction
Insulin resistance is a metabolic state in which cells fail to sufficiently respond to insulin.1 This insulin impaired response results in decreased uptake of glucose by muscle and adipose tissues.1 Insulin resistance, characterised by hyperinsulinaemia and hyperglycaemia leads to the development of type 2 diabetes mellitus (T2DM).2 It is estimated that diabetes mellitus affects more than 415 million people which translates to 8.8% of people worldwide.3 According to International Diabetes Federation (IDF), it was estimated that 7% (3.6–14.1%), that is, 2.286 million South African adults (20–79 years) were diabetic in 2017.4 Also, over five million South Africans are pre-diabetic (insulin resistant) and there are many more who are undiagnosed.5
Several factors such as obesity, smoking, alcohol, physical inactivity, genetics, and advancing age contribute to the development of insulin resistance among which obesity is considered to be the primary factor.6 Obesity is characterized by increased adipose tissue because of the consumption of a high fat/energy diet and lack of physical activity. The excess energy is stored in adipocytes as triglycerides under the control of insulin. In adipocytes, adipokines such as leptin and adiponectin, among others, are produced to modulate lipid metabolism.7 Leptin is a pro-inflammatory adipokine that regulates food-intake and energy expenditure, and therefore, leptin concentration in adipose tissue is dependent on the amount of energy stored.8 Increased adipocyte size due to obesity increases leptin synthesis leading to leptin resistance. As such, hyperleptinaemia (leptin resistance) is associated with obesity, low grade inflammation and insulin resistance.9 Adiponectin, on the other hand, is an anti-inflammatory adipokine molecule that regulates the storage of fatty acid in adipocytes and has been shown to increase the expression of enzymes involved in β-oxidation of fatty acids reducing circulatory free fatty acids thereby preventing the development of insulin resistance.10 In obesity, adipocyte hypertrophy results in compromised blood supply to adipose tissue resulting in the development of a hypoxic state.11 In the hypoxic state, the adipocytes release chemokines that induces the recruitment of macrophages to the adipose tissue thus promoting the production of pro-inflammatory cytokines. Studies have shown that obesity induces pro-inflammatory factors such as TNF-α, IL-1β and IL-6, as well as hypoxia and oxidative stress, inhibiting adiponectin production in adipocytes.12 Also, leptin upregulates pro-inflammatory cytokines in adipocytes.13 Evidence indicates that obesity promotes chronic low-grade inflammatory state, shown by increased levels of inflammatory markers which contribute directly to the development of insulin resistance14 and T2DM.15 Studies have reported that increased leptin: adiponectin ratio is strongly associated with metabolic syndrome (MetS) and cardiovascular disease risk than isolated leptin or adiponectin concentrations.16
Obesity and inflammation are also associated with increased intestinal permeability.17,18 In the human gastrointestinal tract, there are trillions of microorganisms collectively called microbiota. Under normal conditions, the intestinal mucosa is permeable to nutrients and water but serve as a barrier to microbiota from penetrating and entering the circulation through tight junctions. Alterations in the composition of microbiota by high-fat diet, obesity and local intestinal inflammation can result in the secretion of zonulin by enterocytes resulting in further disruption of tight junctions and leaky intestinal mucosa.18 This increases the seepage of bacteria and bacterial components such as lipopolysaccharide (LPS) across the intestinal mucosa.19 A high blood endotoxin level can further trigger local inflammation or gain access to circulation and contribute to systemic inflammation through cytokine release. Continuous infusion of endotoxins or high endotoxin levels in the blood may, therefore, worsen peripheral inflammation associated with obesity. It is postulated that endotoxin-induced inflammation which results from gut-permeability also contributes to the development of insulin resistance.20
Though some studies have shown gut permeability to be associated with insulin resistance,21 it still remains unclear whether obesity may be the underlining factor for the association between gut permeability and insulin resistance as obesity and inflammation have been shown to be major contributors to the development of insulin resistance.22 Since obesity-induced insulin resistance is age dependent, often observed in older population than in young adults, studies in young apparently healthy adults are scarce.23,24 Therefore, the purpose of this study was to investigate gut permeability as a potential contributor to insulin resistance in apparently healthy obese young adult population.
Materials and Methods
Study Design and Population
This was a cross-sectional quantitative study which enrolled 18–25-year-old, apparently healthy students at Walter Sisulu University, Mthatha, Eastern Cape Province of South Africa.
Ethical Consideration
The study was conducted in accordance with the guidelines of the Helsinki Declaration (2008 reviewed version) as well as local and national regulations in South Africa. Ethical approval was obtained from the Walter Sisulu University Faculty of Health Sciences Research Ethics Committee with approval number: [040/2019] on the 26th of June 2019. After careful explanation of the purpose and aim of the study, written informed consent was obtained from each volunteering student before enrolment into the study. The study adhered to the standards of reporting and was in accordance with the National Data Protection Acts as the identity of the participants was kept confidential. There were no important changes in the methods after study commencement.
Inclusion/Exclusion Criteria
Registered students both male and female of Walter Sisulu University aged 18–25 years who had fasted overnight were recruited for the study. Students with or any history of diagnosed diabetes and on medication, weight loss programmes or on medication, chronic intestinal disorder, previous surgery within the gastrointestinal tract, immune suppressing medication, history of liver diseases, pregnant or lactating were excluded from the study.
Anthropometric Measurements
Anthropometric measurements were performed in accordance with the International Standards for Anthropometric Assessments25 on all participants. Participants’ waist circumference (WC) was measured at the approximate mid-point between the lower margin of the last palpable rib and the top of the iliac crest using an anthropometric tape in centimetres (cm). Height was measured using a wall-mounted stadiometer (Electronic body scale TCS-200-RT) and recorded to the nearest 0.1cm. Body composition was assessed using the Omron (BF500) which uses bioelectrical impedance analysis and was used to measure weight (kg), body mass index (BMI) in kg/ , visceral fat (VF%) and skeletal muscle fat (SMF%). Participants with BMI<25 were considered lean while BMI≥25 were classified as overweight/obese (O/O) according to the International Obesity Task Force (IOTF) BMI Classification.26
Blood Collection and Biochemical Analysis
Five millilitre (5mL) of blood was collected into ethylenediaminetetraacetic acid (EDTA) tubes and fasting glucose was measured using Accu-Chek® Active glucometer (Roche Diabetes Care South Africa (Pty) Ltd). A portion of the whole blood was centrifuged (Eppendorf 5810 R) for 15 minutes at 1000×g to obtain plasma. The plasma was used to determine zonulin, insulin, adiponectin and leptin. Zonulin, insulin, adiponectin and leptin were measured using a commercial ELISA kit [Elabscience Biotechnology Co., Ltd with catalogue E-EL-H1507, E-EL-H2665, E-EL-H2665, E-EL-H0004 respectively] as per manufacturer’s protocol.
Assessment of Insulin Resistance
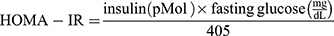
Fasting glucose concentration and plasma insulin concentration were computed in the HOMA2 calculator v2.2.3 (https://www.dtu.ox.ac.uk/homacalculator/download.php) to determine homeostasis model assessment of insulin resistance (HOMA‑IR), insulin sensitivity (%S) and beta-cell function (%B).
Statistical Analyses
Data were analysed using GraphPad Prism version 5 and IBM Statistical Package for Social Sciences (SPSS) version 20. The data were presented as mean ± standard error of mean (S.E.M) in tables and figures. Independent sample T-test was used to compare mean differences of continuous variables between lean and overweight/obese participants. Pearson correlation was used to determine the relationship between gut permeability, measures of obesity, and insulin resistance. The standardised beta coefficient (β) was determined by multiple linear regression analysis using continuous variables to predict the associated relationship between gut permeability, measures of obesity, and insulin resistance. A causal mediation analysis based on OLS regression analysis by Process.sps through custom dialogue in SPSS was performed to assess the mediatory effect of gut permeability on the relationship between obesity and insulin resistance. A p-value ≤0.05 was considered to be statistically significant.
Results
Characteristics of Study Participants
One hundred and fifty-one (151) participants participated in the study of which 77 (51%) were females and 74 (49%) were males. Based on BMI, 34.4% (52/151) of the participants were overweight/obese among which 32 were females while 20 were males. The study population matched for age and height as they were not significantly (p>0.005) different among overweight/obese and lean participants. The body weight, BMI, WC and VF% for overweight/obese individuals were significantly (p < 0.05) higher compared to lean individuals for the cohort and both gender (Table 1).
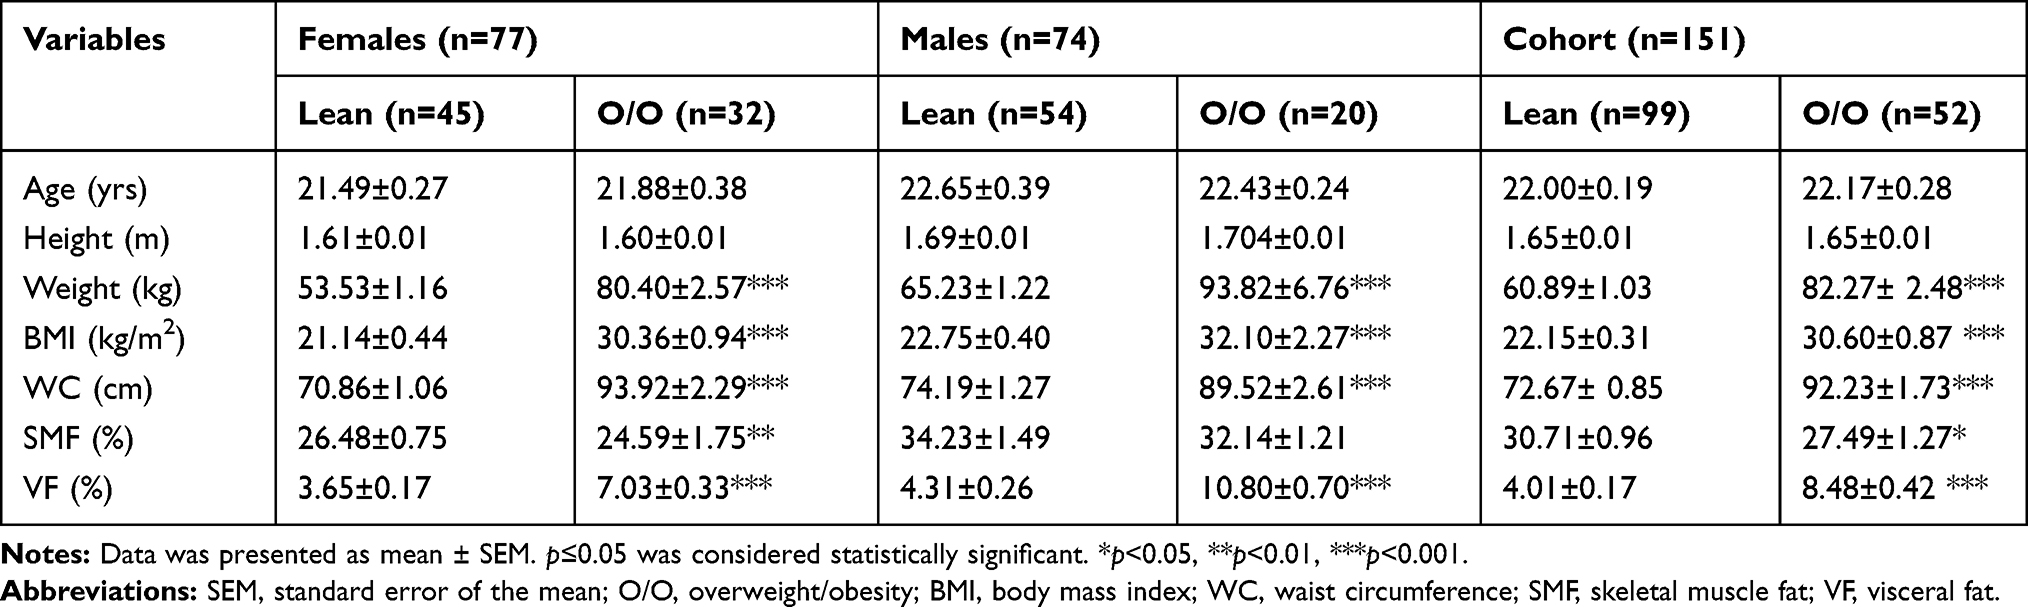 |
Table 1 Characteristics of Participants |
Effect of Obesity on Inflammatory Markers
Adiponectin, an anti-inflammatory markers was significantly (p<0.05) lower in overweight/obese individuals compared to their lean counterparts in the cohort and in males and females (Figure 1). Moreover, leptin which is a pre-inflammatory molecule was significantly (p<0.05) higher in overweight/obese individuals compared to lean participants in the cohort and in both gender (Figure 2). Similarly, leptin to adiponectin ratio was significantly (p<0.05) higher in overweight/obese than in lean individuals in the cohort and in both gender (Figure 3).
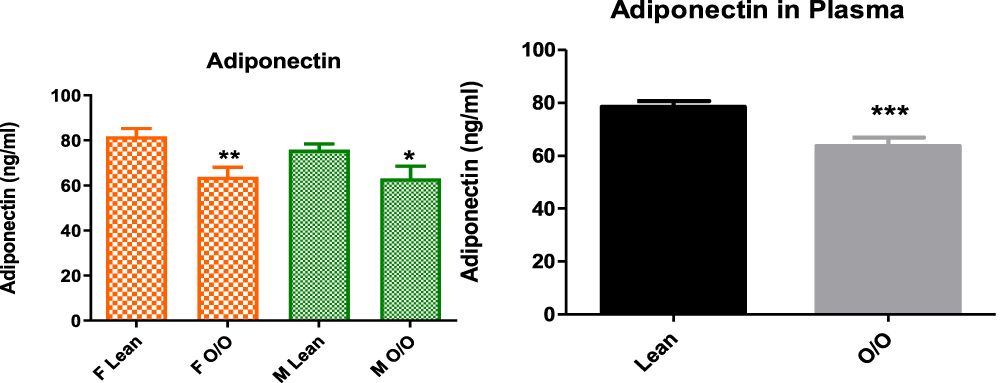 |
Figure 1 Plasma adiponectin level between overweight/obese and lean subjects. Data is expressed as mean ± standard error of the mean. p≤0.05 was considered statistically significant, *p<0.05, **p<0.01, ***p<0.001. |
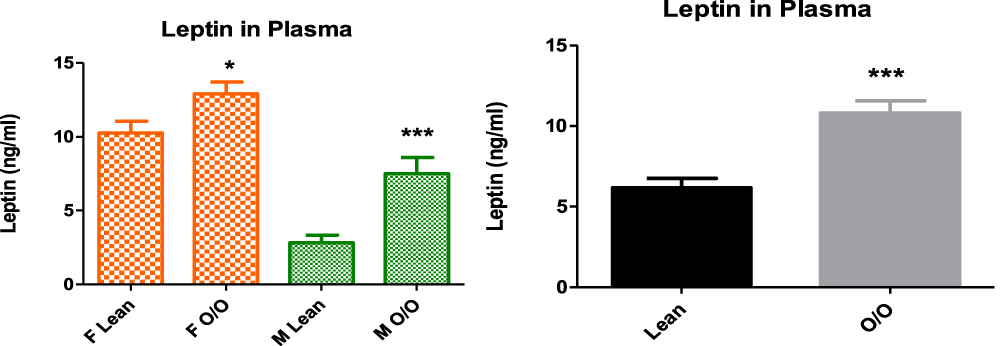 |
Figure 2 Plasma leptin level between overweight/obese and lean subjects. Data is expressed as mean ± standard error of the mean. p≤0.05 was considered statistically significant, *p<0.05, ***p<0.001. |
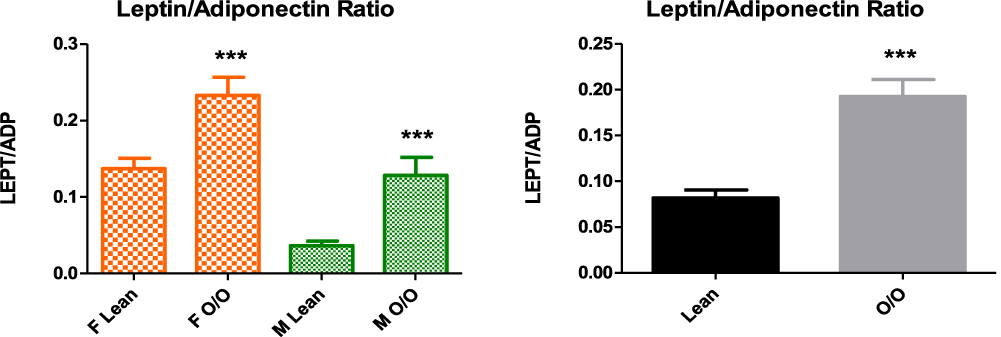 |
Figure 3 Leptin to adiponectin ratio between overweight/obese and lean subjects. Data is expressed as mean ± standard error of the mean. p≤0.05 was considered statistically significant, ***p<0.001. |
Effect of Obesity on Gut Permeability
Zonulin is a surrogate marker for gut permeability. In this study, overweight/obese females showed a significantly (p<0.01) higher zonulin concentration than lean females. In the cohort, the overweight/obese group showed a significantly (p<0.01) higher concentration of zonulin than the lean cohort group (Figure 4).
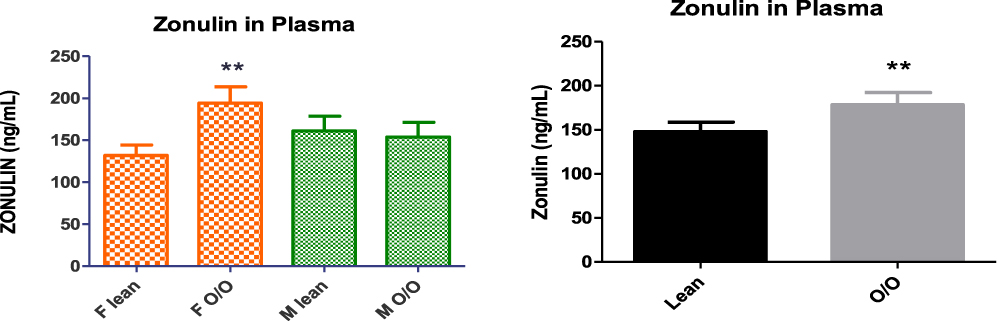 |
Figure 4 Plasma zonulin between lean and overweight/obese subjects. Data is expressed as mean ± standard error of the mean. p≤0.05 was considered statistically significant, **p<0.01. |
Effect of Obesity on Glucose Homeostasis and Insulin Action
All variables of insulin resistance; fasting glucose, insulin in plasma, HOMA-IR, percentage insulin sensitivity (%S) and beta cell function (%B) were similar (p>0.05) between lean and overweight/obese individuals across all groups for females, males, and the cohort (Table 2).
 |
Table 2 Markers of Glucose Homeostasis and Insulin Action |
Relationship of Insulin Resistance with Body Composition, Glucose Homeostasis and Inflammatory Markers
HOMA-IR correlated (p<0.0001) positively with insulin and beta-cell function (%B) but it was associated (p<0.01) negatively with insulin sensitivity (%S) in the cohort as well as in males and females. HOMA-IR positively associated (p<0.05) with fasting glucose in the cohort and in females. Adiponectin inversely correlated (p<0.05) with HOMA-IR in females while leptin to adiponectin ratio showed a (p<0.05) positive relationship with HOMA-IR in females (Table 3).
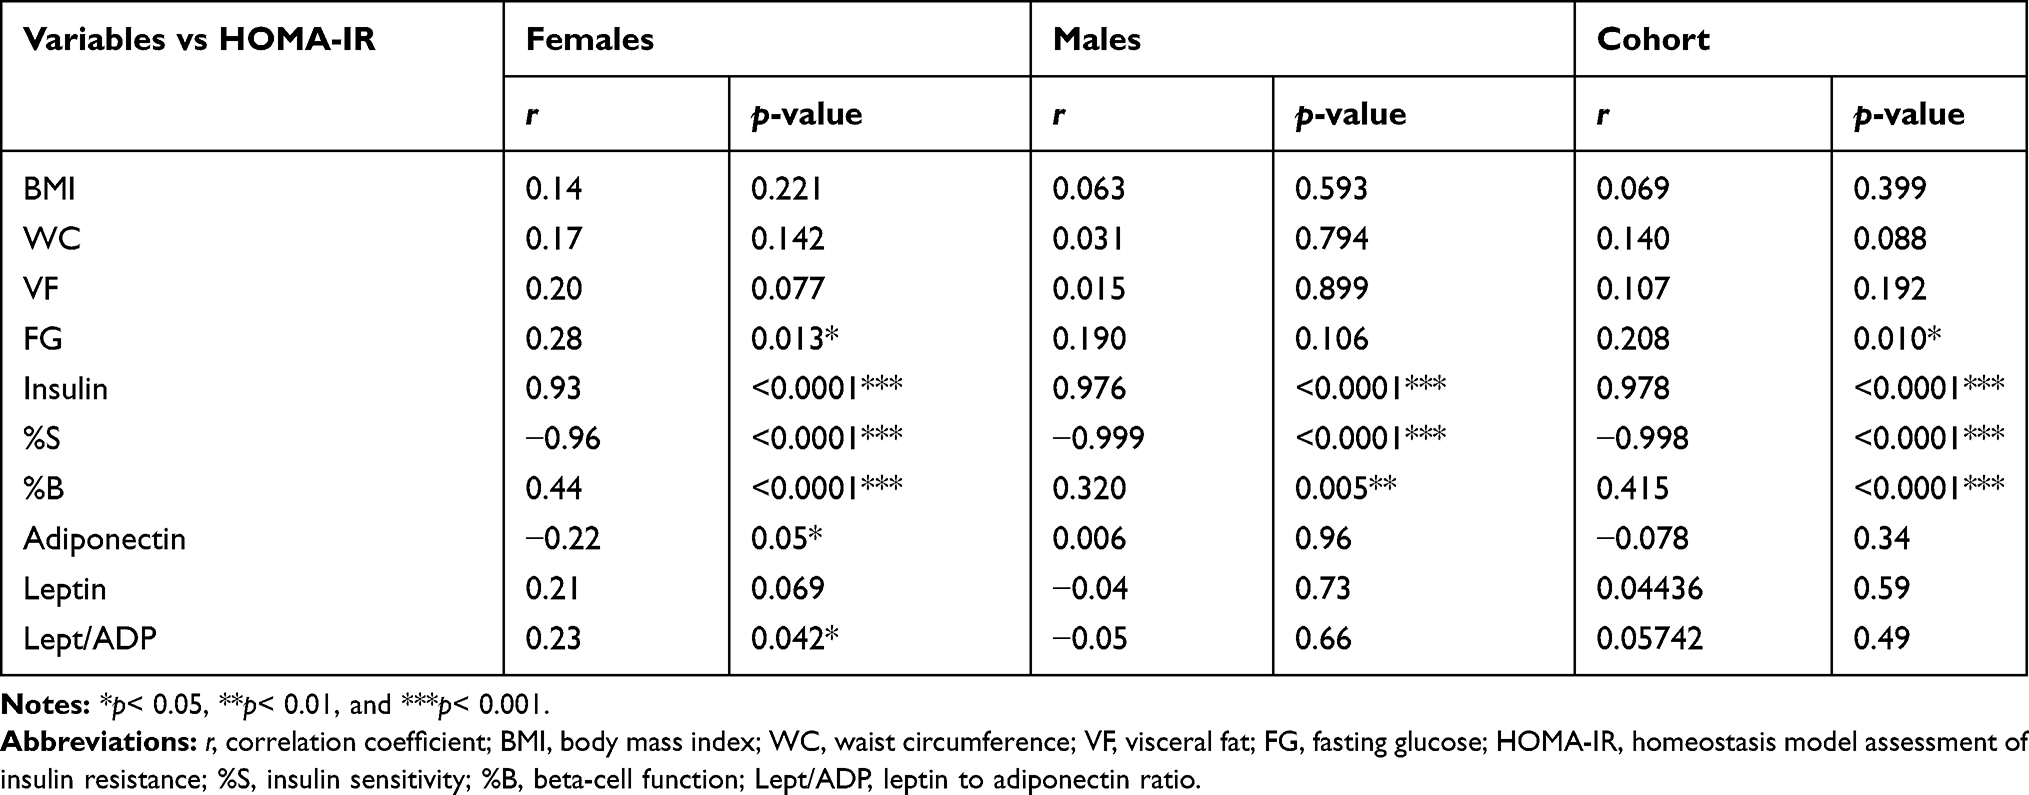 |
Table 3 Correlation of HOMA-IR with Body Composition, Inflammatory and Glucose Homeostasis Markers |
Following age adjustment, linear regression of a fitted model (F=2.155; p=0.024) for the relationship of HOMA-IR with study parameters showed adiponectin, leptin and Leptin/adiponectin ratio to predict insulin resistance (R2= 0.134, Adj.R2= 0.072; p<0.05) in the cohort. Leptin/adiponectin ratio showed the greatest prediction for insulin resistance (β: 0.492; p=0.022) in the cohort. In males, a strong fitted model (F=2447.8; p<0.001) showed fasting glucose, insulin and β-cell function with likelihood for insulin resistance (R2= 0.998; Adj.R2=0.997; p<0.001). In females, a fitted model (F=3.075; p=0.002) showed adiponectin, leptin and Leptin/adiponectin ratio to predict insulin resistance (R2= 0.346, Adj.R2 = 0.233 p<0.01). Leptin/adiponectin ratio showed the greatest prediction (β: 0.858; p=0.001) for insulin resistance (Table 4).
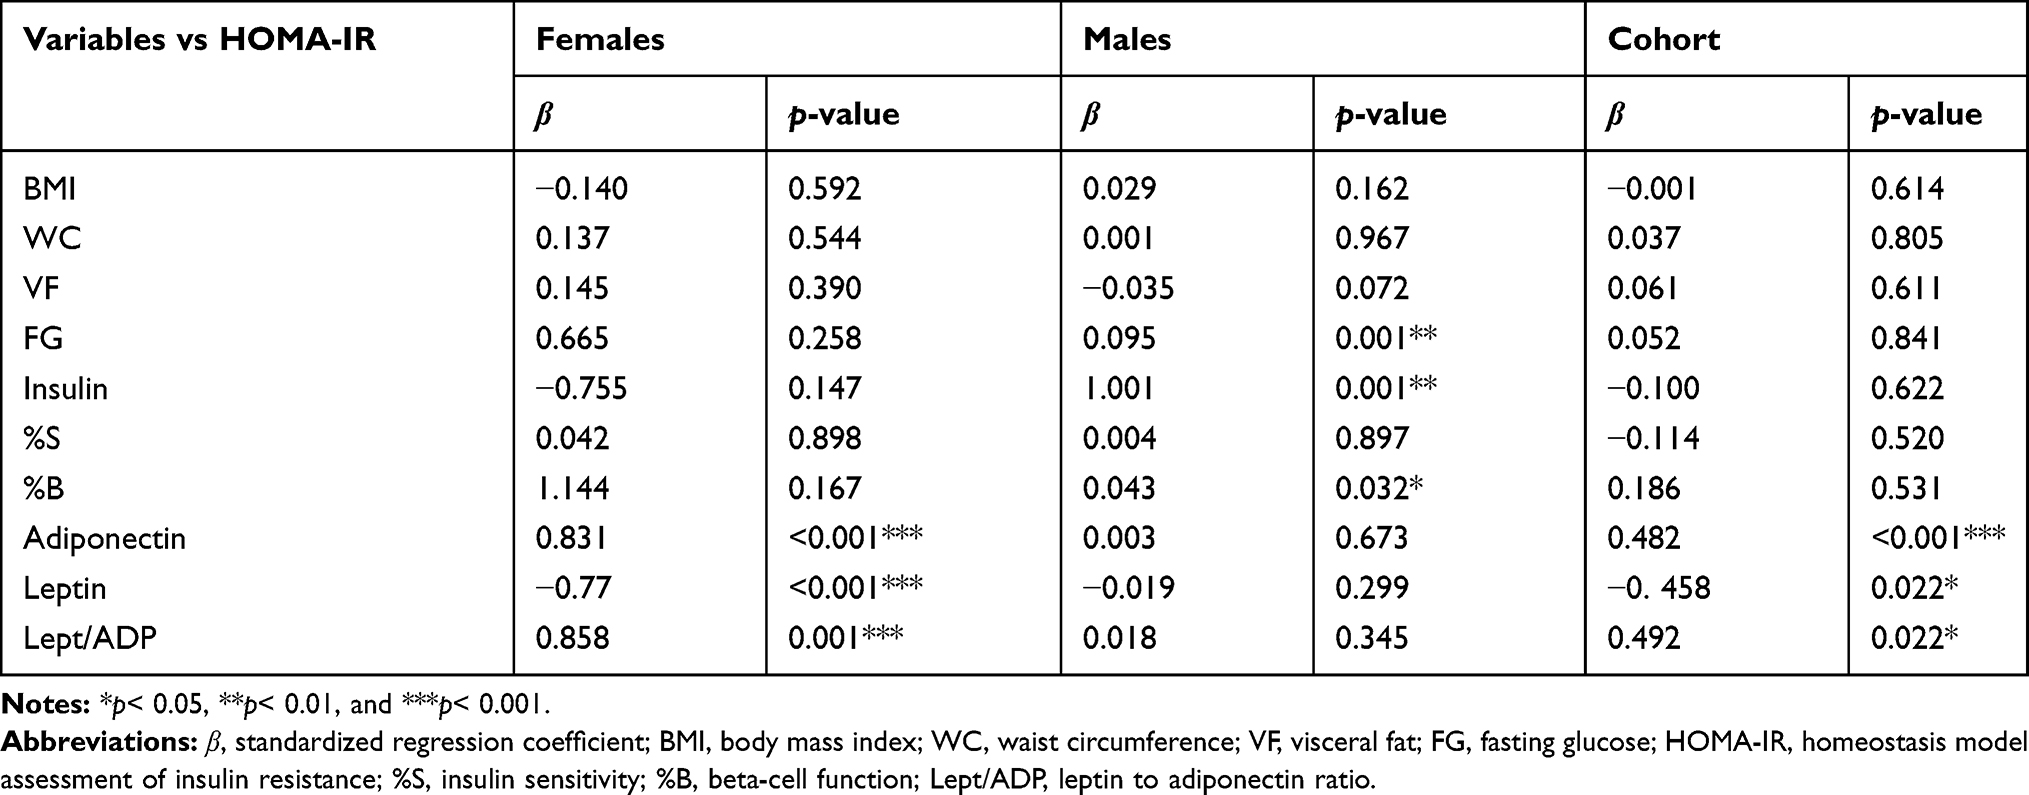 |
Table 4 Linear Regression of HOMA-IR with Body Composition, Inflammatory and Glucose Homeostasis Markers |
Relationship of Zonulin with Body Composition, Inflammatory and Glucose Homeostasis Markers
Zonulin positively associated (p<0.05) with body mass index and visceral fat in the cohort and in females but positively correlated (p<0.05) with waist circumference only in females. Zonulin showed a positive association (p<0.05) with glucose homeostasis markers; HOMA-IR and insulin concentration only in females. Inflammatory markers; adiponectin and leptin as well as leptin to adiponectin ratio showed no relationship (p>0.05) with zonulin (Table 5).
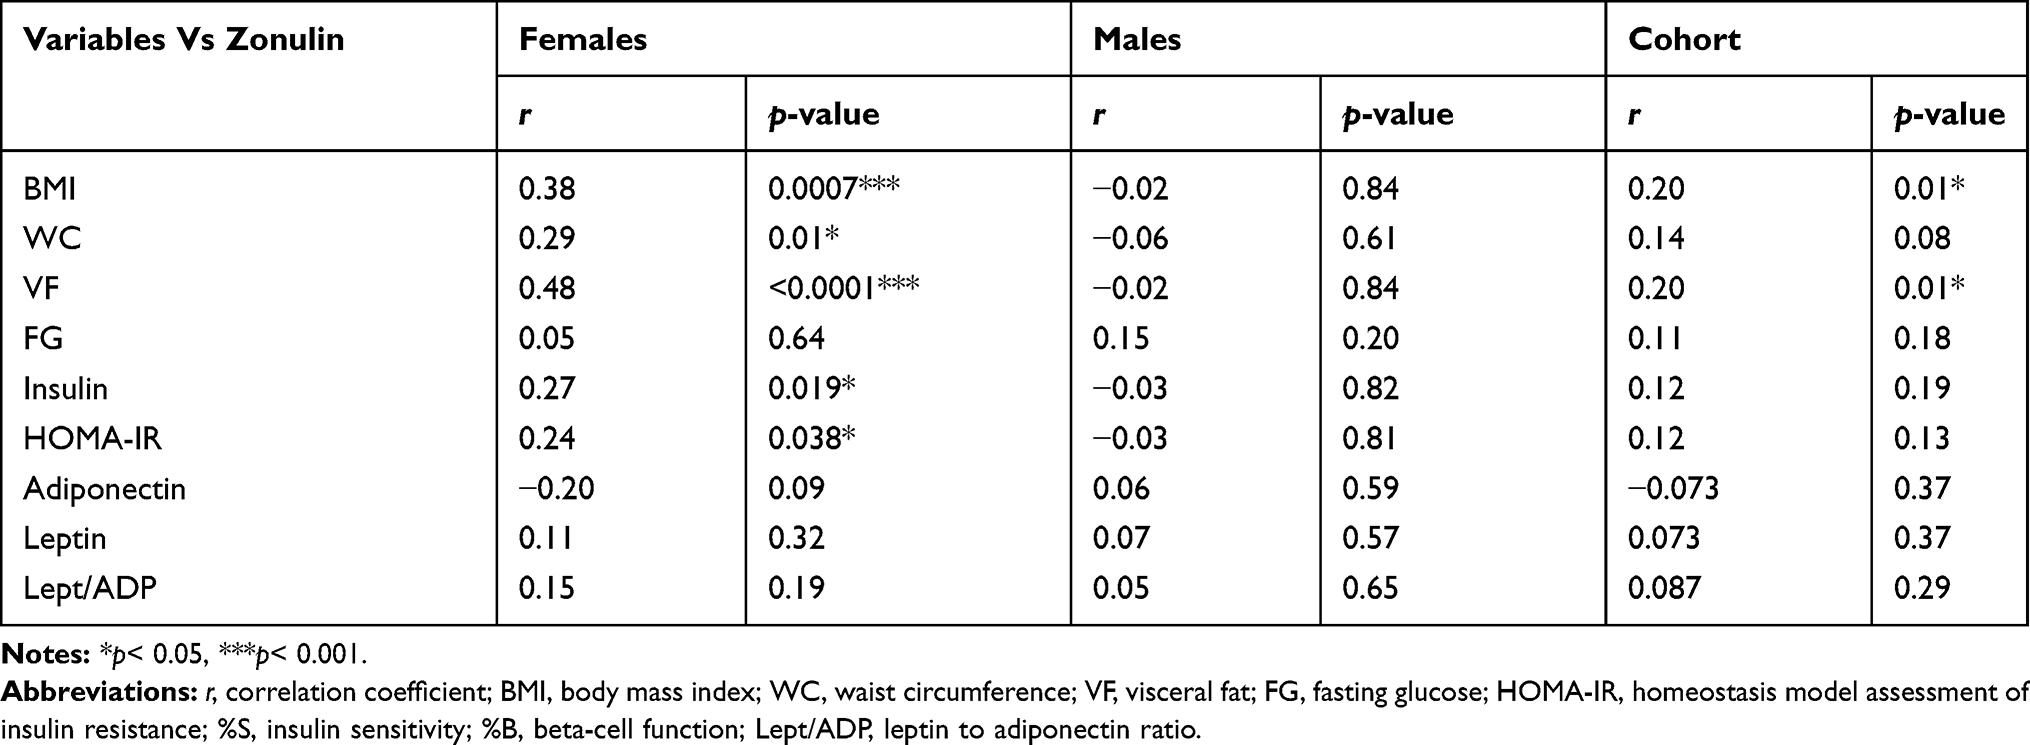 |
Table 5 Correlation of Zonulin with Body Composition, Inflammatory and Glucose Homeostasis Markers |
Linear regression after age adjustment of an unfitted model (F=1.44; p=0.169) for the relationship of zonulin with study parameters showed increased insulin with likelihood of gut permeability (R2= 0.094, Adj.R2= 0.029; p<0.05) in the cohort. In males, an unfitted model (F=0.651; p=0.749) showed no factor to predict gut permeability (R2= 0.084; Adj.R2=−0.045; p>0.05). In females, a fitted model (F=2.721; p=0.009) for zonulin with study parameters showed increased visceral fat and insulin to predict gut permeability (R2= 0.271, Adj.R2= 0.171; p<0.01). Results are summarised in Table 6.
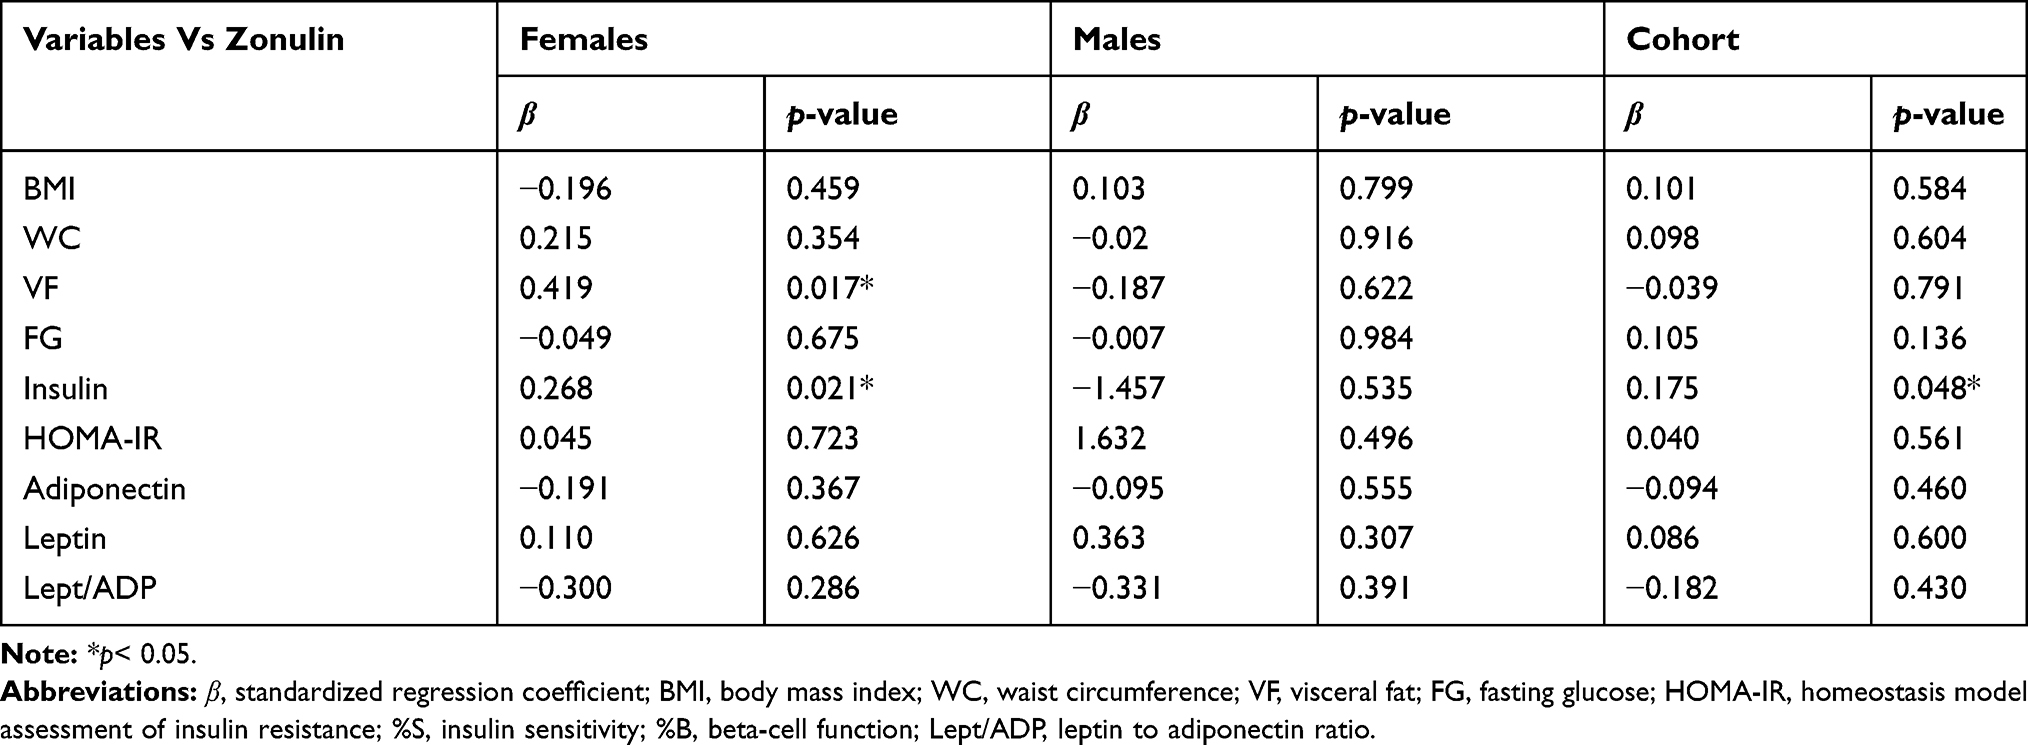 |
Table 6 Linear Regression of Zonulin with Body Composition, Inflammatory and Glucose Homeostasis Markers |
Mediation Effect of Gut Permeability on the Relationship Between Obesity and Insulin Resistance
Since obesity was associated with gut permeability but not with insulin resistance, we hypothesised gut permeability to have a possible mediation effect on the relationship between obesity and insulin resistance. As such, a mediation analysis was performed. The relationship between obesity and insulin resistance was indirectly mediated through gut permeability by 13.46%. When, age and sex were considered as covariates, the relationship between obesity and insulin resistance was mediated by 11.52% and 14.8%, respectively, through gut permeability. This finding suggests that the lack of relationship between obesity and insulin resistance could partially be attributed to the indirect relationship of obesity and gut permeability, which in turn influences insulin resistance (Table 7 and Figure 5A).
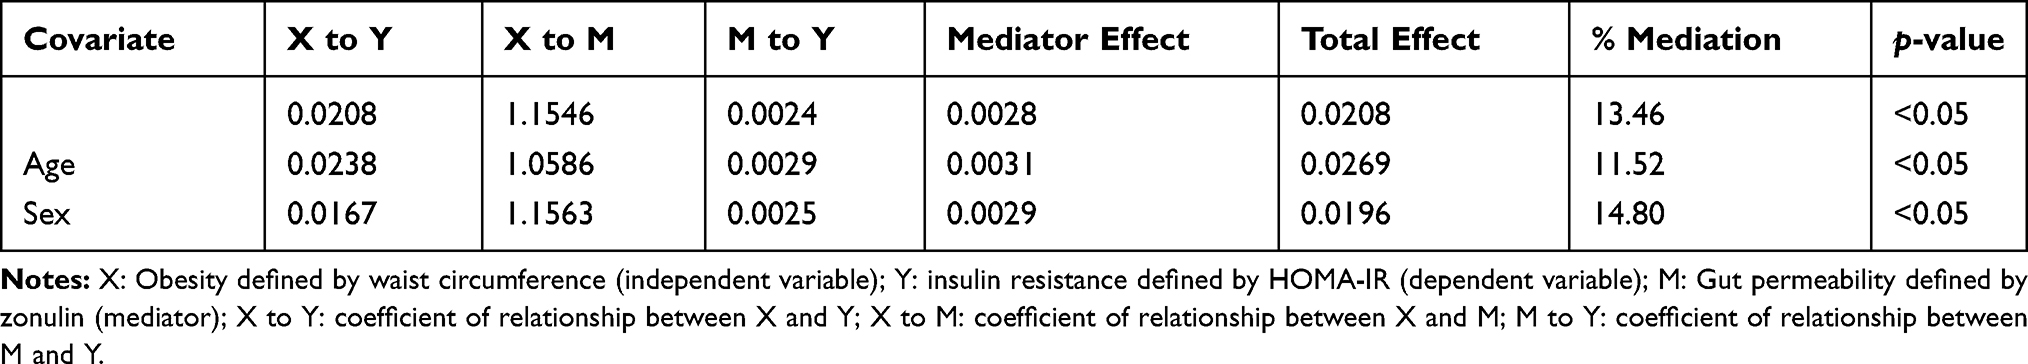 |
Table 7 Mediation Effect of Gut Permeability on the Relationship of Obesity and Insulin Resistance |
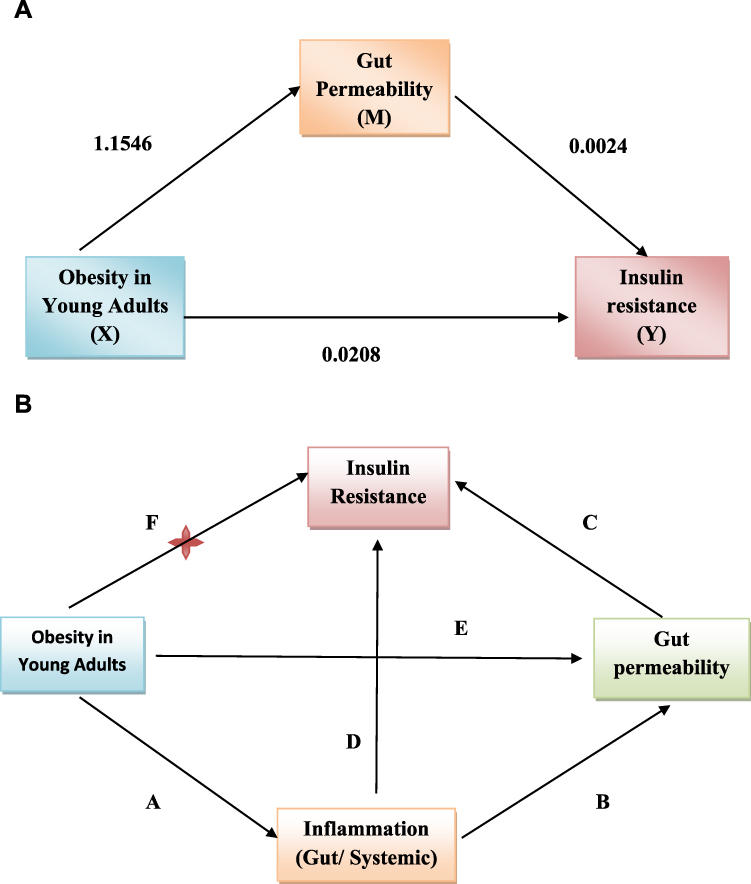 |
Figure 5 Mediation effect and summary of findings. (A) Mediation effect of gut permeability on the relationship between obesity and insulin resistance. The numeric figures represent the coefficient of relationship; X: Independent variable, Y: Dependent variable and M: Mediator variable. (B) Schematic summary of findings. A: Metabolically healthy obesity in young adults promote gut and systemic inflammation; B: Inflammation in the gut promotes gut permeability; C: Gut permeability leads to insulin resistance; D: Systemic inflammation promotes insulin resistance; E: Metabolically healthy obesity in young adults is associated with gut permeability; F: Metabolically healthy obesity in young adults is not associated with insulin resistance. |
Discussion
Insulin resistance is a feature of metabolic syndrome together with obesity, elevated blood glucose and high triglycerides thus, increasing the risk of T2DM and cardiovascular diseases.27 Though insulin resistance is known to be associated with obesity, there is growing evidence that gut permeability, measures of obesity, and insulin resistance are associated.28 Recent findings have associated insulin resistance with increased gut permeability.21 However, it still remains unclear whether obesity may be the underlining factors for such observation. However, obesity-induced insulin resistance is age dependent, often observed in older population than in young adults.24 More so, since insulin resistance is not routinely checked as part of clinical management, many cases may go undiagnosed, especially young adults. We, therefore, resolve to assess the relationship between measures of obesity, gut permeability and markers of insulin resistance in young adults. Obesity is a known risk factor for insulin resistance.29 There is concern of increasing prevalence of obesity in South Africa.30 In this study, overweight/obesity was prevalent (34.4%) in young South African adults with a greater prevalence observed in females than in males. Previous studies have also reported a higher prevalence of obesity in females than in males.31
Normally obesity, especially abdominal obesity is associated with hypertrophy of adipocytes resulting in adipose tissue hypoxia.31 In the hypoxic state, adipocytes are associated with over secretion of pro-inflammatory cytokines such as TNF-α, IL-6, leptin and CRP and hyposecretion of anti-inflammatory cytokines such as adiponectin.16 This imbalance in cytokine secretion by adipocytes is associated with local adipose inflammation, and lipolysis. Significantly increased leptin as well as leptin to adiponectin ratio was observed while adiponectin was significantly lower in obese subjects. This finding suggests that obesity induces inflammation and concurs with previous studies which have shown elevated leptin level in obese subjects and reduced adiponectin due to obesity-induced inflammation.32
Obesity-induced inflammation and lipolysis is known to promote insulin resistance.12 Increased visceral fat is associated with risk of abdominal obesity and with increased secretion of proinflammatory cytokines which act as autocrine signals to metabolic tissues (liver, skeletal muscle, and adipose tissues) decreasing insulin sensitivity33 and leading to insulin resistance.34 In this study, adiponectin was inversely associated with HOMA-IR in females while leptin to adiponectin ratio showed a positive relationship with HOMA-IR in females. Hyperinsulinaemia and increased HOMA-IR are characteristics of insulin resistance. In hyperinsulinaemia, there is increased insulin concentration in circulation even when there is a low concentration of glucose in blood. Also, HOMA-IR, a measure to assess insulin resistance is derived from fasting glucose and plasma insulin concentration. Therefore, an increase in HOMA-IR is associated with a decrease in insulin sensitivity (insulin resistance) in tissues.35 As expected, HOMA-IR inversely associated with insulin sensitivity while it showed a positive correlated with hyperinsulinaemia, fasting glucose and beta cell function across all groups. More so, hyperinsulinaemia, increased fasting glucose and poor beta cell function was associated with risk of insulin resistance as previously reported.35 Previous studies have demonstrated a positive relationship of insulin resistance with obesity measures.36 In the current study, insulin concentration, HOMA-IR, insulin sensitivity and pancreatic β cell function were similar between lean and overweight/obese individuals. More so, measures of obesity showed no associated risk of insulin resistance. This finding suggests that obesity in young adults was not associated with insulin resistance. Though surprising, this finding conforms with previous studies that showed no association between obesity and insulin resistance to describe a condition called metabolically healthy obesity (MHO) or otherwise known as metabolically benign obesity which is more common in young adults that make them less susceptible to insulin resistance and metabolic diseases.37 In fact, it has been reported that MHO individuals comprise about 30% of obese population and about 10% of adults in the general population.38 Also, it has been shown that MHO subjects have similar insulin sensitivity status to that of non-obese individuals and have lower liver fat content than obese insulin-resistant (OIR) individuals.39 More so, it has been suggested that the pathogenesis of obesity-induced insulin resistance takes a longer time to develop and therefore, it may be in its early stages in young adults.23
Recent findings suggest a relationship between insulin resistance, obesity and gut permeability.40 Abdominal obesity is associated with gut permeability which is linked to dysbiosis of the gut microbiota due to the consumption of western diet. The western diet reduces the protective mucus layer and the production of anti-microbial factors and mucin by enterocytes.41 When the protective mucus layer is reduced, it makes it easier for bacteria and bacterial components to pass through the intestinal barrier. The invasive bacteria trigger inflammatory responses resulting in the upregulation of pro-inflammatory cytokines and secretion of zonulin, an intestinal tight junction regulator.42 Higher zonulin concentration has been observed in obese than lean individuals.43 In this study, overweight/obese individuals had higher serum zonulin concentration than their lean counterparts. Also, a positive association was observed between zonulin and measures of obesity with visceral fat presenting increased risk of gut permeability. These findings confirm previous reports that obesity promotes gut permeability.40 Following secretion of zonulin into the intestinal lumen, it transactivates epidermal growth factor receptor (EGFR) through the proteinase activating receptor 2 (PAR2). This complex phosphorylates zonula occludens proteins, resulting in small intestine’s tight junction disassembling opening the paracellular pathway.44 The opening of the paracellular pathway results in bacteria entering the circulation which triggers systemic inflammation. In turn, systemic inflammation releases circulating pro-inflammatory cytokines which induces insulin resistance in metabolic tissues.44 In this study, increased leptin to adiponectin ratio, markers of inflammation showed increased likelihood to promote insulin resistance. Studies have shown a positive association between serum zonulin, measures of obesity, inflammation43 and insulin resistance.40 In the current study, insulin resistance variables (insulin concentration and HOMA-IR) positively associated with zonulin and increased insulin showed risk of gut permeability, confirming previous reports that have shown gut permeability to be associated with insulin resistance.38
In a nutshell, gut permeability was associated independently with obesity and insulin resistance but however, an association between obesity and insulin resistance was not observed. We hypothesized a possible mediation effect of gut permeability to affect the relationship between obesity and insulin resistance since obesity was associated with gut permeability. Mediation analysis showed that the relationship between obesity and insulin resistance could be indirectly or partially affected by the presence of gut permeability which was induced by obesity. Since gut permeability was associated with insulin resistance, this finding suggests that obesity was not associated with insulin resistance as a result of its indirect effect on gut permeability in young adults. The possible explanation of the findings of this study has been summarised in Figure 5B.
Conclusion
This study showed that gut permeability was associated with insulin resistance in young adults. Though a high prevalence of overweight/obesity was observed, obesity was not associated with insulin resistance. The association between obesity and gut permeability may possibly have indirectly mediated the relationship between obesity and insulin resistance. The association of gut permeability with insulin resistance without the direct implication of obesity suggests that gut permeability may be a potential independent contributory risk factor to the development of insulin resistance in healthy obese young adults. This call for public health concern as other underlining risk factors such as gut permeability may be implicated in insulin resistance-related diseases such as T2DM and cardiovascular diseases. However, further studies with large population size and more robust designs may be needed to address this observation.
Disclosure
The authors report no conflicts of interest for this work.
References
1. Samuel VT, Shulman GI. The pathogenesis of insulin resistance: integrating signaling pathways and substrate flux. Nm J Clin Invest. 2016;126(1):12–22. doi:10.1172/JCI77812
2. Gutiérrez-Rodelo C, Roura-Guiberna A, Olivares-Reyes JA. Molecular mechanisms of insulin resistance: an update. Gac Med Mex. 2017;153:197–209.
3. Eltom MA, Ahmed MH. Increasing prevalence of type diabetes mellitus of ethnicity in Northern Sudan. Diabetes Res Clin Pract. 2018;136:93–99. doi:10.1016/j.diabres.2017.11.034
4. International Diabetes Federation. IDF Diabetes Atlas.
5. SEMDSA Type 2 Diabetes Guidelines Expert Committee. The 2017 SEMDSA guideline for the management of type 2 diabetes. JEMDSA. 2017;22(1):S1–S196.
6. Wu Y, Ding Y, Tanaka Y, Zhang W. Review risk factors contributing to type 2 diabetes and recent advances in the treatment and prevention. Int J Med Sci. 2014;11(11):1185–1200. doi:10.7150/ijms.10001
7. Coelho M, Oliveira T, Fernandes R. Biochemistry of adipose tissue an endocrine gland. Arch Med Sci. 2013;9(2):191–200. doi:10.5114/aoms.2013.33181
8. Francisco V, Pino J, Campos-Cabaleiro V, et al. Obesity, fat mass and immune system: role for leptin. Front Physiol. 2018;9:640. doi:10.3389/fphys.2018.00640
9. Facey A
10. Gariballa S, Alkaabi J, Yasin J, Al Essa A. Total adiponectin in overweight and obese subjects and its response to visceral fat loss. BMC Endocr Disord. 2019;19(1):55. doi:10.1186/s12902-019-0386-z
11. Rudnicki M, Abdifarkosh G, Rezvan O, Nwadozi E, Roudier E, Haas TL. Female mice have higher angiogenesis in perigonadal adipose tissue than males in response to high-fat diet. Front Physiol. 2018;9:1452. doi:10.3389/fphys.2018.01452
12. Martins LM, Oliveira ARS, Cruz KJC, Torres-Leal FL, Marreiro DN. Obesity, inflammation, and insulin resistance. Braz J Pharm Sci. 2014;50(4):677–685. doi:10.1590/S1984-82502014000400003
13. Kang YE, Kim JM, Joung KH, et al. The roles of adipokines, proinflammatory cytokines, and adipose tissue macrophages in obesity-associated insulin resistance in modest obesity and early metabolic dysfunction. PLoS One. 2016;11:4.
14. Torres-Leal FL, Fonseca-Alaniz MH, Rogero MM, Tirapegui J. The role of inflamed adipose tissue in the insulin resistance. Cell Biochem Funct. 2010;28(8):623–631. doi:10.1002/cbf.1706
15. Finucane FM, Luan J, Wareham NJ, et al. Correlation of the leptin: adiponectin ratio with measures of insulin resistance in non-diabetic individuals. Diabetologia. 2009;52(11):2345–2349. doi:10.1007/s00125-009-1508-3
16. Liu C, Feng X, Li Q, Wang Y, Li Q, Hua M. Adiponectin, TNF-α and inflammatory cytokines and risk of type 2 diabetes: a systematic review and meta-analysis. Cytokine. 2016;86:100–109. doi:10.1016/j.cyto.2016.06.028
17. Saad MJA, Santos A, Prada PO. Linking gut microbiota and inflammation to obesity and insulin resistance. Physiology. 2016;31(4):283–293. doi:10.1152/physiol.00041.2015
18. Frazier TH, DiBaise JK, McClain CJ. Gut microbiota, intestinal permeability, obesity-induced inflammation, and liver injury. J Parenter Enteral Nutr. 2012;35:14–20. doi:10.1177/0148607111413772
19. Amar J, Chabo C, Waget A, et al. Intestinal mucosal adherence and translocation of commensal bacteria at the early onset of type 2 diabetes: molecular mechanisms and probiotic treatment. EMBO Mol Med. 2011;3:559–572. doi:10.1002/emmm.201100159
20. Teixeira TDS, Collado MC, Ferreira CLLF, Bressan J, Peluzio MCG. Potential mechanisms for the emerging link between obesity and increased intestinal permeability. Nut Res. 2012;32:637–647. doi:10.1016/j.nutres.2012.07.003
21. Damms-Machado A, Louis S, Schnitzer A, et al. Gut permeability is related to body weight, fatty liver disease, and insulin resistance in obese individuals undergoing weight reduction. Am J Clin Nutr. 2017;105(1):127–135. doi:10.3945/ajcn.116.131110
22. Jung U, Choi M. Obesity and its metabolic complications: the role of adipokines and the relationship between obesity, inflammation, insulin resistance, dyslipidemia and non-alcoholic fatty liver disease. Int J Mol Sci. 2014;215:6184–6223. doi:10.3390/ijms15046184
23. Refaie MR, Sayed-Ahmed NA, Bakr AM, Abdel Aziz MY, Abdel-Gawad SS, Kannishi MH. Aging is an inevitable risk factor for insulin resistance. J Taibah Univ Sci. 2006;1(1):30–41. doi:10.1016/S1658-3612(06)70005-1
24. Karakelides H, Irving BA, Short KR, O’Brien P, Nair KS. Age, obesity, and sex effects on insulin sensitivity and skeletal muscle mitochondrial function. Diabetes. 2010;59(1):89–97. doi:10.2337/db09-0591
25. Stewart A, Marfell-Jones M, Olds T, Ridder H. International Standards for Anthropometric Assessment. Lower Hutt: ISAK; 2011.
26. Cole TJ, Lobstein T. Extended international (IOTF) body mass index cut‐offs for thinness, overweight and obesity. Pediatr Obes. 2012;7(12):284–294.
27. Anhê FF, Roy D, Pilon G, et al. A polyphenol-rich cranberry extract protects from diet-induced obesity, insulin resistance and intestinal inflammation in association with increased Akkermansia spp. population in the gut microbiota of mice. Gut. 2015;64(6):872–883. doi:10.1136/gutjnl-2014-307142
28. Canfora EE, Jocken JW, Blaak EE. Short-chain fatty acids in control of body weight and insulin sensitivity. Nat Rev Endocrinol. 2015;11(10):577. doi:10.1038/nrendo.2015.128
29. Belkina AC, Denis GV. Obesity genes and insulin resistance. Curr Opin Endocrinol Diabetes Obes. 2010;17(5):472–477. doi:10.1097/MED.0b013e32833c5c48
30. Rossouw HA, Grant CC, Viljoen M. Overweight and obesity in children and adolescents: the South African problem. S Afr J Sci. 2012;108(5/6):31–37. doi:10.4102/sajs.v108i5/6.907
31. Lee YS, Osborne O, Youngoh D, et al. Increased adipocyte O2 consumption triggers HIF-1α, causing inflammation and insulin resistance in obesity. Cell. 2014;157(6):1339–1352. doi:10.1016/j.cell.2014.05.012
32. Forny-Germano L, De Felice FG, Vieira MN. The role of leptin and adiponectin in obesity-associated cognitive decline and alzheimer’s disease. Front Neurosci. 2019;12:1027. doi:10.3389/fnins.2018.01027
33. Wu H, Ballantyne CM. Skeletal muscle inflammation and insulin resistance in obesity. J Clin Invest. 2017;127(1):43–54. doi:10.1172/JCI88880
34. Wensveen FM, Jelenčić V, Valentić S, et al. NK cells link obesity-induced adipose stress to inflammation and insulin resistance. Nat Immunol. 2015;16(4):376. doi:10.1038/ni.3120
35. Wallace TM, Levy JC, Matthews DR. Use and abuse of HOMA modeling. Diabetes Care. 2004;27(6):1487–1495. doi:10.2337/diacare.27.6.1487
36. Singh Y, Garg MK, Tandon N, Marwaha RK. A study of insulin resistance by HOMA-IR and its cut-off value to identify metabolic syndrome in urban Indian adolescents. J Clin Res Pediatr Endocrinol. 2013;5(4):245–251. doi:10.4274/Jcrpe.1127
37. Johnson W. Healthy obesity: time to give up the ghost? Ann Hum Biol. 2018;45(4):297–298. doi:10.1080/03014460.2018.1444789
38. Calori G, Lattuada G, Piemonti L. Prevalence, metabolic features and prognosis of metabolically healthy obese Italian individuals: the Cremona Study. Diabetes Care. 2011;34(1):210–215. doi:10.2337/dc10-0665
39. Stefan N, Kantartzis K, Machann J. Identification and characterization of metabolically begin obesity in humans. Arch Intern Med. 2008;168:1609–1616. doi:10.1001/archinte.168.15.1609
40. Moreno-Navarete JM, Sabater M, Ortega F, Ricart W, Fernández-Real JM. Circulating zonulin, a marker of intestinal permeability, is increased in association with obesity-associated insulin resistance. PLoS One. 2012;7:e37160. doi:10.1371/journal.pone.0037160
41. Salvo-Romero E, Alonso-Cotoner C, Pardo-Camacho C, Casado-Bedmar M, Vicario M. The intestinal barrier function and its involvement in digestive disease. Rev Esp Enferm Dig. 2015;107:686–696. doi:10.17235/reed.2015.3846/2015
42. Winer DA, Luck H, Tsai S, Winer S. The intestinal immune system in obesity and insulin resistance. Cell Metab. 2016;23(3):413–426. doi:10.1016/j.cmet.2016.01.003
43. Ohlsson B, Orho-Melander M, Nilsson P. Higher levels of serum zonulin may rather be associated with increased risk of obesity and hyperlipidemia, than with gastrointestinal symptoms or disease manifestations. Int J Mol Sci. 2017;18(3):582. doi:10.3390/ijms18030582
44. Sturgeon C, Fasano A. Zonulin, a regulator of epithelial and endothelial barrier functions, and its involvement in chronic inflammatory diseases. Tissue Barriers. 2016;4(4):e1251384. doi:10.1080/21688370.2016.1251384
 © 2020 The Author(s). This work is published and licensed by Dove Medical Press Limited. The full terms of this license are available at https://www.dovepress.com/terms.php and incorporate the Creative Commons Attribution - Non Commercial (unported, v3.0) License.
By accessing the work you hereby accept the Terms. Non-commercial uses of the work are permitted without any further permission from Dove Medical Press Limited, provided the work is properly attributed. For permission for commercial use of this work, please see paragraphs 4.2 and 5 of our Terms.
© 2020 The Author(s). This work is published and licensed by Dove Medical Press Limited. The full terms of this license are available at https://www.dovepress.com/terms.php and incorporate the Creative Commons Attribution - Non Commercial (unported, v3.0) License.
By accessing the work you hereby accept the Terms. Non-commercial uses of the work are permitted without any further permission from Dove Medical Press Limited, provided the work is properly attributed. For permission for commercial use of this work, please see paragraphs 4.2 and 5 of our Terms.