")
Back to Journals » Cancer Management and Research » Volume 12
Insulin Reduces the Efficacy of Vemurafenib and Trametinib in Melanoma Cells
Authors Osrodek M , Rozanski M , Czyz M
Received 23 May 2020
Accepted for publication 16 July 2020
Published 13 August 2020 Volume 2020:12 Pages 7231—7250
DOI https://doi.org/10.2147/CMAR.S263767
Checked for plagiarism Yes
Review by Single anonymous peer review
Peer reviewer comments 2
Editor who approved publication: Dr Eileen O'Reilly
Marta Osrodek, 1 Michal Rozanski, 1, 2 Malgorzata Czyz 1
1Department of Molecular Biology of Cancer, Medical University of Lodz, Lodz, Poland; 2Laboratory of Transcriptional Regulation, Institute of Medical Biology, Polish Academy of Sciences, Lodz, Poland
Correspondence: Malgorzata Czyz
Department of Molecular Biology of Cancer, Medical University of Lodz, 6/8 Mazowiecka Street, 92-215 Lodz, Poland
Tel +48 42 272 57 02
Email [email protected]
Background: Despite the progress made in the clinical management of metastatic melanoma, a patient’s response to treatment cannot be fully predicted, and intrinsic or acquired resistance that is developed in most melanoma patients warrants further research efforts. In addition to genetic factors, microenvironmental input should be considered to explain the diversity of response to treatment among melanoma patients. In this study, we evaluated the impact of insulin on patient-derived BRAFV600E melanoma cells, either untreated or treated with vemurafenib or trametinib, inhibitors of BRAFV600 and MEK1/2, respectively.
Methods: Cells were cultured in serum-free conditions, either with or without insulin. The activity of the MAPK/ERK and PI3K/AKT pathways was assessed by Western blotting, cell viability, and percentages of Ki-67- and NGFR-positive cells by flow cytometry. Transcript levels were analyzed using qRT-PCR, and γ-H2AX levels by immunoblotting and confocal microscopy. A luminescence-based assay was used to measure glutathione content.
Results: While insulin did not influence the MAPK/ERK pathway activity, it had a strong influence on melanoma cells, in which this pathway was suppressed by either vemurafenib or trametinib. In the presence of insulin, both drugs were much less efficient in 1) inhibiting proliferation and reducing the percentage of Ki-67-positive cells, and 2) inducing apoptosis and phosphorylation of histone H2AX in melanoma cells. Changes induced by vemurafenib and trametinib in glutathione homeostasis and DNA repair gene expression were also attenuated by insulin. Moreover, insulin impaired the combined effects of targeted drugs and doxorubicin in melanoma cells. In addition to insulin-induced PI3K/AKT activity, which was either transient or sustainable depending on the cell line, an insulin-triggered increase in the percentage of cells expressing NGFR, a marker of neural crest stem-like cells, may contribute to the reduced drug efficacy.
Conclusion: Our results demonstrate the role of insulin in reducing the efficacy of vemurafenib and trametinib. This needs clinical assessment.
Keywords: BRAFV600, NGFR, targeted therapy
Introduction
Insulin is an anabolic hormone with an important role in many aspects of metabolism. It exerts its primary function in glucose homeostasis by stimulating glucose transport from the vascular system into the cell, while simultaneously decreasing hepatic glucose production.1 It has long been established that cancer cells thrive in glucose-rich environments. This led to investigation of the role of hyperglycemia and hyperinsulinemia in cancer patient survival, linking diabetes mellitus, among other metabolic disorders, to increased cancer risk and poor patient outcome.2–9 While the direct role of insulin in cancer development is still not well understood,10–12 there have been epidemiological indications of hyperinsulinemia as a risk factor for many types of cancers,9,10,13-17 including melanoma.18–20 Hyperinsulinemia is a hallmark of insulin resistance, a condition characterized by reduced efficiency of insulin signaling and increased hepatic glucose production.21 As insulin resistance may contribute to the development of cancer cachexia,22,23 treatment of insulin resistance, by administration of either insulin or insulin sensitizers such as metformin or thiazolidinediones (TZDs), has the potential to diminish muscle wasting in patients with cancers.24 While exogenously provided insulin has been shown to enhance cancer growth in animal models of cachexia,25,26 administration of insulin in 138 patients with cachexia and advanced gastrointestinal cancer augmented the survival of patients.27
Insulin, together with insulin-like growth factor-1 (IGF-1), belongs to an evolutionarily conserved group of growth factors that activate insulin receptor (IR) and insulin-like growth factor receptor (IGF-1R).28,29 Following receptor activation, two major signaling cascades can be triggered, the phosphatidylinositol 3-kinase (PI3K)/protein kinase B (AKT) pathway and mitogen-activated protein kinase (MAPK)/extracellular signal-regulated kinase 1 and 2 (ERK1/2) pathway,30 both of which regulate key cellular functions such as cell growth, metabolism and survival, and play a major role in oncogenesis.31,32
Bearing all this in mind, we sought to further explore the link between insulin and cancer and asked the question whether insulin may affect cancer cell response to treatment targeting the MAPK pathway, one of these signaling pathways. Melanoma cells are an especially interesting model for such investigation as oncogenic mutations causing aberrant, growth factor-independent activation of the MAPK pathway can be found in the majority of melanomas,33 and several inhibitors of this pathway have been approved for melanoma treatment, targeting either the most frequently altered kinase, BRAFV600E/K (vemurafenib, dabrafenib and encorafenib), or mitogen-activated protein kinase 1/2 (MEK1/2) (trametinib, cobimetinib and binimetinib).34 Pathological hyperactivation of the PI3K/AKT pathway is not a common driving force in melanoma development; however, several elements of the PI3K/AKT pathway as well as upstream signal transducers of PI3K/AKT and MAPK pathways have been implicated in therapeutic resistance of melanoma to BRAFV600 or MEK1/2 inhibitors. For instance, inhibition of the activity of IGF-1R has been shown to enhance the response of melanoma cells to MEK1/2 inhibition.35 The expression of insulin receptor substrate-1 (IRS-1), a key signal adapter protein transmitting signals from IR and IGF-1R, has been found to be upregulated in melanoma cells derived from tumors of patients with previously developed resistance to vemurafenib,36 while PI3K inhibition has been shown to delay the development of drug resistance to MEK1/2 inhibitors.37 In a preclinical model of melanoma resistance, enhanced AKT activity has been found in three out of six vemurafenib-resistant melanoma cell lines and two out of five trametinib-resistant cell lines.38
We have now endeavored to elucidate whether insulin may influence the response of BRAFV600E melanoma cells to targeted therapeutics, either vemurafenib or trametinib. The defined conditions, applied as serum-free culture medium containing or lacking insulin, support a controlled study comparing the impact of insulin on melanoma cells with an active or drug-suppressed MAPK pathway. Moreover, patient-derived BRAFV600E melanoma cell lines used in this study have been previously characterized on genetic and phenotypic levels,39,40 and their response to vemurafenib and trametinib has also been extensively investigated.38,41-45
Materials and Methods
Clinical Dataset Analysis
The cBioPortal for Cancer Genomics46 was used to quantify the prevalence of gene alterations in selected genes, including missense mutations, truncating mutations, amplifications and deep deletions. The percentage of genetic alterations was calculated in a total of 1084 cases of cutaneous melanoma from nine pooled datasets: Melanoma (Broad/Dana-Farber, Nature 2012), Melanoma (MSKCC, NEJM 2014), Metastatic Melanoma (DFCI, Science 2015), Metastatic Melanoma (MSKCC, JCO Precis Oncol 2017), Skin Cutaneous Melanoma (Broad, Cell 2012), Skin Cutaneous Melanoma (TCGA, Firehose Legacy), Skin Cutaneous Melanoma (TCGA, PanCancer Atlas), Skin Cutaneous Melanoma (Yale, Nat Genet 2012) and Skin Cutaneous Melanoma (Broad, Cancer Discov 2014). Genes involved in the PI3K/AKT signaling pathway or its regulation were selected based on the Kyoto Encyclopedia of Genes and Genomes (KEGG) analysis.47
Whole-Exome Sequencing (WES) and WES Data Analysis
DNA extraction, whole-exome sequencing and data analysis were described previously.40 Raw data are publicly available under the accession numbers E-MTAB-6978 at ArrayExpress and ERP109743 at the European Nucleotide Archive (ENA).
Drugs
Vemurafenib and trametinib were obtained from Selleck Chemicals (Houston, TX, USA) and doxorubicin was purchased from Sigma-Aldrich (St. Louis, MO, USA).
Cell Culture
Melanoma cell lines were established from surgical specimens, as previously described.45 The study has been approved by Ethical Commission of the Medical University of Lodz (identification code: RNN/84/09/KE). Each patient signed an informed consent before tissue acquisition. Established cell lines were named DMBC11, DMBC12, DMBC21, DMBC28 and DMBC29, after the Department of Molecular Biology of Cancer (DMBC). Melanoma cells were maintained in stem cell medium (SCM), composed of DMEM/F12 medium, B-27 supplement (Gibco, Paisley, UK), heparin (1 ng/mL), 10 ng/mL bFGF, 20 ng/mL EGF (BD Biosciences, San Jose, CA, USA), antibiotics (100 IU/mL penicillin, 100 µg/mL streptomycin) and insulin (10 µg/mL). For the purpose of the study, a parallel, insulin-free culture of each cell line was initiated 1 week prior to the start of experiments and was maintained without insulin throughout the study. For experiments, cells were seeded 2 h prior to treatment with trametinib at the concentration of 10 nM or 50 nM, vemurafenib at 2 µM or 10 µM, and doxorubicin at 50 nM. Nuclear extracts, confocal microscopy and glutathione measurements were performed after 12 h, RNA isolation and whole cell lysates after 24 h, viability analysis after 30, 36 or 46 h, and immunophenotype analysis after 40 h of drug treatment.
Acid Phosphatase Activity Assay
Doubling time was calculated based on the colorimetric measurement of acid phosphatase activity, as described previously.48 In brief, melanoma cells (3.6×10³) were left to grow for 24 h, 48 h and 72 h, after which the plates were centrifuged, the medium was removed and assay buffer was added, which contained 0.1 mM of sodium acetate pH=5, 0.1% Triton X-100 and 5 mM p-nitrophenyl phosphate (Calbiochem, Darmstadt, Germany). Following incubation for 2 h at 37°C, 1 mM NaOH was added to inhibit the reaction, and the absorbance measurements were performed at 405 nm with the microplate reader Infinite M200Pro (Tecan, Salzburg, Austria). In order to calculate the doubling time (DT), the following formula was used: DT=(t–t0)log2/(logA–logA0), in which t and t0 are the time points at which the cells were collected, and A and A0 are the absorbance values at times t and t0, respectively. For proliferation analysis of drug-treated cells, 2 µM vemurafenib, 10 nM trametinib and 50 nM doxorubicin, alone or in combination, were added to melanoma cells immediately after plating.
Flow Cytometry
Flow cytometric measurements were carried out using FACSVerse (BD Biosciences, San Jose, CA, USA). BD FACSuite software was used for data analysis and visualization. The FITC Annexin V Apoptosis Detection Kit (BD Biosciences) was used for the viability assay according to the manufacturer’s protocol, with the exception of experiments with doxorubicin, in which propidium iodine was not added to the staining mix owing to overlapping fluorescence spectra with doxorubicin. To exclude dead cells from immunophenotype analysis, cells were stained with the LIVE/DEAD Fixable Violet Dead Cell Stain Kit (Life Technologies, Eugene, OR, USA). Prior to intracellular staining, 20 min fixation with 4% paraformaldehyde was performed followed by 20 min permeabilization with 0.1% Triton X-100 in PBS. Antibodies recognizing NGFR (PE-conjugated, #557196) and Ki-67 (Alexa Fluor647-conjugated, #558615) were purchased from BD Biosciences. Each experiment included an appropriate isotype control: Alexa Fluor647-conjugated (#557714) and PE-conjugated (#555749) from BD Biosciences.
RNA Isolation, cDNA Synthesis and Quantitative RT-PCR (qRT-PCR)
A Total RNA Isolation kit with mini column system (A&A Biotechnology, Gdynia, Poland) was used to isolate and purify total RNA. Then, 1 µg of total RNA was transcribed into cDNA using random primers (300 ng) and SuperScript II Reverse Transcriptase (Invitrogen Life Technologies, Carlsbad, CA, USA). Quantitative real-time polymerase chain reaction served to evaluate mRNA expression of selected genes using the Rotor-Gene 3000 Real-Time DNA analysis system (Corbett Research, Mortlake, Australia). Amplification was performed with KAPA SYBR FAST qPCR Kit Universal 2X qPCR Master Mix (Kapa Biosystems, Cape Town, South Africa), 200 nM of each primer and 25 ng cDNA template per reaction. The following primer sequences were used: RPS17 forward 5ʹ-AAT CTC CTG ATC CAA GGC TG-3ʹ and reverse 5ʹ-CAA GAT AGC AGG TTA TGT CAC G-3ʹ; BRIP1 forward 5ʹ-CAA TGC CCG TGC TGT CA-3ʹ and reverse 5ʹ-ATC TGC TGC CGT ACC CAT TTA-3ʹ; BRCA1 forward 5ʹ-CTG AAG ACT GCT CAG GGC TAT C-3ʹ and reverse 5ʹ-AGG GTA GCT GTT AGA AGG CTG G-3ʹ; BRCA2 forward 5ʹ-GGC TTC AAA AAG CAC TCC AGA TG-3ʹ and reverse 5ʹ-GGA TTC TGT ATC TCT TGA CGT TCC-3ʹ; XRCC4 forward 5ʹ-AAT CCA CCT TGT TTC TGA ACC C-3ʹ and reverse 5ʹ-CCT TTT TCC ATT GCC ATG TCA TC-3ʹ; XRCC5 forward 5ʹ-GGA CGT GGG CTT TAC CAT GA-3ʹ reverse 5ʹ-GGG GAT TGT CAG TGC CAT CT-3ʹ; SLC7A11 forward 5ʹ-TGC TGG GCT GAT TTA TCT TCG-3ʹ and reverse 5ʹ-GAA AGG GCA ACC ATG AAG AGG-3ʹ; SLC1A5 forward 5ʹ-GAG CTG CTT ATC CGC TTC TTC-3ʹ and reverse 5ʹ-GGG GCG TAC CAC ATG ATC C-3ʹ. To calculate the relative expression of target genes versus a reference gene, RPS17, a mathematical model including an efficiency correction was used.
Preparation of Whole Cell Lysates and Nuclear Extracts
Whole cell lysates were prepared in RIPA buffer containing 50 mM Tris-HCl pH=8.0, 150 mM NaCl, 1% Triton X-100, 0.5% sodium deoxycholate, 0.1% SDS supplemented with freshly added protease and phosphatase inhibitors (Merck, Darmstadt, Germany). For nuclear extracts, melanoma cells were suspended in 5× pellet volume of hypotonic buffer (10 mM HEPES-KOH, pH=7.9, 1.5 MgCl2, 10 mM) with freshly added 0.2 mM phenylmethylsulfonyl fluoride and 0.5 mM DL-dithiothreitol. Cells were then centrifuged, suspended in 2× the initial pellet volume of hypotonic buffer and transferred to Kontes all-glass dounce homogenizers. After 10 min incubation at 4°C, cells were homogenized and the homogenate was collected and centrifuged at 14,000×g for 15 min at 4°C. The supernatant containing the cytosolic fraction was discarded and the nucleus-containing pellet was lysed in RIPA buffer. For both methods, the Bradford assay was used to determine protein concentration. Samples were diluted in 2× Laemmli buffer (125 mM Tris-HCl pH=6.8, 20% glycerol, 0.004% bromophenol blue, 10% -mercaptoethanol and 4% SDS), heated to 95°C for 5 min and stored at −80°C until use.
Western Blot
Whole cell lysates and nuclear extracts were loaded on 7% or 12% SDS–polyacrylamide gels, respectively. Electrophoresis was conducted at a constant voltage of 25 V/cm, followed by transfer of the proteins onto an Immobilon-P PVDF membrane (Millipore, Billerica, MA, USA). Membranes were blocked in a solution of 5% phosphoBLOCKER (Cell Biolabs, San Diego, CA, USA) or 5% non-fat milk in PBS-Tween 0.05% for 45 min. Primary antibodies recognizing ERK1/2 (#9107), phospho-ERK1/2 (Thr202/Tyr204, #4377), AKT (#2920), phospho-AKT (Thr308, #4056), phospho-AKT (Ser473, #9271), phospho-H2AX (Ser139, #2577) and PARP (#9542) were purchased from Cell Signaling Technology (Danvers, MA, USA), Lamin B (#sc-6216) and GAPDH (#sc-47724) were from Santa Cruz Biotechnology (Santa Cruz, CA, USA). Secondary HRP-conjugated anti-mouse (#sc-516102) and anti-goat (#sc-2768) antibodies were from Santa Cruz Biotechnology and anti-rabbit antibodies (#7074) were from Cell Signaling. For protein visualization, membranes were incubated with Pierce® ECL Western Blotting Substrate (Pierce, Rockford, IL, USA) for 1 min and visualized using the ChemiDoc Imaging System (BioRad, Hercules, CA, USA). ImageJ software was used for densitometric analysis.
Confocal Imaging
Melanoma cells (1.25×10⁵) were seeded onto a cover glass placed inside a 24-well plate. Cells were left to adhere for 2 h, after which vemurafenib or trametinib was added for 12 h. Next, the culture medium was discarded, and cells were washed with PBS followed by fixation/permeabilization with methanol for 10 min. Cells were incubated in a blocking solution: 5% phosphoBLOCKER (Cell Biolabs, San Diego, CA, USA) in PBS-Tween 0.05% for 1 h. Next, primary antibodies against phospho-H2AX (Ser139, #2577) (Cell Signaling Technology, Danvers, MA, USA) were added for 1 h, and cells were washed with PBS-Tween 0.05% followed by 1 h incubation with secondary, Alexa Fluor555-conjugated (#ab150078) antibodies from Abcam (Cambridge, UK). After washing with PBS-Tween 0.05%, the coverslips were flipped onto a drop of ProLong™ Diamond Antifade Mountant with DAPI (Thermo Fisher Scientific, Waltham, MA, USA) on glass slides and left to dry overnight. Images were obtained using the Nikon Eclipse TE2000-S inverted microscope (Nikon) with Plan-Apochromat 60×/1.4 Oil DIC N2 objective and Nikon C1 confocal attachment. Nuclear fluorescence was imaged with 408 nm excitation and 432–467 nm emission range, while secondary antibody fluorescence was imaged with 543 nm excitation and 567–642 nm emission range.
Glutathione Measurements
Melanoma cells (1×10⁴) were plated onto 96-well plates. Vemurafenib and trametinib were added after 2 h, for a period of 12 h. Next, the plates were centrifuged, the medium was discarded, and total or oxidized glutathione detection was performed using the GSH/GSSG-Glo™ Assay from Promega (Madison, WI, USA) according to the manufacturer’s protocol. The ratio of GSH:GSSG was calculated using the formula GSH/GSSG = (Total glutathione – Oxidized glutathione)/(Oxidized glutathione/2). Luminescence measurements were performed using a Vector X plate reader (PerkinElmer, Waltham, MA, USA).
Statistical Analysis
All experiments were conducted in three biological replicates unless stated otherwise. Graphs are presented as mean ± SD. To calculate the statistical significance of differences, StatsDirect v.2.7.2 software was used. To compare two independent samples, the Student’s t-test was used. For multiple comparisons, ANOVA was used with post-hoc Scheffé’s test (CI=95%). Differences were considered significant at P<0.05.
Results
Insulin Does Not Influence Proliferation of Melanoma Cells but Significantly Affects the Subpopulation of NGFR-Positive Cells
In addition to activating mutations in the MAPK pathway, microenvironmental factors may increase the proliferation rate of melanoma cells. To evaluate the influence of insulin on proliferation, melanoma cells were grown with or without insulin in the culture medium. We found that melanoma cells maintained similar proliferative capacity in both types of growth conditions, as proliferation curves, doubling time (Figure 1A) and the percentage of Ki-67-positive cells (Figure 1B) were comparable irrespective of the presence of insulin. Next, the influence of insulin on the percentage of nerve growth factor receptor (NGFR, also termed CD271)-positive cells, considered as neural crest stem-like cells with increased tumor-initiating capacity,49,50 was examined. Cell surface localization of NGFR was quantified by flow cytometry, and we found that the percentage of NGFR-positive melanoma cells was significantly lower in melanoma cell populations grown without insulin compared with their insulin-stimulated counterparts (Figure 1C). The least difference was detected in the DMBC29 cell line, in which the percentage of NGFR-positive cells increased from 1.3% in the medium without insulin to only 4.9% in the presence of insulin (Supplementary Figure 1).
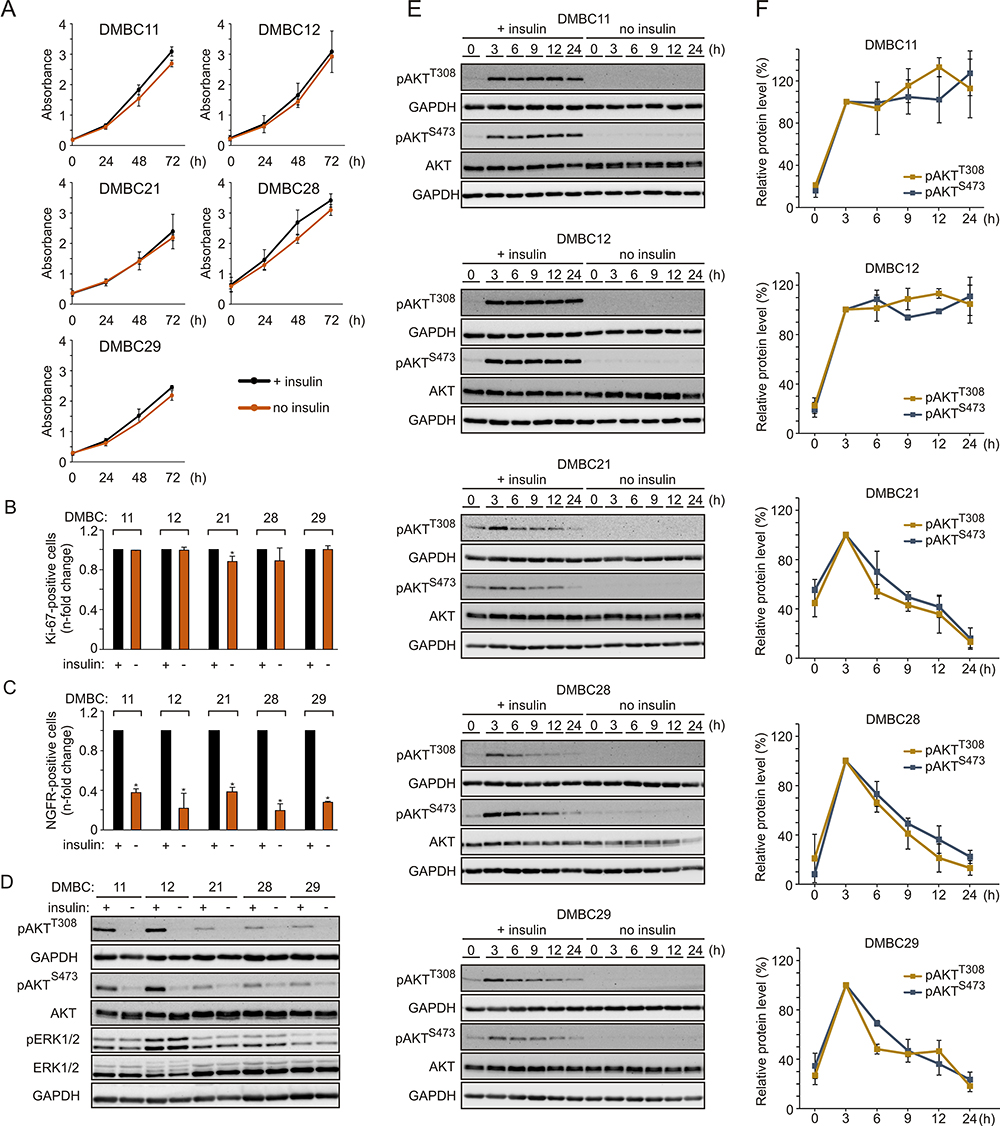 |
Figure 1 Insulin does not influence proliferation but markedly affects the subpopulation of NGFR-positive cells and induces AKT activity in melanoma cells, either transiently or sustainably. (A) Proliferation curves of melanoma cells grown in the presence (black line) or absence (orange line) of insulin based on the activity of acidic phosphatase (APA assay). n=3. (B and C) The percentages of Ki-67-positive cells (B) or NGFR-positive cells (C) in the populations of melanoma cells grown without insulin relative to their percentages in the insulin-treated melanoma cell populations, 42 h after cell seeding. Data are presented as mean values of three biological replicates ± SD. Student’s t-test was used to calculate statistical significance. Differences are considered significant at *P<0.05. (D) Western blot analysis of the activity of PI3K/AKT and MAPK pathways in melanoma cells grown in the presence or absence of insulin for 24 h, shown as levels of phosphorylated AKT at Ser473 (pAKTS473) and Thr308 (pAKTT308), and phosphorylated ERK1/2 (pERK1/2), respectively. n=2. (E) The level of phosphorylated AKT at indicated time points following insulin stimulation, shown as representative Western blots. Total AKT and GAPDH served as loading controls. (F) Densitometry was used to analyze band intensity. The level of phosphorylated AKT corrected by total AKT level measured at the indicated time points was expressed relative to corrected pAKT level at 3 h of insulin treatment. Data from two independent experiments are expressed as mean ± SD. |
Melanoma Cell Lines Differ in PI3K/AKT Pathway Activity Upon Insulin Stimulation
Phosphorylation of ERK1/2, effector proteins of the MAPK signaling cascade, was comparable in the presence and absence of insulin (Figure 1D), indicating that insulin did not affect this pathway. AKT phosphorylation was nearly undetectable in all cell lines in the absence of insulin (Figure 1D). When the PI3K/AKT pathway activity was examined in the presence of insulin, two melanoma cell lines, DMBC11 and DMBC12, exhibited substantial AKT activity, measured as phosphorylation of both PDK1-dependent (Thr308) and mTORC2-dependent (Ser473) target sites (Figure 1D). These two melanoma cell lines were hence designated as pAKThigh, and DMBC21, DMBC28 and DMBC29 cell lines were categorized as pAKTlow. Analysis of insulin-triggered changes over time revealed that marked insulin-induced AKT activity was sustained only in AKThigh cell lines, whereas AKTlow cell lines exhibited a peak activity of AKT at 3 h and its gradual decrease afterwards (Figure 1E and F).
Genetic Alterations in Insulin Signaling and PI3K/AKT Pathway are Rare in Melanomas
Next, to gain insight into a possible cause for differential PI3K/AKT pathway dynamics in melanoma cells, we analyzed the frequency of mutations in downstream components of the insulin signaling and PI3K/AKT pathway both in melanoma cell lines and in clinical melanoma samples. The main elements of the MAPK pathway were also included. The prevalence of genetic alterations in selected genes was queried in a total of 1084 melanoma tumors using cBioPortal for Cancer Genomics, and the frequency of mutations is shown in Figure 2. Genetic alterations in any element of insulin signaling, beginning with insulin and insulin-like growth factor receptors to AKT isoforms, as well as positive and negative regulators of the PI3K/AKT signaling cascade, were rare in clinical samples. Mutations in PTEN, which are carried by about 13.5% of clinical melanoma samples, and many other rare mutations were not found in any of the five investigated cell lines, according to data from whole-exome sequencing (WES).40 Three melanoma cell lines designated as AKTlow harbored V592A substitution in one of the isoforms of the catalytic subunit of PI3K, PIK3CD (phosphatidylinositol-4,5-bisphosphate 3-kinase catalytic subunit delta, also known as p110 delta), and all cell lines had a frame-shift alteration in the regulatory subunit of the PI3K gamma complex, PIK3R6 (Figure 2). The amino acid substitutions caused by point mutations shown in Figure 2 are available in Supplementary Table 1.
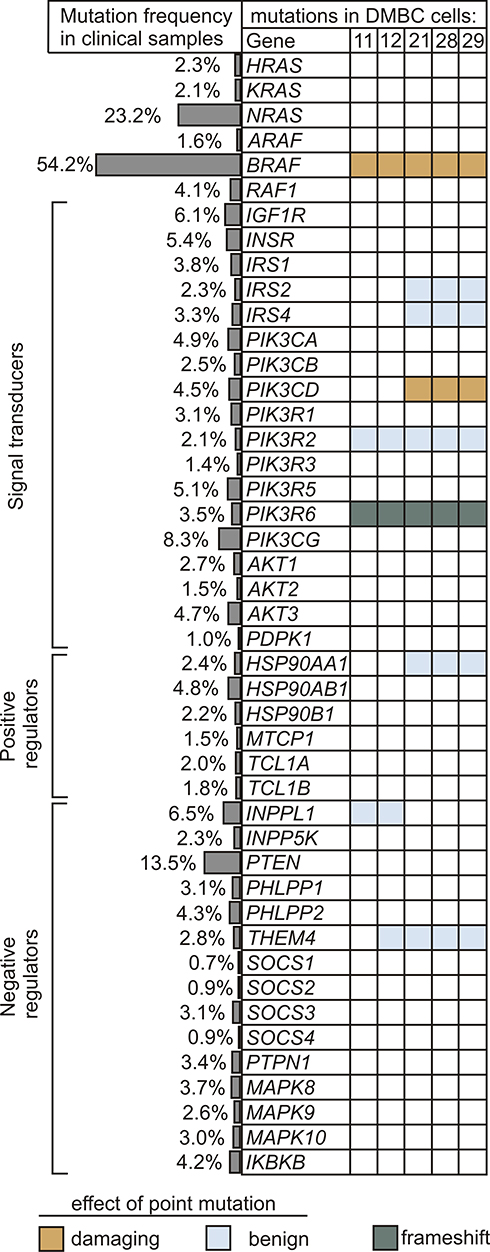 |
Figure 2 Alterations in genes encoding the components of insulin signaling and PI3K/AKT pathway. The frequency of genetic alterations based on the clinical dataset from cBioPortal for Cancer Genomics is shown as side bars, whereas the occurrence of mutations in melanoma cell lines used in this study is presented in the table. Raw data for cell lines are publicly available at ArrayExpress, under the accession number E-MTAB-6978. Indicated colors specify the type of mutation, while unaltered genes are left uncolored. Potential effects of amino acid substitution were evaluated in silico using PolyPhen-2 software, and were classified as benign (scores 0.000–0.449) and probably damaging (scores 0.960–1.000). |
Vemurafenib and Trametinib are Severely More Cytostatic and Cytotoxic in Insulin-Deprived Melanoma Cells Than in Insulin-Stimulated Cells, Despite Comparable Inhibition of the MAPK Pathway and Lack of Effect on the PI3K/AKT Pathway
Regardless of the presence of insulin, vemurafenib and trametinib efficiently suppressed the activity of the MAPK pathway in melanoma cells, as evidenced by diminished phosphorylation of ERK1/2, whereas they had no effect on the activity of the PI3K/AKT pathway (Figure 3A). Contrary to this, insulin significantly affected drug-induced changes in the frequency of Ki-67-expressing cells, and melanoma cells grown in the presence of insulin were significantly less responsive to drug treatment (Figure 3B). Drug-induced apoptosis, shown as PARP cleavage, was already observed primarily in insulin-deprived cells at 24 h of treatment (Figure 3A). This inhibitory influence of insulin on the number of apoptotic cells in response to vemurafenib or trametinib was confirmed by the analysis of Annexin V-positive cells (Figure 3C). All melanoma cell lines grown without insulin already exhibited a markedly higher increase in the percentage of apoptotic cells after 30 h of incubation with either drug, in comparison with an increase observed in the presence of insulin. This difference was markedly enhanced after additional 26 h of treatment. Deprivation of two other exogenous growth factors used in the medium, bFGF and EGF, had no effect on drug efficacy in the presence or absence of insulin (Figure 3C, upper panel vs lower panel). Notably, neither of the growth factors, including insulin, was necessary for survival of melanoma cells when the activity of the MAPK pathway was not suppressed by vemurafenib or trametinib. While an increase in the percentage of apoptotic cells in the absence of insulin was consistently higher than with insulin, investigated melanoma cell lines differed in their sensitivity to drug treatment, with the DMBC11 cell line being the least responsive to drugs, especially within the first 30 h. Overall, our results suggest that insulin interferes with the cytostatic and cytotoxic effects of targeted therapeutics. While vemurafenib and trametinib could 1) reduce expression of Ki-67, which may indicate that melanoma cells enter G0 phase characterized by low expression of Ki-67, and 2) induce apoptosis of melanoma cells, these drug-induced effects were markedly diminished by insulin.
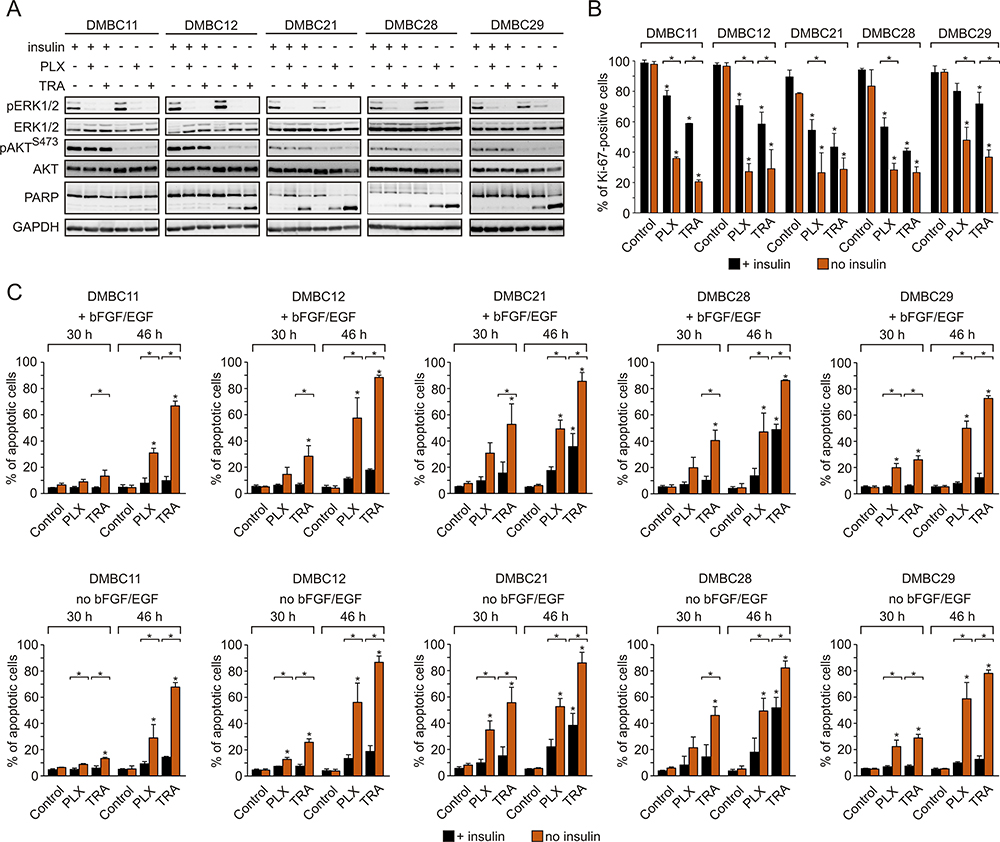 |
Figure 3 Insulin protects melanoma cells against vemurafenib- or trametinib-induced apoptosis and diminishes drug-triggered downregulation of Ki-67 expression. (A) Western blot analysis of the effects of 10 µM vemurafenib (PLX) or 50 nM trametinib (TRA) on the activity of MAPK (level of pERK1/2) and PI3K/AKT (level of pAKTS473) pathways, and PARP cleavage in the presence or absence of insulin, after 24 h of drug treatment. GAPDH was used as a loading control. n=3. (B) Insulin-induced changes in the percentage of Ki-67-positive melanoma cells, untreated or treated with PLX or TRA for 40 h. n=3. (C) Apoptosis shown as percentages of Annexin V-positive cells assessed by flow cytometry after 30 and 46 h of treatment with PLX or TRA, in the presence or absence of insulin. Bars represent mean values of three biological replicates ± SD. Statistical significance marked as asterisks in proximity to each bar refers to the drug-induced difference in relation to control, and as asterisks adjacent to lines above the bars refers to the difference between melanoma cells grown with or without insulin. Statistical significance for both panels was calculated with ANOVA followed by Scheffé’s test. Differences are considered significant at *P<0.05. |
Insulin Attenuates the Effects of Vemurafenib and Trametinib on DNA Integrity and Repair
Given that DNA integrity is a crucial condition required to pass the G1 checkpoint, we evaluated the level of phosphorylated histone H2AX (γ-H2AX), an indicator of DNA damage. Both drugs substantially increased the level of γ-H2AX in the nuclei of melanoma cells (Figure 4A), and two groups of melanoma cell lines could be distinguished. DMBC11 and DMBC12 cell lines already exhibited marked H2AX phosphorylation in control cells grown with or without insulin, which was further increased by drugs. The level of γ-H2AX could be further slightly increased by insulin, as shown in Supplementary Table 2. DMBC21, DMBC28 and DMBC29 cell lines, which showed almost undetectable levels of γ-H2AX in control settings, had this marker substantially enhanced by vemurafenib or trametinib, but only in nuclei of cells that were grown in the absence of insulin (Figure 4A). Microscopic visualization of γ-H2AX-stained nuclei confirmed abundant phosphorylation of H2AX in DMBC11 and DMBC12 cells regardless of the presence of insulin, and drug-induced phosphorylation of H2AX in DMBC21, DMBC28 and DMBC28, but only in the absence of insulin (Figure 4B). Our results indicate that insulin may play an inhibitory role in drug-induced stress, illustrated as increased levels of γ-H2AX, although particular melanoma cell lines differ in this respect.
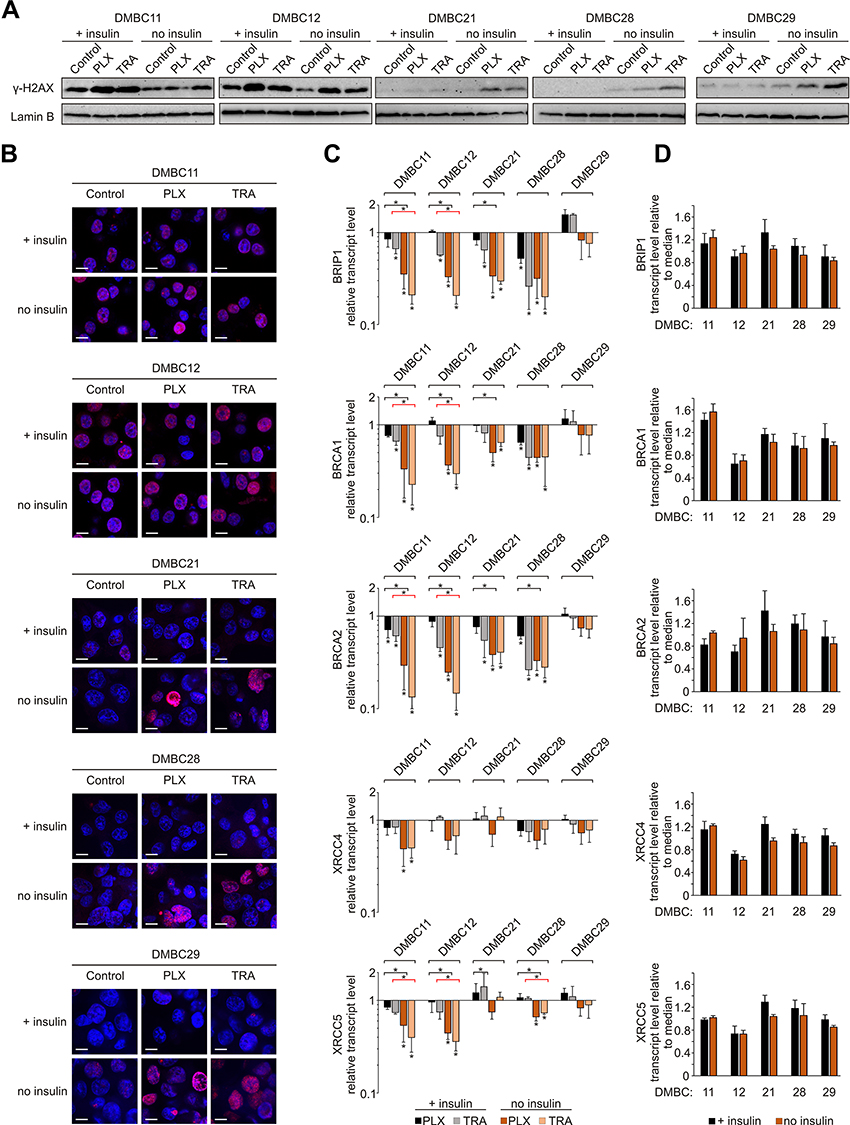 |
Figure 4 Insulin attenuates vemurafenib- and trametinib-induced changes in the γ-H2AX level and DNA repair capacity of melanoma cells. (A) Western blot analysis of the H2AX phosphorylation detected in nuclear extracts of control melanoma cells or cells treated with vemurafenib (PLX) or trametinib (TRA) for 12 h, in the presence or absence of insulin. Lamin B was used as a loading control. n=2. (B) Confocal imaging of melanoma cells stained with anti-phospho-H2AX (pink) merged with nuclear counterstain – DAPI (blue) after 12 h of drug treatment. Scale bar=10 µm. n=2. (C) Changes relative to controls in transcript levels of BRIP1, BRCA1, BRCA2, XRCC4 and XRCC5 after 24 h of drug treatment assessed by qRT-PCR and normalized to the expression of a reference gene, RPS17. Bars represent mean values of three independent experiments ± SD. ANOVA and Scheffé’s test were used to calculate statistical significance. Statistical significance marked as asterisks in proximity to each bar refers to the drug-induced difference in relation to control, and as asterisks adjacent to lines above the bars refers to the difference between melanoma cells grown with or without insulin (black lines for PLX-induced differences, red lines for TRA-induced differences). Differences are considered significant at *P<0.05. (D) Transcript levels of BRIP1, BRCA1, BRCA2, XRCC4 and XRCC5 in melanoma cells grown with or without insulin, relative to the median value for all five cell lines. |
The obtained results suggest that insulin can attenuate drug-related DNA damage, which may be associated with the efficiency of DNA damage repair systems. Analysis of transcript levels of genes involved in DNA repair revealed that the expression of BRIP1, BRCA1 and BRCA2, genes encoding elements of the homologous repair (HR) system, was reduced substantially by vemurafenib or trametinib in all cell lines except one, and this reduction was more pronounced in insulin-deprived cells (Figure 4C). The expression of selected genes encoding proteins of the non-homologous end joining pathway (NHEJ), XRCC4 and XRCC5, was reduced particularly in DMBC11 and DMBC12 cell lines, and the extent of these drug-dependent effects was also considerably higher in melanoma cells grown without insulin. In the DMBC29 cell line, none of HR- and NHEJ-related genes was downregulated by vemurafenib or trametinib in the presence of insulin. Notably, this cell line did not differ from other melanoma cell lines in the basal expression of DNA repair genes, either in the absence or the presence of insulin (Figure 4D). Altogether, we found that inhibition of DNA repair gene expression by targeted therapeutics in most melanoma cell lines is significant, and more substantial in the absence of insulin.
Insulin Impairs Combined Effects of Targeted Drugs and Doxorubicin in Melanoma Cells
Next, to further explore the influence of insulin on melanoma cell sensitivity to drugs, doxorubicin was used in combination with vemurafenib or trametinib. For proliferation analysis, lower concentrations of vemurafenib (2 µM) and trametinib (10 nM) were applied, as the robust apoptosis induced by higher concentrations of drugs (10 µM and 50 nM, respectively) used previously, in the absence of insulin overshadowed any effects of combined treatment on proliferation (not shown). The analysis of acidic phosphatase activity in melanoma cells demonstrated that doxorubicin alone did not substantially affect proliferation, except for DMBC11 and DMBC12 cells (Figure 5A). Combined treatment of doxorubicin with either of the targeted drugs resulted in more efficient reduction of viable cell number than obtained for any of these drugs used alone, especially for DMBC11 and DMBC12 cell lines (Figure 5A). A significant increase in the percentage of apoptotic cells was observed when doxorubicin was added to either vemurafenib or trametinib, except for the DMBC29 cell line (Figure 5B and C). Moreover, effects of the drug combination on the percentage of apoptotic cells (Figure 5B) could be related to drug-induced changes in the expression of DNA repair-related genes (Figure 4C). Lack of substantial drug-induced reduction in the expression of DNA repair-related genes rendered DMBC29 cells less sensitive to doxorubicin treatment. More importantly, insulin diminished the effects of combined treatment on proliferation (Figure 5A) and apoptosis (Figure 5B and C) in all melanoma cell lines.
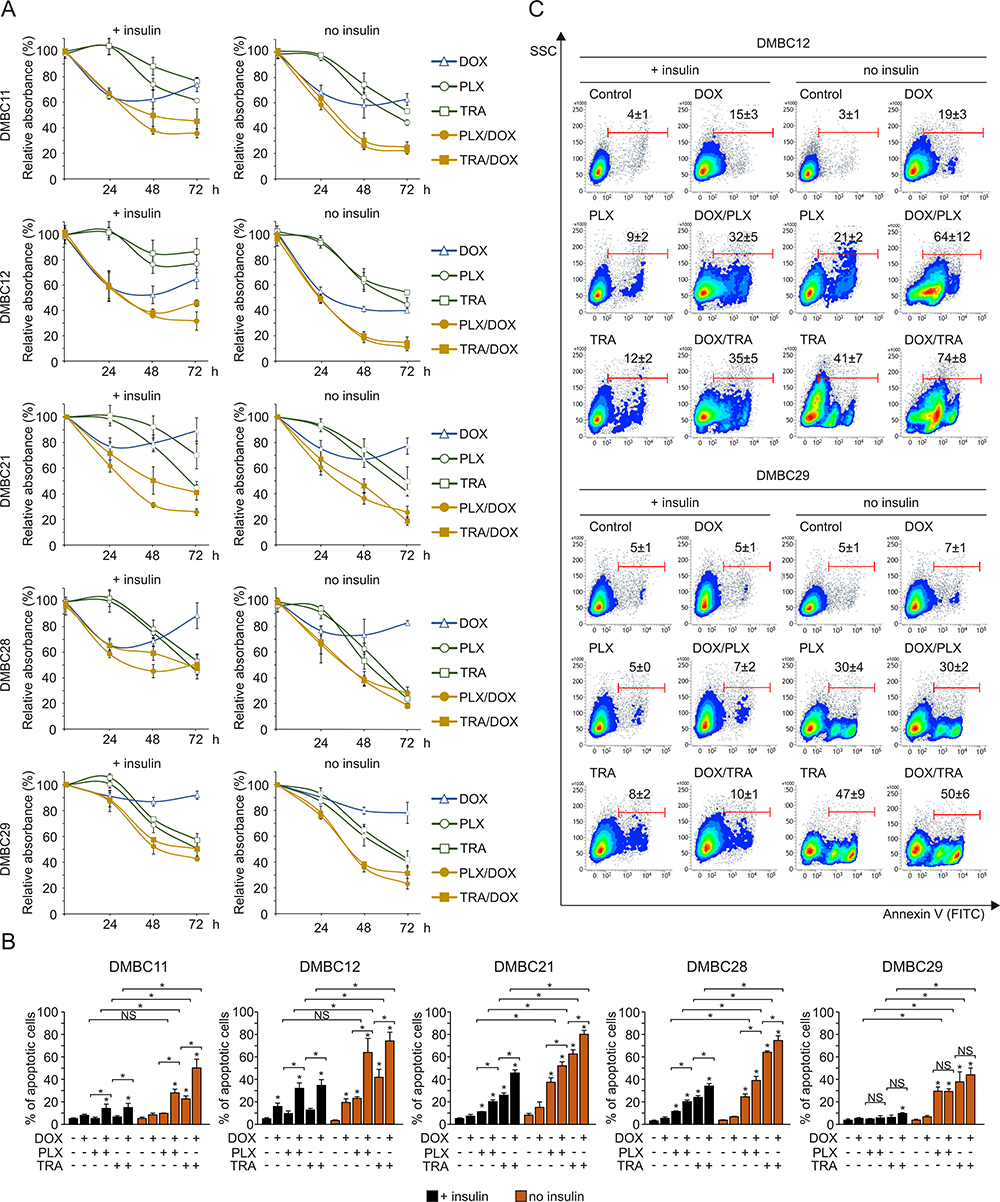 |
Figure 5 Insulin diminishes combined effects of doxorubicin with vemurafenib or trametinib on viable cell number. (A) Changes relative to control in viable cell numbers induced by vemurafenib (PLX, 2 µM), trametinib (TRA, 10 nM) and doxorubicin (DOX, 50 nM), used alone or in combination, assessed by the acidic phosphatase assay and presented as mean values of three biological replicates ± SD. (B) The percentages of apoptotic cells stained with Annexin V and assessed by flow cytometry after 36 h treatment with PLX, TRA and DOX are shown as bar graphs. Data are presented as mean values of three biological replicates ± SD. ANOVA and Scheffé’s test were used to calculate statistical significance. Statistical significance marked as asterisks in proximity to each bar refers to the drug-induced difference relative to control, and as asterisks adjacent to lines above the bars refers to the difference between targeted drugs used either alone or in combination with doxorubicin, or between drug-treated samples in the presence or absence of insulin. Differences are considered significant at *P<0.05. NS, not significant. (C) Representative density plots for the most (DMBC12) and least (DMBC29) doxorubicin-responsive cell lines after 36 h of drug treatment are shown. |
Insulin Attenuates Changes in Glutathione Homeostasis Induced by Vemurafenib or Trametinib in Melanoma Cells
Next, we assessed the effects of vemurafenib or trametinib on the redox status of melanoma cells by evaluating the level of cellular glutathione. The results revealed that in insulin-deprived melanoma cells both drugs not only reduced the ratio of the reduced (GSH) form to the oxidized (GSSG) form of glutathione (Figure 6A), but also diminished the total intracellular glutathione pool (Figure 6B). We expanded the analysis to the expression of two transmembrane transporters in charge of substrate uptake required for glutathione synthesis: SLC1A5 (also known as ASCT2), responsible for glutamine import into the cell, and SLC7A11 (also known as xCT), an antiporter that exports glutamate in exchange for cystine, a pivotal element in redox control. Transcript levels of both genes were significantly reduced following drug treatment in all melanoma cell lines, and this effect was diminished by insulin in most melanoma cell lines (Figure 6C). In addition, insulin significantly upregulated the basal levels of SLC7A11 in selected cell lines, especially in the DMBC21 cell line, in which the basal level of SLC1A5 transcript was also significantly higher in the presence of insulin (Figure 6D). Altogether, we found that insulin attenuates the effects of vemurafenib and trametinib on glutathione homeostasis.
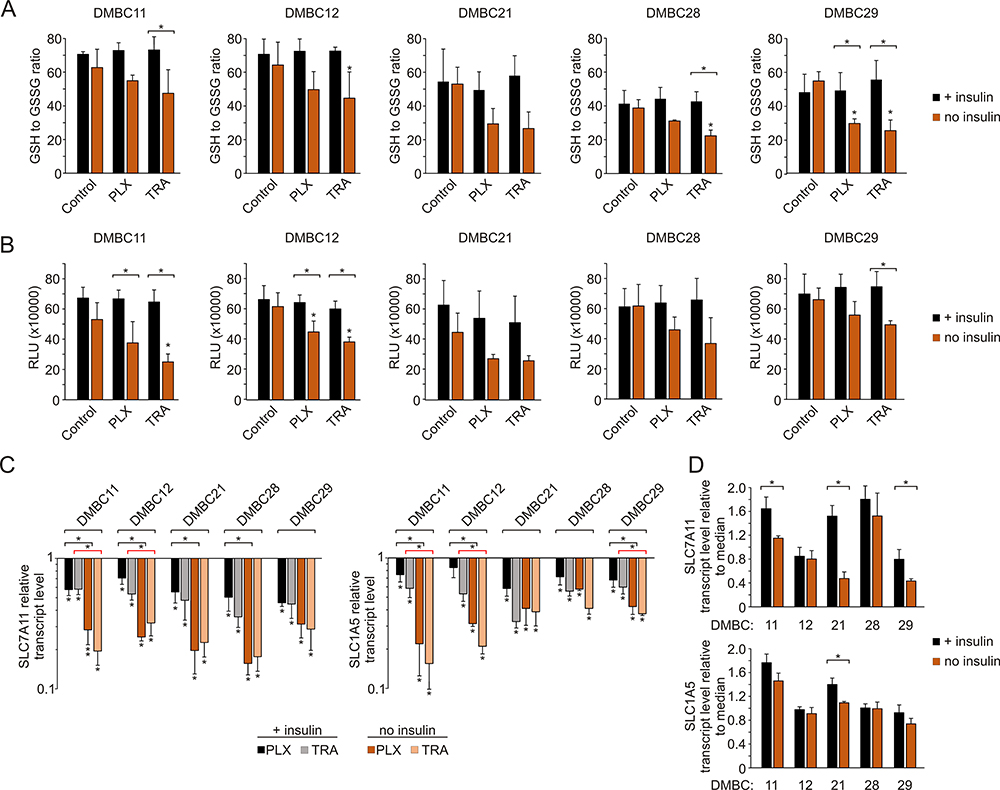 |
Figure 6 Insulin influences glutathione homeostasis in melanoma cells exposed to vemurafenib and trametinib. (A) The ratio of reduced (GSH) to oxidized (GSSG) glutathione after 12 h incubation with vemurafenib (PLX) and trametinib (TRA). (B) Luminescence measurements of total glutathione levels in melanoma cells after 12 h of drug treatment. RLU, relative light units. (C) Changes relative to controls in transcript levels of SLC7A11 and SLC1A5 after 24 h drug treatment, determined by qRT-PCR and normalized to the expression of a reference gene, RPS17. For panels A, B and C, statistical significance was calculated with ANOVA followed by Scheffé’s test. Statistical significance marked as asterisks in proximity to each bar refers to the drug-induced difference in relation to control, and as asterisks adjacent to lines above the bars refers to the difference between melanoma cells grown with or without insulin (black line for PLX-induced differences, red line for TRA-induced differences). (D) Comparison of basal transcript levels of SLC7A11 and SLC1A5 in melanoma cell lines at 26 h after cell seeding in the presence or absence of insulin. Gene expression in each melanoma cell line is presented relative to the median value for all five cell lines. Bars represent mean values ± SD. Student’s t-test was used to calculate statistical significance. Asterisks adjacent to lines above the bars refer to differences between median values obtained for melanoma cells grown with or without insulin. Differences are considered significant at *P<0.05. n=3. |
Discussion
Melanoma is still responsible for the majority of skin cancer-related deaths, even though melanoma survival has increased recently.51–53 Current therapeutic modalities for melanoma patients consist of surgical excision in an early stage of disease, and chemotherapy, immunotherapy and targeted therapy in late-stage melanoma patients.54 While inhibitors of BRAFV600 (vemurafenib, dabrafenib and encorafenib) and MEK1/2 (trametinib, cobimetinib and binimetinib) brought hope for late-stage melanoma patients, intrinsic and acquired resistance still represents a major challenge in clinical practice.55–57 Therefore, it is critical to recognize factors that could potentially expedite drug resistance. In our study, we singled out insulin as the examined factor by using serum-free cell culture medium and demonstrated the significance of insulin in melanoma cells’ response to treatment.
The role of microenvironmental stimuli, specifically growth factors, in the response of melanoma to targeted therapeutics has been studied extensively and reviewed.42,58-63 The impact of insulin, however, the serum level of which differs between patients, on the efficacy of targeted therapeutics in melanoma has not been sufficiently investigated. One short report showing limited data on the influence of insulin on dacarbazine- and PLX4720-induced cytotoxicity in melanoma cells has been published;64 however, melanoma cells were cultured in the presence of serum in that study.
Melanoma cells predominantly rely on the constitutively active MAPK pathway for growth and survival, and activity of this pathway was not modulated by insulin in control cells, and ERK1/2 activity was almost completely inhibited by either vemurafenib or trametinib irrespective of the presence of insulin. Without impacting on the activity of the MAPK pathway, insulin substantially influenced the proliferation and survival of melanoma cells exposed to either vemurafenib or trametinib (Figure 7). Insulin affected several processes in melanoma cells grown without or with targeted therapeutics, and the extent of its influence depended on the cell line. The effects of insulin administration were the most pronounced in those cell lines that exerted dedifferentiated phenotypes, DMBC11 and DMBC12, and much less detected in the DMBC29 cell line, which contained a large subpopulation of differentiated MITF-positive cells.45 This is in line with the notion of extensive variability in the response of melanoma cells to drugs.38,45,65 This remark can be applied to several effects observed in melanoma cells in our study, including insulin’s influence on PI3K/AKT activity, which was either sustainable or transient, and phosphorylation of histone H2AX, which was either constitutive or drug-inducible but only in melanoma cells grown without insulin. Regardless of the differences observed between the cell lines, insulin substantially reduced the efficacy of vemurafenib and trametinib, which was clearly visible in PARP cleavage, percentages of Annexin V-positive cells and Ki-67-positive cells, phosphorylation of H2AX, expression of HR- and to a lower extent NHEJ-associated genes of DNA repair system, GSH to GSSG ratio, total intracellular glutathione pool and expression of genes encoding transmembrane transporters responsible for an uptake of substrates required for glutathione synthesis.
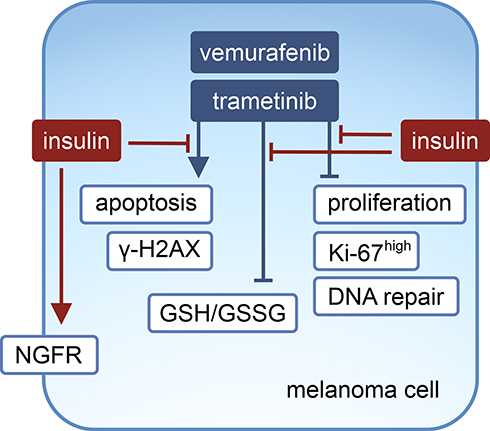 |
Figure 7 Proposed model of the influence of insulin on vemurafenib- and trametinib-induced effects in melanoma cells. |
For the first time, we have shown that the expression of NGFR (CD271) can be related to insulin signaling, and this receptor was consistently upregulated when insulin was present in the microenvironment. NGFR is expressed on several cell types and its cellular consequences depend on the context.66 In melanoma, NGFR-expressing cells represent a neural crest stem-like population with tumor-initiating capacity.49,50 The elevated levels of NGFR have been associated with several processes accompanying the progression of melanoma, such as enhanced survival and metastatic capacity, evasion of the immune system and development of resistance to drugs, including inhibitors of the MAPK pathway.38,67-70 Our finding suggests that insulin, by promoting the expression of NGFR, may partake in the acquisition of stem-like properties in melanoma cells, leading to their limited sensitivity to drugs. Although insulin consistently caused an increase in the frequency of NGFR-positive cells in all melanoma cell populations, with the enrichment by a factor of more than 2.5, the percentages of NGFR-positive cells were different in each cell line. The lowest effect of insulin was observed in the DMBC29 cell population, from 1.3±0.2% in the medium without insulin to only 4.9±0.5% in the presence of insulin. When acquired resistance was developed in the cell lines used in the present study, the 29_TRAR cell line, resistant to trametinib, was the least changed in terms of the frequency of MITF-positive cells and expression of genes related to pigmentation,45 and the frequency of NGFR-positive cells remained low and unaltered in this highly differentiated cell line.38 NGFR expression has a strong impact on melanoma transcriptomes in a cell-context dependent manner, and distinct pathways can be connected to NGFR expression in melanoma cells and melanocytes.49 The diversity of responses to insulin observed between cell lines in our study, eg, in H2AX phosphorylation or DNA repair gene expression, may be partially explained by differences in the frequency of NGFR-positive cells. Our results are in line with the view that intrinsic features of melanomas, such as a differentiation versus stem-like status, predefine the cell response to changes introduced into the microenvironment, and insulin as a constituent of the microenvironment may also affect melanoma cell phenotype and response to therapeutics in a cell status-dependent manner.
Differential expression of γ-H2AX in melanoma cell lines has previously been reported.71 In our study, two groups of melanoma cell lines could be distinguished based on the γ-H2AX level, DMBC11 and DMBC12 that were intrinsically γ-H2AXhigh, and DMBC21, DMBC28 and DMBC29 that were γ-H2AXlow. H2AX phosphorylation was not detrimental to DMBC11 and DMBC12 cell lines since, despite the high γ-H2AX level, no reduction in cell viability of control cells was observed at any time point. Elevated γ-H2AX levels were also found during M phase of the cell cycle in normally growing mammalian cells.72 These two γ-H2AXhigh cell lines, DMBC11 and DMBC12, exerted sustained AKT activity. AKT has been shown to mediate H2AX phosphorylation in HeLa cells in response to DNA damage but also during cell cycle progression.73 Drug treatment caused a higher increase in γ-H2AX level associated with induction of apoptosis in melanoma cells grown in medium without insulin than in cells grown in the presence of insulin. Our finding that the reduction in DNA repair genes is significantly more pronounced in the absence of insulin could partially explain this phenomenon. Again, DMBC29 cells were exceptional in this respect as, while DNA repair gene expression was not reduced by either drug, an increase in γ-H2AX levels in the absence of insulin was still detected. Although we cannot provide an unambiguous explanation for disparities in γ-H2AX levels detected in the investigated cell lines, the pleiotropic effects of insulin signaling, together with the wide range of cellular processes affected by MAPK pathway inhibition, should be taken into consideration. For instance, insulin has severe effects on cellular metabolism, and the DMBC29 cells exhibited a significant decrease in the GSH:GSSG ratio in drug-treated cells in the absence of insulin, which could have contributed to increased DNA damage. Moreover, in the absence of insulin, the DMBC29 cell line had the lowest basal expression of SLC7A11 of all cell lines, and the second lowest ratio of GSH:GSSG, which could indicate the sensitivity of the cell line to redox imbalance, but only when insulin is not provided. In addition, it has been recently observed in thyroid cancer that BRAF inhibitor delayed the resolution of γ-H2AX foci, which could partially explain the accumulation of γ-H2AX after drug treatment in cells with high basal levels of γ-H2AX.74 Nonetheless, further studies are needed to find the direct cause of changes in γ-H2AX in melanoma cells that exert diverse phenotypes.
Given the widely accepted pro-survival role of the PI3K/AKT pathway and that activation of this pathway depended on the presence of insulin in our study, it is reasonable to assume that the detrimental effects of vemurafenib and trametinib on melanoma cell viability were attenuated by insulin via the PI3K/AKT pathway. Such a hypothesis is supported by previously published studies, showing that survival of melanoma cells upon BRAFV600E or MEK1/2 inhibition was conditional on AKT activity.75,76 However, other reports have shown that inhibition of PI3K or AKT alone was insufficient to increase the sensitivity of melanoma cells to MAPK inhibitors.77–79 We found that the durability of PI3K/AKT pathway activation in insulin-treated melanoma cells varied between cell lines despite the continued presence of insulin in the microenvironment. While insulin-mediated activation of AKT was transient in some melanoma cell lines, the pro-survival effect of insulin in these cells persisted long after AKT phosphorylation was diminished. Genetically, all three melanoma cell lines, in which the PI3K/AKT was only transiently activated, harbor a V592A substitution in PIK3CD. This delta isoform has been reported primarily in leukocytes80 and leukemic cells;81,82 however, there has also been an indication of its expression in both untransformed and transformed cells of melanocytic origin.83 So far, no studies have reported a V592A substitution in PIK3CD as a functional alteration leading to only transient AKT activation in melanoma. Notably, we have recently shown that all three cell lines bearing a V592A substitution could become sustainably pAKThigh in the presence of insulin after developing resistance to either vemurafenib or trametinib.38 This excluded a V592A substitution as a causative factor of only transient activation of AKT in the response to insulin in their drug-naïve counterparts. In summary, we could not find any correlation between mutations detected in downstream components of the insulin signaling and PI3K/AKT pathway with different phenotypes of the investigated melanoma cell lines in terms of AKT activity. The lack of substantial genetic changes in elements of the insulin signaling pathway found in this study is consistent with the low frequency of PI3K/AKT pathway mutations in melanoma detected in large-scale genomic analyses.33,84-86 Most frequently found alterations in the PI3K/AKT signaling axis in melanoma are loss-of-function mutations in PTEN and copy number alterations of AKT.33,86 While both modifications promote increased AKT activity, neither of them could explain the differences in PI3K/AKT pathway activity in melanoma cells used in this study, as all melanoma cell lines were wild-type PTEN and did not substantially differ in total AKT levels. The diversity of melanoma cell response to insulin may be considered as a result of phenotypic cell plasticity driven by epigenetic modifications87,88 in response to changes in the microenvironment rather than genetic alterations, which, however, needs further investigation. Melanoma cells have been shown to upregulate the IGF1R–MEK5–Erk5 signaling axis as a resistance mechanism to bypass BRAFV600E, MEK1/2 and ERK1/2 inhibition,79 and simultaneous inhibition of PI3K and IGF-1R may be necessary to maximize the efficacy of MAPK inhibitors.77,78 Notably, thus far, clinical attempts to inhibit IGF-1R as an anticancer treatment strategy have been unsuccessful,89–91 in part because the IR compensates for the loss of IGF-1R signaling.92 All of this points to a critical role of insulin, as an upstream stimulant of the aforementioned pathways, in the efficacy of targeted therapy against melanoma. Arguably, potential differences in IGF-1R or IR expression could contribute to differences in the initial phospho-AKT level after insulin treatment, but would not explain the differences in duration of the activating signal observed in our study.
Stimulation of the PI3K/ATK pathway activity drives numerous molecular mechanisms, among them those that lead to elevated reactive oxygen species (ROS) levels, including modulation of mitochondrial bioenergetics or activation of NADPH oxidases (NOXs).93 At the same time, PI3K activation confers resistance to oxidative stress by increasing the antioxidant response through upregulation of the Keap1-Nrf2 pathway and increased expression of enzymes involved in ROS detoxification, including superoxide dismutase, NADPH quinone dehydrogenase 1, glutathione S-transferase and glutamate cysteine ligase.93–96 Recent studies have pointed to the ROS-detoxifying capacity of melanoma cells as a contributor to drug resistance,97–99 and the ROS-detoxifying role of the PI3K/AKT pathway has been documented by showing that resistance to MEK1/2 inhibition in melanoma cells with elevated oxidative phosphorylation can be overcome by inhibition of mTORC1/2, a key downstream outlet of the PI3K/AKT pathway.100 Insulin increases glucose uptake and lactate production through the PI3K/mTOR axis, supports aerobic glycolysis and stimulates pentose phosphate pathway-dependent production of NADPH, critical in the maintenance of GSH and reductive biosynthesis.101–103 Thereby, insulin enhances the metabolic capacities of cancer cells. SLC7A11, specifically, has been shown to be essential for the maintenance of intracellular glutathione levels.104 Melanoma cells resistant to inhibitors of the MAPK pathway have been reported to depend on SLC7A11 activity for the maintenance of redox balance.98 We have previously shown that vemurafenib and trametinib can reduce the expression of SLC7A11 and SLC1A5 in BRAFV600E and HRASQ61R melanoma cells,43 which is also confirmed in the present study, and furthermore, we have now demonstrated the influence of insulin on drug-induced reduction of their expression and the total glutathione pool. SLC7A11 and SLC1A5 have been shown to be regulated by components of the PI3K/AKT105 and RAS/RAF/MEK106 pathways, which may explain the greater reduction in their expression when the activity of both signaling pathways is diminished. Altogether, our study also suggests the role of insulin signaling in glutathione homeostasis in melanoma cells under treatment with MAPK inhibitors. Glutathione is essential for the maintenance of redox balance and the process of protein thiolation, which depends specifically on the ratio of GSH:GSSG. The thiol status of proteins, in turn, regulates many metabolic processes and signaling pathways.107 Given that MAPK inhibition has been shown to shift the metabolic dependence towards ROS-generating oxidative metabolism and that glutamine is often used as a metabolic fuel, deregulation in GSH content or glutamine influx may have severe consequences on drug-treated cells. Moreover, GSH has been shown to serve as a cofactor in enzymatic repair of the damaged DNA108 and its high levels have been associated with multidrug resistance of many cancer types.109 Besides affecting the expression of transporters involved in glutathione synthesis, insulin restrained the vemurafenib- and trametinib-induced suppression of transcription of homologous recombination genes, BRIP1, BRCA1 and BRCA2. It has been demonstrated recently that dabrafenib and trametinib are capable of suppressing the expression of BRIP1 and BRCA2, but only in selected cell lines.110 This is in agreement with our results showing a differential suppression of these genes in the investigated cell lines, with DMBC29 being the least responsive. While in the report of Maertens et al110 the combined effects of dabrafenib and trametinib have been evaluated, in our study vemurafenib and trametinib used as single agents generated similar effects on the expression of DNA repair genes in the majority of melanoma cell lines, unless insulin was present in the microenvironment. More substantial reduction of DNA repair gene expression, together with the accumulation of γ-H2AX in most melanoma cell lines in the absence of insulin, further demonstrates the role of insulin in the protection of melanoma cells against vemurafenib and trametinib. These results, together with the influence of insulin on glutathione homeostasis, point to a possible double-sided protection against DNA damage by GSH: from eliminating the cause of the DNA lesion to aiding its repair.
Recently, it has been demonstrated that inhibitors of the PI3K/AKT pathway caused an acute increase in glucose blood levels and insulin serum levels in wild-type mice and mice with tumor allografts.111 The authors suggested that insulin spikes induced by PI3K inhibitors could cause a transient enhancement in glucose uptake in the tumor, which could support tumor growth. Although melanoma allografts were not investigated in this study, the importance of approaches that manage blood insulin levels in the tumor treatment were underlined. This has been supported by other studies also performed in animal models and showing that caloric restriction and a ketogenic diet play an anticancer role in terms of tumor initiation, progression and metastasis.112 Managing insulin levels in non-diabetic cancer patients carries no clinical risk. In fact, the nutrition regimen of cancer patients with no prior record of hyperinsulinemia per se has been drawing increasing attention, both in general patient care and in the clinical evaluation of PI3K inhibitors.113,114 Therefore, our study, which clearly indicates a reduced efficacy of targeted therapeutics in melanoma cells in the presence of insulin, may stimulate clinical evaluation of how high level of insulin impacts the response to anticancer treatment.
Conclusion
Our study has revealed that while insulin does not influence the activity of the MAPK pathway itself, it protects BRAFV600E melanoma cells against targeted therapeutics, vemurafenib or trametinib, that suppress this pathway. Despite differences in the phenotypes of melanoma cells employed in this study,40,41 several effects of insulin administration on the effectiveness of targeted therapeutics used alone or in combination with doxorubicin have been found in all melanoma cell lines, including less effective inhibition of proliferation and induction of apoptosis. Vemurafenib- and trametinib-induced changes in glutathione homeostasis and expression of DNA repair genes were also attenuated by insulin. As our results indicate much lower efficacy of targeted therapy in melanoma cells with insulin in the microenvironment, the relevance of high levels of insulin in melanoma patients undergoing anticancer treatment with targeted therapeutics needs to be determined.
Author Contributions
All authors made substantial contributions to conception and design, acquisition of data, or analysis and interpretation of data; took part in drafting the article or revising it critically for important intellectual content; agreed to submit to the current journal; gave final approval of the version to be published; and agree to be accountable for all aspects of the work.
Disclosure
The authors report no conflicts of interest in this work.
References
1. Dimitriadis G, Mitrou P, Lambadiari V, Maratou E, Raptis SA. Insulin effects in muscle and adipose tissue. Diabetes Res Clin Pract. 2011;93(Suppl 1):S5259. doi:10.1016/S0168-8227(11)70014-6
2. Friberg E, Orsini N, Mantzoros CS, Wolk A. Diabetes mellitus and risk of endometrial cancer: a meta-analysis. Diabetologia. 2007;50(7):
3. Larsson SC, Mantzoros CS, Wolk A. Diabetes mellitus and risk of breast cancer: a meta-analysis. Int J Cancer. 2007;121(4):
4. Barone BB, Yeh HC, Snyder CF, et al. Long-term all-cause mortality in cancer patients with preexisting diabetes mellitus: a systematic review and meta-analysis. JAMA. 2008;300(23):
5. Ben Q, Xu M, Ning X, et al. Diabetes mellitus and risk of pancreatic cancer: A meta-analysis of cohort studies. Eur J Cancer. 2011;47(13):
6. Jiang Y, Ben Q, Shen H, Lu W, Zhang Y, Zhu J. Diabetes mellitus and incidence and mortality of colorectal cancer: a systematic review and meta-analysis of cohort studies. Eur J Epidemiol. 2011;26(11):
7. Wang C, Wang X, Gong G, et al. Increased risk of hepatocellular carcinoma in patients with diabetes mellitus: a systematic review and meta-analysis of cohort studies. Int J Cancer. 2012;130(7):
8. Renehan AG, Yeh HC, Johnson JA, et al. Diabetes and cancer (2): evaluating the impact of diabetes on mortality in patients with cancer. Diabetologia. 2012;55(6):
9. Tsujimoto T, Kajio H, Sugiyama T. Association between hyperinsulinemia and increased risk of cancer death in nonobese and obese people: A population-based observational study. Int J Cancer. 2017;141(1):
10. Bruning PF, Bonfrèr JM, van Noord PA, Hart AA, de Jong-bakker M, Nooijen WJ. Insulin resistance and breast-cancer risk. Int J Cancer. 1992;52(4):
11. Djiogue S, Nwabo Kamdje AH, Vecchio L, et al. Insulin resistance and cancer: the role of insulin and IGFs. Endocr Relat Cancer. 2013;20(1):R1R17. doi:10.1530/ERC-12-0324
12. Arcidiacono B, Iiritano S, Nocera A, et al. Insulin resistance and cancer risk: an overview of the pathogenetic mechanisms. Exp Diabetes Res. 2012;2012:789174. doi:10.1155/2012/789174
13. Argirion I, Weinstein SJ, Männistö S, Albanes D, Mondul AM. Serum insulin, glucose, indices of insulin resistance, and risk of lung cancer. Cancer Epidemiol Biomarkers Prev. 2017;26(10):
14. Nimptsch K, Kenfield S, Jensen MK, et al. Dietary glycemic index, glycemic load, insulin index, fiber and whole-grain intake in relation to risk of prostate cancer. Cancer Causes Control. 2011;22(1):
15. Yoshikawa T, Noguchi Y, Doi C, Makino T, Nomura K. Insulin resistance in patients with cancer: relationships with tumor site, tumor stage, body-weight loss, acute-phase response, and energy expenditure. Nutrition. 2001;17(78):
16. Mu N, Zhu Y, Wang Y, Zhang H, Xue F. Insulin resistance: a significant risk factor of endometrial cancer. Gynecol Oncol. 2012;125(3):
17. Li Y, Bian X, Wei S, He M, Yang Y. The relationship between pancreatic cancer and type 2 diabetes: cause and consequence. Cancer Manag Res. 2019;11:
18. Antoniadis AG, Petridou ET, Antonopoulos CN, et al. Insulin resistance in relation to melanoma risk. Melanoma Res. 2011;21(6):
19. Sevim DG, Kiratli H. Serum adiponectin, insulin resistance, and uveal melanoma: clinicopathological correlations. Melanoma Res. 2016;26(2):
20. Scoppola A, Strigari L, Barnabei A, et al. Insulin resistance as a risk factor for cutaneous melanoma. A case control study and risk-assessment nomograms. Front Endocrinol. 2019;10:757. doi:10.3389/fendo.2019.00757
21. Wilcox G. Insulin and insulin resistance. Clin Biochem Rev. 2005;26(2):
22. Wagner EF, Petruzzelli M. Cancer metabolism: A waste of insulin interference. Nature. 2015;521(7553):
23. Honors MA, Kinzig KP. The role of insulin resistance in the development of muscle wasting during cancer cachexia. J Cachexia Sarcopenia Muscle. 2012;3(1):
24. Dev R, Bruera E, Dalal S. Insulin resistance and body composition in cancer patients. Ann Oncol. 2018;29(Suppl 2):ii18ii26. doi:10.1093/annonc/mdx815
25. Peacock JL, Norton JA. Impact of insulin on survival of cachectic tumor-bearing rats. JPEN J Parenter Enteral Nutr. 1988;12(3):
26. Beck SA, Tisdale MJ. Effect of insulin on weight loss and tumour growth in a cachexia model. Br J Cancer. 1989;59(5):
27. Lundholm K, Körner U, Gunnebo L, et al. Insulin treatment in cancer cachexia: effects on survival, metabolism, and physical functioning. Clin Cancer Res. 2007;13(9):
28. Chitnis MM, Yuen JS, Protheroe AS, Pollak M, Macaulay VM. The type 1 insulin-like growth factor receptor pathway. Clin Cancer Res. 2008;14(20):
29. Malaguarnera R, Belfiore A. The insulin receptor: a new target for cancer therapy. Front Endocrinol. 2011;2:93. doi:10.3389/fendo.2011.00093
30. Poloz Y, Stambolic V. Obesity and cancer, a case for insulin signaling. Cell Death Dis. 2015;6(12):e2037. doi:10.1038/cddis.2015.381
31. De Luca A, Maiello MR, D’Alessio A, Pergameno M, Normanno N. The RAS/RAF/MEK/ERK and the PI3K/AKT signalling pathways: role in cancer pathogenesis and implications for therapeutic approaches. Expert Opin Ther Targets. 2012;16(Suppl 2):S17S27. doi:10.1517/14728222.2011.639361
32. Asati V, Mahapatra DK, Bharti SK. PI3K/Akt/mTOR and Ras/Raf/MEK/ERK signaling pathways inhibitors as anticancer agents: structural and pharmacological perspectives. Eur J Med Chem. 2016;109:
33. Cancer Genome Atlas Network. Genomic classification of cutaneous melanoma. Cell. 2015;161(7):
34. National Cancer Institute. Drugs Approved for Melanoma. Available from: https://www.cancer.gov/about-cancer/treatment/drugs/melanoma.
35. Suleymanova N, Crudden C, Worrall C, Dricu A, Girnita A, Girnita L. Enhanced response of melanoma cells to MEK inhibitors following unbiased IGF-1R down-regulation. Oncotarget. 2017;8(47):8225682267. doi:10.18632/oncotarget.19286
36. Reuveni H, Flashner-Abramson E, Steiner L, et al. Therapeutic destruction of insulin receptor substrates for cancer treatment. Cancer Res. 2013;73(14):43834394. doi:10.1158/0008-5472.CAN-12-3385
37. Deuker MM, Marsh Durban V, Phillips WA, McMahon M. PI3ʹ-kinase inhibition forestalls the onset of MEK1/2 inhibitor resistance in BRAF-mutated melanoma. Cancer Discov. 2015;5(2):143153. doi:10.1158/2159-8290.CD-14-0856
38. Hartman ML, Sztiller-Sikorska M, Gajos-Michniewicz A, Czyz M. Dissecting mechanisms of melanoma resistance to BRAF and MEK inhibitors revealed genetic and non-genetic patient- and drug-specific alterations and remarkable phenotypic plasticity. Cells. 2020;9(1):142. doi:10.3390/cells9010142
39. Hartman ML, Talar B, Sztiller-Sikorska M, Nejc D, Czyz M. Parthenolide induces MITF-M downregulation and senescence in patient-derived MITF-M(high) melanoma cell populations. Oncotarget. 2016;7(8):
40. Hartman ML, Sztiller-Sikorska M, Czyz M. Whole-exome sequencing reveals novel genetic variants associated with diverse phenotypes of melanoma cells. Mol Carcinog. 2019;58(4):
41. Hartman ML, Rozanski M, Osrodek M, Zalesna I, Czyz M. Vemurafenib and trametinib reduce expression of CTGF and IL-8 in V600EBRAF melanoma cells. Lab Invest. 2017;97(2):
42. Zalesna I, Osrodek M, Hartman ML, et al. Exogenous growth factors bFGF, EGF and HGF do not influence viability and phenotype of V600EBRAF melanoma cells and their response to vemurafenib and trametinib in vitro. PLoS One. 2017;12(8):e0183498. doi:10.1371/journal.pone.0183498
43. Osrodek M, Hartman ML, Czyz M. Physiologically relevant oxygen concentration (6% O2) as an important component of the microenvironment impacting melanoma phenotype and melanoma response to targeted therapeutics in vitro. Int J Mol Sci. 2019;20(17):4203. doi:10.3390/ijms20174203
44. Hartman ML, Czyz M. TYRP1 mRNA level is stable and MITF-M-independent in drug-naïve, vemurafenib- and trametinib-resistant BRAFV600E melanoma cells. Arch Dermatol Res. 2019. doi:10.1007/s00403-019-01995-w
45. Czyz M, Sztiller-Sikorska M, Gajos-Michniewicz A, Osrodek M, Hartman ML. Plasticity of drug-naïve and vemurafenib- or trametinib-resistant melanoma cells in execution of differentiation/pigmentation program. J Oncol. 2019;2019:1697913. doi:10.1155/2019/1697913
46. The cBioPortal for cancer genomics. Available from: https://www.cbioportal.org.
47. Keyoto Encyclopedia of Genes and Genomes (KEGG). Available from https://www.kegg.jp.
48. Sztiller-Sikorska M, Koprowska K, Jakubowska J, et al. Sphere formation and self-renewal capacity of melanoma cells is affected by the microenvironment. Melanoma Res. 2012;22(3):
49. Boiko AD, Razorenova OV, van de Rijn M, et al. Human melanoma-initiating cells express neural crest nerve growth factor receptor CD271. Nature. 2010;466(7302):
50. Redmer T, Welte Y, Behrens D, et al. The nerve growth factor receptor CD271 is crucial to maintain tumorigenicity and stem-like properties of melanoma cells. PLoS One. 2014;9(5):e92596. doi:10.1371/journal.pone.0092596
51. Siegel RL, Miller KD, Jemal A. Cancer statistics, 2020. CA Cancer J Clin. 2020;70(1):
52. Crocetti E, Mallone S, Robsahm TE, et al. Survival of patients with skin melanoma in Europe increases further: results of the EUROCARE-5 study. Eur J Cancer. 2015;51(15):
53. Iadeluca L, Mardekian J, Chander P, Hopps M, Makinson GT. The burden of selected cancers in the US: health behaviors and health care resource utilization. Cancer Manag Res. 2017;9:
54. Garbe C, Amaral T, Peris K, et al. European consensus-based interdisciplinary guideline for melanoma. Part 2: treatment - update 2019. Eur J Cancer. 2020;126:
55. Kozar I, Margue C, Rothengatter S, Haan C, Kreis S. Many ways to resistance: how melanoma cells evade targeted therapies. Biochim Biophys Acta Rev Cancer. 2019;1871(2):
56. Tian Y, Guo W. A review of the molecular pathways involved in resistance to braf inhibitors in patients with advanced-stage melanoma. Med Sci Monit. 2020;26:e920957. doi:10.12659/MSM.920957
57. Robert C, Karaszewska B, Schachter J, et al. Improved overall survival in melanoma with combined dabrafenib and trametinib. N Engl J Med. 2015;372(1):
58. Straussman R, Morikawa T, Shee K, et al. Tumour micro-environment elicits innate resistance to RAF inhibitors through HGF secretion. Nature. 2012;487(7408):
59. Filitis DC, Rauh J, Mahalingam M. The HGF-cMET signaling pathway in conferring stromal-induced BRAF-inhibitor resistance in melanoma. Melanoma Res. 2015;25(6):
60. Rohrbeck L, Gong JN, Lee EF, et al. Hepatocyte growth factor renders BRAF mutant human melanoma cell lines resistant to PLX4032 by downregulating the pro-apoptotic BH3-only proteins PUMA and BIM. Cell Death Differ. 2016;23(12):
61. Grimm J, Hufnagel A, Wobser M, et al. BRAF inhibition causes resilience of melanoma cell lines by inducing the secretion of FGF1. Oncogenesis. 2018;7(9):71. doi:10.1038/s41389-018-0082-2
62. Czyz M. HGF/c-MET signaling in melanocytes and melanoma. Int J Mol Sci. 2018;19(12):3844. doi:10.3390/ijms19123844
63. Czyz M. Fibroblast growth factor receptor signaling in skin cancers. Cells. 2019;8(6):540. doi:10.3390/cells8060540
64. Chi M, Ye Y, Zhang XD, Chen J. Insulin induces drug resistance in melanoma through activation of the PI3K/Akt pathway. Drug Des Devel Ther. 2014;8:
65. Roesch A. Tumor heterogeneity and plasticity as elusive drivers for resistance to MAPK pathway inhibition in melanoma. Oncogene. 2015;34(23):
66. Tomellini E, Touil Y, Lagadec C, et al. Nerve growth factor and proNGF simultaneously promote symmetric self-renewal, quiescence, and epithelial to mesenchymal transition to enlarge the breast cancer stem cell compartment. Stem Cells. 2015;33(2):
67. Civenni G, Walter A, Kobert N, et al. Human CD271-positive melanoma stem cells associated with metastasis establish tumor heterogeneity and long-term growth. Cancer Res. 2011;71(8):
68. Li S, Yue D, Chen X, et al. Epigenetic regulation of CD271, a potential cancer stem cell marker associated with chemoresistance and metastatic capacity. Oncol Rep. 2015;33(1):
69. Lehraiki A, Cerezo M, Rouaud F, et al. Increased CD271 expression by the NF-kB pathway promotes melanoma cell survival and drives acquired resistance to BRAF inhibitor vemurafenib. Cell Discov. 2015;1:15030. doi:10.1038/celldisc.2015.30
70. Redmer T, Walz I, Klinger B, et al. The role of the cancer stem cell marker CD271 in DNA damage response and drug resistance of melanoma cells. Oncogenesis. 2017;6(1):e291. doi:10.1038/oncsis.2016.88
71. Warters RL, Adamson PJ, Pond CD, Leachman SA. Melanoma cells express elevated levels of phosphorylated histone H2AX foci. J Invest Dermatol. 2005;124(4):807–817. doi:10.1111/j.0022-202X.2005.23674.x
72. McManus KJ, Hendzel MJ. ATM-dependent DNA damage-independent mitotic phosphorylation of H2AX in normally growing mammalian cells. Mol Biol Cell. 2005;16(10):5013–5025. doi:10.1091/mbc.e05-01-0065
73. An J, Huang YC, Xu QZ, et al. DNA-PKcs plays a dominant role in the regulation of H2AX phosphorylation in response to DNA damage and cell cycle progression. BMC Mol Biol. 2010;11:18. doi:10.1186/1471-2199-11-18
74. Robb R, Yang L, Shen C, et al. Inhibiting BRAF oncogene-mediated radioresistance effectively radiosensitizes BRAFV600E-mutant thyroid cancer cells by constraining DNA double-strand break repair. Clin Cancer Res. 2019;25(15):4749–4760. doi:10.1158/1078-0432.CCR-18-3625
75. Gopal YN, Deng W, Woodman SE, et al. Basal and treatment-induced activation of AKT mediates resistance to cell death by AZD6244 (ARRY-142886) in Braf-mutant human cutaneous melanoma cells. Cancer Res. 2010;70(21):8736–8747. doi:10.1158/0008-5472.CAN-10-0902
76. Deng W, Gopal YN, Scott A, Chen G, Woodman SE, Davies MA. Role and therapeutic potential of PI3K-mTOR signaling in de novo resistance to BRAF inhibition. Pigment Cell Melanoma Res. 2012;25(2):248–258. doi:10.1111/j.1755-148X.2011.00950.x
77. Villanueva J, Vultur A, Lee JT, et al. Acquired resistance to BRAF inhibitors mediated by a RAF kinase switch in melanoma can be overcome by cotargeting MEK and IGF-1R/PI3K. Cancer Cell. 2010;18(6):683–695. doi:10.1016/j.ccr.2010.11.023
78. Herkert B, Kauffmann A, Mollé S, et al. Maximizing the efficacy of MAPK-targeted treatment in PTENLOF/BRAFMUT melanoma through PI3K and IGF1R Inhibition. Cancer Res. 2016;76(2):390–402. doi:10.1158/0008-5472.CAN-14-3358
79. Benito-Jardón L, Díaz-Martínez M, Arellano-Sánchez N, Vaquero-Morales P, Esparís-Ogando A, Teixidó J. Resistance to MAPK inhibitors in melanoma involves activation of the IGF1R-MEK5-Erk5 Pathway. Cancer Res. 2019;79(9):2244–2256. doi:10.1158/0008-5472.CAN-18-2762
80. Al-Alwan MM, Okkenhaug K, Vanhaesebroeck B, Hayflick JS, Marshall AJ. Requirement for phosphoinositide 3-kinase p110delta signaling in B cell antigen receptor-mediated antigen presentation. J Immunol. 2007;178(4):
81. Zebedin E, Simma O, Schuster C, et al. Leukemic challenge unmasks a requirement for PI3Kdelta in NK cell-mediated tumor surveillance. Blood. 2008;112(12):
82. Dornan GL, Siempelkamp BD, Jenkins ML, Vadas O, Lucas CL, Burke JE. Conformational disruption of PI3Kδ regulation by immunodeficiency mutations in PIK3CD and PIK3R1. Proc Natl Acad Sci U S A. 2017;114(8):
83. Sawyer C, Sturge J, Bennett DC, et al. Regulation of breast cancer cell chemotaxis by the phosphoinositide 3-kinase p110delta. Cancer Res. 2003;63(7):
84. Hodis E, Watson IR, Kryukov GV, et al. A landscape of driver mutations in melanoma. Cell. 2012;150(2):251–263. doi:10.1016/j.cell.2012.06.024
85. Hayward NK, Wilmott JS, Waddell N, et al. Whole-genome landscapes of major melanoma subtypes. Nature. 2017;545(7653):175–180. doi:10.1038/nature22071
86. Kwong LN, Davies MA. Navigating the therapeutic complexity of PI3K pathway inhibition in melanoma. Clin Cancer Res. 2013;19(19):5310–5319. doi:10.1158/1078-0432.CCR-13-0142
87. Dong L, Jin L, Tseng HY, et al. Oncogenic suppression of PHLPP1 in human melanoma. Oncogene. 2014;33(39):4756–4766. doi:10.1038/onc.2013.420
88. Ye Y, Jin L, Wilmott JS, et al. PI(4,5)P2 5-phosphatase A regulates PI3K/Akt signalling and has a tumour suppressive role in human melanoma. Nat Commun. 2013;4:1508. doi:10.1038/ncomms2489
89. Baserga R. The decline and fall of the IGF-I receptor. J Cell Physiol. 2013;228(4):675–679. doi:10.1002/jcp.24217
90. Janssen JA, Varewijck AJ. IGF-IR targeted therapy: past, present and future. Front Endocrinol. 2014;5:224. doi:10.3389/fendo.2014.00224
91. Osher E, Macaulay VM. Therapeutic targeting of the IGF axis. Cells. 2019;8(8):895. doi:10.3390/cells8080895
92. Garofalo C, Manara MC, Nicoletti G, et al. Efficacy of and resistance to anti-IGF-1R therapies in Ewing’s sarcoma is dependent on insulin receptor signaling. Oncogene. 2011;30(24):2730–2740. doi:10.1038/onc.2010.640
93. Koundouros N, Poulogiannis G. Phosphoinositide 3-Kinase/Akt signaling and redox metabolism in cancer. Front Oncol. 2018;8:160. doi:10.3389/fonc.2018.00160
94. Wang L, Chen Y, Sternberg P, Cai J. Essential roles of the PI3 kinase/Akt pathway in regulating Nrf2-dependent antioxidant functions in the RPE. Invest Ophthalmol Vis Sci. 2008;49(4):
95. Chen HH, Chen YT, Huang YW, Tsai HJ, Kuo CC. 4-Ketopinoresinol, a novel naturally occurring ARE activator, induces the Nrf2/HO-1 axis and protects against oxidative stress-induced cell injury via activation of PI3K/AKT signaling. Free Radic Biol Med. 2012;52(6):
96. Li L, Dong H, Song E, Xu X, Liu L, Song Y. Nrf2/ARE pathway activation, HO-1 and NQO1 induction by polychlorinated biphenyl quinone is associated with reactive oxygen species and PI3K/AKT signaling. Chem Biol Interact. 2014;209:
97. Khamari R, Trinh A, Gabert PE, et al. Glucose metabolism and NRF2 coordinate the antioxidant response in melanoma resistant to MAPK inhibitors. Cell Death Dis. 2018;9(3):325. doi:10.1038/s41419-018-0340-4
98. Wang L, Leite de Oliveira R, Huijberts S, et al. An acquired vulnerability of drug-resistant melanoma with therapeutic potential. Cell. 2018;173(6):
99. Yuan L, Mishra R, Patel H, et al. Utilization of reactive oxygen species targeted therapy to prolong the efficacy of BRAF inhibitors in melanoma. J Cancer. 2018;9(24):
100. Gopal YN, Rizos H, Chen G, et al. Inhibition of mTORC1/2 overcomes resistance to MAPK pathway inhibitors mediated by PGC1α and oxidative phosphorylation in melanoma. Cancer Res. 2014;74(23):
101. Iqbal MA, Siddiqui FA, Gupta V, et al. Insulin enhances metabolic capacities of cancer cells by dual regulation of glycolytic enzyme pyruvate kinase M2. Mol Cancer. 2013;12:72. doi:10.1186/1476-4598-12-72
102. Wagle A, Jivraj S, Garlock GL, Stapleton SR. Insulin regulation of glucose-6-phosphate dehydrogenase gene expression is rapamycin-sensitive and requires phosphatidylinositol 3-kinase. J Biol Chem. 1998;273(24):
103. Jin L, Zhou Y. Crucial role of the pentose phosphate pathway in malignant tumors. Oncol Lett. 2019;17(5):
104. Lo M, Wang YZ, Gout PW. The x(c)- cystine/glutamate antiporter: a potential target for therapy of cancer and other diseases. J Cell Physiol. 2008;215(3):
105. Yang Y, Yee D. IGF-I regulates redox status in breast cancer cells by activating the amino acid transport molecule xC-. Cancer Res. 2014;74(8):
106. Lim JKM, Delaidelli A, Minaker SW, et al. Cystine/glutamate antiporter xCT (SLC7A11) facilitates oncogenic RAS transformation by preserving intracellular redox balance. Proc Natl Acad Sci U S A. 2019;116(19):
107. Traverso N, Ricciarelli R, Nitti M, et al. Role of glutathione in cancer progression and chemoresistance. Oxid Med Cell Longev. 2013;2013:972913. doi:10.1155/2013/972913
108. Ghoshal N, Sharma S, Banerjee A, Kurkalang S, Raghavan SC, Chatterjee A. Influence of reduced glutathione on end-joining of DNA double-strand breaks: cytogenetical and molecular approach. Mutat Res. 2017;795:
109. Estrela JM, Ortega A, Obrador E. Glutathione in cancer biology and therapy. Crit Rev Clin Lab Sci. 2006;43(2):143–181. doi:10.1080/10408360500523878
110. Maertens O, Kuzmickas R, Manchester HE, et al. MAPK pathway suppression unmasks latent DNA repair defects and confers a chemical synthetic vulnerability in BRAF-, NRAS-, and NF1-mutant melanomas. Cancer Discov. 2019;9(4):
111. Hopkins BD, Pauli C, Du X, et al. Suppression of insulin feedback enhances the efficacy of PI3K inhibitors. Nature. 2018;560(7719):
112. Lv M, Zhu X, Wang H, Wang F, Guan W. Roles of caloric restriction, ketogenic diet and intermittent fasting during initiation, progression and metastasis of cancer in animal models: a systematic review and meta-analysis. PLoS One. 2014;9(12):e115147. doi:10.1371/journal.pone.0115147
113. Allen BG, Bhatia SK, Anderson CM, et al. Ketogenic diets as an adjuvant cancer therapy: history and potential mechanism. Redox Biol. 2014;2:
114. Paddock MN, Field SJ, Cantley LC. Treating cancer with phosphatidylinositol-3-kinase inhibitors: increasing efficacy and overcoming resistance. J Lipid Res. 2019;60(4):
 © 2020 The Author(s). This work is published and licensed by Dove Medical Press Limited. The full terms of this license are available at https://www.dovepress.com/terms.php and incorporate the Creative Commons Attribution - Non Commercial (unported, v3.0) License.
By accessing the work you hereby accept the Terms. Non-commercial uses of the work are permitted without any further permission from Dove Medical Press Limited, provided the work is properly attributed. For permission for commercial use of this work, please see paragraphs 4.2 and 5 of our Terms.
© 2020 The Author(s). This work is published and licensed by Dove Medical Press Limited. The full terms of this license are available at https://www.dovepress.com/terms.php and incorporate the Creative Commons Attribution - Non Commercial (unported, v3.0) License.
By accessing the work you hereby accept the Terms. Non-commercial uses of the work are permitted without any further permission from Dove Medical Press Limited, provided the work is properly attributed. For permission for commercial use of this work, please see paragraphs 4.2 and 5 of our Terms.