")
Back to Journals » OncoTargets and Therapy » Volume 12
Insulin-like growth factor II mRNA-binding protein 3 promotes cell proliferation, migration and invasion in human glioblastoma
Authors Wu C, Ma H, Qi G, Chen F, Chu J
Received 9 January 2019
Accepted for publication 19 March 2019
Published 15 May 2019 Volume 2019:12 Pages 3661—3670
DOI https://doi.org/10.2147/OTT.S200901
Checked for plagiarism Yes
Review by Single anonymous peer review
Peer reviewer comments 2
Editor who approved publication: Professor Gaetano Romano
Chao Wu, Hongxin Ma, Guijun Qi, Fanyu Chen, Jiancheng Chu
Department of Neurosurgery, Tengzhou Central People’s Hospital, Tengzhou, Shandong 277500, People’s Republic of China
Background/Aims: Recently, the insulin-like growth factor mRNA-binding protein 3 (IMP3) has been reported to be involved in tumorigenesis. We aimed to study the expression and role of IMP3 in human glioblastoma.
Methods: We analyzed the expression of IMP3 in 70 cases of glioma tissues, normal brain tissues and 5 kinds of cell lines using western blot. Immunohistochemistry (IHC) was used to evaluate the expression and distribution of IMP3 in glioma tissues. Colony formation, wound healing, migration and invasion assays and tumorigenesis in nude mice were used to explore the function of IMP3 in vitro and in vivo. The epithelial-mesenchymal transition (EMT)-related biomarkers were detected by western blot.
Results: We found that the expression level of IMP3 was obviously higher in glioma tissues than that in normal brain tissues, and associated with glioma grade. In-vitro assays revealed that IMP3 overexpression significantly induced cell proliferation, migration, and invasion. Mechanically, IMP3 over-expression downregulated the expression of E-cadherin, but upregulated the expressions of N-cadherin, vimentin, snail, slug and MMP9. However, the inhibition of IMP3 impaired these oncogenic effects. In vivo assay also demonstrated that silencing of IMP3 inhibited tumor growth and improved survival of tumor-bearing xenograft nude mice.
Conclusion: IMP3 can promote cell proliferation, migration and invasion by inducing EMT in glioblastoma. Thus, targeting IMP3 pathway may be a novel way to treat patients with glioblastoma.
Keywords: IMP3, proliferation, migration, invasion, glioblastoma
Introduction
Glioblastomas multiforme (GBM) or grade IV astrocytomas are the most common common and aggressive type of primary brain tumors due to highly infiltrative features.1 World Health Organization (WHO) divided all gliomas into grades I-IV through histopathologic evaluation, among which GBM (grade IV) is the most aggressive and malignant.2,3 GBM treatment mainly consists of surgical resection, as well as radio and/or chemotherapy. However, only 15%–20% of patients survive 5 years after diagnosis, and no other therapies have demonstrated a robust survival benefit in recurrent disease.4,5 Therefore, it is critical to investigate the molecular mechanisms underlying the development and progression of GBM.
The insulin-like growth factor mRNA-binding protein 3 (IMP3) is a member of an evolutionarily conserved mRNA-binding protein family, which modulates transport and translation of mRNAs.6 As reported, IMP3 expression primarily occurs in the early stages of embryogenesis7 and contributes to cell growth, migration and invasion. In recent decades, emerging evidence suggests that IMP3 serves as an oncogenic protein and promotes invasive potentials of cancer cells.8 IMP3 expression was found to be increased in different malignancies, such as ovarian cancer, lung cancer and gastrointestinal cancers.9,10 However, the expression and role of IMP3 in patients with gliomas is unclear.
In this study, we detected the expression of IMP3 in glioma tissues and cell lines, and investigated whether IMP3 was involved in the tumorigenesis of GBM. And then we used in-vivo and in-vitro assays to identify the involvement of IMP3 in the progression of GBM. Finally, we demonstrated that IMP3 can induce EMT and tumor growth in GBM.
Material and methods
Tissues samples
Our study received the approval of Ethics Committee of the Tengzhou Central People’s Hospital. The normal tissues were provided by individuals who did not have cancer but had suffered a traumatic brain injury and undergone subsequent surgical resection. 70 cases of paraffin-embedded tissues were collected from Department of Neurosurgery, Tengzhou Central People’s Hospital (Tengzhou, Shandong, China) between June 2011 and June 2016. All tissue samples were immediately snap-frozen, and stored in liquid nitrogen until further use. None of patients had received chemotherapy, immunotherapy or radiotherapy prior to the surgery. All patients provided written informed consent, and that this was conducted in accordance with the Declaration of Helsinki.
IHC
Immunohistochemical analysis was performed by using an EliVision™ Plus Kit (KIT-9902; Boster Biological Technology, Pleasanton, CA, USA). Glioma or normal tissues were cryo-sectioned at 8 µm thickness. Sodium citrate buffer (pH 6.0) was used for antigen retrieval. Slides were incubated with 3% H2O2 to clear endogenous peroxidase. Then the sections were blocked for 1 h at room temperature and incubated with primary antibodies. 3,3′-diaminobenzidine tetrahydrochloride developer was used for slide development. After doubled staining with hematoxylin, dehydration with gradient ethanol, and mounting with neutral resins, tissue sections were observed under a microscope.
Tissue sections stained by IHC were analyzed by two pathologists blinded to the clinical parameters. Under a microscope (original magnification: 400×, 100×), 10 viewing fields were randomly chosen. The staining was scored as “0” (no staining), “1” (weakly positive), “2” (moderately positive), and “3” (strongly positive). The percentage of positively stained cells was scored as: 0=0%, 1=1%–25%, 2=26%–50%, 3=51%–75%, and 4=76%–100%. The best predictive cutoff value of IMP3 expression was determined to be 6 analyzed by X-tile software. The score ≥ 6 was defined as high IMP3 expression, otherwise was defined as low IMP3 expression.
Cell culture
Neuroglioma cell lines U373, U251, LN-18, U87 and SHG-44 and the normal astrocyte cell line NHA were purchased from iCell Bioscience Inc. (Shanghai, China). Cells were cultured following the manufacturer’s protocols. In brief, the cells were grown in Roswell Park Memorial Institute (RPMI)-1640 (Hyclone, Pittsburgh, PA, USA) supplemented with 10% (v/v) FBS. All cells were cultured at 37 °C in a humidified incubator under 5% CO2.
Cell transfection
The downregulation of IMP3 in cells was performed using small-interfering RNAs (siRNAs). The upregulation of IMP3 was performed using pcDNA3.1-IMP3 overexpression plasmid. The si-IMP3, si-control, pcDNA3.1-IMP3 plasmid, and control plasmid were designed and synthesized at Thermo Fisher. The scramble siRNA was used: 5′-CCUACGCCACCAAUUUCGU-3′. The siRNAs and plasmids were transfected to cells using Lipofectamine 2000 (Invitrogen, Carlsbad, CA, USA) according to the manufacturer’s instructions. G418 screened stable transfected cell lines and expanded them. Indicated cells were harvested after 72 h of transfection and analyzed as indicated. Quantitative real-time PCR (qRT-PCR) and western blot was used to identify the expression of IMP3.
qRT-PCR
Total RNA from the transfected cells was extracted using TransZol Up (Transgen Biotech, Beijing, China) according to the manufacturer’s recommendation. cDNA was synthesized from 2 μg of total RNA using SuperScript™ IV First-Strand Synthesis System (cat. no. 18091050; Thermo Fisher Scientific) following the manufacturer’s protocols. Then cDNA was used to perform qRT-PCR on the StepOne Plus PCR system with TransStart Green qPCR SuperMix (Transgen Biotech). GAPDH served as an internal reference. The 2-ΔΔCt method was used to quantify the relative expression level of transcripts. The following primers were used in this study: IMP3, forward 5ʹ- TCCAGAGTTTATCAAGTGCTG-3ʹ and reverse 5ʹ-CTTCCCTTAGGTTATCCATG-3ʹ; and GAPDH, forward 5ʹ-GAGTCAACGGATTTGGTCGT-3ʹ and reverse 5ʹ-GATCTCGCTCCTGGAAGATG-3ʹ.
Western blot
Total proteins were extracted using RIPA buffer (Beyotime, Shanghai, China) and quantified using a BCA protein assay kit (Pierce). Equal amounts of proteins (50 g) were separated on a 10% sodium dodecyl sulfate-polyacrylamide gel and transferred to polyvinylidene fluoride membranes (PVDF, Millipore, Bedford, MA, USA). Then, the membranes were blocked with 5% nonfat milk in PBS-Tween-20 for 1 h and incubated with primary antibodies against IMP3 (1: 500, ab176685, Abcam, Cambridge, MA, USA) or GAPDH (1: 500, #2118, Cell Signaling Technology, Beverly, MA, USA) at 4 °C overnight. Next, the membranes were incubated with horseradish peroxidase (HRP)-conjugated secondary antibody (1: 500, #7074, Cell Signaling Technology, Beverly, MA, USA) at room temperature for 2 h. The protein signals were visualized using an enhanced chemiluminescence (ECL) detection reagent (Pierce, Rockford, IL, USA).
MTT assay
Exponentially growing cells were trypsinized and seeded into 96-well plates at 2×10³ cells/well. Cells were respectively incubated for 6, 12, 24, and 48 hrs. Following the operation manual, 20 µL MTT reagent was added into the cell culture medium, and cells were incubated for another 4 hrs at 37 °C. Then the formazan was solubilized with 150 µL dimethyl sulfoxide. The absorbance value was measured at 490 nm by a microplate reader. The experiment was repeated three times.
Colony formation assays
Cells were seeded into 6-well plates at adensity of 1000 cells/mL, 2 mL/well. The cells were incubated in the aforementioned conditions for 14 days and washed with PBS, then stained with 0.1% crystal violet for 30 min at 37 °C. Images of the colonies were captured by Quantity One (Bio-Rad Laboratories, Inc., Hercules, CA, USA).
Wound-healing assay
Cell migration was evaluated by wound-healing assays performed 24 hrs after transfection. Cells were seeded at 1×10⁶ cells per well into six well plate. Cells were washed with serum free media and treated with mitomycin C (10 µg/ml for 30 min). After incubation, cells were again washed thrice with serum free media. Scratch was made by 200 µl micro tip; then cell debris was removed, and cells continued to be cultured with serum-free RPMI-1640 medium for 24 h. Cells migrating into wound areas were visualized and photographed. All experiments were repeated at least three times.
Transwell invasion assay
For the transwell assay, transwell chambers with 8-μm porous membranes (Corning, NY, USA) were used. A total of 5 × 10⁴ transfected cells were added with 200 μL serum-free medium to the upper chambers, the membranes of which were pre-coated with Matrigel (BD Bioscience, San Jose, CA, USA) for invasion assays. GBM cells were seeded on the RPMI 1640 medium and the invading cells in the lower chamber were stained by 0.1% crystal violet. The cells were observed under the phase contrast microscope (×200) (Nikon). Cell counts were completed with at least five random visual fields conducted per membrane under a light microscope. The assays were performed in triplicate.
In vivo tumor xenograft assays
All animal procedures were performed in accordance with the Care and Use of Laboratory Animals and protocols approved by the Animal Care Committee of Tengzhou Central People’s Hospital. We constructed IMP3 over-expression vector (pCDH-EF1-IMP3-copGFP) and IMP3 silencing vector (pGPU6/GFP/Neo IMP3 siRNA), and co-transfected with recombinant lentivirus vectors into U87 cells using Lipofectamine 2000 (Invitrogen, Carlsbad, CA, USA). Twenty nude mice were selected and randomly divided into four groups with 5 mice in each group. 2×10⁶ cells were separately subcutaneously inoculated into the left and right flank in the dorsal of the nude mice for in vivo xenograft assay. Tumor growth after subcutaneous injection was monitored every 3 days for 21 days, and tumor size was measured by a digital caliper. Tumor volume was calculated as follows: Volume (mm3) = 0.52 × (short axis [mm])2 × long axis (mm). The growth curves were constructed accordingly. After 21 days of treatment, tumor xenografts were excised and weighed to assess tumor weight. For survival analysis, 40 nude mice were selected and randomly divided into four groups with 10 mice in each group. Intracranial injection of cells (100 000–150 000 cells per animal) were performed as described previously using stereotactic frame.11 Peri-operative care included approved anesthesia and analgesia. Survival duration was determined as follows: Survival rate: 100%×(number of survivors)/(number of challenged mice) and the data was analyzed by Kaplan-Meier curve using GraphPad 5.0. software (GraphPad software, Inc., La Jolla, CA, USA).
Statistical analysis
Statistical analyses between groups were calculated by Student’s t-test and one-way ANOVA. P< 0.05 was considered statistically significant. Statistical analyses were conducted using SPSS 17.0 (SPSS, Inc., Chicago, IL, USA) and GraphPad Prism 5.0 (GraphPad software, San Diego, CA. USA). All data were presented as the mean ± standard deviation (SD).
Results
IMP3 is highly expressed in glioma tissues and cells
To figure out the relationship between IMP3 and GBM, the expression level of IMP3 in 70 cases of patients with GBM was analyzed by IHC. We found that IMP3 immunostaining can be observed in glioma cells (Figure 1A). As shown in Table 1, the expression score of IMP3 in patients with high grade III-IV glioma was significantly higher compared with that in patients with low grade I–II or normal brain tissues (P<0.01; Figure 1A). Further, we testified the expression of IMP3 using western blot, and found that the expression of IMP3 in glioma tissues was obviously higher than that in normal brain tissues (P<0.001) (Figure 1B). Afterwards, we performed western blot to analyze the expression level of IMP3 protein in cell lines U251, U87, U373, SHG-44, LN-18 and normal NHA. Our findings revealed that the expression of IMP3 was obviously up-regulated in all GBM cell lines compared with the normal NHA cells (Figure 1C). It should be noted that U87 and U251 cells showed the highest IMP3 expression. Thus, U87 and U251 cells were selected for further studies.
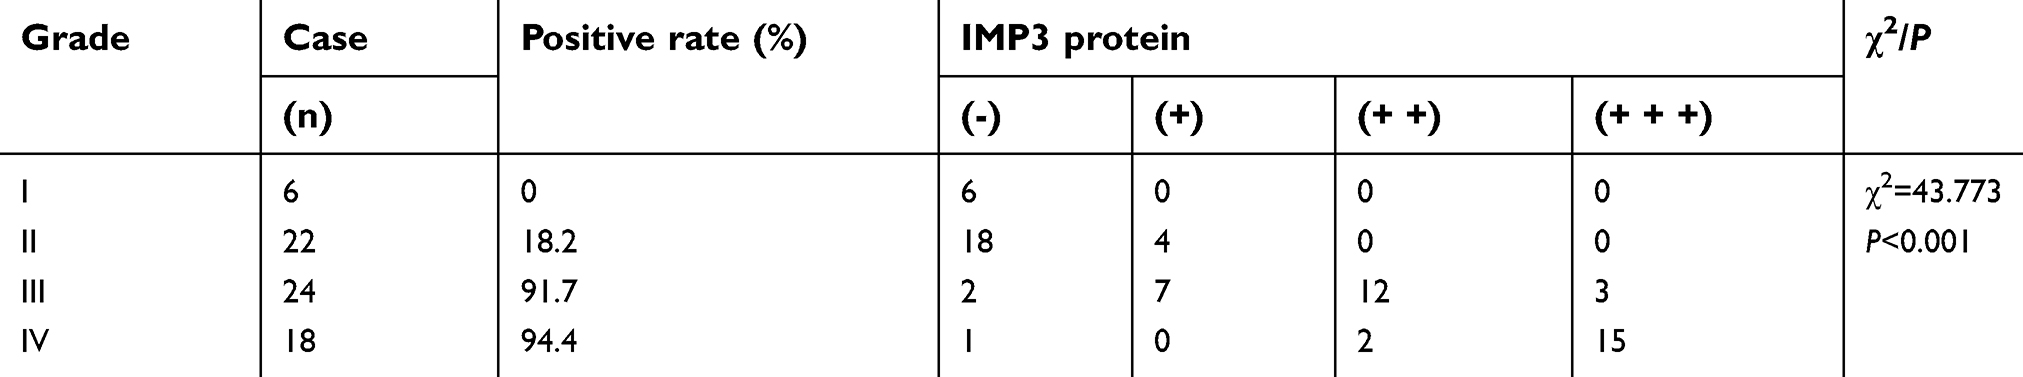 | Table 1 The expression of IMP3 in gliomas with different grades |
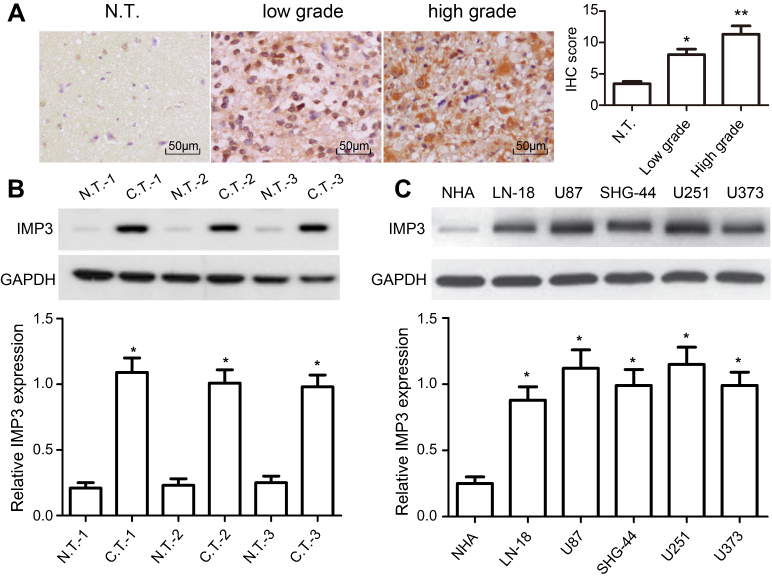 | Figure 1 IMP3 expression in glioma tissues and cells. (A) Representative IHC images showed IMP3 expression was decreased in normal brain tissues compared with primary glioma samples; original magnification: 400×. Western blot was performed to measure the expression of IMP3 protein in representative glioma tissues, and normal brain tissues (B), normal NHA cell, LN-18, U87, SHG-44, U251, and U373 cells (C). The expression levels of IMP3 proteins were normalized to GAPDH in each sample. Data are presented as mean ± SD of at least three independent experiments or 3 cases of representative samples. *P<0.01 vs N.T. or NHA;**P<0.01 vs low grade; “N.T.”=normal tissues; “C.T.”=cancer tissues. |
Ectopic expression of IMP3 promotes tumourigenic properties
We used U87 and U251 cell lines to investigate the effect of over-expression of IMP3 on GBM. IMP3 plasmids were transfected into U87 and U251 cells, and then the over-expression of IMP3 protein was identified by western blot (Figure 2A). MTT assay revealed that over-expression of IMP3 caused a significant increase in cell proliferation of U87 and U251 cells (P<0.01, Figure 2B). As expected, the colony formation assay confirmed that the over-expression of IMP3 protein significantly elevated the number of cell colonies and clonogenicity of U87 and U251 cells compared with vector control (P<0.01, Figure 2C). Further, we used nude mice model to explore the effect of IMP3 on the growth of U87 cells. Following post-inoculation 21 days, we found that the mean volume of tumor mass with IMP3 plasmids was approximately 2-fold larger than that control. The tumor growth curves revealed that compared with U87-control group, U87-IMP3 cells had an obvious increase in tumor growth rate in the xenograft model (P<0.01; Figure 2D). In addition, after 21 days of treatment, we found the average tumor weight in the U87-IMP3 group was obviously increased than that in the control group (P<0.01; Figure 2E).
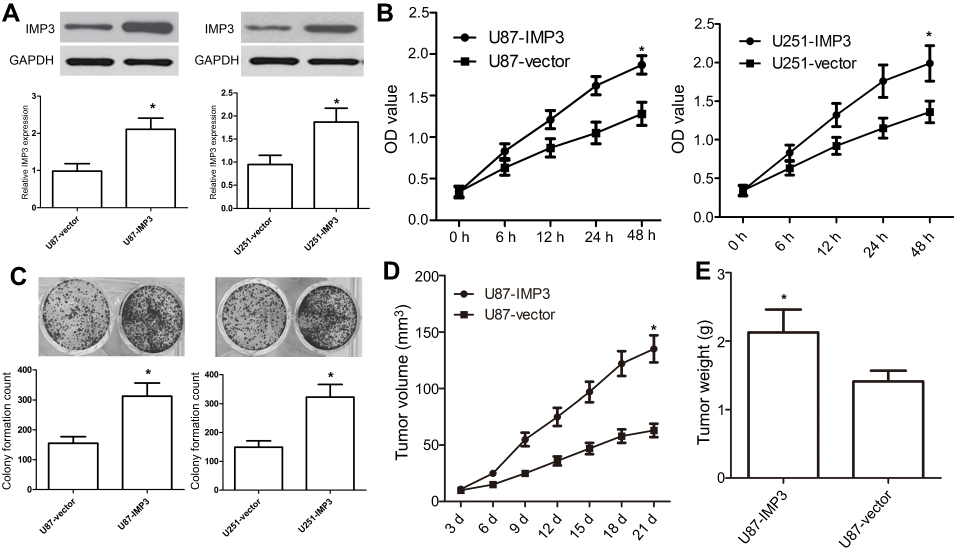 | Figure 2 Ectopic expression of IMP3 promotes tumourigenic properties. (A) IMP3 plasmids or vector control were transfected into U87 and U251 cell lines to overexpress IMP3, and then IMP3 expression was confirmed by western blot. (B) Cell proliferation was determined in U87 and U251 cells by MTT assay. (C) Colony formation assay was used to determine the proliferation capacity of U87 and U251 cells. (D and E) We used 10 nude mice (5 for each group) to investigate the role of IMP3 over-expression in the growth of U87 cells. Following post-inoculation 21 days, we measured the mean volume and weight of xenograft tumors. The data were represented by mean ± SD.*P<0.01, vs their respective controls. |
Inhibition of IMP3 expression affects tumourigenic properties
To further investigate the role of IMP3 in the proliferation of GBM, we used IMP3 siRNAs to silence the expression of IMP3 protein, which was validated by western blot (Figure 3A). MTT assay exhibited that inhibition of IMP3 in U87 cells inhibited cell proliferation (P<0.01, Figure 3B). The colony formation assay showed si-IMP3-infected cells had fewer cell colonies than si-control (P<0.01, Figure 3C). In-vivo assay demonstrated that U87-si-IMP3 exhibited significantly decreased tumor growth rate and tumor weight in the xenograft model compared with U87-control group (Figure 3D and E). Overall, these findings suggested that IMP3 exhibited obvious tumorigenic effects in GBM cells.
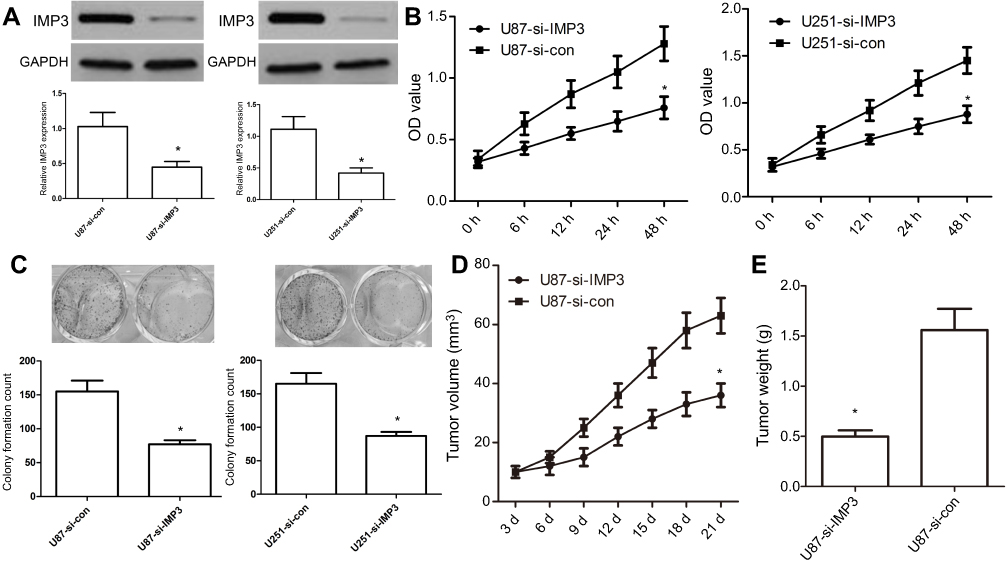 | Figure 3 Inhibition of IMP3 expression affects tumourigenic properties. (A) IMP3 siRNA or si-control were transfected into U87 and U251 cell lines to inhibit IMP3 expression, and then IMP3 expression was confirmed by western blot. (B) Cell proliferation was determined in U87 and U251 cells by MTT assay. (C) Colony formation assay was used to determine the proliferation capacity of U87 and U251 cells. Upper: images of colony formation assay (200× magnification); Lower: quantification data. (D and E) We used 10 nude mice (5 for each group) to investigate the role of si-IMP3 in the growth of U87 cells. Tumor volumes were measured with calipers every 3 days. Following post-inoculation 21 days, we measured the mean volume and weight of xenograft tumors. The data were represented by mean ± SD.*P<0.01, vs their respective controls. |
IMP3 silencing increases survival rates in tumor-bearing xenograft nude mice
In order to further define the potential efficacy of IMP3, a lentiviral vector of IMP3 siRNA was used to evaluate its role in the survival of nude mice containing U87 cells with IMP3 over-expression or IMP3 silencing. We found that the survival rate of nude mice with IMP3 silencing was significantly increased, as compared with the si-control group (χ2=11.49, P=0.009; Figure 4A). However, the survival rate of nude mice with IMP3 overexpression was significantly lower that than with vector control (χ2=4.870, P=0.027; Figure 4A). Therefore, these results further demonstrated that IMP3 silencing increased survival rates in tumor-bearing xenograft nude mice, and suggested that knockdown of IMP3 expression significantly inhibited the proliferation of U87 cells in vivo.
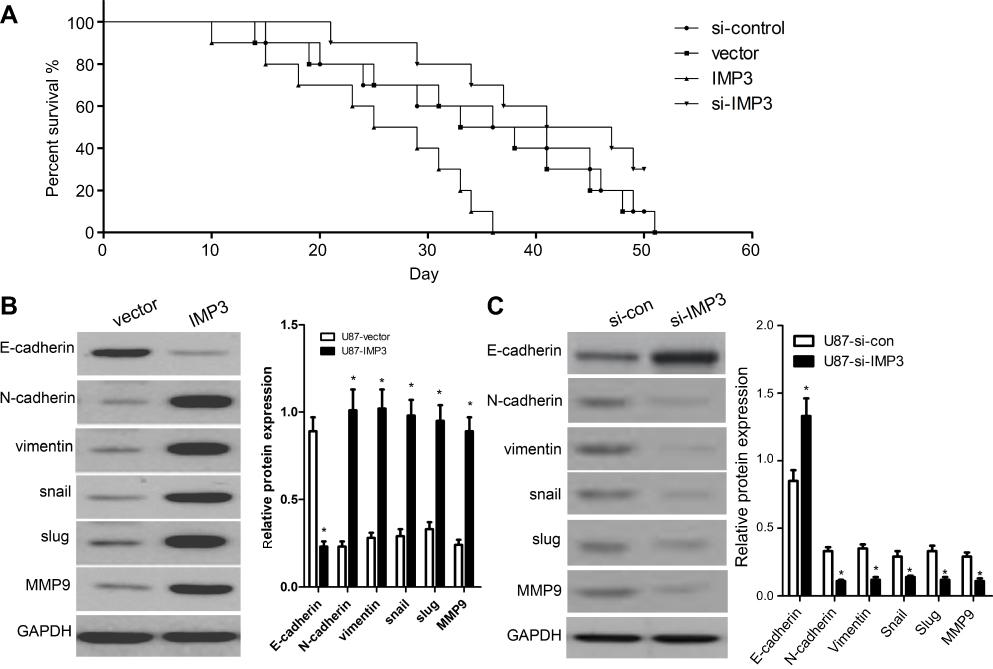 | Figure 4 IMP3 affects the survival of nude mice and EMT biomarkers in U87 cells. (A) The survival rates of nude mice containing U87 cells with IMP3 over-expression or IMP3 silencing were determined as follows: 100%×(number of survivors)/(number of challenged mice). (B) Western blot analysis was used to assess the levels of E-cadherin, N-cadherin, vimentin, snail, slug and MMP9 in U87 cells with over-expression of IMP3. (C) Western blot analysis was used to assess the levels of E-cadherin, N-cadherin, vimentin, snail, slug and MMP9 in U87 cells with IMP3 siRNAs. Data are presented as Mean ± SD of at least three independent experiments or 3 cases of representative samples. *P<0.01 vs their respective controls. |
IMP3 induces EMT
In this work, we used western blot to detect the expressions of EMT biomarkers induced by IMP3 over-expression in U87 and U251 cells. We found that the expression level of E-cadherin was markedly reduced in U87-IMP3 cells compared with control cells. The expressions of N-cadherin, vimentin, snail, slug and MMP9 were also increased by IMP3 over-expression in U87 cells (Figure 4B). Consistent with U87-IMP3 cells, U251-IMP3 cells also exhibited the same changes (data not shown). All these changes in biomarkers suggested a transition of epithelial cells to mesenchymal cells. Then, we knocked down IMP3 to investigate whether IMP3 inhibition could reverse these changes of EMT biomarkers. As shown in Figure 4C, western blot revealed that the expression level of E-cadherin was upregulated, while the expressions of N-cadherin, vimentin, snail, slug and MMP9 were downregulated by silencing of IMP3 compared with si-control. Consistent with U87-si-IMP3 cells, U251-si-IMP3 cells also exhibited the same changes (data not shown). These results indicated IMP3 had an important role in induction of EMT.
IMP3 promotes the migration and invasion of U87 and U251 cells
Firstly, the wound healing assay revealed that U87-IMP3 or U251-IMP3 cells exhibited 1-fold faster wound-healing ability than control (P<0.01, Figure 5A). However, U87-si-IMP3 or U251-si-IMP3 has a slower ability in the migration than their controls (P<0.01, Figure 5B). Secondly, we conducted Matrigel invasion assays to analyze the invasion ability, and found that more U87-IMP3 or U251-IMP3 cells invaded into lower chambers through Matrigel compared with their respective controls (P<0.01, Figure 5C). By contrast, U87-si-IMP3 or U251-si-IMP3 cells showed less invasion number through Matrigel than their respective controls (P<0.01, Figure 5D). Overall, our findings suggested that IMP3 promoted the migration and invasion of U87 and U251 cells.
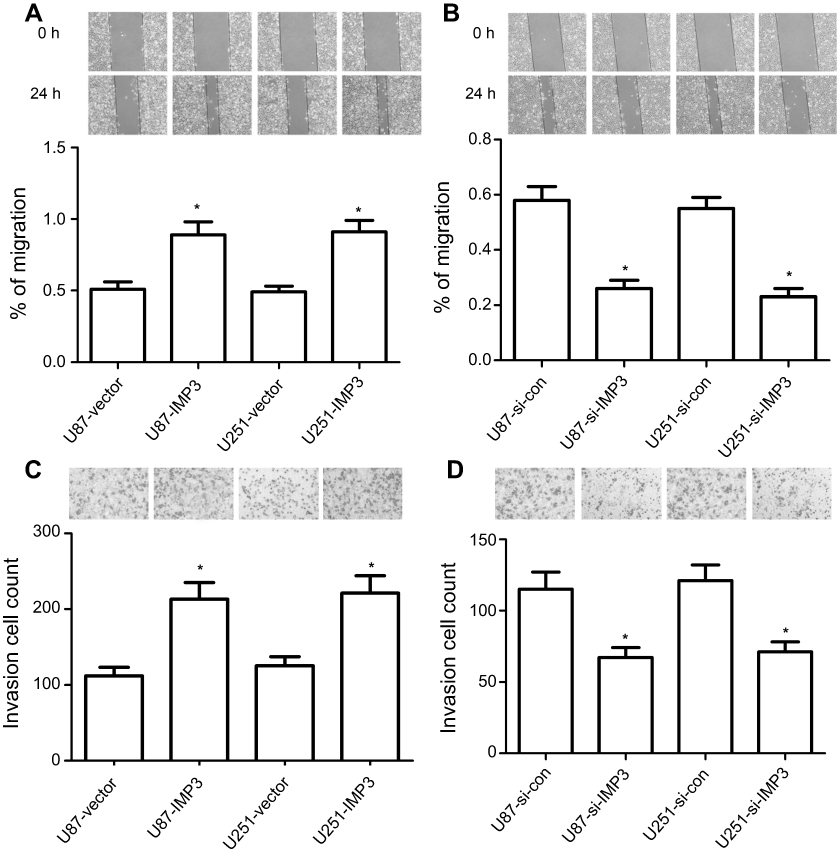 | Figure 5 IMP3 expression promotes migration and invasion in vitro. Mitomycin C pretreated (10 µg/ml for 30 min) U87 (A) and U251 cells (B) were incubated with serum scarce media for 24 h, scratch was made and multiple images were collected in different time interval. Cell invasion assay was determined in U87 and U251 cells (C and D) by Transwell assay. All cells were transfected with IMP3 plasmids, IMP3 siRNAs, or their controls. The data were represented by mean ± SD. *P<0.01, vs their respective control. |
Discussion
IMP3, also called IGF2BP3, is a member of the insulin-like growth factor II mRNA-binding proteins.12 In recent years, IMP3 has been found in most of cancer tissues and human embryogenesis, but rarely observed in normal human tissues. Functionally, IMP3 is involved in regulating mRNA stability and localization, and enhances cancer cell proliferation, migration and invasion. Several studies showed that IMP1 and IMP3 may function collaboratively and were the prognostic markers of various types of cancer including breast, ovarian, melanoma and colon cancers.13–15 However, to date, little information has been reported about the expression and role of IMP3 in GBM. In the present study, we found that high IMP3 expression was significantly correlated with high grade of glioma patients, and validated its high expression in glioma cells. Consistent with our data, Del Gobbo A et al suggested that IMP3 staining could identify a subgroup of patients with poor prognosis and at risk of recurrence in high-grade gliomas, indicating that IMP3 may act as a novel grading tool and predictor of poor clinical outcome in human gliomas.16
In previous studies, IMP3 expression predicted a propensity for metastasis in renal-cell carcinoma patients.17 IMP3 also promotes tumor invasion and predicts early recurrence and poor prognosis in hepatocellular carcinoma.18 IMP3 is an important aggressive factor in the migration and invasion of HeLa cells.19 In the present study, in vitro and in vivo assays revealed that over-expression of IMP3 contributed to cancer cell proliferation, migration and invasion as confirmed by MTT assay, colony formation assay, wound healing and Transwell invasion assay. The IMP3-induced cancer cell growth and tumor formation were further demonstrated in subcutaneous xenograft tumor model. However, the inhibition of IMP3 impaired these oncogenic effects. In vivo assay also demonstrated that silencing of IMP3 inhibited tumor growth and improved survival of tumor-bearing xenograft nude mice.
EMT is an important step in tumor migration and invasion, and enhances glioma patient resistance to radio-/chemotherapeutic drugs. We further elucidated molecular changes induced by over-expression or knockdown of IMP3 in GBM cells. We found that over-expression of IMP3 in U87 and U251 cells resulted in decreased E-cadherin expression and increased N-cadherin, vimentin, snail, slug and MMP9 expressions. Conversely, the knockdown of IMP3 promoted the expression of E-cadherin, and down-regulated the expressions of N-cadherin, snail, slug and MMP9. These results suggested a transition of epithelial cells to mesenchymal cells. In addition, IMP3 is a crucial transcriptional regulator, which binds a couple of mRNAs and modulates their expressions.20–22 IMP-3 binds to and positively regulates the expressions of cyclins D1, D3 and G1 in a number of human cancer cell lines.20,21 IMP3 also binds avidly to SNAI2 mRNA and regulates its expression by binding to the 5‘ UTR.22 Thus, we thought that EMT biomarkers may also be transcriptionally and posttranslationally regulated by IMP3 in the tumorigenesis of GBM.
In conclusion, IMP3 was demonstrated to be frequently and highly expressed in glioma tissues, and promoted GBM cell proliferation, migration and invasion by activating EMT processes. These findings suggest that IMP3 may be a useful therapeutic target for patients with GBM in the future.
Acknowledgments
We are thankful to other members in our lab for their suggestions.
Disclosure
The authors declare that they have no conflicts of interest in this work.
References
1. Weathers SP, Han X, Liu DD, et al. A randomized phase II trial of standard dose bevacizumab versus low dose bevacizumab plus lomustine (CCNU) in adults with recurrent glioblastoma. J Neurooncol. 2016;129(3):487–494. doi:10.1007/s11060-016-2195-9
2. Wick W, Roth P, Hartmann C, et al. Long-term analysis of the NOA-04 randomized phase III trial of sequential radiochemotherapy of anaplastic glioma with PCV or temozolomide. Neuro Oncol. 2016;18(11):1529–1537. doi:10.1093/neuonc/now133
3. Salloum R, Hummel TR, Kumar SS, et al. A molecular biology and phase II study of imetelstat (GRN163L) in children with recurrent or refractory central nervous system malignancies: a pediatric brain tumor consortium study. J Neurooncol. 2016;129(3):443–451. doi:10.1007/s11060-016-2189-7
4. Wick W, Gorlia T, Bady P, et al. Phase II study of radiotherapy and temsirolimus versus radiochemotherapy with temozolomide in patients with newly diagnosed glioblastoma without MGMT promoter hypermethylation (EORTC 26082). Clin Cancer Res. 2016;22(19):4797–4806. doi:10.1158/1078-0432.CCR-15-3153
5. Jaspan T, Morgan PS, Warmuth-Metz M, et al. Implementation and expansion of the RANO criteria in a randomized phase II trial of pediatric patients with newly diagnosed high-grade gliomas. AJNR Am J Neuroradiol. 2016;37(9):1581–1587. doi:10.3174/ajnr.A4782
6. Degrauwe N, Suvà ML, Janiszewska M, Riggi N, Stamenkovic I. IMPs: an RNA-binding protein family that provides a link between stem cell maintenance in normal development and cancer. Genes Dev. 2016;30(22):2459–2474. doi:10.1101/gad.287540.116
7. Yaniv K, Yisraeli JK. The involvement of a conserved family of RNA binding proteins in embryonic development and carcinogenesis. Gene. 2002;287(1–2):49–54.
8. Gong Y, Woda BA, Jiang Z. Oncofetal protein IMP3, a new cancer biomarker. Adv Anat Pathol. 2014;21(3):191–200. doi:10.1097/PAP.0000000000000021
9. Imamura H, Ohishi Y, Aman M, et al. Ovarian high-grade serous carcinoma with a noninvasive growth pattern simulating a serous borderline tumor. Hum Pathol. 2015;46(10):1455–1463. doi:10.1016/j.humpath.2015.06.002
10. Yan J, Wei Q, Jian W, et al. IMP3 predicts invasion and prognosis in human lung adenocarcinoma. Lung. 2016;194(1):137–146. doi:10.1007/s00408-015-9829-0
11. Mikheev AM, Mikheeva SA, Trister AD, et al. Periostin is a novel therapeutic target that predicts and regulates glioma malignancy. Neuro Oncol. 2015;17(3):372–382. doi:10.1093/neuonc/nou161
12. Li D, Yan D, Tang H, et al. IMP3 is a novel prognostic marker that correlates with colon cancer progression and pathogenesis. Ann Surg Oncol. 2009;16(12):3499–3506. doi:10.1245/s10434-009-0648-5
13. Walter O, Prasad M, Lu S, et al. IMP3 is a novel biomarker for triple negative invasive mammary carcinoma associated with a more aggressive phenotype. Hum Pathol. 2009;40(11):1528–1533. doi:10.1016/j.humpath.2009.01.003
14. Kobel M, Xu H, Bourne PA, et al. IGF2BP3 (IMP3) expression is a marker of unfavorable prognosis in ovarian carcinoma of clear cell subtype. Mod Pathol. 2009;22(3):469–475. doi:10.1038/modpathol.2008.206
15. Pryor JG, Bourne PA, Yang Q, et al. IMP-3 is a novel progression marker in malignant melanoma. Mod Pathol. 2008;21(4):431–437. doi:10.1038/modpathol.3801016
16. Del Gobbo A, Vaira V, Ferrari L, et al. The oncofetal protein IMP3: a novel grading tool and predictor of poor clinical outcome in human gliomas. Biomed Res Int. 2015;2015:413897. doi:10.1155/2015/413897
17. Jiang Z, Chu PG, Woda BA, et al. Analysis of RNA-binding protein IMP3 to predict metastasis and prognosis of renal-cell carcinoma: a retrospective study. Lancet Oncol. 2006;7(7):556–564. doi:10.1016/S1470-2045(06)70732-X
18. Jeng YM, Chang CC, Hu FC, et al. RNA-binding protein insulin-like growth factor II mRNA-binding protein 3 expression promotes tumor invasion and predicts early recurrence and poor prognosis in hepatocellular carcinoma. Hepatology. 2008;48(4):1118–1127. doi:10.1002/hep.22459
19. Lu D, Yang X, Jiang NY, et al. IMP3, a new biomarker to predict progression of cervical intraepithelial neoplasia into invasive cancer. Am J Surg Pathol. 2011;35(11):1638–1645. doi:10.1097/PAS.0b013e31823272d4
20. Rivera Vargas T, Boudoukha S, Simon A, et al. Post-transcriptional regulation of cyclins D1, D3 and G1 and proliferation of human cancer cells depend on IMP-3 nuclear localization. Oncogene. 2014;33(22):2866–2875. doi:10.1038/onc.2013.252
21. Deforzh E, Vargas TR, Kropp J, Vandamme M, Pinna G, Polesskaya A. IMP-3 protects the mRNAs of cyclins D1 and D3 from GW182/AGO2-dependent translational repression. Int J Oncol. 2016;49(6):2578–2588. doi:10.3892/ijo.2016.3750
22. Samanta S, Sun H, Goel HL, et al. IMP3 promotes stem-like properties in triple-negative breast cancer by regulating SLUG. Oncogene. 2016;35(9):1111–1121. doi:10.1038/onc.2015.164
 © 2019 The Author(s). This work is published and licensed by Dove Medical Press Limited. The full terms of this license are available at https://www.dovepress.com/terms.php and incorporate the Creative Commons Attribution - Non Commercial (unported, v3.0) License.
By accessing the work you hereby accept the Terms. Non-commercial uses of the work are permitted without any further permission from Dove Medical Press Limited, provided the work is properly attributed. For permission for commercial use of this work, please see paragraphs 4.2 and 5 of our Terms.
© 2019 The Author(s). This work is published and licensed by Dove Medical Press Limited. The full terms of this license are available at https://www.dovepress.com/terms.php and incorporate the Creative Commons Attribution - Non Commercial (unported, v3.0) License.
By accessing the work you hereby accept the Terms. Non-commercial uses of the work are permitted without any further permission from Dove Medical Press Limited, provided the work is properly attributed. For permission for commercial use of this work, please see paragraphs 4.2 and 5 of our Terms.