")
Back to Journals » OncoTargets and Therapy » Volume 12
Insulin-like growth factor-1, metabolic abnormalities, and pathological complete remission rate in HER2-positive breast cancer patients receiving neoadjuvant therapy
Authors Tong YW, Wang G, Wu JY, Huang O, He JR, Zhu L, Chen WG, Li YF, Chen XS , Shen KW
Received 17 November 2018
Accepted for publication 14 April 2019
Published 21 May 2019 Volume 2019:12 Pages 3977—3989
DOI https://doi.org/10.2147/OTT.S194981
Checked for plagiarism Yes
Review by Single anonymous peer review
Peer reviewer comments 2
Editor who approved publication: Dr Jianmin Xu
Yi-Wei Tong, Gen Wang, Jia-Yi Wu, Ou Huang, Jian-Rong He, Li Zhu, Wei-Guo Chen, Ya-Fen Li, Xiao-Song Chen, Kun-Wei Shen
Comprehensive Breast Health Center, Ruijin Hospital, Shanghai Jiao Tong University School of Medicine, Shanghai, People’s Republic of China
Purpose: HER2-positive breast cancer (BC) achieving pathological complete remission (pCR) after neoadjuvant therapy (NAT) had a superior disease outcome. Dysmetabolism and stimulation of insulin-like growth factor 1 (IGF-1)-axis would increase BC risk, but we are lacking data for their association with pCR in HER2-positive+ BC. We aim to evaluate the pCR predictive value of above factors in HER2-positive BC patients receiving NAT.
Patients and methods: HER2-positive BC patients receiving NAT ± trastuzumab were retrospectively included between January 2013 and December 2016. Data were compared between baseline at biopsy and surgery. Median value of IGF-1 expression was used as cutoff value to classify patients into low or high group. pCR was defined as no residual invasive carcinoma in breast and axilla.
Results: Overall, 101 patients were included. Metabolic syndrome was diagnosed in 29 (28.71%) with an average of 1.71±1.51 metabolic disorders at baseline, significantly increased after NAT (2.12±1.54, P<0.001). Lipid metabolism factors, including triglycerides, TC, HDL-C and LDL-C significantly worsened after NAT (all P<0.05). Average post-NAT IGF-1 was 196.14±86.03 ng/mL (vs preNAT 186.41±75.03 ng/mL, P=0.182). pCR was achieved in 29 (28.71%) patients. pCR rate was 40.00% and 17.65% for those with low or high preIGF-1 level (P=0.013). Multivariate analysis found that low IGF-1 expression, but not any other metabolic variable, was significantly associated with higher pCR rate in whole population (OR: 3.83, 95%CI: 1.32–11.11, P=0.014) or in patients receiving NAT + trastuzumab (OR: 3.93, 95%CI: 1.13–13.63, P=0.031). With a median follow-up of 29.03 (range: 10.42–56.98) months, IGF-1 level was not associated with overall survival (P=0.328) or disease-free survival (P=0.288).
Conclusion: Low IGF-1 level was related with higher pCR rate in HER2-positive BC patients receiving NAT, which deserves further clinical evaluation.
Keywords: breast cancer, HER2-positive, neoadjuvant therapy, metabolic syndrome, IGF-1, pathological complete response
Introduction
Overexpression of human epidermal growth factor receptor-2 (HER2) is present in about 15–20% of breast cancers (BCs).1 HER2-positive subtype confers a worse prognosis than luminal tumors, with more aggressive biological behavior, higher tumor grade, and more lymph node positivity.2–4 Neoadjuvant therapy (NAT) was introduced as standard treatment for HER2-amplified BC.5–8 Overall, 13–50% high-Dear author, please provide the email for Shen Kun-Weirisk BC patients would have a pathological complete response (pCR) after standard NAT.9 The achievement of pCR can be viewed as a surrogate for better prognosis in BC patients.6 Regarding different BC molecular subtypes, a meta-analysis showed that only in HER2-positive subtype, high pCR rate for a specific regimen is associated with improved disease prognosis.8 Nowadays, in addition to standard NAT and HER2-targeted therapy with trastuzumab, we can also integrate with pertuzumab to increase pCR rate and add to disease outcomes.10
Previously identified predictors for pCR rate in HER2-positive population are smaller tumor size, node negativity, high histological grade, negative hormone receptor, higher Ki-67, and HER2-enrichment subtype.7,10 However, the histopathological characteristics cannot be changed during treatment. Evidence is still lacking concerning modifiable pCR impact factors, to eventually predict or even intentionally increase pCR rate in HER2-amplified cases.
Metabolic syndrome (MetS), a group of metabolic risk factors including central obesity, insulin resistance, dyslipidemia, and elevated blood pressure, has been shown to upregulate inflammatory, adipose-derived cytokines and select proteases inhibitors, leading to increased BC risk11 and BC mortality.12 Recent publications identified an impaired metabolic function in patients undergoing NAT as characterized by worsened components of MetS, anthropometric measures, and glucose profile.13 However, potential metabolic predictive factors of pCR and survival have yet to be identified, and there is still no robust suggestion of the relationship between metabolic variables and NAT efficacy.
As an essential part of cell growth and metabolism, insulin-like growth factor (IGF)-axis has been proven to be involved in oncogenesis and metastasis for various solid tumors including breast, lung, prostate, gynecological, and gastrointestinal cancers.14 About 75% of BC patients, and 87% invasive BC patients show activation of IGF signaling.15 Previous studies showed an association between high circulating IGF-1 concentration with an increased risk of BC.14,16 In addition, increased IGF signaling has been shown to support disease progression, promote development of resistance to established therapies,17 cause decreased BC specific survival18 and increased all-cause mortality19 in HER2-positive subtype. In the neoadjuvant setting, Bhargava et al concluded that low IGF-1 receptor expression is related to higher pCR rate in estrogen receptor (ER)-positive tumors.20 The predictive value of IGF-axis has not been validated in the neoadjuvant HER2-positive population.
The objectives of this study are thus to investigate the predictive value of MetS components and related anthropometric metabolic variables, including the IGF-axis, on pathological response to NAT, as well as to establish their impacts on survival in the HER2-positive BC population.
Patients and methods
Patient population
All BC patients in Comprehensive Breast Health Center, Ruijin Hospital, Shanghai Jiao Tong University School of Medicine, Shanghai, China were screened for the following eligibility criteria: (1) female gender; (2) pathological-proven BC with identified biomarker status; (3) HER2-positive disease according to the 2018 ASCO/CAP guidelines, which included immunohistochemistry HER2 3+, immunohistochemistry HER2 2+ and fluorescence in situ hybridization HER2 amplified (HER2/CEP17 ratio ≥2.0 and HER2 copy number ≥4.0, HER2/CEP17 ratio <2.0 and HER2 copy number ≥6.0); 4) planned NAT followed by definitive surgery between January 2013 and December 2016; 5) complete pre- and postNAT anthropometrics, lipid and glucose metabolism profile. Exclusion criteria included: (1) patients treated with neoadjuvant endocrine therapy; (2) de novo stage IV BC. NAT regimens, either anthracycline plus taxane (A+T) regimen or nonA+T regimen, were recommended by a multidisciplinary team meeting. Common NAT regimens included EC-T (four cycles of epirubicin 90 mg/m2 and cyclophosphamide 600 mg/m2 every 21 days followed by four cycles of docetaxcel 100 mg/m2 every 21 days), EC-wP (four cycles of epirubicin 90 mg/m2 and cyclophosphamide 600 mg/m2 every 21 days followed by 12 cycles of weekly paclitaxel 80 mg/m2), TC*4 (four cycles of docetaxel 75 mg/m2 plus cyclophosphamide 600 mg/m2 every 21 days), TC*6 (six cycles of docetaxel 75 mg/m2 plus cyclophosphamide 600 mg/m2 every 21 days) and wPCb (12 cycles of weekly paclitaxel 80 mg/m2 plus carboplatin area under the curve [AUC] 2).
This approach was approved by the independent Ethical Committees of Ruijin Hospital, Shanghai Jiao Tong University School of Medicine. All tested parameters including IGF-1 and other metabolic variables were routinely analyzed in our center since 2012. Patient informed consent for retrospective review of our database was waived since it exceeded no additional risk or additional cost to the subjects. Patient data were strictly protected for confidentiality, with all personal identifiable information carefully removed. All aspects comply with the Declaration of Helsinki guidelines.
Data collection
Patient clinical details were retrospectively obtained from Shanghai Jiao Tong University Breast Cancer Database (SJTU-BCDB), including age, menopausal status, clinical tumor size, histology, grade, node status, stage, ER status, progesterone receptor (PR) status, Ki-67, NAT regimens (A+T, or nonA+T), cycles and neoadjuvant targeted therapy.
Tumor histopathologic evaluation was performed in the Department of Pathology, Ruijin Hospital, Shanghai Jiao Tong University School of Medicine, Shanghai, China by experienced pathologists. The pCR was defined as no residual invasive carcinoma in the breast and axilla at the time of definitive surgery. The methods and positivity criteria for immunohistochemical assessment of tumor biomarkers were as described in our previous report.21
Measurements of metabolic variables were performed by trained nurses in our center on the day of biopsy as baseline. Patient peripheral hematological parameters were analyzed using XN-series blood analyzer (Sysmex,Kobe, Japan) in the Department of Clinical Laboratory, Ruijin Hospital. IGF-1 was measured by chemiluminescent immunoassay using IMMULITE 2000 system (Siemens AG, Munich, Germany). Serum insulin and C-peptide were tested by electrochemiluminescence immunoassay on Cobas E601 analyzers (Hoffman-La Roche Ltd, Basel, Switzerland). Fasting glucose and lipid profiles including triglycerides, total cholesterol (TC), high-density lipoprotein cholesterol (HDL-C), and low-density lipoprotein cholesterol (LDL-C), were collected using Beckman Coulter-AU5800 (Beckman Coulter, Inc., Atlanta, GA, USA). The same procedure would be carried out after the completion of NAT, on the day before definitive surgery as comparison.
Definition of metabolic syndrome
American Heart Association/National Heart, Lung, and Blood Institute (AHA/NHLBI) guidelines were modified according to the Chinese population, and applied to define MetS in this study, since it diagnosed 4% more people with MetS in the Chinese population compared to International Diabetes Federation definition, as shown in a previous study.22 Body mass index (BMI) was employed to evaluate central obesity with a cut-off value of no less than 25.0 kg/m2, based on the Chinese Medical Association criteria for MetS.23 The criteria for clinical diagnosis of MetS adjusted to the study population are shown in
Follow-up
Patient follow-up was conducted by specialized breast cancer nurses in our center. Overall survival (OS) was calculated from the date of the commencement of NAT to death from any cause. Disease-free survival (DFS) was computed until the first proven event including ipsilateral and local/regional recurrence, distant metastasis in any site, second primary tumor, and death from any cause. The diagnosis of disease-free events was generally based on radiographic images and/or pathologic biopsies when accessible. Last follow-up was completed in November 2017.
Statistical analysis
Means, standard deviations (SDs), and frequencies were computed using standard methods. Paired sample t-tests were applied to compare MetS components and metabolic biomarkers before and after NAT. Median values were adopted to turn numeric variables into categorical variables. Descriptive characteristics of categorical variables were tested using chi-squared test or Fisher’s exact test. OR with 95%CI were calculated from logistic regression analysis to identify impact factors for pCR. Kaplan–Meier method and Cox regression were applied for survival analysis. All statistical tests were realized using IBM SPSS statistics software version 23 (IBM Corporation, Armonk, NY, USA). Two-sided P-values <0.05 were considered statistically significant.
Results
Baseline characteristics
In all, 101 patients were included in the study. Pretreatment baseline characteristics are presented in Table 1. The mean age was 50.91±12.70 (range: 21–77) years. More than half of the study population had relatively aggressive tumors with greater tumor size (T2 62.38%, T3–4 14.85%), lymph node involvement (72.28%), grade III (55.45%) and Ki-67 ≥20% (86.14%) at diagnosis. The majority (91.09%) had a histology of invasive ductal carcinoma. Luminal-B HER2-positive, hormone receptor negative HER2-amplified diseases were found in 34.65% and 65.35% cases, respectively.
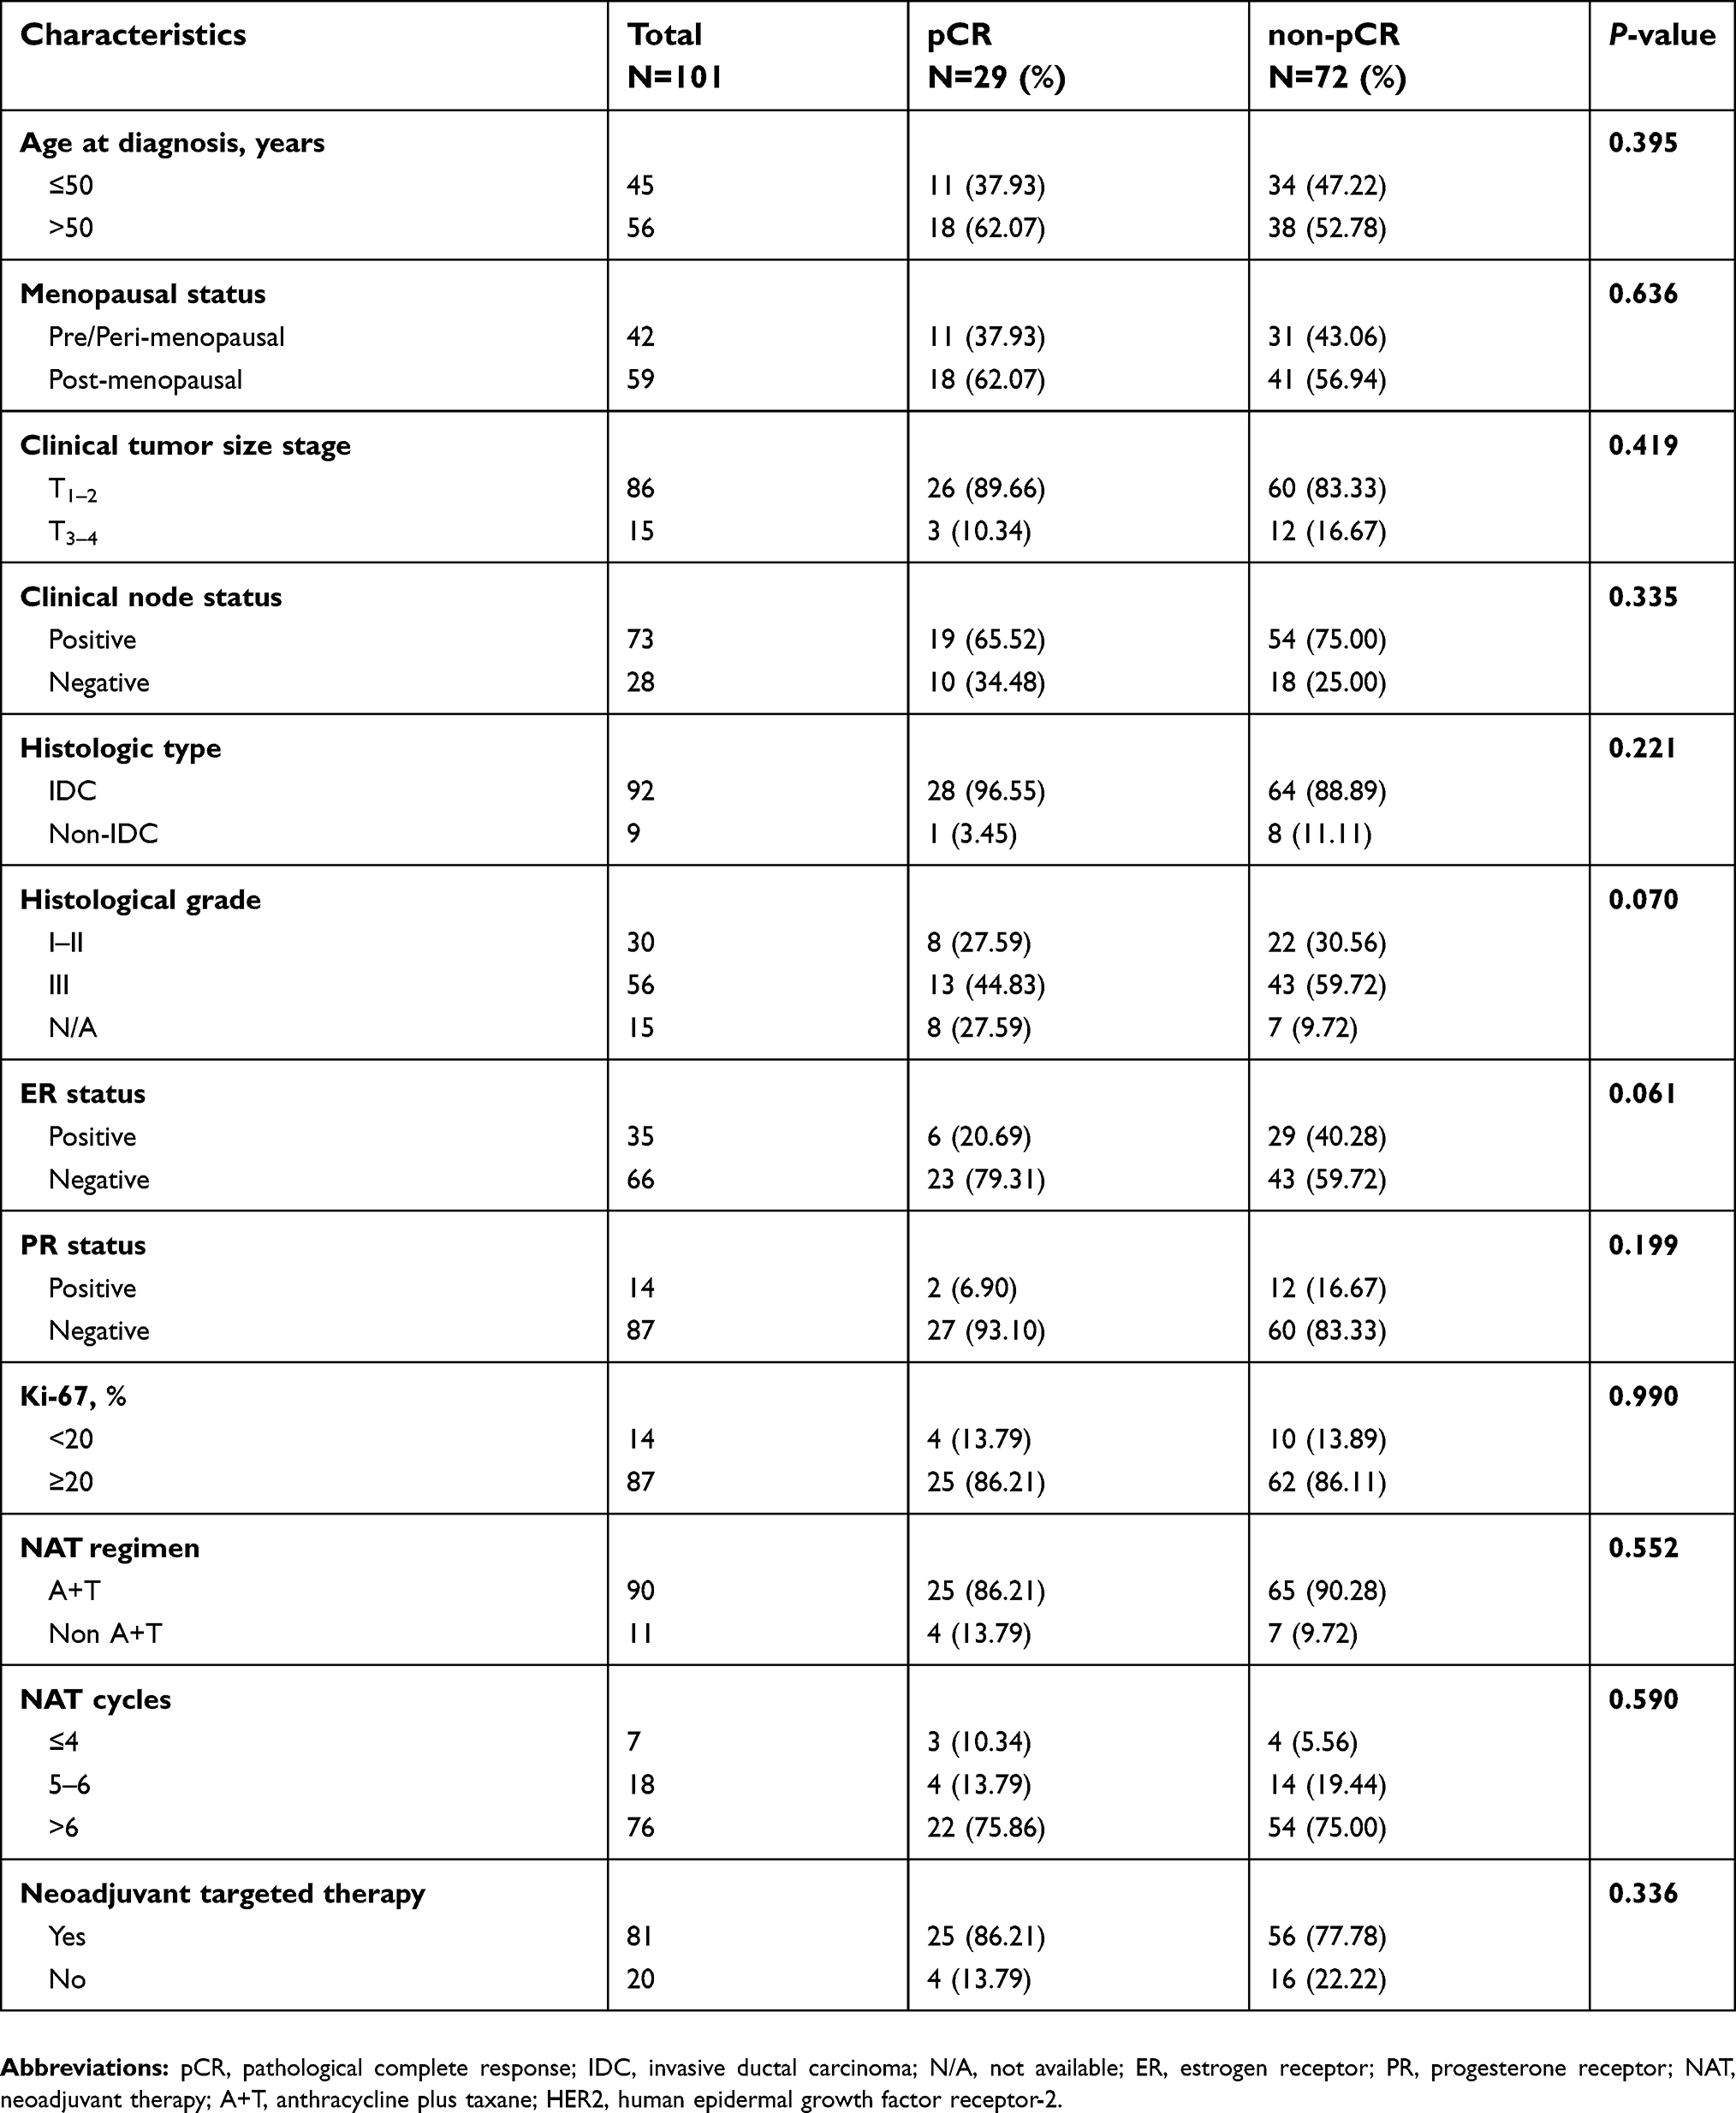 | Table 1 Baseline clinical characteristics and relationship with pCR for enrolled HER2 positive breast cancer patients |
Ninety patients were treated with A+T chemotherapy (89.11%). Most of them completed more than six cycles (75.25%). Other chemotherapy regimen included carboplatin, taxane and cyclophosphamide. Furthermore, 81 (80.20%) patients received simultaneous neoadjuvant anti-HER2 targeted therapy with trastuzumab at NAT, and completed one-year anti-HER2 treatment. There were 29 (28.71%) patients achieved pCR after NAT.
Changes in MetS-related variables pre- and postNAT
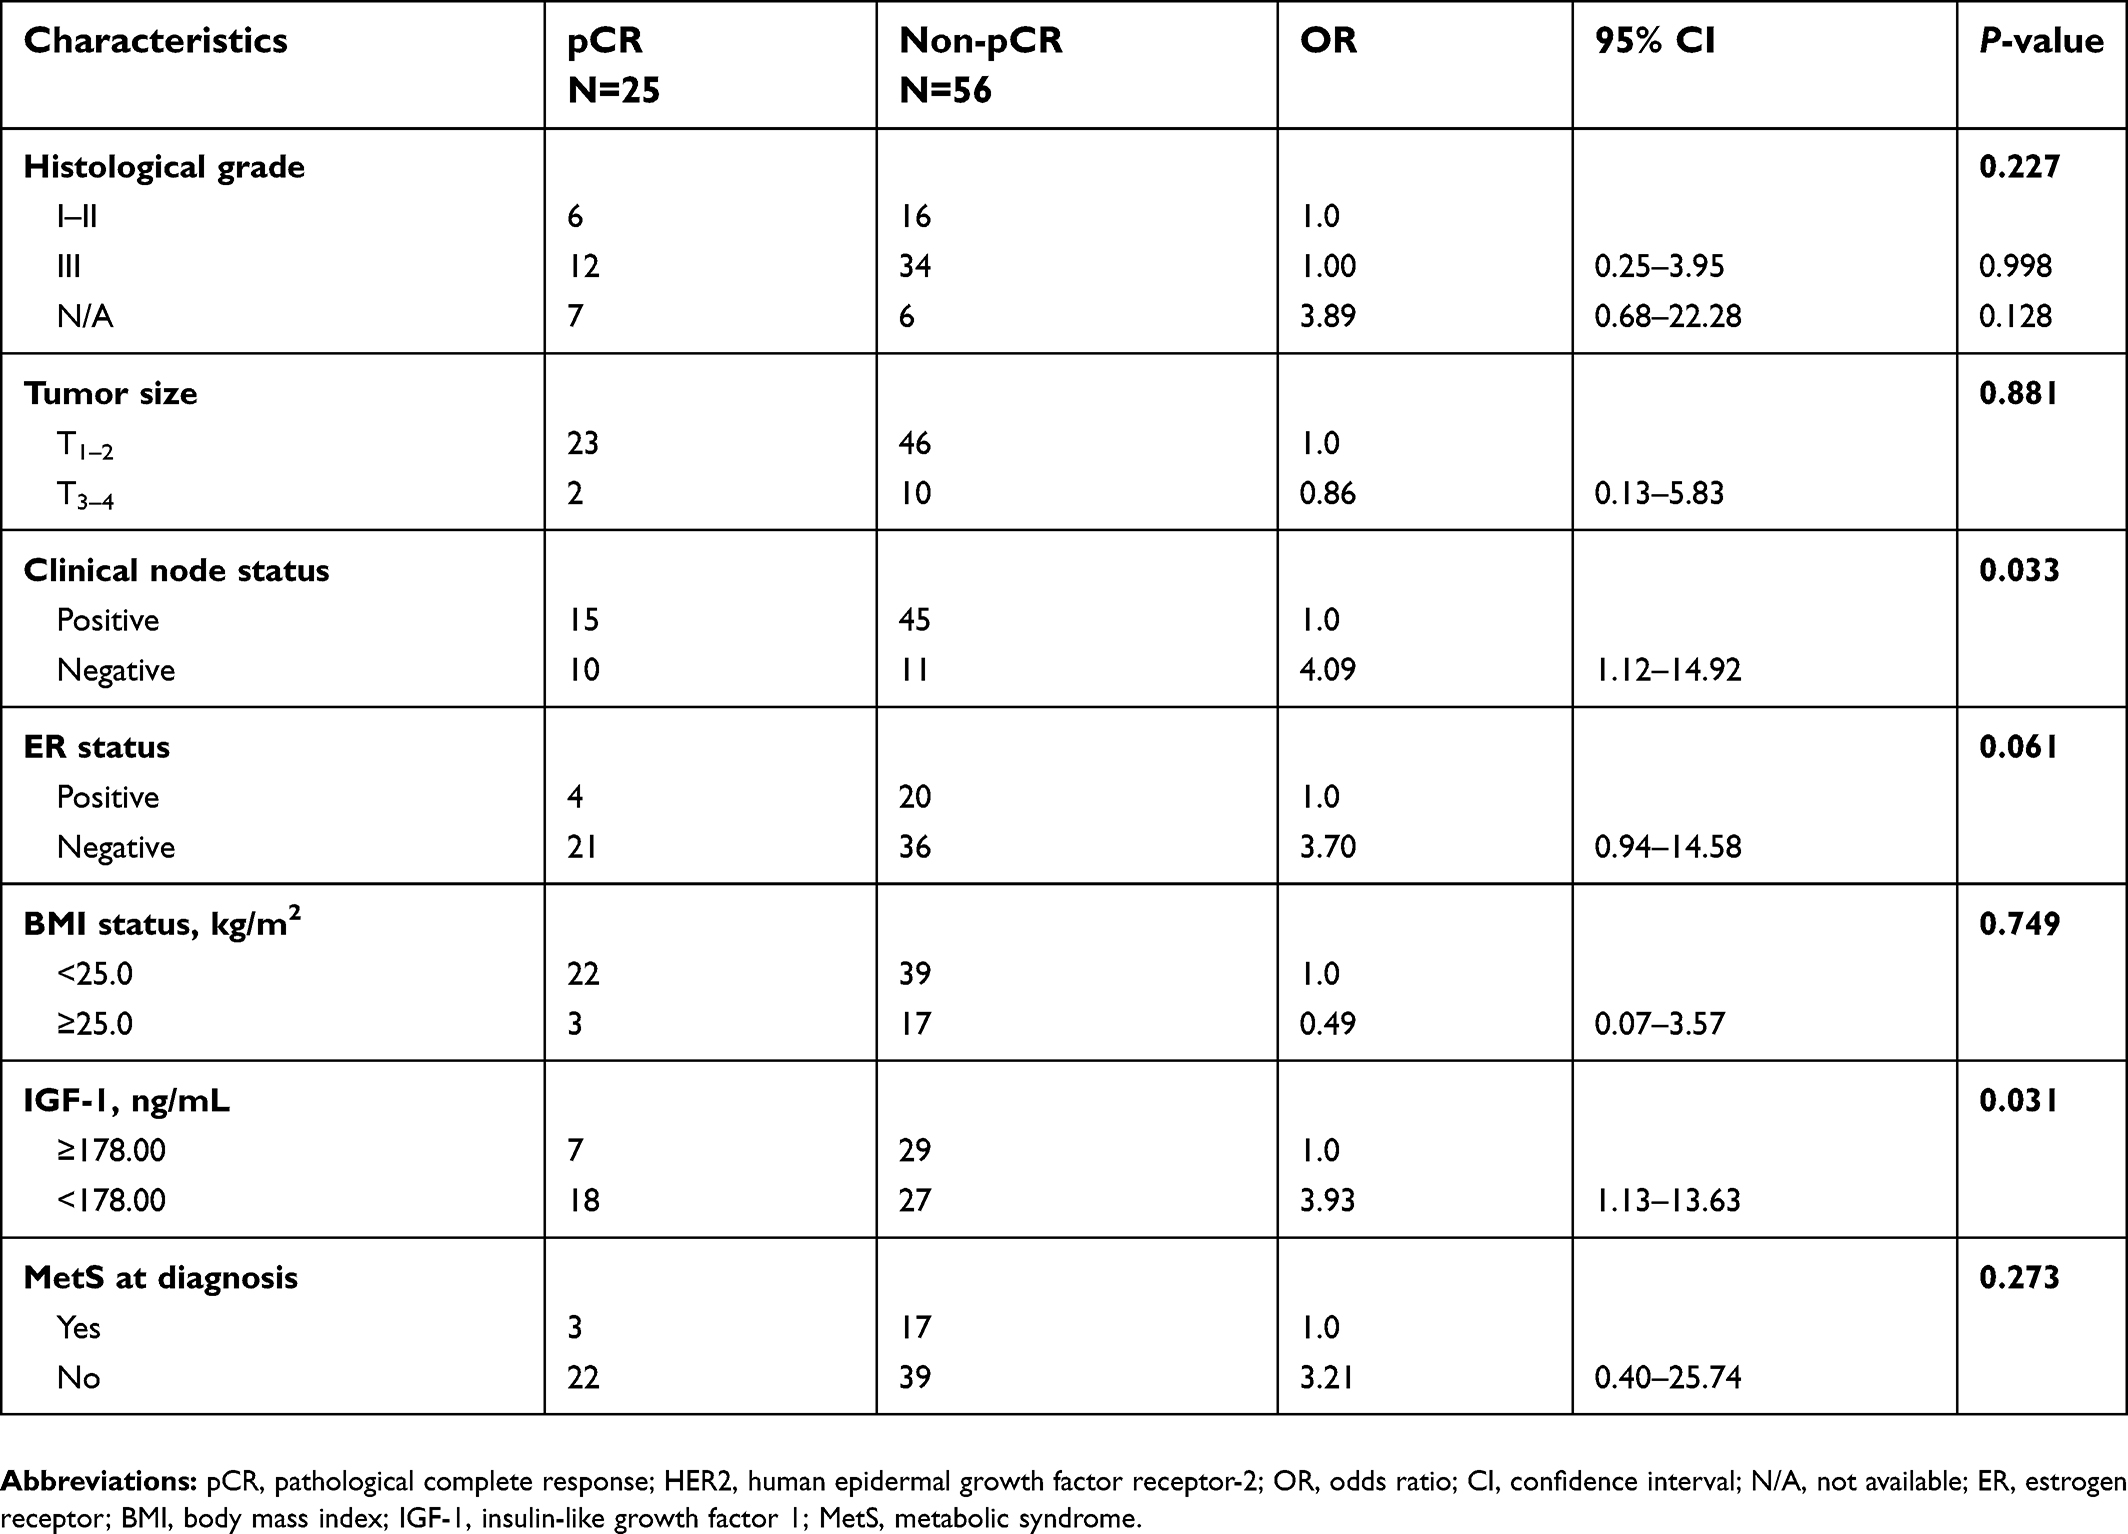
Distribution of MetS-related variables at initiation of NAT was shown in Table 2. The pCR rate was significantly higher in patients with low preNAT IGF-1 level compared to higher level (40.00% vs 17.65%, P=0.013). According to the AHA/NHLBI guideline, 29 (28.71%) patients were diagnosed with MetS at initiation of NAT, with an average of 1.71±1.51 MetS-related components meeting the criteria (Table 3). The major metabolic disorders were reduced HDL-C (44.55%), and successively elevated blood pressure (41.58%), obesity (28.71%), elevated fasting blood glucose (28.71%), and elevated triglycerides (22.77%) according to the AHA/NHLBI guildeline (
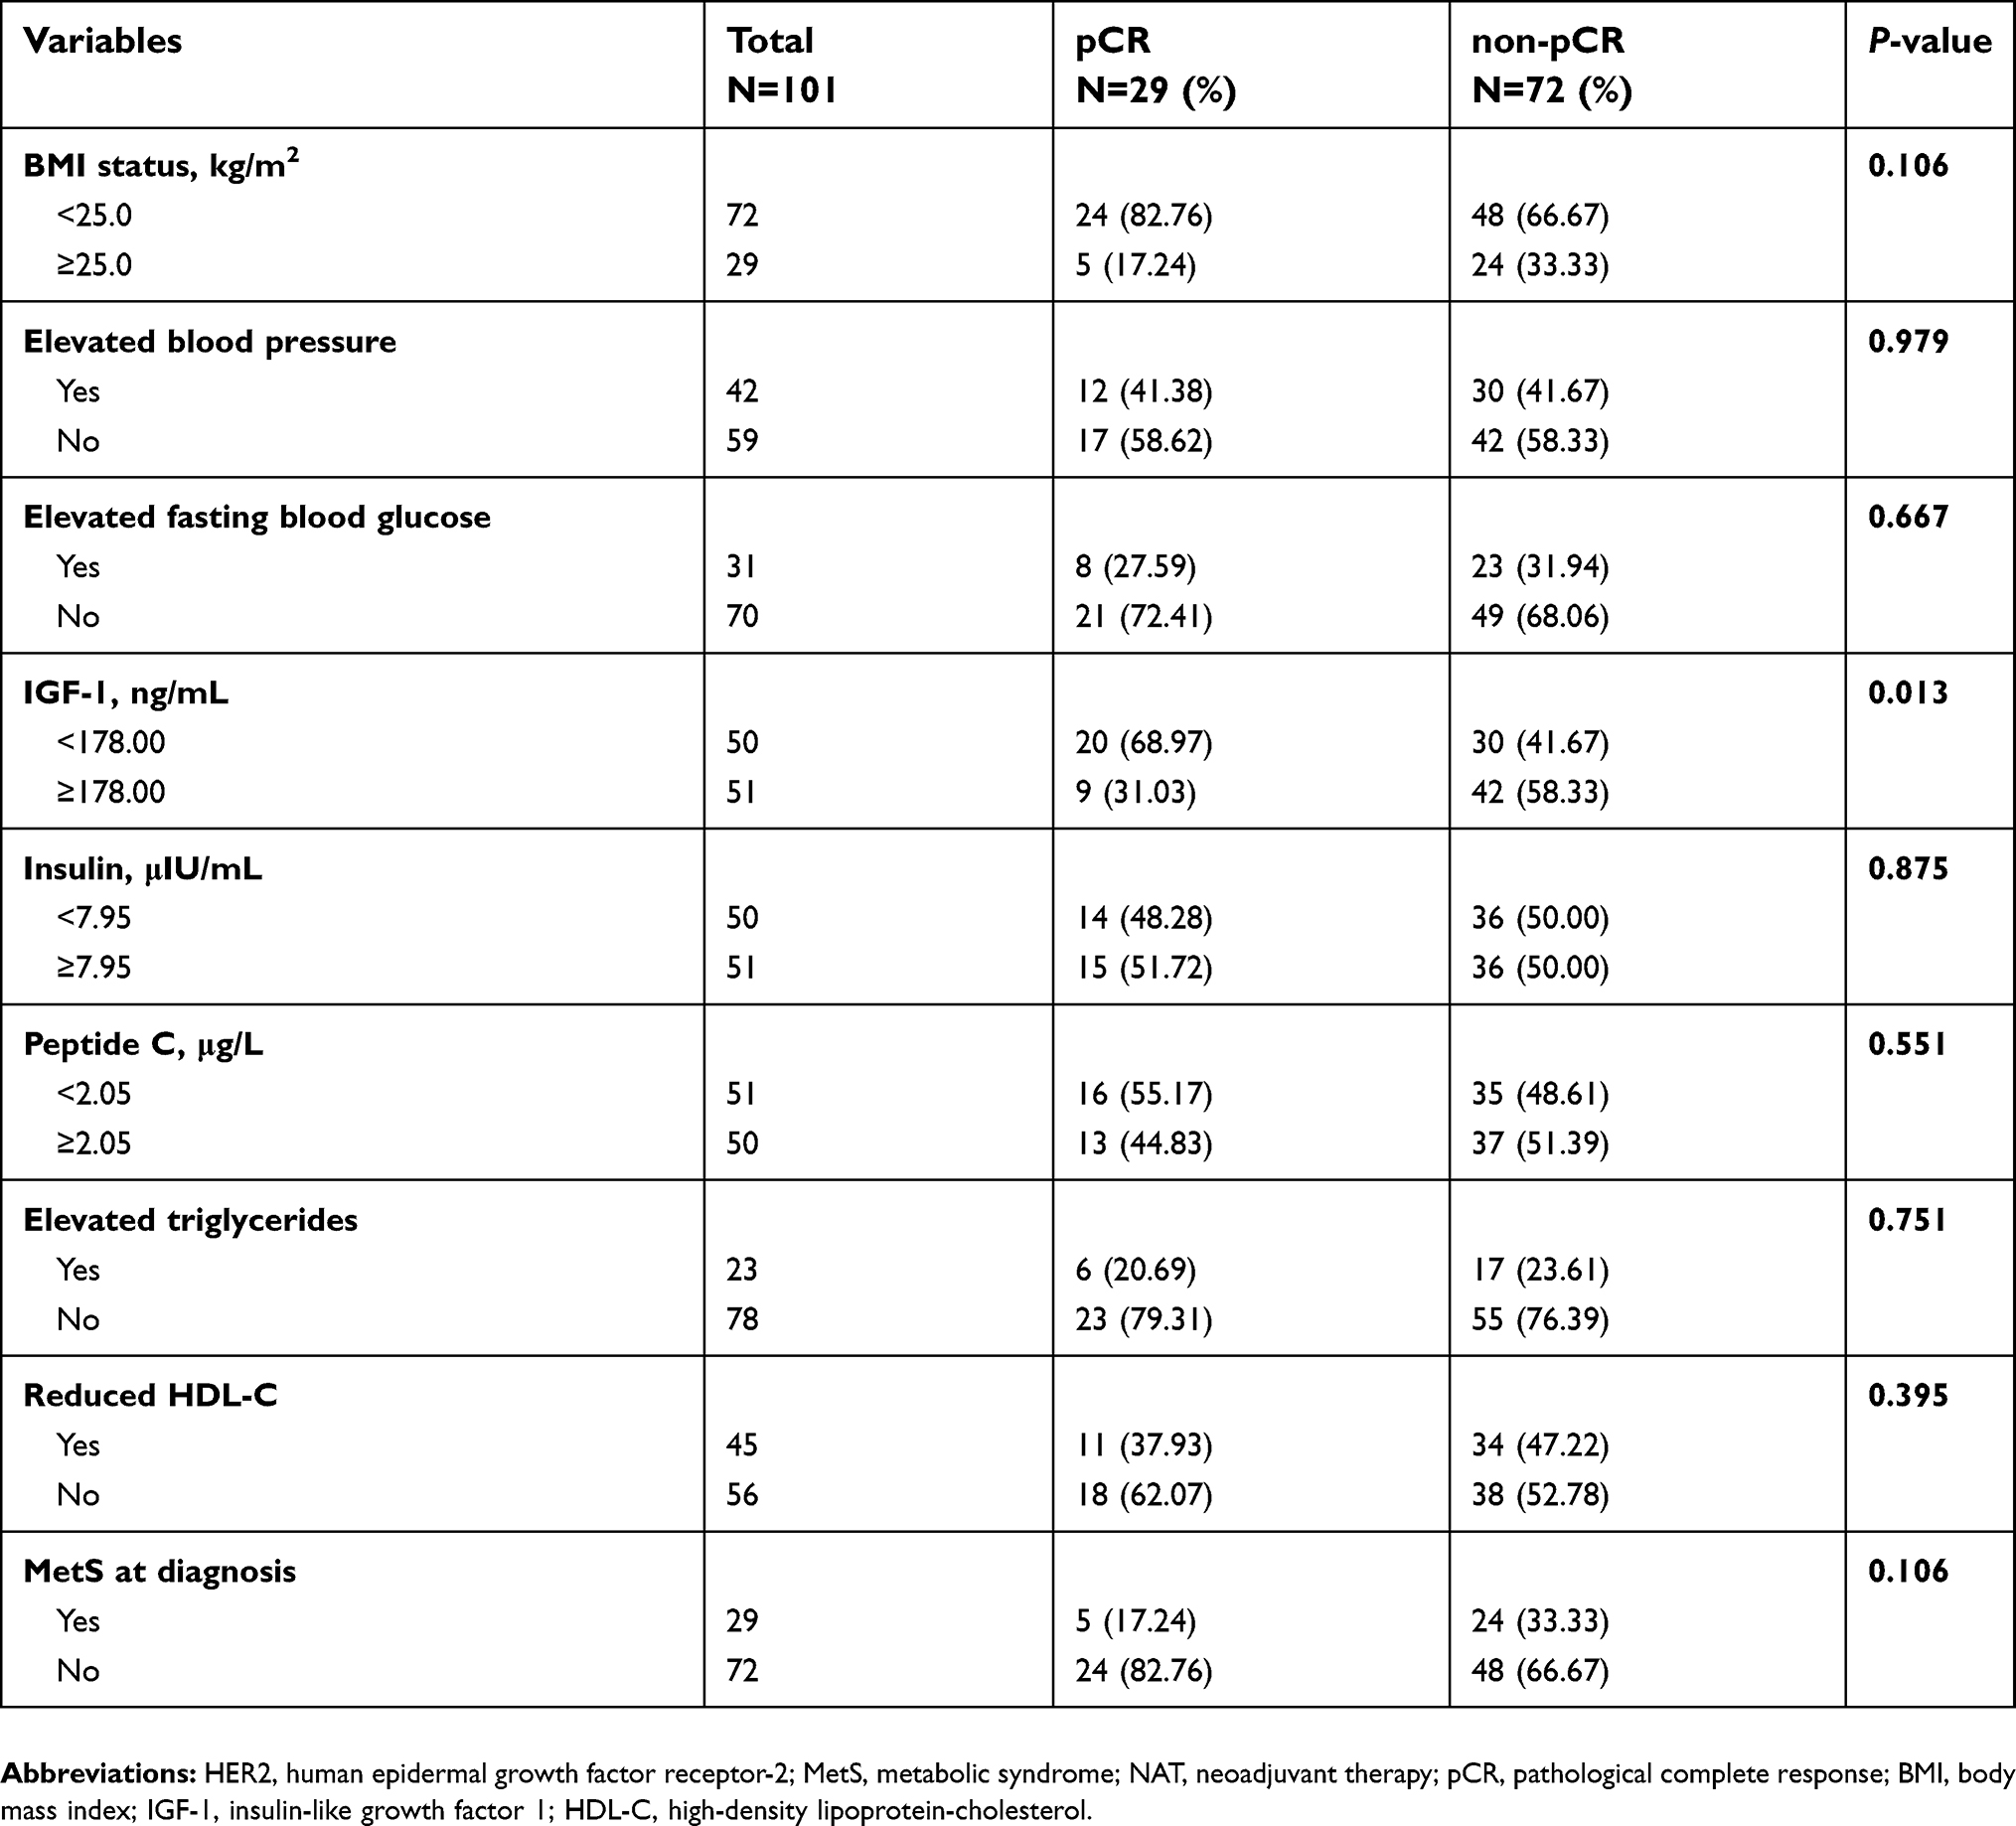 | Table 2 MetS-related variables at initiation of NAT and pCR in HER2 positive breast cancer patients |
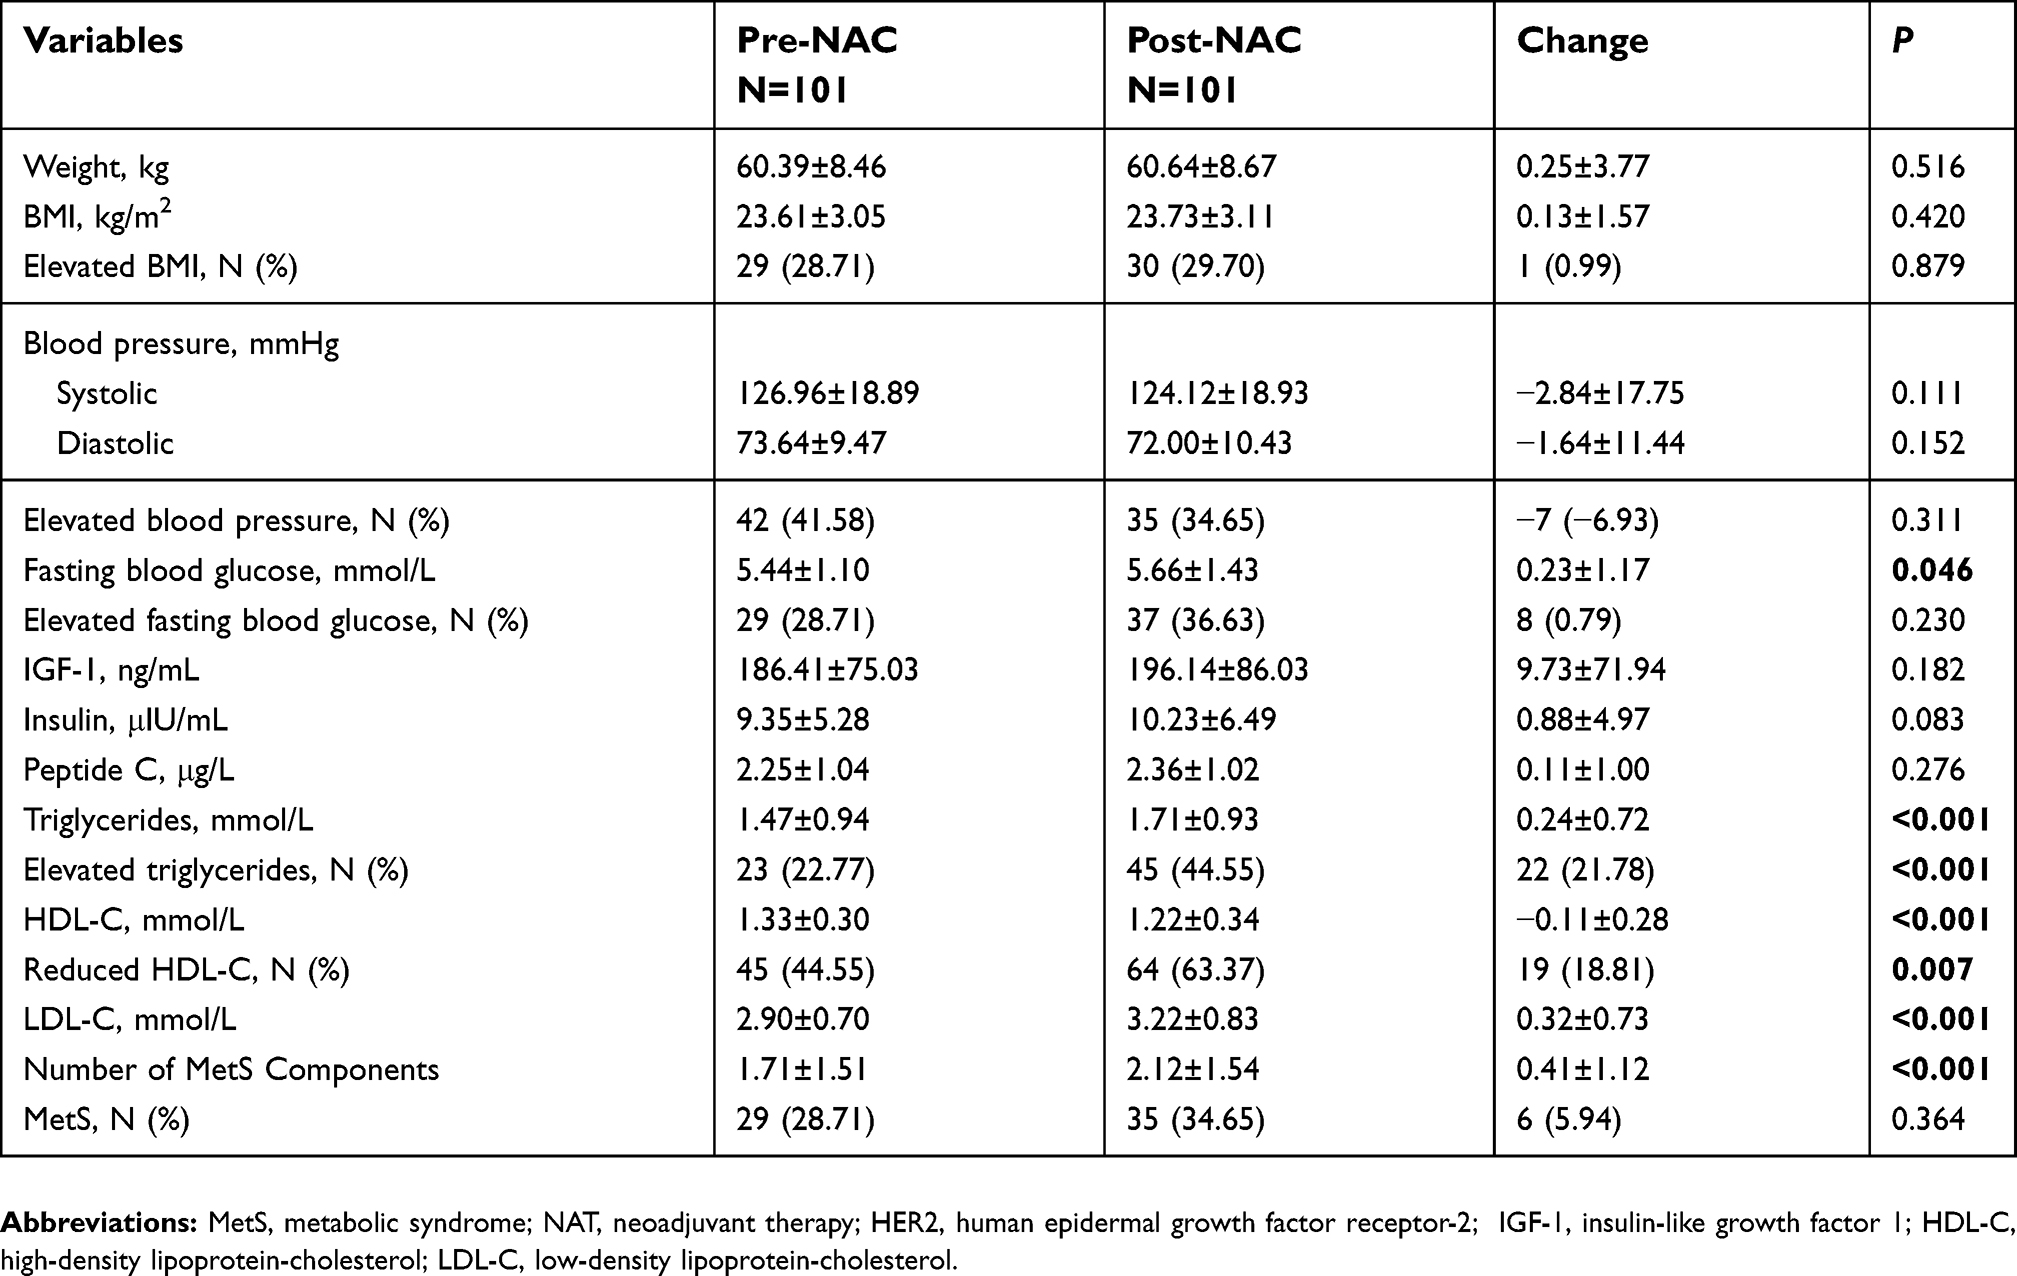 | Table 3 MetS-related variables change before and after NAT in HER2 positive breast cancer patients |
An aggravation of the MetS was observed after the completion of NAT, with the patients presenting significantly disturbed metabolic profiles (Table 3). MetS was diagnosed in 34.65% of the patients with an average of 2.12±1.54 metabolic disorders (P<0.001). BMI and blood pressure were comparable before and after NAT (P>0.05). PostNAT fasting blood glucose was substantially higher compared to baseline (P=0.046), but the number of patients with elevated fasting blood glucose did not increase dramatically (P=0.230). The average IGF-1 was 196.14±86.03 ng/mL after NAT, which was numerically higher than the baseline of 186.41±75.03 ng/mL before NAT (P=0.182). There were no significant increases in insulin or C-peptide (P>0.05). Moreover, lipid metabolism factors, including triglycerides, TC, HDL-C and LDL-C, significantly worsened by the completion of NAT (all P<0.05).
Impact factors for pCR in HER2-amplified patients
A total of 29 patients (28.71%) achieved pCR after NAT. IGF-1 level was significantly associated with pCR in the univariate analysis (OR: 3.11, 95%CI: 1.25–7.77, P=0.013; Table 2). Meanwhile, BMI, blood pressure, other glucose and lipid metabolic variables were not significantly different between pCR and non-pCR groups. In multivariate analysis, patients with lower IGF-1 levels were more likely to achieve pCR (OR: 3.83, 95%CI: 1.32–11.11, P=0.014; Table 4). In addition, ER negativity also showed a trend of higher pCR rate at NAT (OR: 3.36, 95%CI: 1.00–11.25, P=0.049).
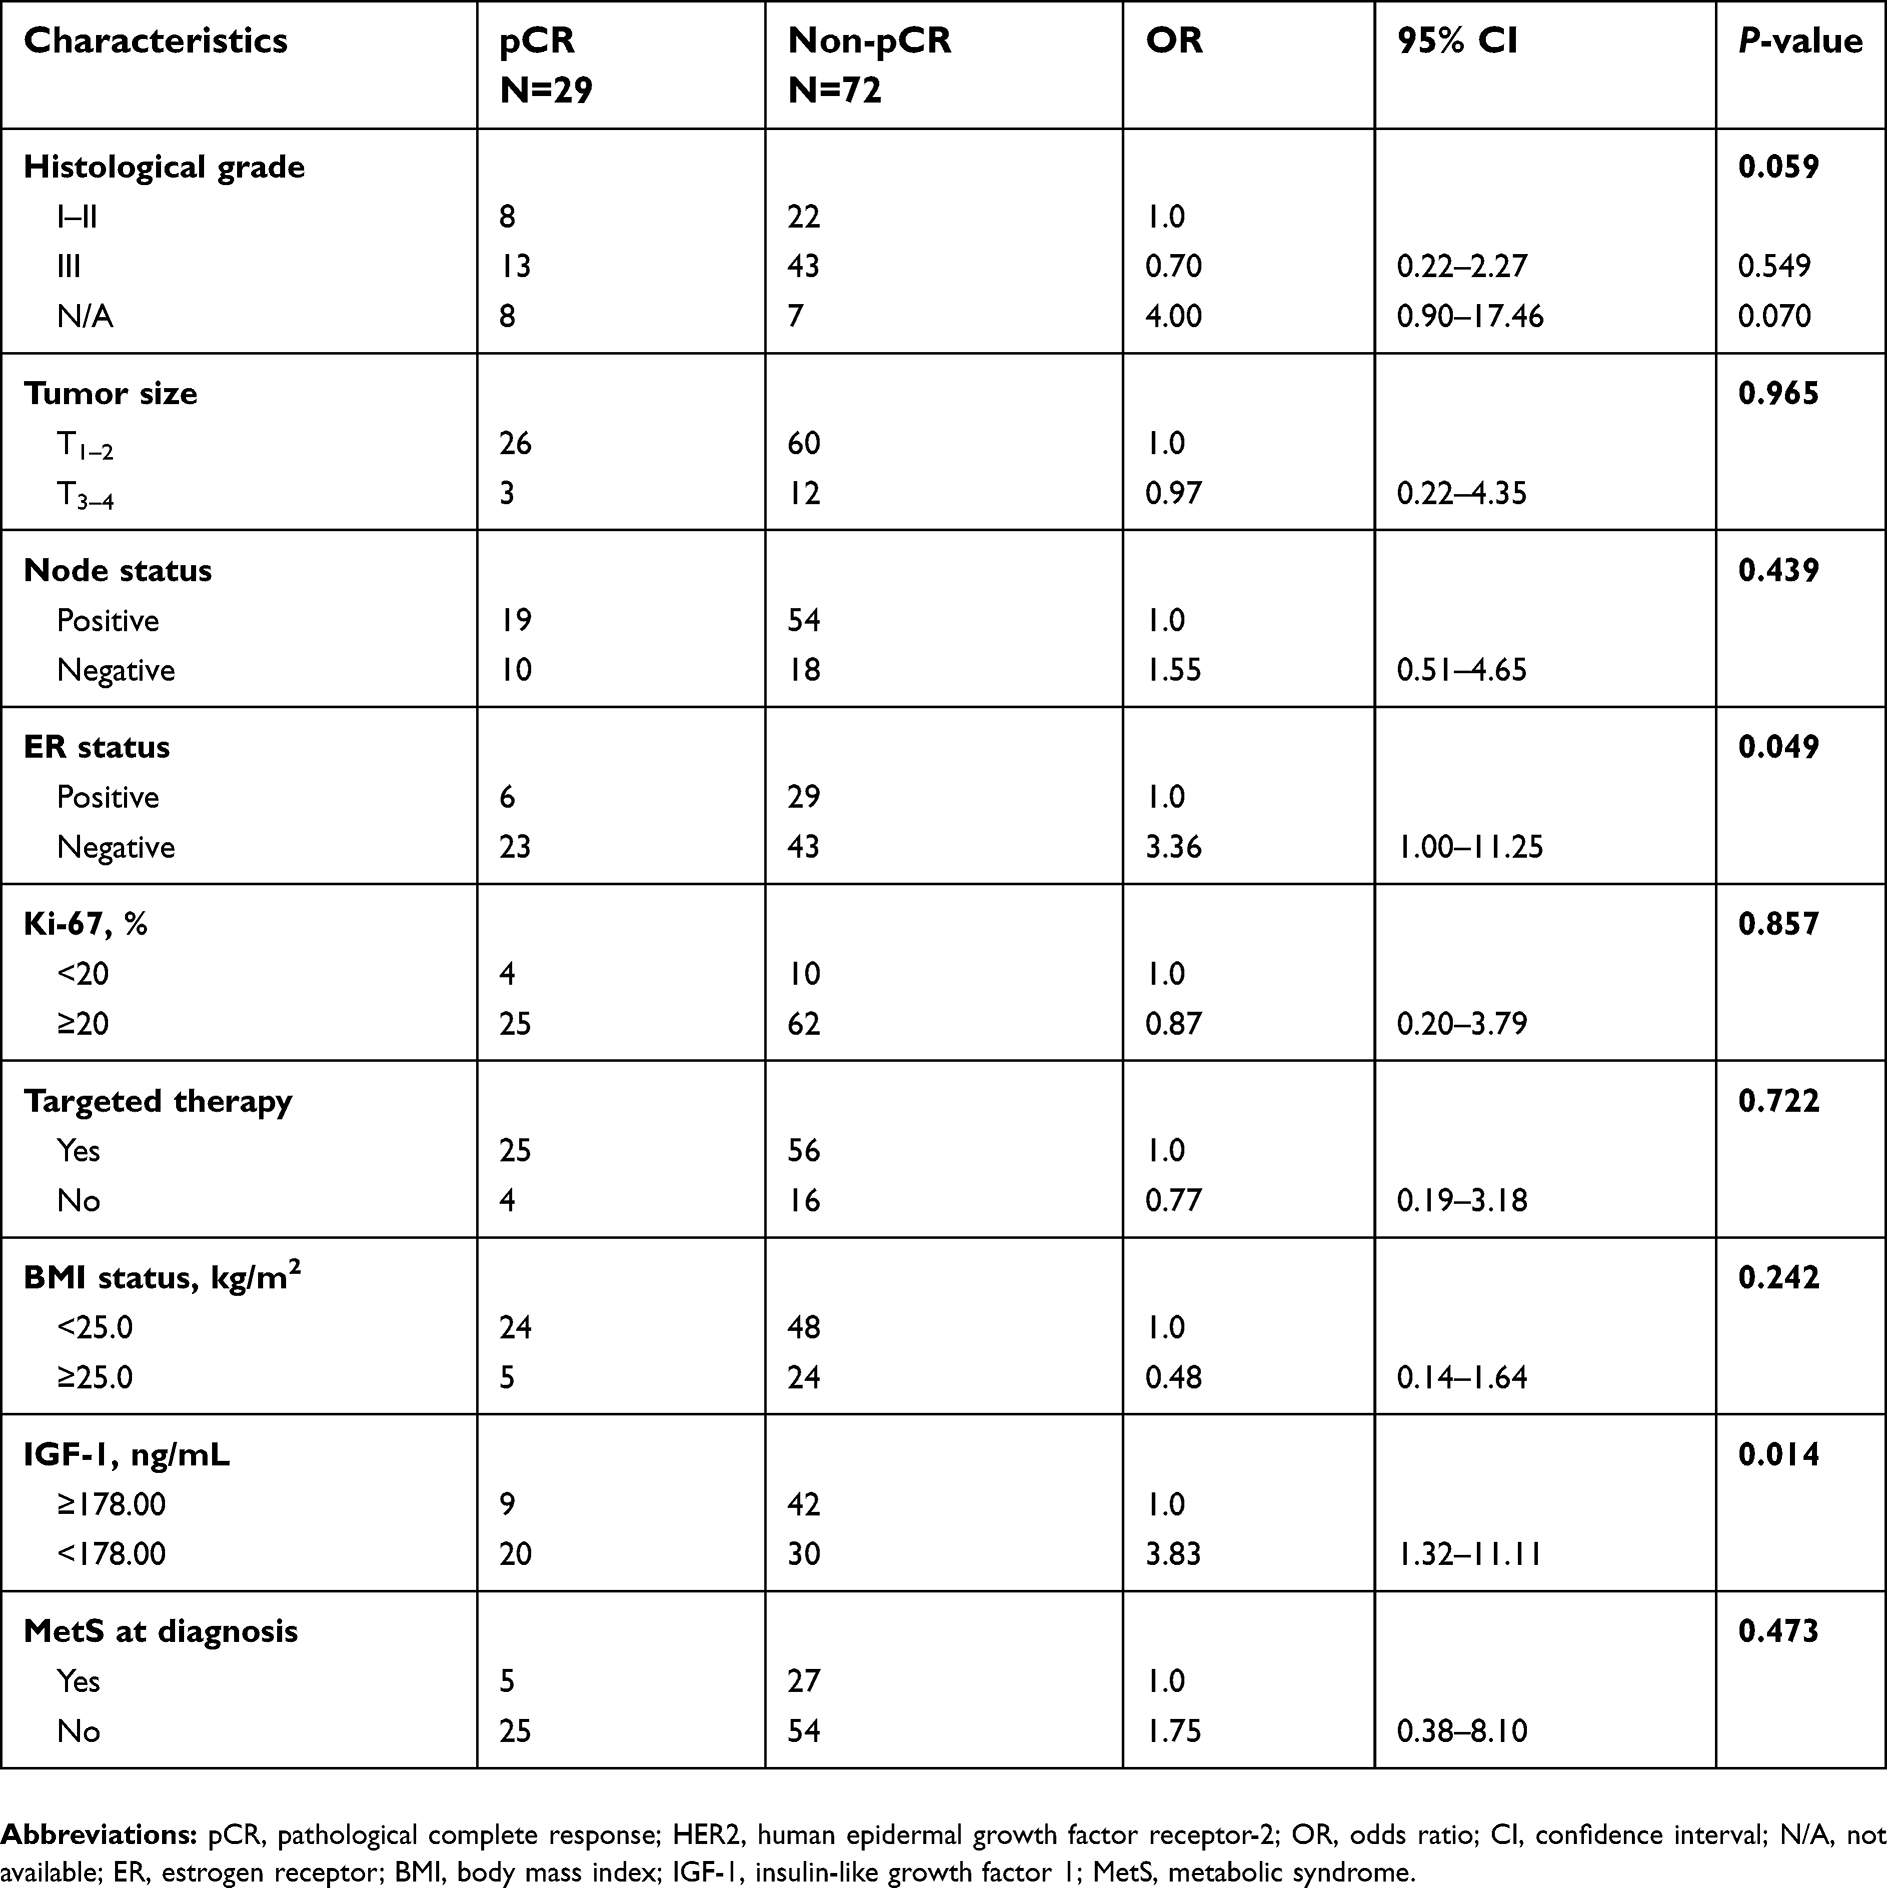 | Table 4 Multivariate logistic regression analysis of factors associated with pCR in HER2 positive breast cancer patients |
Moreover, for patients who had been treated with neoadjuvant targeted therapy, the pCR rate was 30.86% (25 of 81;
 | Table 5 Multivariate logistic regression analysis of factors associated with pCR in HER2 positive breast cancer cases receiving neoadjuvant targeted therapy |
Distribution of IGF-1 levels before and after NAT was plotted as Figure 1. Patients with low preNAT IGF-1 expression showed significantly higher pCR rate compared to those with high preNAT expression (40.00% vs 17.65%, P=0.013). Patients with lower pre- and postNAT IGF-1 were the most likely to achieve pCR compared to others (pCR rate: 40.61%, P=0.012), while those with high pre- and low postNAT IGF-1 level showed the lowest pCR rate of 13.33%.
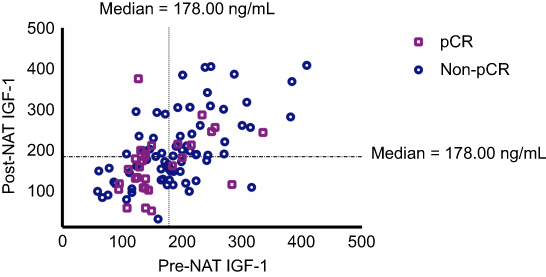 | Figure 1 Distribution of IGF-1 levels before and after neoadjuvant therapy and its association with pCR rate in HER2 breast cancer patients. Those achieving pCR were presented in violet squares, and those without pCR were presented in blue circles. The median value of 178.00 ng/mL was adopted to classify patients into higher or lower IGF-1 expression. Patients with lower IGF-1 levels both pre and post NAT were statistically more likely to achieve pCR compared with others (P=0.012). Abbreviations: IGF-1, insulin-like growth factor-1; NAT, neoadjuvant therapy; pCR, pathological complete response. |
Clinical outcomes
At a median follow-up time of 29.03 (range: 10.42–56.98) months, 15 disease-free events and five deaths were reported. There was no significant difference of DFS (HR: 2.19, 95%CI: 0.72–6.65, P=0.166; Figure 2A] or OS (HR: 3.98, 95%CI: 0.54–29.38, P=0.176;
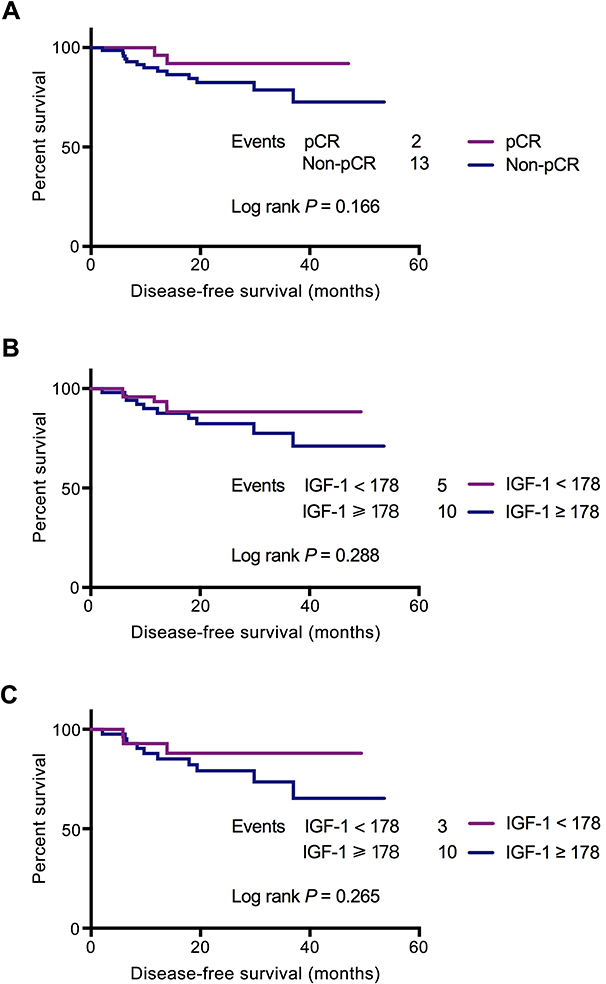 | Figure 2 Disease free survival of enrolled patients by pCR and IGF-1 status. The median value of 178.00 ng/mL was adopted to classify patients into higher or lower IGF-1 expression. At a median follow up time of 24.50 (range 4.57–53.63) months, a total of 15 disease-free events were reported. The number of DFS events were relatively fewer in the lower IGF-1 group. DFS rate was similar between (A) pCR and non-pCR groups (P=0.166), (B) lower and higher IGF-1 groups in whole study population (P=0.288), or (C) lower and higher IGF-1 groups in non-pCR patients (P=0.265). Abbreviations: DFS, disease-free survival; pCR, pathological complete response; IGF-1, insulin-like growth factor-1. |
In addition, Cox regression was applied to define prognostic factors affecting DFS in the study population. Grade III tumors (HR: 23.70, 95%CI: 1.61–349.52, P=0.021; Table 6), higher Ki-67 (HR: 31.20, 95%CI: 4.02–242.29, P=0.001), and elevated fasting blood glucose (HR: 12.50, 95%CI: 1.92–100.00, P=0.008) were independently associated with worse DFS.
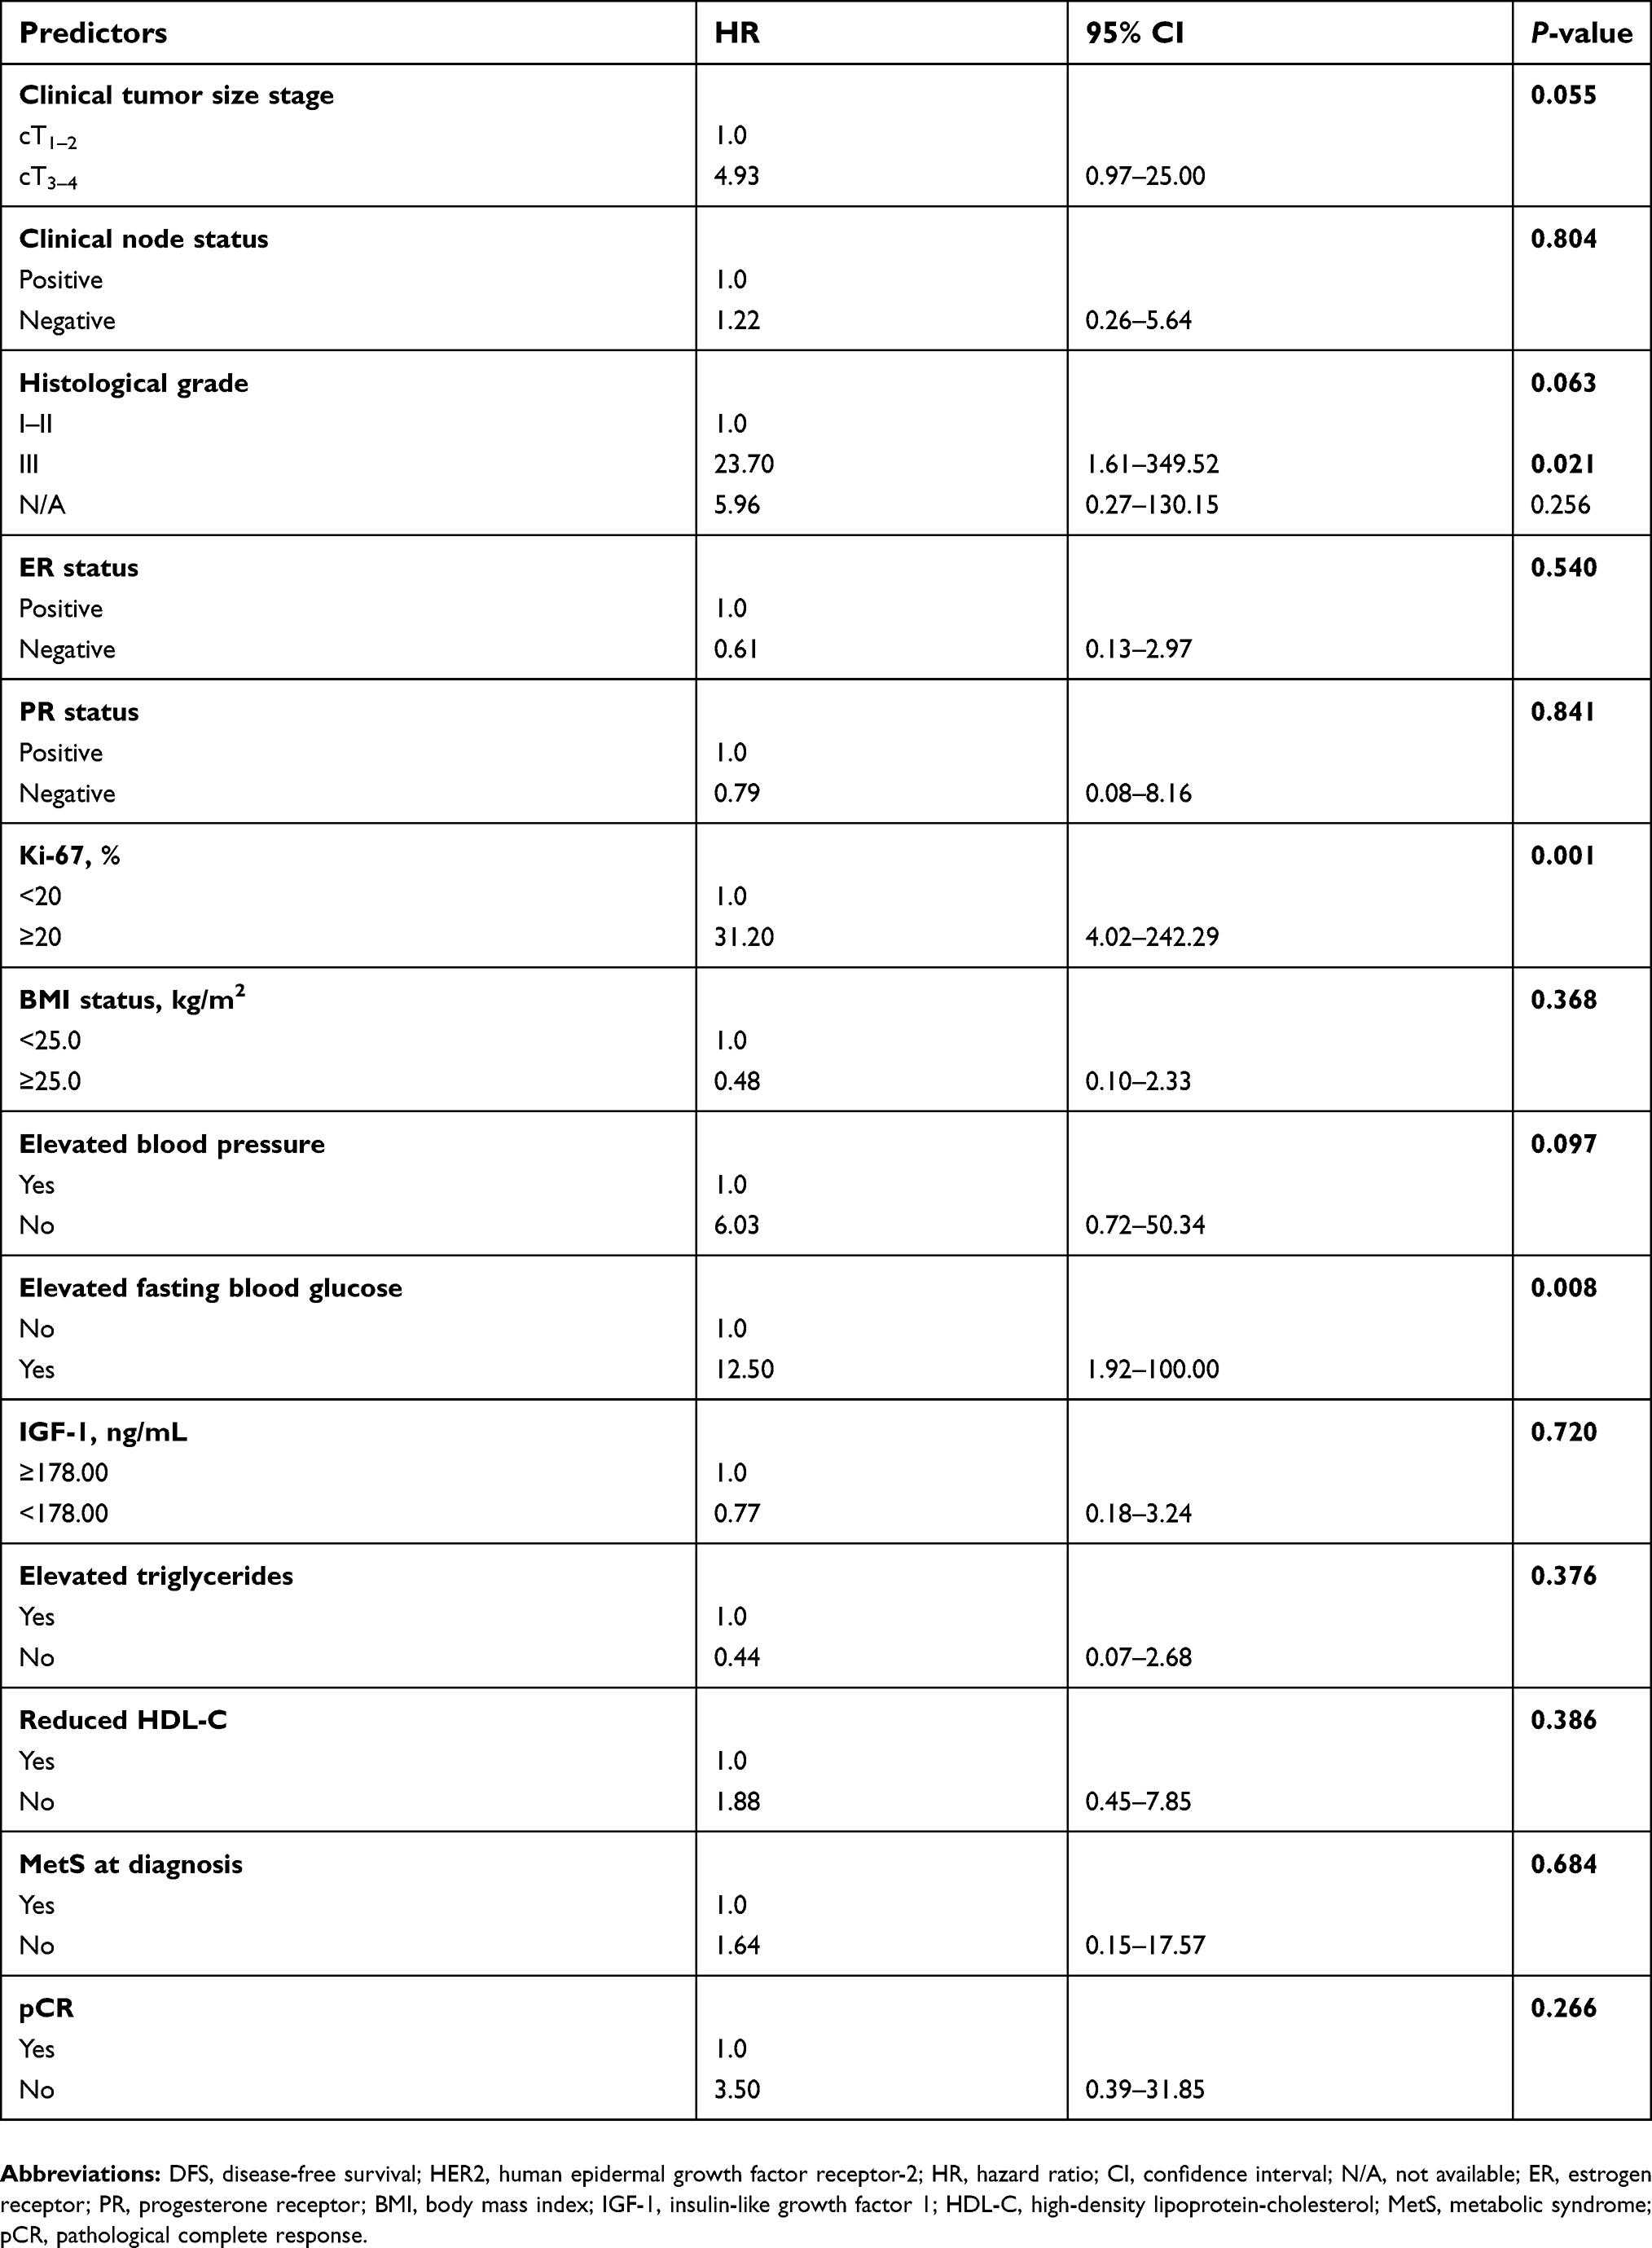 | Table 6 Multivariate analysis of prognostic factors affecting DFS in HER2 positive breast cancer patients treated with neoadjuvant therapy |
Discussion
In this study, including HER2-positive BC patients who underwent NAT and definitive surgery, we demonstrated a significant deterioration in metabolic profiles during NAT, especially in lipid metabolism. The pCR rate was 28.71% in the whole population and 30.86% in those receiving neoadjuvant trastuzumab targeted therapy with chemotherapy. Moreover, low IGF-1 level at initiation of NAT was associated with a higher pCR rate for HER2-positive BC. To our knowledge, this is the first study looking into the change of metabolic profiles in a particular HER2-amplified population undergoing NAT, and to explore the potential metabolic biomarkers to predict pathological response and survival. Our findings showed that the expression of IGF-1 could be a candidate biomarker for pCR prediction in HER2-positive BC receiving NAT.
Great efforts have been made to identify pCR predictors in the HER2-amplified BC population. Among all the potential factors, for example smaller tumor size, high histological grade, etc,7 negative hormone receptor is the most well-accepted independent predictor for NAT efficacy. Our study confirmed that patients with ER-negative tumors responded better to NAT in overall HER2-amplifed cases, while those with negative clinical lymph node experienced a significantly better pathological response in HER2-positive patients treated with neoadjuvant targeted therapy. To note, IGF-1 expression was the only independent pCR predictor both in the overall population and in patients receiving neoadjuvant targeted therapy.
Potential metabolic changes following adjuvant treatment have been previously reported by different investigators. Bicakli et al showed an elevated risk for weight gain, dyslipidemia, and insulin resistance in BC patients treated with adjuvant chemotherapy.24 Guinan et al also revealed significant increases in fasting insulin and HbA1c level, accompanied by the insulin resistance at the completion of adjuvant treatment in BC patients.25 Adjuvant treatment potentially contributes to an increased risk for MetS in patients with BC. Still, not much evidence has been built concerning the effect of NAT. Dieli-Conwright et al established an impaired metabolic profile with worsened components of MetS, related anthropometrics, and glucose metabolism biomarkers after finishing neoadjuvant or adjuvant chemotherapy in 86 females free from MetS at BC diagnosis.13 In the present study, 35 (34.65%) patients were diagnosed with MetS at the completion of NAT, in combination with a significant growing number of MetS components. While others have reported a notable progression of central obesity post systematic treatment,13 we found minor changes in BMI during the course of NAT. The major metabolic disturbances observed in our population were impaired lipid metabolism, which was consistent to the previous studies.
Moreover, the potential influence of MetS-related variables on pathological response to NAT remains unclear. Here we found that individual MetS component, ie BMI, blood pressure, fasting glucose or dyslipidemia did not have much impact on pCR rate, while the status of MetS at diagnosis showed a tendency to interfere with NAT efficacy, but the difference was not statistically significant in multivariate analysis. In the past decade, antidiabetic medications such as metformin have received great attention, since metformin has been shown to restrain BC tumor cell growth in vitro and in vivo.26,27 Jiralerspong et al found a significantly higher pCR rate of 24% in diabetic BC population treated with metformin (95%CI: 13–34%), and metformin use during NAT was an independent predictor of pCR after adjustment (OR: 2.95, 95%CI: 1.07–8.17, P=0.04).28 The proposed hypotheses of the mechanism of metformin action involves both direct and indirect effects. The direct, insulin-independent effects are mediated by the activation of AMPK and the inhibition of mTOR signaling, while the indirect insulin-dependent effects are associated with circulating insulin reduction, and a sequential decline of insulin receptor-signaling.29
One of the most interesting findings of our study is the effect of IGF-axis on NAT. As described before, IGF-axis, a critical part of cell growth and tissue maintenance, has been proven to be involved in 87% of invasive BC patients.17 Higher IGF-1 concentration is associated with increased BC risk, disease progression, or treatment resistance, as shown in previous studies.21,22,24,25 In the current study, we managed to demonstrate that lower IGF-1 level before initiation of NAT was predictive for pCR in HER2-positive population. Meantime, lower pre- and postNAT IGF-1 might also reflect NAT efficacy, since patients with lower IGF-1 expression both before and after NAT were more likely to achieve pCR (P=0.012). However, other IGF signaling elements including insulin etc, were unable to independently predict pathological response. Based upon previous evidence, diverse therapeutic strategies have been developed targeting the IGF signaling axis. For example, the IGF-1/2 blocking antibody xentuzumab was shown to reduce tumor cell proliferation and metastasis in a BC xenograft model when combined with taxane.15 Likewise, metformin could resensitize trastuzumab-resistant cells via interfering with the formation of the ERBB/IGF1R complexes, suggesting a possible dual-blockade blueprint in treating HER2-enriched diseases.30 Given the potential crosstalk between different growth factor axes including IGF, HER2 and ER-signaling pathways, the co-targeting strategy may hold promise in treating BC by subtypes.
Furthermore, the current study revealed that patients with normal fasting glycaemia experienced significantly better DFS compared to those with elevated blood glucose. Similar results had been reported by Barba et al, who defined fasting glucose as a significant predictor of time to disease progression in breast cancer patients receiving targeted therapy (P=0.017).31 Besides, no significant association between IGF-1 and patients’ clinical outcome in terms of DFS and OS was identified in this HER2-amplified population, with a median follow up of 24.50 months. These findings were consistent with previous studies, which also failed to show any prognostic value for IGF-1 in BC patients.32 Additional validation is necessary to give definitive conclusion about the prognostic effect of IGF-1.
There are certain limitations in this study, including its retrospective single center design and potential selection biases. The follow-up time wasn’t long enough to detect any survival difference between subgroups, and a continuous long-term follow-up should be warranted. Besides, waist circumference and waist-hip ratio, frequently applied parameters in previous studies to define MetS, were unavailable in the current study. Instead, we used a BMI with a cut-off value of no less than 25.0 kg/m2 to define central obesity, according to the Chinese Medical Association criteria for MetS, which we believed applicable for Chinese population.23 Meantime, we conducted measurements only at diagnosis and after completion of NAT; additional time points in follow-up can be considered to elucidate the long term effect of MetS.
Conclusion
In conclusion, metabolic profiles especially lipid metabolism significantly worsened during NAT. IGF-1 level at diagnosis, but no other metabolic variables, was an independent predictor for pCR in patients with HER2-amplified BC undergoing NAT. Patients with consistent lower IGF-1 expression before and after NAT were more likely to achieve pCR, which deserves further clinical evaluation.
Abbreviation list
HER2, human epidermal growth factor receptor-2; BC, breast cancer; NAT, neoadjuvant therapy; pCR, pathological complete response; MetS, metabolic syndrome; ER, estrogen receptor; PR, progesterone receptor; A+T, anthracycline plus taxane; BMI, body mass index; IGF-1, insulin-like growth factor-1; TC, total cholesterol; HDL-C, high-density lipoprotein cholesterol; LDL-C, low-density lipoprotein cholesterol; AHA/NHLBI, American Heart Association/National Heart, Lung, and Blood Institute; OS, overall survival; DFS, disease-free survival; SD, standard deviation; OR, odds ratio; CI, confidence interval; HR, hazard ratio.
Acknowledgments
The authors want to thank the financial supported by grants from National Natural Science Foundation of China (Grant Number: 81472462, 81772797), Medical Guidance Foundation of Shanghai Municipal Science and Technology Commission (15411966400). All these financial sponsors had no role in the study design, in the collection, analysis or interpretation of data.
Disclosure
The authors report no conflicts of interest in this work.
References
1. Loibl S, Gianni L. HER2-positive breast cancer. Lancet. 2017;389(10087):2415–2429. doi:10.1016/S0140-6736(16)32417-5
2. Slamon DJ, Leyland-Jones B, Shak S, et al. Use of chemotherapy plus a monoclonal antibody against HER2 for metastatic breast cancer that overexpresses HER2. N Engl J Med. 2001;344(11):783–792. doi:10.1056/NEJM200103153441101
3. Vogel CL, Cobleigh MA, Tripathy D, et al. Efficacy and safety of trastuzumab as a single agent in first-line treatment of HER2-overexpressing metastatic breast cancer. J Clin Oncol. 2002;20(3):719–726. doi:10.1200/JCO.2002.20.3.719
4. Creighton CJ, Casa A, Lazard Z, et al. Insulin-like growth factor-I activates gene transcription programs strongly associated with poor breast cancer prognosis. J Clin Oncol. 2008;26(25):4078–4085. doi:10.1200/JCO.2007.15.2777
5. Gianni L, Bisagni G, Colleoni M, et al. Neoadjuvant treatment with trastuzumab and pertuzumab plus palbociclib and fulvestrant in HER2-positive, ER-positive breast cancer (NA-PHER2): an exploratory, open-label, phase 2 study. Lancet Oncol. 2018;19(2):249–256. doi:10.1016/S1470-2045(18)30144-X
6. Hamy AS, Belin L, Bonsang-Kitzis H, et al. Pathological complete response and prognosis after neoadjuvant chemotherapy for HER2-positive breast cancers before and after trastuzumab era: results from a real-life cohort. Br J Cancer. 2016;114(1):44–52. doi:10.1038/bjc.2015.426
7.
8. Cortazar P, Zhang L, Untch M, et al. Pathological complete response and long-term clinical benefit in breast cancer: the CTNeoBC pooled analysis. Lancet. 2014;384:164–172. doi:10.1016/S0140-6736(13)62422-8
9. DeMichele A, Yee D, Esserman L. Mechanisms of resistance to neoadjuvant chemotherapy in breast cancer. N Engl J Med. 2017;377(23):2287–2289. doi:10.1056/NEJMcibr1711545
10. Gerratana L, Bonotto M, Bozza C, et al. Pertuzumab and breast cancer: another piece in the anti-HER2 puzzle. Expert Opin Biol Ther. 2017;17:365–374. doi:10.1080/14712598.2017.1282944
11. Bhandari R, Kelley GA, Hartley TA, et al. Metabolic syndrome is associated with increased breast cancer risk: a systematic review with meta-analysis. Int J Breast Cancer. 2014;2014:189384. doi:10.1155/2014/189384
12. Bjorge T, Lukanova A, Jonsson H, et al. Metabolic syndrome and breast cancer in the me-can (metabolic syndrome and cancer) project. Cancer Epidemiol Biomarkers Prev. 2010;19(7):1737–1745. doi:10.1158/1055-9965.EPI-10-0230
13. Dieli-Conwright CM, Wong L, Waliany S, et al. An observational study to examine changes in metabolic syndrome components in patients with breast cancer receiving neoadjuvant or adjuvant chemotherapy. Cancer. 2016;122(17):2646–2653. doi:10.1002/cncr.v122.17
14. Renehan AG, Zwahlen M, Minder C, et al. Insulin-like growth factor (IGF)-I, IGF binding protein-3, and cancer risk: systematic review and meta-regression analysis. Lancet. 2004;363(9418):1346–1353. doi:10.1016/S0140-6736(04)16044-3
15. Ireland L, Santos A, Campbell F, et al. Blockade of insulin-like growth factors increases efficacy of paclitaxel in metastatic breast cancer. Oncogene. 2018;37(15):2022–2036. doi:10.1038/s41388-017-0115-x
16.
17. Denduluri SK, Idowu O, Wang Z, et al. Insulin-like growth factor (IGF) signaling in tumorigenesis and the development of cancer drug resistance. Genes Dis. 2015;2(1):13–25. doi:10.1016/j.gendis.2014.10.004
18. Yerushalmi R, Gelmon KA, Leung S, et al. Insulin-like growth factor receptor (IGF-1R) in breast cancer subtypes. Breast Cancer Res Treat. 2012;132(1):131–142. doi:10.1007/s10549-011-1529-8
19. Duggan C, Wang CY, Neuhouser ML, et al. Associations of insulin-like growth factor and insulin-like growth factor binding protein-3 with mortality in women with breast cancer. Int J Cancer. 2013;132(5):1191–1200. doi:10.1002/ijc.27753
20. Bhargava R, Beriwal S, McManus K, et al. Insulin-like growth factor receptor-1 (IGF-1R) expression in normal breast, proliferative breast lesions, and breast carcinoma. Appl Immunohistochem Mol Morphol. 2011;19(3):218–225. doi:10.1097/PAI.0b013e318206d23d
21. Chen X, Zhu S, Fei X, et al. Surgery time interval and molecular subtype may influence Ki67 change after core needle biopsy in breast cancer patients. BMC Cancer. 2015;15:822. doi:10.1186/s12885-015-1584-3
22. Liu J, Grundy SM, Wang W, et al. Ethnic-specific criteria for the metabolic syndrome: evidence from China. Diabetes Care. 2006;29(6):1414–1416. doi:10.2337/dc06-0481
23.
24. Bicakli DH, Varol U, Degirmenci M, et al. Adjuvant chemotherapy may contribute to an increased risk for metabolic syndrome in patients with breast cancer. J Oncol Pharm Pract. 2016;22(1):46–53. doi:10.1177/1078155214551315
25. Guinan EM, Connolly EM, Healy LA, et al. The development of the metabolic syndrome and insulin resistance after adjuvant treatment for breast cancer. Cancer Nurs. 2014;37(5):355–362.
26. Zhang J, Li G, Chen Y, et al. Metformin inhibits tumorigenesis and tumor growth of breast cancer cells by upregulating miR-200c but downregulating AKT2 expression. J Cancer. 2017;8(10):1849–1864. doi:10.7150/jca.19858
27. Checkley LA, Rudolph MC, Wellberg EA, et al. Metformin accumulation correlates with organic cation transporter 2 protein expression and predicts mammary tumor regression in vivo. Cancer Prev Res (Phila). 2017;10(3):198–207. doi:10.1158/1940-6207.CAPR-16-0211-T
28. Jiralerspong S, Palla SL, Giordano SH, et al. Metformin and pathologic complete responses to neoadjuvant chemotherapy in diabetic patients with breast cancer. J Clin Oncol. 2009;27(20):3297–3302. doi:10.1200/JCO.2009.19.6410
29. Dowling RJ, Niraula S, Chang MC, et al. Changes in insulin receptor signaling underlie neoadjuvant metformin administration in breast cancer: a prospective window of opportunity neoadjuvant study. Breast Cancer Res. 2015;17:32. doi:10.1186/s13058-015-0540-0
30. Liu B, Fan Z, Edgerton SM, et al. Potent anti-proliferative effects of metformin on trastuzumab-resistant breast cancer cells via inhibition of erbB2/IGF-1 receptor interactions. Cell Cycle. 2011;10(17):2959–2966. doi:10.4161/cc.10.17.17068
31. Barba M, Sperati F, Stranges S, et al. Fasting glucose and treatment outcome in breast and colorectal cancer patients treated with targeted agents: results from a historic cohort. Ann Oncol. 2012;23(7):1838–1845. doi:10.1093/annonc/mdr540
32. Papadakis GZ, Mavroudis D, Georgoulias V, et al. Serum IGF-1, IGFBP-3 levels and circulating tumor cells (CTCs) in early breast cancer patients. Growth Horm IGF Res. 2017;33:28–34. doi:10.1016/j.ghir.2017.02.001
 © 2019 The Author(s). This work is published and licensed by Dove Medical Press Limited. The full terms of this license are available at https://www.dovepress.com/terms.php and incorporate the Creative Commons Attribution - Non Commercial (unported, v3.0) License.
By accessing the work you hereby accept the Terms. Non-commercial uses of the work are permitted without any further permission from Dove Medical Press Limited, provided the work is properly attributed. For permission for commercial use of this work, please see paragraphs 4.2 and 5 of our Terms.
© 2019 The Author(s). This work is published and licensed by Dove Medical Press Limited. The full terms of this license are available at https://www.dovepress.com/terms.php and incorporate the Creative Commons Attribution - Non Commercial (unported, v3.0) License.
By accessing the work you hereby accept the Terms. Non-commercial uses of the work are permitted without any further permission from Dove Medical Press Limited, provided the work is properly attributed. For permission for commercial use of this work, please see paragraphs 4.2 and 5 of our Terms.