")
Back to Journals » Journal of Inflammation Research » Volume 15
Insight into the Molecular Characteristics of Langhans Giant Cell by Combination of Laser Capture Microdissection and RNA Sequencing
Authors Chen Y , Jiang H, Xiong J, Shang J, Chen Z, Wu A, Wang H
Received 16 September 2021
Accepted for publication 16 January 2022
Published 2 February 2022 Volume 2022:15 Pages 621—634
DOI https://doi.org/10.2147/JIR.S337241
Checked for plagiarism Yes
Review by Single anonymous peer review
Peer reviewer comments 2
Editor who approved publication: Professor Ning Quan
Yanqing Chen,1 Haiqin Jiang,1 Jingshu Xiong,1 Jingzhe Shang,2,3 Zhiming Chen,1 Aiping Wu,2,3 Hongsheng Wang1
1Jiangsu Key Laboratory of Molecular Biology for Skin Diseases and STIs, Institute of Dermatology, Chinese Academy of Medical Sciences and Peking Union Medical College, Nanjing, People’s Republic of China; 2Center for Systems Medicine, Institute of Basic Medical Sciences, Chinese Academy of Medical Sciences and Peking Union Medical College, Suzhou, People’s Republic of China; 3Center of Systems Medicine, Suzhou Institute of Systems Medicine, Suzhou, People’s Republic of China
Correspondence: Hongsheng Wang; Haiqin Jiang
Jiangsu Key Laboratory of Molecular Biology for Skin Diseases and STIs, Institute of Dermatology, Chinese Academy of Medical Sciences and Peking Union Medical College, No. 12, St Jiangwangmiao, Nanjing, 210042, Jiangsu, People’s Republic of China
, Tel +86-25-85478953
, Fax +86-25-85478944
, Email [email protected]; [email protected]
Purpose: The presence of Langhans giant cell (LGC) is a hallmark of mycobacterium-induced granuloma. The molecular characteristics and functions of LGC remain unclear to date. The study aimed to systematically characterize the molecular characteristics of LGC and reveal the potential functions.
Methods: Human LGCs were purified through laser capture microdissection (LCM) in vitro. RNA sequencing and in-depth transcriptome analysis were performed for purified LGCs and macrophages in the same system. Skin samples from mycobacterial infection patients were used to confirm some of the transcriptional expression.
Results: Human LGCs have different expression pattern from macrophages in the same in vitro system. A total of 967 differentially expressed genes were found. Bioinformatics analysis showed that LGCs are is characterized by active cell shape regulation, increased cytoskeletal components, weakened energy metabolism level, and reduced immune response. CCL7 may be a specific molecular for LGC to communicate with CCR1-expression cells in granuloma.
Conclusion: LGCs have unique molecular characteristics different from that of macrophages. They may play a role in maintaining the hemostasis in granuloma.
Keywords: langhans giant cell, transcriptome analysis, laser capture microdissection, molecular characteristics, CCL7
Introduction
The presence of multinucleated giant cell (MGC) is a pathological feature of granulomatous disorders, including infectious diseases such as mycobacterial infections, parasitic infections, and non-infectious diseases such as Sarcoidosis and Crohn’s disease.1,2 MGCs are derived from the differentiation of monocyte-macrophage lineage cells and contain more than 3 nuclei in a single cell.3 According to the morphological difference, MGCs are divided into several types, which tend to appear in different disease situations.3 In mycobacterial infections, the MGCs are dominantly Langhans giant cells (LGCs), which have a circular nuclei arrangement, instead of the nuclei derangement appearing in the foreign body reaction.3,4
Previous studies have found that the stimulation of recombinant human IFN-γ, GM-CSF, M-CSF, and IL-3 or the combination of them led to LGC formation from human monocytes or macrophages in vitro.5 Recently, TNF-α, CD40-CD40L axis, and TRIM34 are also reported to be involved in the formation of multinucleated giant cells.6–9 However, little is known about the molecular characteristics of LGCs. At present, no specific biomarkers of LGC have been found. The recognition of LGCs highly relies on the morphological features visually. As the number of LGCs is usually small among the cells aggregated in granuloma, it is difficult for their separation and purification. Therefore, the understanding of the biological significance of LGC is limited currently. In addition, comprehensive transcriptome analysis of LGCs is also insufficient.
Laser capture microdissection (LCM) is a useful method for isolating specific single cells or areas from the heterogeneous tissue sections for RNA sequencing and precise transcriptome analysis.10 The method can also be applied to cell samples.
In this study, the transcription profiling of human LGCs purified by LCM was analyzed, and the molecular features and potential functions of LGC in granulomas were revealed. The study will help to unveil the complex molecular mechanism of mycobacterial infections or other granulomatous diseases.
Materials and Methods
Ethics Approval
Healthy donors were recruited from the Institute of Dermatology, Chinese Academy of Medical Sciences and Peking Union Medical College, Nanjing, China. The study protocol was approved by the local Institutional Review Boards. Written informed consent for collection of peripheral blood, skin samples, and the subsequent scientific analysis was obtained from each volunteer or patient.
Induction of LGC Formation from Peripheral Blood Cells in vitro
Peripheral blood from healthy volunteers was collected after informed consent and ethical approval. Peripheral blood mononuclear cells (PBMCs) are isolated through Ficoll-Paque™ (Stemcell, USA) density gradient centrifugation. Wash the PBMCs with PBS. PBMCs were plated at a density of 106 cells/mL in RPMI-1640 medium containing 2% fetal bovine serum (FBS), 100 U/mL penicillin, and 100 U/mL streptomycin. After an hour, the cells were washed for three times with PBS and the adherent cells were cultured in the presence of 20 ng/mL rhGM-CSF (Peprotech, USA) and 10 ng/mL rh IFN-γ (Peprotech, USA) in RPMI-1640 medium containing 20% FBS for 7 days.11 The cells were supplemented with fresh medium every 2 days. At the end of the culture period, the number of nuclei per cell was determined by rapid Wright-Giemsa staining (Jiancheng Biotech, China) or immunofluorescence staining. LGCs were defined as cells with more than three nuclei per cell.
Cell Sample Preparation and LCM for LGC and Macrophage Separation
After 7 days of stimulation, the adherent cells were washed with PBS when LGCs have formed. AccutaseTM Cell Dissociation Reagent (Fcmacs Biotech, China) was added and incubated at 37°C for 40 min. Equal volume of PBS was added to stop digesting. Cell suspension was acquired by gently pipetted using a 1000 μL pipette tip. After washing with PBS, the cells were resuspended in RPMI-1640 medium containing 20% FBS. 1 mL cell suspension (1×10⁵ cells) was added on the polyethylene naphthalate (PEN) membrane slide, which would focally melt when triggered by the infrared laser pulse. The cells were then cultured for 24 h for adherence to the membrane slide, then were stained using rapid Wright-Giemsa staining according to the manufacturer's protocol. Supernatant was removed and the slides were immediately stored in the dry ice. LCM (Leica ASLMD System, Germany) procedure was done. Inverted microscope was used. The setting of the LCM program was microscope (objective) 20X, power 45, aperture 12, speed 29, and balance 49. For each slide, LGCs and macrophages were defined under the microscope and then were separately collected after LCM. To avoid RNA degradation, the LCM procedures were completed within 15 min for each slide. For each experiment, about 75–80 cells were collected separately for each of the two groups, the LGC group and the macrophage group.
RNA Extraction and the Transcriptome Sequencing and Alignment
Cell samples were stored in 6 μL lysate provided by the SMART-Seq kit at −80°C. SMART-Seq Ultra Low Input RNA Kit for Sequencing (Clontech, USA) was used for cell lysis and the first-strand cDNA synthesis, followed by full-length long-distant PCR amplification of the first-stand cDNA. Libraries were created by performing end-repair, dA-tailing, and adapter ligation, followed by purification and PCR amplification. Libraries were purified using AMPure XP beads to select cDNA fragments of preferentially about 200 bp in length, then were quantified by Qubit and sequenced on the Illumina HiSeq 2500 Sequencing System (Illumina, San Diego, CA). Then the library quality was assessed on the Agilent 2100 system. At last, the libraries were accurately quantified for the effective concentration and pooled for HiSeq sequencing.
Bioinformatics Analyses
Sequenced reads were aligned to the human reference genome using Hisat2. HTSeq was used to count the reads mapped to each gene. Then, FPKM of each gene was calculated based on the length. Mapped the reads count of the gene for estimating gene expression levels.12 Differential expression analysis of two groups was performed using the DESeq R package. The resulting P-values were adjusted using the Benjamini and Hochberg’s approach for controlling the false discovery rate. Genes with an adjusted P-value <0.05 found by DESeq were assigned as differentially expressed. Gene Ontology (GO) enrichment analysis and KEGG pathway analysis of differentially expressed genes (DEGs) were performed using clusterProfiler package. The violin graph and heatmap were generated using TBtools, a biological data handling software, or Novomagic, a free online platform for data analysis (https://magic.novogene.com). Protein–protein interaction network analysis was constructed by STRING.
Quantitative RT-PCR
PBMCs were isolated from the peripheral blood of healthy donors. For the LGC formation group, the adherent monocytes were separated from PBMCs and stimulated by rhGM-CSF and rhIFN-γ for 7 days. For the control group, the adherent monocytes were stimulated with rhGM-CSF for 7 days. Microscopic observation confirmed that LGCs were not formed in this group. RNA was extracted from the two groups of cells using RNeasy Micro Kit (Qiagen, Germany). RNA was reverse transcribed into cDNA using HiScript III 1st Strand cDNA Synthesis kit (Vazyme, China). The 20 μL qPCR reaction included 50–200ng templet DNA, 10 μL 2 × ChamQ Universal SYBR qPCR Master Mix (Vazyme, China), 0.4 μL forward and 0.4 μL reverse primers, and nuclease-free water. The primer sequences were as follows: for hGAPDH: F:5’-TGACAACTTTGGTATCGTGGAAGG-3’ and R:5’-AGGCAGGGATGATGTTCTGGAG-3’; for hCCL7: F:5’-CCACACAGAAGTGGGTCCAG-3’ and R:5’-ACCACTCTGAGAAAGGACAGG-3; for hRASSF1: F:5’-GGACGGTTCTTACACAGGCT-3’ and R:5’-TGGGCAGGTAAAAGGAAGTGC-3; for hRRAS2: F:5’-GCTGCCCGCTTCAATCCTAT-3’ and R:5’-AATATCTAGCCGGGCTGCTC-3; for hOSBPL3: F:5’-AATATCTAGCCGGGCTGCTC-3’ and R:5’-AAGCTAAGCACAAGTGATCATCCTAGA-3; for hITM2C: F:5’-ATTAATGTCCCTGTGCCCCA-3’ and R:5’-GGTCCCTCTCTTCACGTTCA-3; for hPPP1R12A: F:5’-AGGTGAAGTTCGACGATGGC −3’ and R:5’-TCCGTCCACATTGGCGTAAT-3. The relative gene expression levels were calculated by the 2−ΔΔCt method.
Phagocytosis Experiment
M. bovis BCG were infected with pMV261-GFP vector. Live bacilli were grown in Middlebrook 7H9 medium with oleic acid, albumin, dextrose, and catalase at 37°C. Adherent monocytes were stimulated by rhGM-CSF and rhIFN-γ for 7 days to form LGCs. BCG-GFP were added at a MOI of 10, and the cells were washed 6 hours later with fresh medium and incubated overnight. After the incubation period, cells were fixed with 4% paraformaldehyde for 10 min, followed by two washing steps with PBS. The cell membrane was labeled with CellMask deep red plasma membrane stain for 5min (ThermoFisher, USA), and the nuclear was labeled with DAPI for 5 min (EMD, USA) according to the recommended method. The number of bacteria located in the cytoplasm of macrophages and LGCs was counted under the visualization by confocal microscope (Olympus, Tokyo, Japan).
Protein Quantification of CCL7 by ELISA
Skin samples measuring 6 mm in diameter were collected from the skin lesions and unlesional skin in 3 leprosy patients. Informed consent and ethical approval were obtained before the skin biopsy. Half of skin tissue was ground into a homogenate, and supernatant was obtained by centrifugation for ELISA assay. Cell culture supernatant from the GM-CSF plus IFN-γ stimulated adherent monocytes and GM-CSF stimulated adherent monocytes were collected, respectively. CCL7 expression levels were measured using a human CCL7 ELISA kit (ElabScience, China) according to the manufacturer’s recommendation.
Immunohistochemistry for CCR1
The paraffin-embedded tissues from patients with granulomatous disease (including leprosy and nontuberculous mycobacterial infections) were collected and sliced. Hematoxylin and Eosin staining and immunohistochemistry for CCR1 (1:250) (Abcam, Britain) were performed with the serial sections. Areas of inflammation including granuloma were determined by histopathologic analysis with Hematoxylin and Eosin staining. The expression of CCR1 was evaluated within the areas of inflammatory cell infiltration and was scored according to the percentage of positively strained inflammatory cells and the staining intensity.
Results
Induction and Isolation of Human LGCs by LCM
LGCs may play an important role in granulomatous diseases, although they are only a minority in number (Figure 1A). To study LGCs, human monocytes isolated from peripheral blood mononuclear cells were incubated with rhGM-CSF plus rhIFN-γ for 7 days to form granuloma-like aggregation with macrophage differentiation (Figure 1B). Meanwhile, LGC formation was observed as previously reported (Figure 1B).11 Immunofluorescence staining of cell surface markers showed the stimulated cells, including both LGC and mononuclear cells, were CD86 positive and CD11c negative (Figure S1). Like the natural granuloma, LGCs were in the minority in in vitro system. To obtain purified LGC, the cells were first related on the thermoplastic PEN membrane slides and then separated into the LGC group and the macrophage group, by a rapid procedure of LCM, based on the morphological difference under microscopic visualization (Figure 1C).
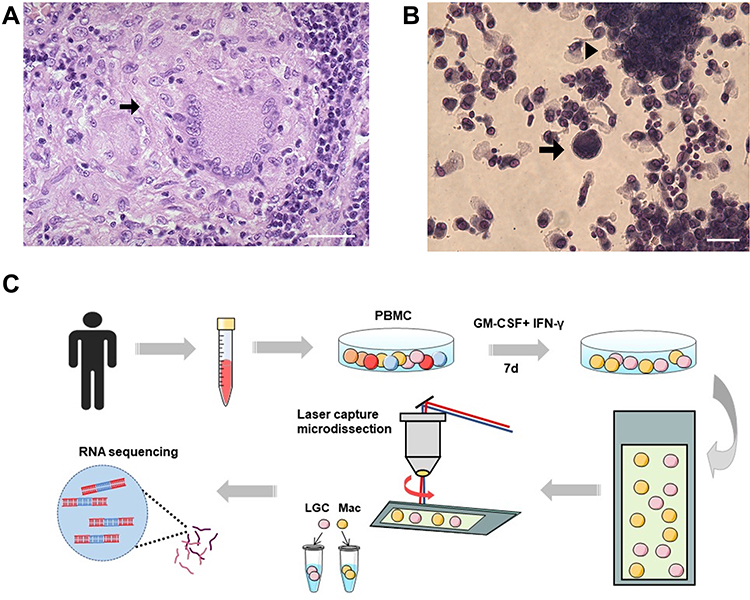 |
Figure 1 Formation and isolation of human LGCs. (A) Representative pathological image of a cutaneous tuberculosis case showing LGC (arrow) in granuloma. Hematoxylin and eosin stain. Scale bar, 100 μm. (B) In vitro granuloma model (arrowhead) induced by rhGM-CSF plus rhIFN-γ for 7 days. LGC formation was also observed (arrow). Scale bar, 50 μm. (C) Schematic diagram of human LGC induction and isolation in vitro for RNA sequencing. Abbreviations: Mac, macrophage; LCM, laser capture microdissection. |
Comprehensive Statistics of RNA Sequencing Analyses of LGCs
As a result of LCM, the LGC group comprised an average of 91.3% LGCs and 8.7% mononuclear macrophages which were too close to the LGCs to be separated. The macrophage group consisted of a 100% of mononucleated macrophages with no LGCs (Figure 2A). Binuclear cells were not selected in both groups. In total, 395 cells in the LGC groups and 155 cells from macrophage group were obtained by LCM for RNA sequencing through several independent experiments (Table S1).
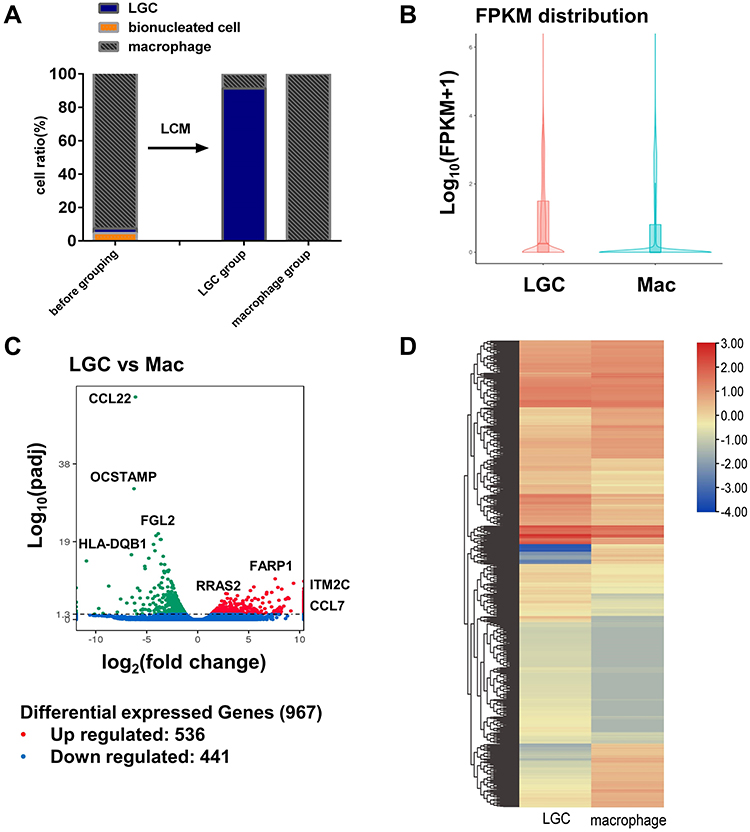 |
Figure 2 RNA sequencing analyses of in vitro human LGCs and macrophages. (A) Average ratio of the cells before and after the LCM. RNA sequencing was performed on the cell sample in the LGC group and macrophage group after the LCM. (B) Violin plot depicting the gene expression distributions of LGCs and macrophages. (C) Volcano plot showing log2 fold change plotted against log10 adjusted P value of DEGs. (D) Heatmap of unsupervised hierarchical clustering of DEGs. |
The RNA sequencing libraries generated a mean of 59.8 million clean reads per individual library, 0.03% error rate, with 91.0% Q30 and 47.3% GC content (Table S2). A total of 61,782 human genes were detected for the RPKM value (Table S3). The expression patterns between LGCs and macrophages showed a significant difference (Figure 2B). With the threshold of FDR-adjusted P value <0.05, a total of 967 DEGs were detected, of which 526 were up-regulated and 441 down-regulated in the LGC group (Figure 2C, Table S4). Unsupervised hierarchical cluster analysis revealed two separate clusters between LGCs and macrophages (Figure 2D).
LGCs are Active in Cell Shape Regulation and May Be Ready for Phagocytosis
GO enrichment analysis showed that the up-regulated DEGs of LGCs were enriched in the biological process of regulation of cell shapes and in the cellular component of cytoskeleton (Figure 3A), which is an important regulator of cell shape and cell mechanics.13,14 KEGG pathway enrichment analysis also showed that regulation of actin cytoskeleton was the top pathway enriched by the up-regulated DEGs in LGC (Figure 3B). Cell shape change has been found to be required for phagocytosis and cell spreading of immune cells.15 Therefore, we hypothesize that the active cell shape regulation of LGCs may enable them to be ready for phagocytizing bacterium. RNA levels of the phagocytosis-related genes GATA2 (log2FoldChange: 7.9183, adjusted P = 0.009), ITGAV (log2FoldChange: 2.365, adjusted P < 0.001), NCKAP1 (log2FoldChange: 1.527, adjusted P = 0.017), and PTK2 (log2FoldChange: 3.989, adjusted P < 0.001) were upregulated in LGCs. Through the phagocytosis experiment, we found that in vitro LGCs maintain a potent phagocytic ability, which is even stronger than that of macrophages, in mycobacterial infection (Figure S2).
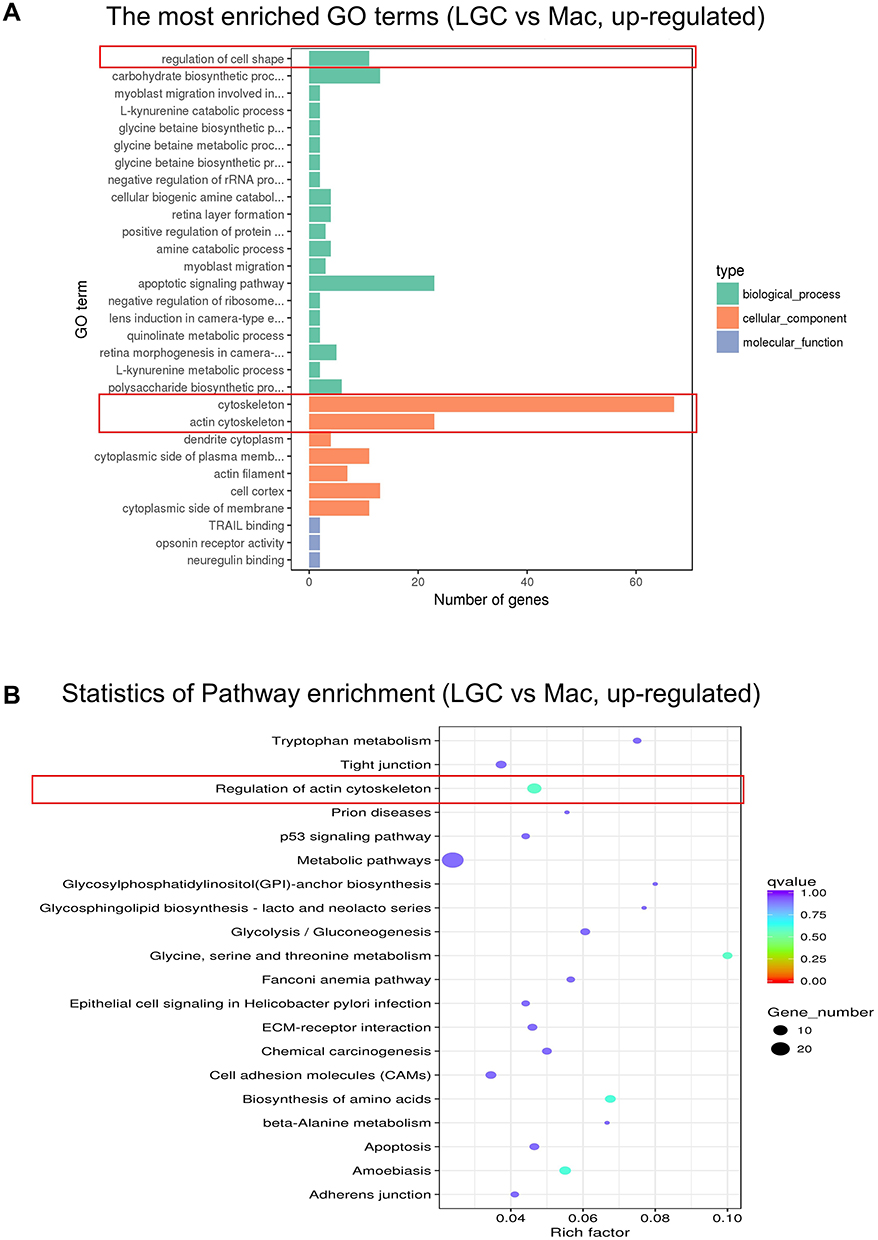 |
Figure 3 GO and KEGG enrichment analysis of the up-regulated genes in LGC group. (A) GO functional enrichment analysis. (B) KEGG pathway enrichment analysis. The red frames show the representative terms. Abbreviation: Mac, macrophage. |
LGC Differentiation Leads to Weakened Energy Metabolism Level and Immune Response
According to the GO analysis, down-regulated DEGs in LGCs were clustered in multiple terms related to energy metabolism, like oxidative phosphorylation, mitochondrial ATP synthesis, and respiratory electron transportation (Figures 4A and S3).
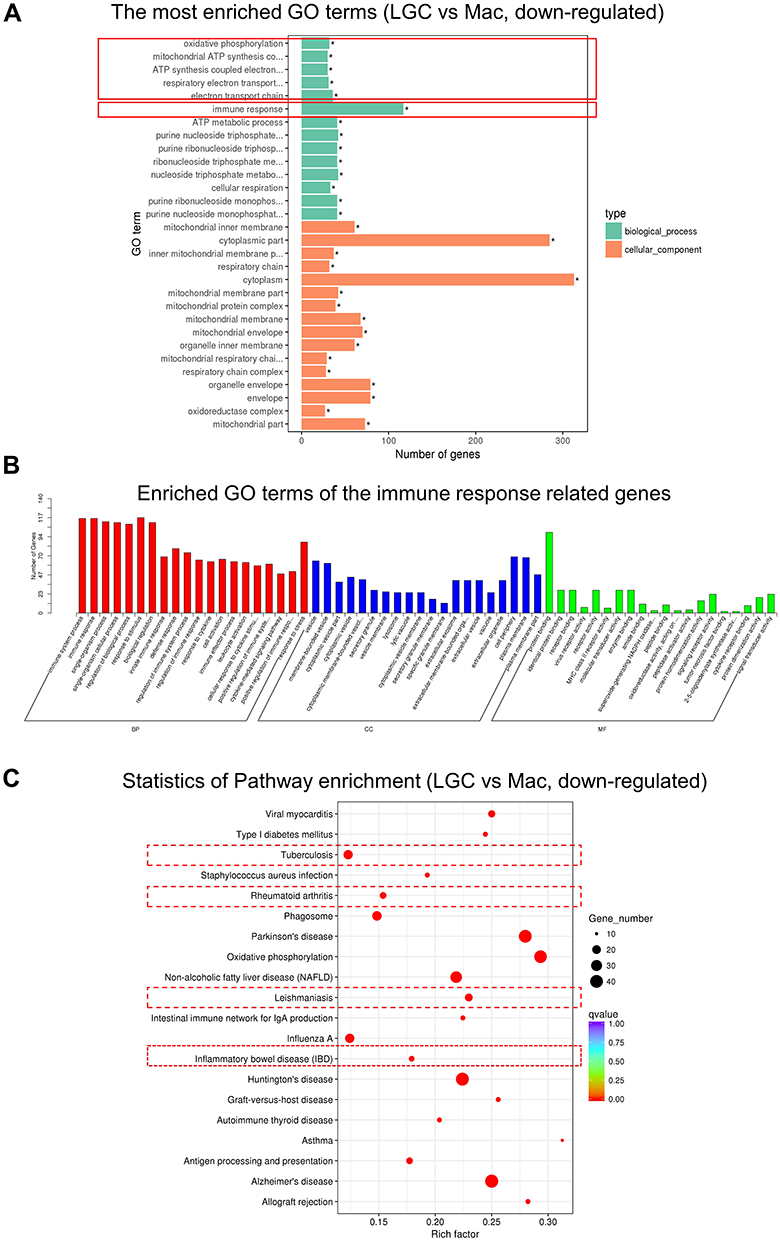 |
Figure 4 GO and KEGG enrichment analysis of the down-regulated genes in LGC group. (A) GO functional enrichment analysis of DEGs. The red frames show the representative terms. (B) The GO functional enrichment analysis of the immune response related DEGs. (C) KEGG pathway enrichment analysis. The rectangle with red dotted border shows granulomatous diseases. Abbreviations: CC, cellular component; BP, biological process; MF, molecular function; Mac, macrophage. |
Although LGCs have enhanced phagocytosis capacity, their down-regulated DEGs were largely related to immune response (Figures 4A, B and S3). Furthermore, KEGG analysis indicated that the down-regulated DEGs are enriched in the pathways of various granulomatous inflammation disorders, such as tuberculosis, leishmaniasis, inflammatory bowel disease, and rheumatoid arthritis (Figure 4C). For example, among the genes related to tuberculosis infection, IFNGR2 (log2FoldChange: −1.554, adjusted P = 0.037), STAT1 (log2FoldChange: −1.625, adjusted P < 0.001), HLA-DQB1 (log2FoldChange: −5.686, adjusted P < 0.001), CIITA (log2FoldChange: −3.497, adjusted P < 0.001), MRC1 (log2FoldChange: −1.801, adjusted P < 0.001), IL18 (log2FoldChange: −2.311, adjusted P < 0.001), CD209 ((log2FoldChange:-4.671, adjusted P = 0.008), CALM3 (log2FoldChange: −2.531, adjusted P < 0.001), etc. are down-regulated in LGCs (Figure S4). These data suggested that although LGC may have advantages in engulfing bacteria, they may be in a state of maintaining homeostasis with weakened immune response and energy metabolism.
Protein–Protein Interaction Networks of the DEGs
To further get an insight into the prominent features of LGCs, we constructed the protein–protein interaction network of the DEGs using the STRING database (Figure 5). The enrichment analysis for these networks further confirmed the changes of immune activity and ATP metabolism in LGCs (Table S5). Particularly, enrichments were observed in the MHC class II receptor activity, interferon gamma signaling, and cytokine signaling in immune responses; and in energy metabolism, the mitochondrial ATP synthesis coupled proton transport, electron transport, and NADH to ubiquinone (Table S5).
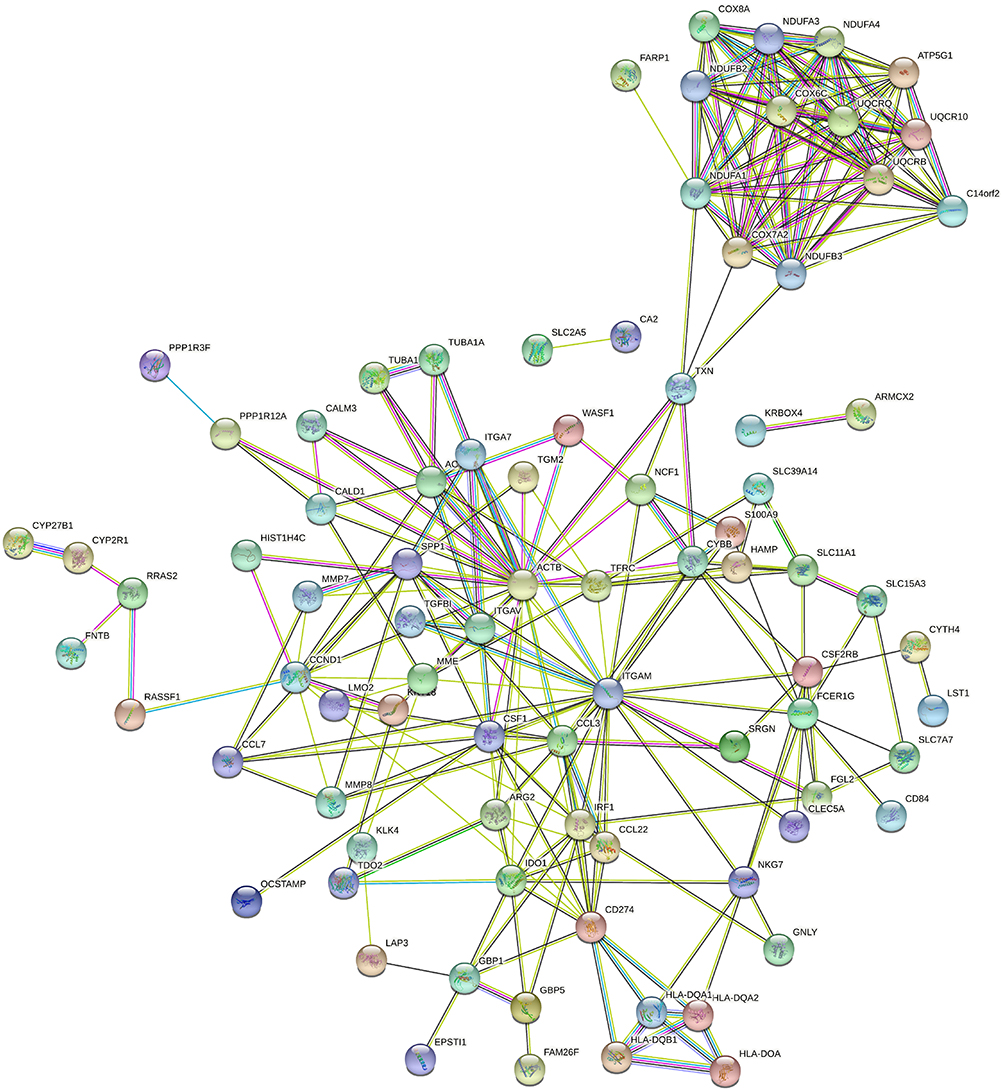 |
Figure 5 Protein–protein interaction networks analysis. The network construct from the top 150 DEGs. The nodes represent proteins. Edges stand for protein–protein associations. The disconnected nodes in the network were hided. |
Validation of DEGs by qRT-PCR
Six selected genes (CCL7, RRASF1, RRAS2, OSBPL3, ITM2C, PPP1R12A) which are up-regulated in LGC in the transcriptome data were verified by qRT-PCR. The mRNA levels of CCL7, RRAS2, ITM2C, PPP1R12A were significantly higher in the LGC formation group (GM-CSF + IFN-γ) than in the GM-CSF-induced macrophage group. The mRNA levels of the other 2 genes were not significantly different (Figure 6). This result is roughly consistent with transcriptome sequencing, for which the setting is purified LGC vs purified macrophage.
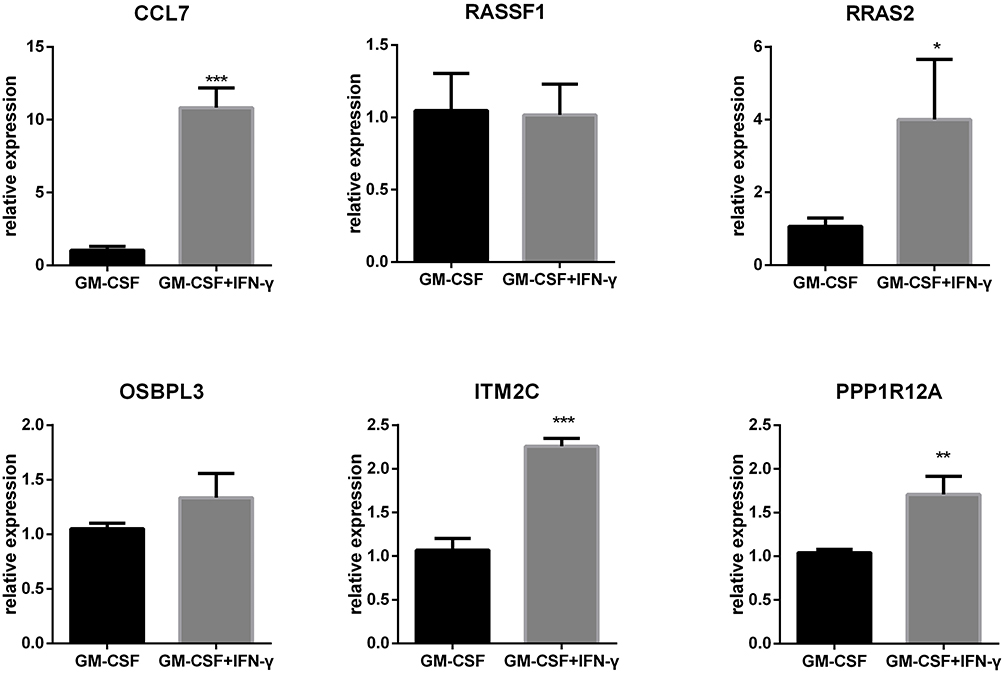 |
Figure 6 Validation of selected DEGs by RT-qPCR. The mRNA levels of CCL7, RRASF1, RRAS2, OSBPL3, ITM2C, and PPP1R12A in the LGC formation group (GM-CSF + IFN-γ for 7 days) vs the GM-CSF-induced macrophage group (GM-CSF for 7 days). n = 3 in each group. ***P < 0.001, **P < 0.01, *P < 0.05. |
LGC May Regulate Granulomatous Responses by Secreting CCL7 to Interact with CCR1-Expressing Macrophages
As LGCs are usually seen among the aggregated cells in the granuloma, they may interact with other cells through the contact between membrane receptors and ligands. From the transcriptome data, we found that chemokine CCL7 was up-regulated in LGCs while its known receptor CCR1 was highly expressed in the macrophages (Figures 6 and 7A). However, other genes related to CCL7, such as CXCL10, CXCR1, and SDC1 were not significantly differentially expressed although with different average expression levels (Figure 7A). Besides, two other chemokine CCL3 and CCL22 were down-regulated in LGCs (Table S4). ELISA assay confirmed that the CCL7 production level in LGC formation group (GM-CSF + IFN-γ) was higher than that in the GM-CSF-induced macrophage group (Figure 7B). To further verified whether similar event happened in real disease situations, we evaluated the CCL7 protein level and CCR1 expression in the granuloma. ELISA performed on the supernatant of skin homogenate from 3 leprosy patients showed that the level of CCL7 was significantly higher in the skin lesion than that in the nearby unlesional skin (Figure 7C). Immunohistochemical analysis showed that the expression of CCR1 in granuloma cells, including LGCs, was significantly higher than that of non-granulomatous inflammatory cells in mycobacterial infectious diseases (Figure 7D and E). These results further confirmed that CCL7, probably secreted by LGCs, may play an important role in the regional immunity of mycobacterial infection, through interacting with CCR1-expressing cells in granulomas.
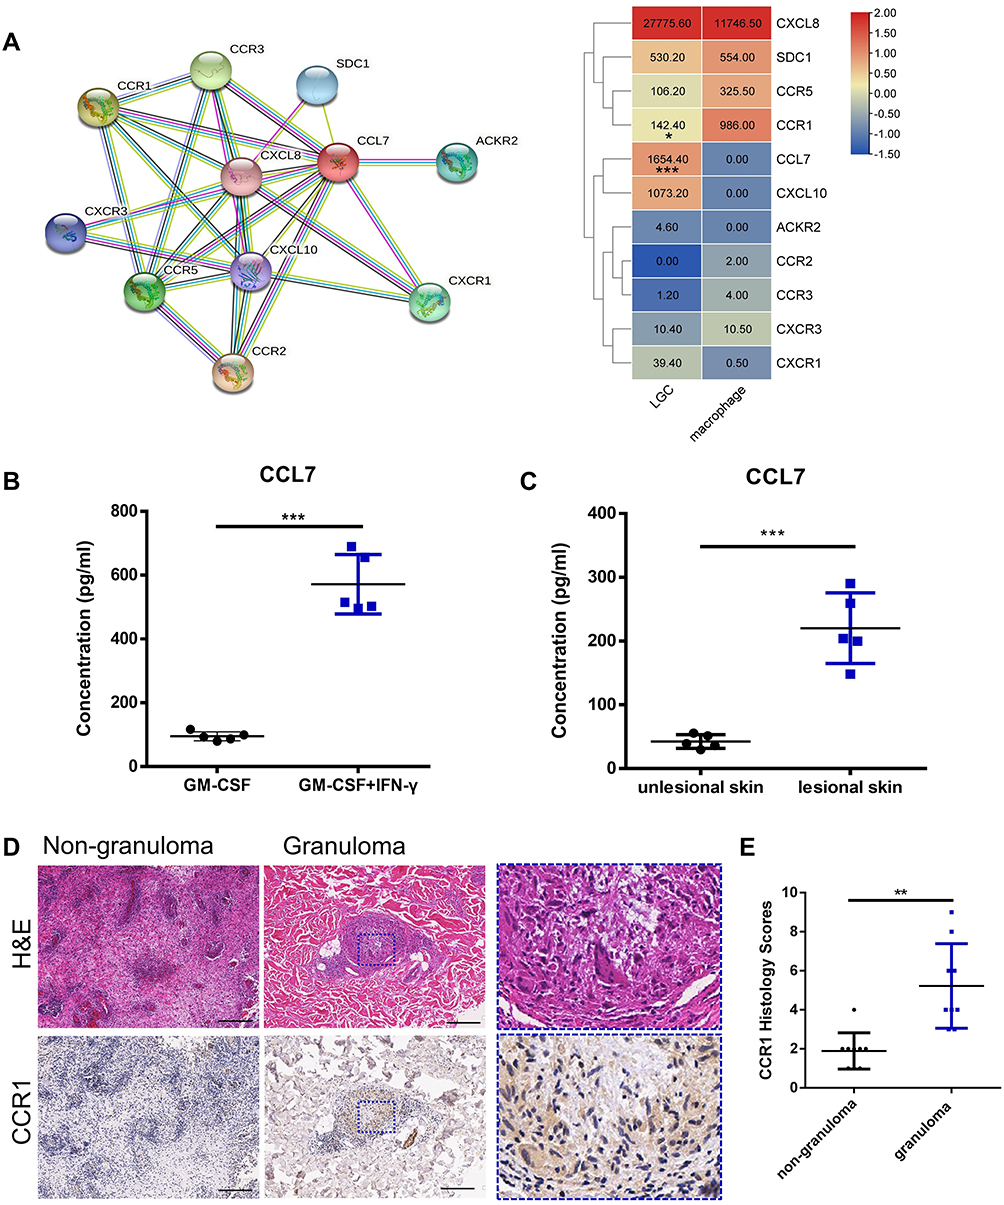 |
Figure 7 The expression levels of CCL7 and CCR1 in vitro and in vivo. (A) Network of CCL7 acquired from STRING database and the heatmap showing the average readout value of CCL7 and its related genes in LGCs. (B) Human CCL7 ELISA for LGC formation group (GM-CSF + IFN-γ for 7 day) (n=5) and GM-CSF-induced macrophage group (GM-CSF for 7 day) (n = 5). (C) CCL7 ELISA in the homogenate supernatant of lesional and non-lesioned skin tissue of leprosy patients (n = 3). (D and E) Immunohistochemical analysis of CCR1 expression in granuloma cells and non-granulomatous inflammatory cells in mycobacterial infectious diseases (n = 9). The rectangle with blue dotted border shows the magnification view. Scale bar, 200 μm. ***P < 0.001, **P < 0.01, *P < 0.05. |
Discussion
LGC is a common characteristic cellular component in granulomas induced by mycobacterial infection. The presence of LGCs in granuloma reflects the specific immune responses occurred in the host. Previous studies on granulomas mainly focused on the macrophages and T lymphocytes.16 The knowledge about the role of LGCs in host response is quite limited. Research focusing on LGC may help to discover new pathogenesis of granulomatous diseases.
Whether the LGCs are good or bad to the host is still inconclusive.17 It is suggested that tuberculosis-associated giant cells are beneficial to the host as they may be associated with restriction of cell-to-cell spread of mycobacteria.17 They may also be detrimental because their secretion of metalloproteinase or other molecules contributes to tissue destruction.18 Recently study suggested that epithelioid cell, which may be an intermediate phenotype between macrophage and MGC, increases bacterial burden and reduces survival time of the host cell, resulting as a potential hazard to the host.19 Therefore, we believe that the strategies of LGCs are complicated. A comprehensive understanding of the role of LGCs and their molecular features is essential to uncover the host’s special immune response in granulomatous inflammation.
LGC purification is a crucial step to accurately study the molecular characteristics and functions of this cell type. Specific markers of LGCs have not yet been discovered. Although previous studies have proposed the use of flow cytometry to sort out Hoechst high-expressing cells for the isolation of chicken MGCs, the successful application of human LGC isolation has not yet been reported.20 As in human granuloma models in vivo and in vitro, LGCs are only a minority in number among the granulomatous immune cells, and the size of LGCs, up to a hundred microns in diameter, reduced the applicability of flow cytometry. In the study, laser capture microdissection combined with cell culture was used to spatially separate LGCs and macrophages in vitro.21 Although it is a primitive method based on recognition of the cell morphology and manual selection, it was effective and direct.21,22
In clinical cases, macrophage variants and LGCs are present in granulomas at the same time and are adjacent to each other. In this study, RNA sequencing was performed for the purified LGCs and nearby macrophages differentiated under the same condition, just as the case in the nature granuloma. The general gene transcriptome profile in LGCs was significantly different from that in macrophages.
Two important characteristics of LGCs showed by the transcriptome data are the active regulation in cell shape and high expression levels of the actin cytoskeleton related genes. Actin has been known to be a central player in cell shape, cell motility and cell-to-cell adhesion.23,24 Therefore, LGCs may be a population which is active in cell deformation and mobility or be derived from such a subgroup of precursor macrophages. These hypotheses are in line with what we have seen in the microscopy – LGCs appear in various shapes and are rarely found distant from the aggregated cells in granuloma. Besides, actin is also critical for bacterium transport and organelle transport in the cytoplasm.23,25 Different from previous study,26 in our phagocytosis experiment with M. bovis BCG, LGCs showed excellent performance in bacilli uptake in vitro, which may possibly be facilitated by their active shape regulation.
Interestingly, although LGCs are prone to engulf more bacteria than macrophages, they may not be able to effectively eliminate the bacteria by themselves. Many genes and pathways related to the immune response were down-regulated in LGCs compared with those in macrophages. The down-regulated genes in LGCs are related to several granulomatous inflammation disorders, such as tuberculosis, leishmaniasis, inflammatory bowel disease, and rheumatoid arthritis. Further details showed that MHC class II receptor activity, interferon gamma signaling, and cytokine signaling possibly have undergone significant changes. At the same time, energy metabolism level such as mitochondrial ATP synthesis in LGCs is observed to be significantly reduced. Therefore, we speculated that the possibility of LGCs in active proliferation and intracellular biological activity is very low. LGC may play a role in maintaining the hemostasis while enhancing phagocytosis in granuloma.
Since LGC’s own ability to metabolize and immune response is weakened, does it communicate with other partner cells? Although the transcriptome analysis indicated that the general cytokine signaling in LGCs was down-regulated, it was found that the expression of CCL7 was significantly up-regulated. Meanwhile, the CCL7 receptor CCR1 was up-regulated in macrophages. Importantly, consistent reaction was amplified by real mycobacterial infection cases. Therefore, LGC may regulate the granulomatous response by secreting CCL7 to communicate with CCR1-expressing granuloma cells. It is known that CCL7 is a chemokine that can induce recruitment of multiple subsets of leukocytes, including monocytes.27 Previous studies have suggested that CCL7 was up-regulated in active tuberculosis patients and was down-regulated in post-chemotherapeutic treated mouse tuberculosis model.28,29 Moreover, in Leishmania major infection, CCL7 was found to be an inflammatory regulator in different organs.30 Therefore, CCL7 may be a potential target for the host-directed treatment of infectious granulomatous disease. However, the effect of this interaction on the inflammation and disease prognosis needs further confirmation.
Conclusion
In conclusion, our study provides a general overview of the expression pattern of human LGCs formed in vitro. The precise separation of LGCs by LCM has greatly reduced the bias caused by the confounding of other cell types. Notably, our results suggested that LGCs are characterized by enriched actin cytoskeleton, active shape regulation, low energy metabolism, and inactive immune response. CCL7 may be a specific molecular of LGC to communicate with macrophages in granuloma. Interestingly, we can imagine LGC as a flexible (active cell shape regulation), gluttonous (potent bacilli uptake) and lazy (weakened metabolism and immune response) fat (in a large size) man, who recruits his “friends” through CCL7 secretion.
However, a growing number of studies have hinted at the heterogeneity of LGCs, possibly like macrophages.31–33 As granulomatous diseases are chronic which usually span for years, the characteristics of LGCs may change with different stages of the disease. Our analysis is only based on the known human LGC model induced by rhGM-CSF and rhIFN-γ in vitro. Although consistent CCL7 and CCR1 expression profiles were demonstrated in real mycobacterium infections, whether the other reactions found in our study are in line with those in clinical situations, or with which specific stages, need further confirmation.
In our study, to avoid RNA degradation, we shortened the time for the experiment, which resulted in a relatively small number of cell samples in this study. However, considering a high purity of LGCs was obtained, we believe the study still provide some meaningful clues for understanding the characteristics of LGCs and pathogenesis of granulomatous diseases. Further studies are needed to develop effective methods to separate viable LGCs for functional verification.
Ethics Approval and Informed Consent
This study was approved by the Ethics Committee of the Institute of Dermatology, Chinese Academy of Medical Sciences (2016-I2M-1-005) and conducted in accordance with the declaration of Helsinki principles. Written informed consents were obtained from all volunteers and patients.
Acknowledgments
We thank Jiya Sun for aiding on data analysis.
Author Contributions
Yanqing Chen contributed to the study design, execution, data analysis, and manuscript writing. Haiqin Jiang contributed to execution, and acquisition of data, and analysis and interpretation. Jingshu Xiong, Jingzhe Shang, and Zhiming Chen contributed to acquisition of data, data analysis and interpretation. Aiping Wu contributed to study design and data analysis and interpretation. Hongsheng Wang contributed to conception, study design, data interpretation, and manuscript preparation. All authors have substantially revised or critically reviewed the manuscript, agreed on the submission to Journal of Inflammation Research, and reviewed and agreed on all the versions of the article, and agree to take responsibility and be accountable for the contents of the article.
Funding
This manuscript was supported by grants from the Chinese Academy of Medical Science Innovation Fund for Medical Science (2017-I2M-B&R-14, 2016-I2M-1-005), and the National Natural Science Foundation of China (grant 81972950).
Disclosure
The authors report no conflicts of interest in this work.
References
1. Helming L, Gordon S. The molecular basis of macrophage fusion. Immunobiology. 2007;212(9–10):785–793. doi:10.1016/j.imbio.2007.09.012
2. Mitteldorf C, Tronnier M. Histologic features of granulomatous skin diseases. JDDG. 2016;14(4):378–387.
3. Anderson JM. Multinucleated giant cells. Curr Opin Hematol. 2000;7(1):40–47. doi:10.1097/00062752-200001000-00008
4. McNally AK, Anderson JM. Macrophage fusion and multinucleated giant cells of inflammation. Adv Exp Med Biol. 2011;713:97–111.
5. Helming L, Gordon S. Molecular mediators of macrophage fusion. Trends Cell Biol. 2009;19(10):514–522. doi:10.1016/j.tcb.2009.07.005
6. Mezouar S, Diarra I, Roudier J, Desnues B, Mege JL. Tumor necrosis factor-alpha antagonist interferes with the formation of granulomatous multinucleated giant cells: new insights into mycobacterium tuberculosis infection. Front Immunol. 2019;10:1947. doi:10.3389/fimmu.2019.01947
7. Yasui K, Yashiro M, Tsuge M, et al. Tumor necrosis factor-α can induce Langhans-type multinucleated giant cell formation derived from myeloid dendritic cells. Microbiol Immunol. 2011;55(11):809–816. doi:10.1111/j.1348-0421.2011.00380.x
8. Sakai H, Okafuji I, Nishikomori R, et al. The CD40-CD40L axis and IFN-gamma play critical roles in Langhans giant cell formation. Int Immunol. 2012;24(1):5–15. doi:10.1093/intimm/dxr088
9. Sun D, An X, Ji B. TRIM34 facilitates the formation of multinucleated giant cells by enhancing cell fusion and phagocytosis in epithelial cells. Exp Cell Res. 2019;384(1):111594. doi:10.1016/j.yexcr.2019.111594
10. Nichterwitz S, Chen G, Aguila Benitez J, et al. Laser capture microscopy coupled with smart-seq2 for precise spatial transcriptomic profiling. Nat Commun. 2016;7:12139. doi:10.1038/ncomms12139
11. McNally AK, Anderson JM. Interleukin-4 induces foreign body giant cells from human monocytes/macrophages. Differential lymphokine regulation of macrophage fusion leads to morphological variants of multinucleated giant cells. Am J Pathol. 1995;147(5):1487–1499.
12. Trapnell C, Williams BA, Pertea G, et al. Transcript assembly and quantification by RNA-Seq reveals unannotated transcripts and isoform switching during cell differentiation. Nat Biotechnol. 2010;28(5):511–515. doi:10.1038/nbt.1621
13. Fletcher DA, Mullins RD. Cell mechanics and the cytoskeleton. Nature. 2010;463(7280):485–492. doi:10.1038/nature08908
14. Schakenraad K, Ernst J, Pomp W, et al. Mechanical interplay between cell shape and actin cytoskeleton organization. Soft Matter. 2020;16(27):6328–6343. doi:10.1039/D0SM00492H
15. Roberts RE, Hallett MB. Neutrophil cell shape change: mechanism and signalling during cell spreading and phagocytosis. Int J Mol Sci. 2019;20(6):1383. doi:10.3390/ijms20061383
16. Pagán AJ, Ramakrishnan L. The formation and function of granulomas. Annu Rev Immunol. 2018;36:639–665. doi:10.1146/annurev-immunol-032712-100022
17. Miron RJ, Bosshardt DD. Multinucleated giant cells: good guys or bad guys? Tissue Eng Part B Rev. 2018;24(1):53–65. doi:10.1089/ten.teb.2017.0242
18. Zhu XW, Price NM, Gilman RH, Recarvarren S, Friedland JS. Multinucleate giant cells release functionally unopposed matrix metalloproteinase-9 in vitro and in vivo.. J Infect Dis. 2007;196(7):1076–1079. doi:10.1086/521030
19. Cronan MR, Beerman RW, Rosenberg AF, et al. Macrophage epithelial reprogramming underlies mycobacterial granuloma formation and promotes infection. Immunity. 2016;45(4):861–876. doi:10.1016/j.immuni.2016.09.014
20. Collin-Osdoby P, Osdoby P. Isolation and culture of primary chicken osteoclasts. In: Bone Research Protocols. Springer; 2012:119–143.
21. Chen Gonzalez E, McGee JS. Research techniques made simple: laser capture microdissection in cutaneous research. J Invest Dermatol. 2016;136(10):e99–e103. doi:10.1016/j.jid.2016.08.005
22. Mahalingam M. Laser capture microdissection: insights into methods and applications. Methods Mol Biol. 2018;1723:1–17.
23. Pollard TD, Cooper JA. Actin, a central player in cell shape and movement. Science. 2009;326(5957):1208–1212. doi:10.1126/science.1175862
24. Zalik SE, Lewandowski E, Kam Z, Geiger B. Cell adhesion and the actin cytoskeleton of the enveloping layer in the zebrafish embryo during epiboly. Biochem Cell Biol. 1999;77(6):527–542. doi:10.1139/o99-058
25. Stamm LM, Morisaki JH, Gao LY, et al. Mycobacterium marinum escapes from phagosomes and is propelled by actin-based motility. J Exp Med. 2003;198(9):1361–1368. doi:10.1084/jem.20031072
26. Lay G, Poquet Y, Salek-Peyron P, et al. Langhans giant cells from M. tuberculosis-induced human granulomas cannot mediate mycobacterial uptake. J Pathol. 2007;211(1):76–85. doi:10.1002/path.2092
27. Liu Y, Cai Y, Liu L, Wu Y, Xiong X. Crucial biological functions of CCL7 in cancer. PeerJ. 2018;6:e4928. doi:10.7717/peerj.4928
28. Mihret A, Bekele Y, Bobosha K, et al. Plasma cytokines and chemokines differentiate between active disease and non-active tuberculosis infection. J Infect. 2013;66(4):357–365. doi:10.1016/j.jinf.2012.11.005
29. Park S, Baek SH, Cho SN, Jang YS, Kim A, Choi IH. Unique chemokine profiles of lung tissues distinguish post-chemotherapeutic persistent and chronic tuberculosis in a mouse model. Front Cell Infect Microbiol. 2017;7:314. doi:10.3389/fcimb.2017.00314
30. Ford J, Hughson A, Lim K, et al. CCL7 is a negative regulator of cutaneous inflammation following leishmania major infection. Front Immunol. 2018;9:3063. doi:10.3389/fimmu.2018.03063
31. Gordon S, Plüddemann A, Martinez Estrada F. Macrophage heterogeneity in tissues: phenotypic diversity and functions. Immunol Rev. 2014;262(1):36–55. doi:10.1111/imr.12223
32. Champion TC, Partridge LJ, Ong S-M, Malleret B, Wong S-C, Monk PN. Monocyte subsets have distinct patterns of tetraspanin expression and different capacities to form multinucleate giant cells. Front Immunol. 2018;9(1247). doi:10.3389/fimmu.2018.01247
33. Lösslein AA-O, Lohrmann F, Scheuermann L, et al. Monocyte progenitors give rise to multinucleated giant cells. Nat Commun. 2021;12(1):1–22. doi:10.1038/s41467-021-22103-5
 © 2022 The Author(s). This work is published and licensed by Dove Medical Press Limited. The full terms of this license are available at https://www.dovepress.com/terms.php and incorporate the Creative Commons Attribution - Non Commercial (unported, v3.0) License.
By accessing the work you hereby accept the Terms. Non-commercial uses of the work are permitted without any further permission from Dove Medical Press Limited, provided the work is properly attributed. For permission for commercial use of this work, please see paragraphs 4.2 and 5 of our Terms.
© 2022 The Author(s). This work is published and licensed by Dove Medical Press Limited. The full terms of this license are available at https://www.dovepress.com/terms.php and incorporate the Creative Commons Attribution - Non Commercial (unported, v3.0) License.
By accessing the work you hereby accept the Terms. Non-commercial uses of the work are permitted without any further permission from Dove Medical Press Limited, provided the work is properly attributed. For permission for commercial use of this work, please see paragraphs 4.2 and 5 of our Terms.